Finances of Public Limited Companies, 2007-08* This article presents the financial performance of select 3,114 nongovernment non-financial public limited companies during 2007-08, based on their audited annual accounts. The data are presented at the aggregate level for all select companies and also for select industries. The consolidated results of the select companies in 2007-08 showed moderation in financial performance in comparison with the previous year as indicated by growth rates in major parameters like sales, value of production, gross profits, profits after tax and profits retained. However, net worth and fixed assets grew at a higher rate than in 2006-07. In profitability and profit allocation ratios, while profit margin was observed to gradually improve during the three year period from 2005-06 to 2007-08, profit after tax to net worth declined in 2007-08 compared to that in 2006-07. Starting with 2005-06, external sources of funds (i.e. other than own sources) continued to play a major role in financing the asset formation and other activities in the year 2007-08. This article presents the financial performance of select 3,114 non-government non-financial public limited companies during 2007-08 based on their audited annual accounts closed during April 2007 to March 20081 . The consolidated results of the financial performance of select 3,114 public limited companies showed decelerated financial performance during the year 2007-08, compared to the performance in 2006-07 as revealed from the moderated growth rates in the year under review in respect of major parameters (Table 1 & Statement 1). Growth rates in sales, value of production, manufacturing expenses, remuneration to employees, etc. were lower along with lower growth in corporate profits, both in gross profits and profits after tax, in 2007-08 than in 2006-07. Gross saving as well as gross value added also grew at a lower rate. On the contrary, interest payments, net worth and gross fixed assets grew at a higher rate in 2007-08 compared to that in 2006-07. The select companies continued to gradually improve their profit margin (measured by profit as percentage of sales) and retention ratio (measured by profits retained as percentage of profits after tax) during the three year period 2005-06 to 2007-08 (Statement 2). Share of exports in sales also continued to move upwards. Gross saving to gross capital formation ratio declined in 2007-08 than that in 2006-07. External sources of funds (i.e. other than own sources) continued to form a major part in total sources of funds like in the previous year but with a lower share in 2007-08. Share of borrowings in total sources of funds during 2007-08 was lower, compared to 2006-07. The share of gross capital formation in uses of funds increased in 2007-08 over that in 2006-07 mainly due to increase in share of gross fixed asset formation in uses of funds during the year under review.
Table 1: Growth rates and ratios of select items |
(Per cent) |
Item |
2006-07 |
2007-08 |
Growth rates |
|
|
Sales + |
27.3 |
18.6 |
Value of production |
27.2 |
18.9 |
Manufacturing expenses |
26.3 |
18.9 |
Remuneration to employees |
27.3 |
22.4 |
Gross profits |
46.6 |
24.9 |
Interest paid |
25.8 |
29.4 |
Profits before tax |
46.0 |
25.7 |
Tax provision |
41.3 |
25.0 |
Profits after tax |
47.6 |
26.0 |
Dividend paid |
13.7 |
21.0 |
Profits retained |
60.3 |
27.3 |
Net worth @ |
28.5 |
31.9 |
Gross saving |
41.7 |
23.5 |
Ratios |
|
|
Debt to equity |
47.8 |
44.4 |
Gross fixed assets formation to total uses of funds |
34.9 |
38.7 |
Gross capital formation to total uses of funds |
47.0 |
50.5 |
Gross profits to sales |
14.1 |
14.9 |
Profits after tax to net worth |
18.5 |
17.5 |
Tax provision to profits before tax |
24.9 |
24.8 |
Profits retained to profits after tax |
79.1 |
79.9 |
Ordinary dividends to ordinary paid-up capital |
26.7 |
30.6 |
+ : Net of ‘Rebates and discounts’ and ‘Excise duty and cess’.
@ : Adjusted for revaluation, etc. |
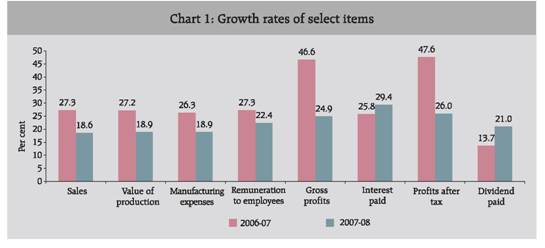
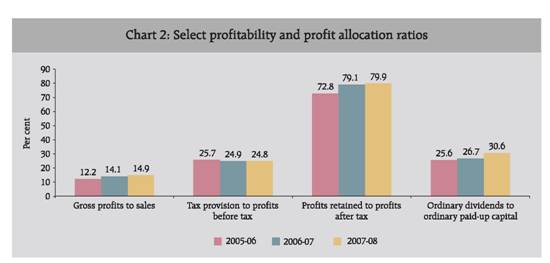
Income and Expenditure The total sales of 3,114 select companies amounted to Rs. 12,92,146 crore, registering a growth of 18.6 per cent in 2007-08 as against 27.3 per cent in 2006-07 (Table 1 & Statement 3). Manufacturing expenses grew at a lower rate of 18.9 per cent as against 26.3 per cent and employees’ remuneration also increased at a lower rate of 22.4 per cent in 2007-08 as against 27.3 per cent in the previous year. Interest payments growth witnessed a reversal from either negative or very low growth rate in recent years to record a growth rate of 25.8 per cent in 2006-07 followed by 29.4 per cent in 2007-08. Growth in gross profits and profits after tax moderated to 24.9 per cent and 26.0 per cent in 2007-08 from 46.6 per cent and 47.6 per cent, respectively in 2006-07. Dividend payments, amounting to Rs.25,528 crore registered a higher growth of 21.0 per cent in 2007-08, compared to 13.7 per cent in 2006-07. The growth rate in profits retained by the select companies decreased significantly to 27.3 per cent in 2007-08 after registering a growth of 60.3 per cent in the previous year. Gross savings grew at a lower rate of 23.5 per cent in 2007-08, compared to 41.7 per cent registered in 2006-07 while gross value added grew at 22.8 per cent in 2007-08 as against 33.3 per cent in 2006-07. Share of sales in total operating income of the select companies declined by 1.2 per cent to 94.6 per cent in 2007-08 while that of other income increased by 1.0 per cent to 3.6 per cent (Table 2). The composition on expenditure side remained almost similar with share of manufacturing expenses at 73.3 per cent. The profit margin (gross profits as a percentage of sales) of the select companies continued to increase from 12.2 per cent in 2005-06 to 14.1 per cent in 2006-07 and further to 14.9 per cent in 2007-08 (Statement 2 & Chart 2). Effective tax rate (tax provision as percentage of profits before tax) remained at around same level (24.8 per cent) in 2007-08 as was in 2006-07 (24.9 per cent). The retention ratio (profits retained as a percentage of profits after tax) moved gradually upwards from 72.8 per cent in 2005-06 to 79.1 per cent in 2006-07 and further to 79.9 per cent in 2007-08. The ordinary dividend rate (ordinary dividends as a percentage of ordinary paid-up capital) also was observed to be gradually increasing over the three year period (25.6 per cent in 2005-06, 26.7 per cent in 2006-07 and 30.6 per cent in 2007-08).
Table 2: Operating income and expenditure |
(Per cent) |
Income |
2006-07 |
2007-08 |
Expenditure |
2006-07 |
2007-08 |
Sales |
95.8 |
94.6 |
Manufacturing expenses |
73.7 |
73.3 |
Change in Inventory |
1.6 |
1.8 |
Remuneration to employees |
7.4 |
7.6 |
Other income |
2.6 |
3.6 |
Interest expenses |
2.5 |
2.7 |
| |
|
|
Other expenses |
12.4 |
12.5 |
| |
|
|
Provision (other than tax) |
4.0 |
3.9 |
Total |
100.0 |
100.0 |
Total |
100.0 |
100.0 |
Earnings and Expenditure in Foreign Currencies The total earnings in foreign currencies2 of the select companies grew by 22.3 per cent to Rs. 3,25,169 crore in 2007-08 against a growth of 42.0 per cent in 2006-07 (Statements 1 & 6). The merchandise exports amounted to Rs. 2,50,841 crore recording an increase by 23.7 per cent in 2007-08 as compared to 44.5 per cent growth recorded in the previous year. The exports to sales ratio continued to move higher from 16.4 per cent in 2005-06 to 18.6 per cent in 2006-07 and further to 19.4 per cent in 2007-08 (Statement 2). The total expenditure in foreign currencies (Rs. 3,89,251 crore) increased by 30.7 per cent in 2007-08, compared to 34.3 per cent in 2006-07. The value of merchandise imports at Rs.3,16,889 crore registered a growth of 27.0 per cent in 2007-08, compared to 34.1 per cent in 2006-07. The imports of raw materials and capital goods accounted for 77.7 per cent (78.8 per cent in 2006-07) and 12.3 per cent (10.2 per cent in 2006-07), respectively of the total merchandise imports in 2007-08. The net outflow in foreign currencies for the select companies amounted to more than double at Rs. 64,082 crore in 2007-08, up from Rs. 31,868 crore in 2006-07. Liabilities and Assets Total liabilities/assets of the select companies increased by 30.4 per cent to Rs. 16,89,297 crore in 2007-08 (Statement 4). Gross fixed assets (adjusted for revaluation) registered a higher growth rate of 20.8 per cent in 2007-08 as against 16.4 per cent in 2006-07 (Statement 1).
Table 3: Composition of Liabilities and Assets |
(Per cent) |
Capital and Liabilities |
2006-07 |
2007-08 |
Assets |
2006-07 |
2007-08 |
1. Share capital |
6.8 |
5.9 |
1. Gross fixed assets |
60.4 |
56.7 |
2. Reserves and surplus |
35.3 |
37.1 |
2. Depreciation |
20.7 |
18.1 |
of which, Capital reserve |
14.3 |
14.9 |
3. Net fixed assets |
39.8 |
38.5 |
3. Borrowings |
32.6 |
32.1 |
4. Inventories |
13.2 |
13.1 |
of which, From banks |
19.5 |
20.1 |
5. Loans and advances and other debtor balances |
24.6 |
26.3 |
4. Trade dues and other
current liabilities |
20.7 |
20.3 |
6. Investments |
12.2 |
14.2 |
of which, Sundry creditors |
12.5 |
12.1 |
7. Advance of income-tax |
— |
— |
5. Provisions |
4.6 |
4.6 |
8. Other assets |
1.8 |
1.5 |
6. Miscellaneous non-current
liabilities |
— |
— |
9. Cash and bank balances |
8.4 |
6.4 |
Total |
100.0 |
100.0 |
Total |
100.0 |
100.0 |
— : Nil or negligible |
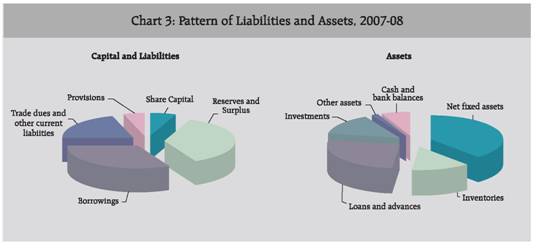
The composition of capital and liabilities (Table 3 and Chart 3) in 2007-08 showed an increase in the share of reserves and surplus in total liabilities by 1.8 per cent to 37.1 per cent as against a decline in the share of share capital along with a marginal drop in the shares of borrowings and trade dues and other current liabilities. Borrowings contributed 32.1 per cent of total liabilities followed by trade dues and other current liabilities at 20.3 per cent in 2007-08. Banks continued to be the major stakeholders in total outstanding borrowings. Debt-equity ratio fell to 44.4 per cent in 2007-08 from 47.8 per cent in 2006-07. The composition of assets in 2007-08 displayed a decline in share of net fixed assets, cash and bank balances against an increase in share of loans and advances and investments in total assets. Net fixed assets contributed a major share at 38.5 per cent in total assets followed by loans and advances at 26.3 per cent and investments at 14.2 per cent in 2007-08. The current ratio (current assets to current liabilities) remained unchanged at 1.3 per cent in 2007-08 i.e. same as in 2006-07.
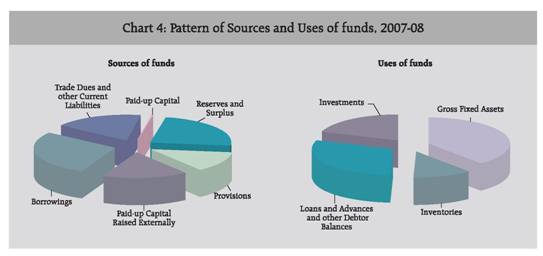
Sources and Uses of funds An analysis of sources and uses of funds revealed that the total funds sourced / used by the select companies amounted to Rs. 4,21,095 crore in 2007-08, recording a growth of 33.9 per cent over Rs. 3,14,571 crore in the previous year (Statement 5). The composition of sources of funds of the select companies (Table 4 and chart 4) continued to exhibit more reliance on external sources of funds, though at a lower share in 2007-08 (63.1 per cent of total sources of funds) than in 2006-07 (66.9 per cent). Share of internal sources of funds moved up to 36.9 per cent in 2007-08 from 33.1 per cent in the previous year mainly on account of increase in share of provisions. In external sources of funds, while raising of capital from secondary market increased the share of paid-up capital, the share of borrowings and trade dues and other current liabilities declined. The composition of uses of funds displayed an increase in share of gross fixed assets, loans and advances and investments and a sharp decline in share of cash and bank balances. The share of borrowings in total liabilities decreased from that in the previous year. However, borrowings continued to be a leading source of funds during 2007-08 (28.3 per cent) followed by reserves and surplus (23.8 per cent). In absolute terms, incremental borrowings amounted to Rs. 1,19,106 crore during 2007-08 registering an increase of 16.8 per cent from Rs. 1,01,935 crore during 2006-07. The incremental borrowings from foreign institutional agencies during 2007-08 amounted to Rs. 16,036 crore as against Rs. 26,000 crore during 2006-07. The gross fixed assets formation by the select companies increased to Rs.1,62,753 crore during 2007-08 from Rs. 1,09,888 crore in 2006-07 recording a growth of 48.1 per cent and increasing its share in total uses of funds to 38.6 per cent as against 34.9 per cent in the previous year. The share of loans and advances and other debtor balances and investments in total uses of funds also moved up to 29.9 per cent and 19.4 per cent in 2007-08 as compared to 25.2 per cent and 15.9 per cent, respectively, in 2006-07. The share of formation of inventories during 2007-08 fell marginally to 11.8 per cent from 12.1 per cent during 2006-07. Gross savings to gross capital formation ratio during 2007-08 declined to 69.2 per cent as against 80.5 per cent during 2006-07.
Table 4: Composition of Sources and Uses of funds |
(Per cent) |
Sources of funds |
2006-07 |
2007-08 |
Uses of funds |
2006-07 |
2007-08 |
Internal sources (Own sources) |
33.1 |
36.9 |
1. Gross fixed assets |
34.9 |
38.6 |
1. Paid-up capital |
0.6 |
0.4 |
of which, i) Buildings |
3.1 |
3.2 |
2. Reserves and Surplus |
23.5 |
23.8 |
ii) Plant and machinery |
20.2 |
19.3 |
3. Provisions |
9.0 |
12.8 |
2. Inventories |
12.1 |
11.8 |
of which, Depreciation provision |
8.8 |
8.0 |
of which,
i) Raw materials etc. |
3.8 |
4.3 |
External sources
(Other than own sources) |
66.9 |
63.1 |
ii) Finished goods |
2.5 |
2.8 |
4. Paid-up capital* |
14.3 |
17.1 |
3. Loans and advances and
other debtor balances |
25.2 |
29.9 |
of which, Premium on shares |
12.7 |
14.4 |
4. Investments |
15.9 |
19.4 |
5. Borrowings |
32.4 |
28.3 |
5. Other assets |
2.3 |
0.7 |
of which, i) Debentures |
-0.4 |
0.5 |
6. Cash and bank balances |
9.5 |
-0.5 |
ii) Loans and advances |
32.7 |
26.0 |
|
|
|
of which, From banks |
22.1 |
20.5 |
|
|
|
6. Trade dues and other current liabilities |
20.2 |
17.7 |
|
|
|
Total |
100.0 |
100.0 |
Total |
100.0 |
100.0 |
* : Includes capital receipts. |
Performance of companies by size of Sales It is observed that companies with larger sales volume recorded, like in the previous year, higher rate of growth in sales during the year under review (Table 5 and Statement 7). Growth in sales as well as gross profits moderated in 2007-08 across all size classes. Sales growth rate was maximum at 19.9 per cent in the sales size group ‘Rs. 1000 crore and above’ in 2007-08. While sales declined by 2.4 per cent (recording negative growth rate) in the smallest sales size group ‘Less than Rs. 25 crore’, these companies recorded highest gross profit growth of 36.8 per cent in 2007-08. Companies in sales size group ‘Rs. 25 crore to Rs. 50 crore’ displayed a decline in their gross profits by 1.5 per cent (recording negative growth rate) in the year under review. Total net assets were observed to grow at a higher rate in 2007-08 in all sales classes, except for ‘Rs. 50 crore to Rs. 100 crore’ and ‘Rs. 500 crore to Rs. 1000 crore’. Profit margin fell in 2007-08 only for companies having sales ‘Rs. 25 crore to Rs. 50 crore’ (Statement 8). Companies with sales range ‘Rs. 1000 crore and above’ showed the highest profit margin of 16.4 per cent whereas the lowest profit margin of 8.1 per cent was registered by companies in sales range ‘Rs. 25 crore to Rs. 50 crore’ in 2007-08. Debt to equity ratio was the lowest, at 31.8 per cent, for the smallest sales size companies viz. in ‘Less than Rs. 25 crore’ sales range while companies in ‘Rs. 25 crore to Rs. 50 crore’ sales range continued to record the highest debt equity ratio at 93.5 per cent in 2007-08. Effective tax rate (ratio of tax provision to profits before tax) ranged from 23.6 per cent in sales range ‘Less than Rs. 25 crore’ to as high as 56.6 per cent in sales range ‘Rs. 25 crore to Rs. 50 crore’. Higher effective tax rate for companies in ‘Rs. 25 crore to Rs. 50 crore’ sales size group was on account of some loss making companies in that group.
Table 5: Performance of companies by size of Sales |
(Per cent) |
A. Growth rates of select items |
Sales size group |
Number of companies |
Sales |
Gross profits |
Total net assets |
2006-07 |
2007-08 |
2006-07 |
2007-08 |
2006-07 |
2007-08 |
Less than Rs. 25 cr |
872 |
2.6 |
-2.4 |
# |
36.8 |
13.5 |
19.1 |
Rs. 25 cr - Rs. 50 cr |
397 |
11.9 |
9.6 |
63.0 |
-1.5 |
15.7 |
19.7 |
Rs. 50 cr - Rs. 100 cr |
462 |
16.9 |
9.6 |
24.5 |
12.0 |
32.0 |
16.4 |
Rs. 100 cr - Rs. 500 cr |
910 |
22.3 |
17.2 |
37.7 |
17.3 |
27.5 |
28.4 |
Rs. 500 cr - Rs. 1000 cr |
226 |
24.4 |
17.8 |
43.1 |
26.5 |
33.1 |
29.1 |
Rs. 1000 cr and above |
247 |
30.4 |
19.9 |
48.8 |
26.7 |
28.5 |
31.6 |
B. Select financial ratios |
Sales size group |
Gross profits to Sales |
Debt to Equity |
Tax provision to Profits before tax |
2005-06 |
2006-07 |
2007-08 |
2005-06 |
2006-07 |
2007-08 |
2005-06 |
2006-07 |
2007-08 |
Less than Rs. 25 cr |
0.9 |
7.0 |
9.8 |
53.8 |
45.0 |
31.8 |
107.5 |
34.1 |
23.6 |
Rs. 25 cr - Rs. 50 cr |
6.2 |
9.0 |
8.1 |
114.3 |
98.0 |
93.5 |
43.6 |
38.6 |
56.6 |
Rs.50 cr - Rs.100 cr |
9.5 |
10.1 |
10.3 |
55.7 |
52.3 |
45.3 |
29.0 |
27.3 |
27.5 |
Rs.100 cr-Rs.500 cr |
10.3 |
11.6 |
11.6 |
56.6 |
52.4 |
51.2 |
26.8 |
25.1 |
28.3 |
Rs. 500 cr - Rs. 1000 cr |
10.3 |
11.8 |
12.7 |
64.0 |
65.8 |
59.0 |
26.1 |
26.4 |
27.0 |
Rs. 1000 cr and above |
13.6 |
15.5 |
16.4 |
39.7 |
43.0 |
40.2 |
25.1 |
24.4 |
23.7 |
# : Denominator is negative or nil or negligible. |
Performance of companies by size of Paid-up capital When analysed by grouping the select companies based on size of their paid-up capital, growth rate in sales was observed to be lower in 2007-08 than in the previous year in all PUC size classes (Table 6 and Statement 9). It was the lowest at 4.2 per cent in PUC size class ‘Less than Rs. 1 crore’ and the highest at 20.3 per cent for companies in PUC sizes ‘Rs. 10 crore to Rs. 25 crore’ and ‘Rs. 25 crore to Rs. 50 crore’. Growth rate in gross profits was also lower in 2007-08 than that in the previous year in all PUC size classes except in ‘Rs. 2 crore to Rs. 5 crore’. It ranged from 17.4 per cent in the PUC size class of ‘Rs. 50 crore to Rs. 100 crore’ to 35.3 per cent in PUC size class ‘Less than Rs. 1 crore’ in 2007-08. Companies in PUC size class of ‘Less than Rs. 1 crore’ recorded the highest growth rate in total net assets at 39.2 per cent whereas companies in PUC size class of ‘Rs. 2 crore to Rs. 5 crore’ recorded the lowest net assets growth at 18.9 per cent in 2007-08. Profit margin improved in 2007-08 over previous year in all PUC size classes except for ‘Rs.50 crore to Rs. 100 crore’ (Statement 10). Companies with the lowest PUC size (‘Less than Rs. 1 crore’) registered the highest profit margin of 22.8 per cent, whereas, the lowest profit margin of 7.7 per cent was registered by companies in PUC size class of ‘Rs. 2 crore to Rs. 5 crore’ in 2007-08. Debt to equity ratio increased for companies with PUC size of ‘Less than Rs. 1 crore’ and ‘Rs. 2 crore to Rs. 5 crore’ in 2007-08, compared to that in 2006-07. Highest debt to equity ratio in 2007-08 was at 69.0 per cent in the PUC range of ‘Less than Rs. 1 crore’ whereas the lowest was at 24.5 per cent in the PUC range of ‘Rs.1 crore to Rs.2 crore’. The smallest PUC size companies in ‘Less than Rs. 1 crore’ recorded the highest effective tax rate at 36.5 per cent while the largest companies in ‘Rs. 100 crore and above’ recorded the lowest at 21.8 per cent in 2007-08, as was the case in the previous year.
Table 6: Performance of companies by size of Paid-up capital |
(Per cent) |
A. Growth rates of select items |
PUC size group |
Number of companies |
Sales |
Gross profits |
Total net assets |
2006-07 |
2007-08 |
2006-07 |
2007-08 |
2006-07 |
2007-08 |
Less than Rs. 1 cr |
178 |
11.8 |
4.2 |
43.9 |
35.3 |
23.0 |
39.2 |
Rs. 1 cr - Rs. 2 cr |
182 |
12.8 |
12.5 |
20.6 |
19.4 |
22.4 |
19.4 |
Rs. 2 cr - Rs. 5 cr |
683 |
17.3 |
14.1 |
14.9 |
23.0 |
19.2 |
18.9 |
Rs. 5 cr - Rs. 10 cr |
665 |
23.6 |
18.2 |
32.5 |
21.8 |
23.5 |
20.3 |
Rs. 10 cr - Rs. 25 cr |
792 |
29.1 |
20.3 |
42.2 |
24.6 |
34.3 |
27.7 |
Rs. 25 cr - Rs. 50 cr |
316 |
26.0 |
20.3 |
33.6 |
32.5 |
33.8 |
28.0 |
Rs. 50 cr - Rs. 100 cr |
156 |
26.3 |
20.0 |
56.2 |
17.4 |
30.1 |
28.6 |
Rs. 100 cr and above |
142 |
29.7 |
17.6 |
53.6 |
24.9 |
25.6 |
33.5 |
B. Select financial ratios |
PUC size group |
Gross profits to Sales |
Debt to Equity |
Tax provision to Profits before tax |
2005-06 |
2006-07 |
2007-08 |
2005-06 |
2006-07 |
2007-08 |
2005-06 |
2006-07 |
2007-08 |
Less than Rs. 1 cr |
13.6 |
17.6 |
22.8 |
49.3 |
35.8 |
69.0 |
29.3 |
36.2 |
36.5 |
Rs. 1 cr - Rs. 2 cr |
7.6 |
8.1 |
8.6 |
26.1 |
28.1 |
24.5 |
27.4 |
30.9 |
25.2 |
Rs. 2 cr - Rs. 5 cr |
7.3 |
7.1 |
7.7 |
39.6 |
42.1 |
45.6 |
29.3 |
28.2 |
32.9 |
Rs. 5 cr - Rs. 10 cr |
8.2 |
8.8 |
9.1 |
41.2 |
40.5 |
38.2 |
28.9 |
28.0 |
28.8 |
Rs. 10 cr - Rs. 25 cr |
10.6 |
11.7 |
12.1 |
47.6 |
50.3 |
44.1 |
25.5 |
25.6 |
26.1 |
Rs. 25 cr - Rs. 50 cr |
11.3 |
12.0 |
13.2 |
47.6 |
47.7 |
44.2 |
25.8 |
25.8 |
28.1 |
Rs. 50 cr - Rs. 100 cr |
12.2 |
15.1 |
14.7 |
51.8 |
51.4 |
49.7 |
25.3 |
25.7 |
27.7 |
Rs. 100 cr and above |
14.8 |
17.5 |
18.6 |
44.9 |
47.4 |
43.7 |
25.3 |
23.5 |
21.8 |
Industry wise performance Among the select industry groups (Table 7 and Statement 11), it may be observed that the companies in ‘Man-made textiles’, ‘Chemical fertilizers and pesticides’ and ‘Plastic products’ industry groups managed to register higher sales growth in 2007-08 than in 2006-07 (18.1 per cent, 11.5 per cent and 26.7 per cent as compared to 6.5 per cent, 9.0 per cent and 24.5 per cent respectively). Companies in ‘Construction’ industry continued to record the highest sales growth of 47.7 per cent in 2007-08 on the back of 61.3 per cent growth in 2006-07. Companies in ‘Sugar’ industry observed a decline in sales by 2.9 per cent (recording negative growth rate) in 2007-08. Companies in ‘Man-made textiles’, ‘Chemical fertilizers and pesticides’ and ‘Transport, storage and communications’ industries registered a higher growth rate in gross profits at 55.7 per cent, 16.9 per cent and 68.4 per cent, respectively in 2007-08, compared to 18.8 per cent, 6.5 per cent and 18.8 per cent, respectively in 2006-07, the gross profits of companies in ‘Food products and beverage’ (along with ‘Sugar’) and ‘Cotton textiles’ industries fell registering a negative growth of 5.7 per cent and 16.4 per cent, respectively in 2007-08. Other companies registering single digit growth in gross profits in 2007-08 belonged to ‘Motor vehicles and other transport equipments’ and ‘Pharmaceuticals and medicines’ industries as against a high growth rate of 28.3 per cent and 59.8 per cent, respectively in 2006-07. The highest growth rate in gross profits in 2007-08 was recorded by companies in ‘Transport, storage and communications’ (68.4 per cent) followed by companies in ‘Mining and quarrying’ industry (62.3 per cent). Companies in ‘Computer and related activities’ industry significantly increased their bank borrowings recording the highest rate at 156.7 per cent in 2007-08, compared to 26.6 per cent in 2006-07. Other industries recording significant high growth in bank borrowings in 2007-08 are ‘Sugar’ (87.3 per cent), ‘Food products and beverages’ (55.9 per cent), ‘Construction’ (55.5 per cent), ‘Man-made textiles’ (48.1 per cent) and ‘Cement and cement products’ (46.2 per cent).
Table 7: Industry wise performance |
(Per cent) |
A. Growth rates of select items |
Select Industry/Industry group |
Number of companies |
Sales |
Gross profits |
Bank borrowings |
2006-07 |
2007-08 |
2006-07 |
2007-08 |
2006-07 |
2007-08 |
Mining and quarrying |
39 |
23.7 |
20.2 |
81.7 |
62.3 |
36.2 |
31.5 |
Food products and beverages |
231 |
23.6 |
19.7 |
32.5 |
-5.7 |
31.9 |
55.9 |
of which, Sugar |
49 |
27.2 |
-2.9 |
8.2 |
-67.8 |
30.4 |
87.3 |
Cotton Textiles |
151 |
18.5 |
12.7 |
14.2 |
-16.4 |
44.6 |
31.8 |
Man-made textiles |
62 |
6.5 |
18.1 |
18.8 |
55.7 |
58.7 |
48.1 |
Chemicals and chemical products |
416 |
17.3 |
12.2 |
31.5 |
11.2 |
23.6 |
21.9 |
of which, Chemical fertilizers and pesticides |
49 |
9.0 |
11.5 |
6.5 |
16.9 |
19.1 |
28.6 |
Pharmaceuticals and medicines |
147 |
26.1 |
14.9 |
59.8 |
9.4 |
12.6 |
31.9 |
Plastic products |
106 |
24.5 |
26.7 |
64.6 |
51.3 |
19.0 |
25.8 |
Cement and cement products |
42 |
36.0 |
21.9 |
131.9 |
34.4 |
39.3 |
46.2 |
Iron and steel |
135 |
30.4 |
20.8 |
53.1 |
28.5 |
18.9 |
40.4 |
Machinery and machine tools |
196 |
27.7 |
20.6 |
42.7 |
22.9 |
20.2 |
39.1 |
Electrical machinery and apparatus |
112 |
36.9 |
29.4 |
47.5 |
38.8 |
48.8 |
24.8 |
Motor vehicles and other transport |
|
|
|
|
|
|
|
equipments |
138 |
24.7 |
10.3 |
28.3 |
4.4 |
47.4 |
39.4 |
Construction |
95 |
61.3 |
47.7 |
144.5 |
49.8 |
124.4 |
55.5 |
Transport, storage and communications |
90 |
32.1 |
26.0 |
18.8 |
68.4 |
53.7 |
36.5 |
Computer and related activities |
178 |
39.8 |
23.9 |
51.1 |
25.2 |
26.6 |
156.7 |
All industries |
3114 |
27.3 |
18.6 |
46.6 |
24.9 |
37.9 |
34.1 |
B. Select financial ratios |
Select Industry/Industry group |
Gross profits to Sales |
Debt to Equity |
Tax provision to Profits before tax |
| |
2005-06 |
2006-07 |
2007-08 |
2005-06 |
2006-07 |
2007-08 |
2005-06 |
2006-07 |
2007-08 |
Mining and quarrying |
16.3 |
23.9 |
32.3 |
94.4 |
95.6 |
85.5 |
46.6 |
33.2 |
35.1 |
Food products and beverages |
7.8 |
8.4 |
6.6 |
58.8 |
60.5 |
63.7 |
30.2 |
24.5 |
30.5 |
of which, Sugar |
16.6 |
14.1 |
4.7 |
82.4 |
82.4 |
111.8 |
22.2 |
17.8 |
# |
Cotton Textiles |
9.0 |
8.6 |
6.4 |
114.4 |
127.7 |
157.7 |
24.9 |
24.9 |
39.4 |
Man-made textiles |
5.1 |
5.7 |
7.5 |
127.6 |
151.1 |
192.4 |
17.2 |
28.7 |
23.6 |
Chemicals and chemical products |
12.2 |
13.7 |
13.5 |
46.5 |
45.2 |
35.9 |
26.5 |
24.2 |
24.9 |
of which, Chemical fertilizers and
pesticides |
10.8 |
10.5 |
11.1 |
51.3 |
53.9 |
37.0 |
30.4 |
28.7 |
29.3 |
Pharmaceuticals and medicines |
15.5 |
19.6 |
18.7 |
32.9 |
35.2 |
30.3 |
23.3 |
21.1 |
22.6 |
Plastic products |
7.5 |
10.0 |
11.9 |
69.9 |
64.2 |
61.6 |
29.5 |
26.8 |
25.9 |
Cement and cement products |
14.7 |
25.0 |
27.6 |
92.0 |
81.5 |
68.5 |
22.3 |
27.5 |
27.1 |
Iron and steel |
14.9 |
17.5 |
18.6 |
103.2 |
104.4 |
82.1 |
29.0 |
29.8 |
26.5 |
Machinery and machine tools |
10.9 |
12.1 |
12.4 |
18.4 |
21.3 |
23.1 |
32.9 |
31.3 |
32.7 |
Electrical machinery and apparatus |
12.7 |
13.7 |
14.7 |
30.5 |
24.6 |
26.6 |
24.5 |
25.9 |
28.3 |
Motor vehicles and other transport equipments |
10.4 |
10.7 |
10.1 |
30.3 |
31.3 |
32.2 |
31.1 |
28.9 |
26.5 |
Construction |
10.9 |
16.5 |
16.8 |
42.0 |
56.4 |
45.6 |
23.3 |
27.2 |
27.6 |
Transport, storage and communications |
7.8 |
7.0 |
9.4 |
91.5 |
120.4 |
125.3 |
52.0 |
53.3 |
28.6 |
Computer and related activities |
21.5 |
23.2 |
23.4 |
5.4 |
6.9 |
13.7 |
17.6 |
12.9 |
18.1 |
All industries |
12.2 |
14.1 |
14.9 |
46.1 |
47.8 |
44.4 |
25.7 |
24.9 |
24.8 |
# : Denominator is negative or nil or negligible. |
Companies in ‘Mining and quarrying’, ‘Cement and cement products’ and ‘Computer and related activities’ industries continued to improve and record highest profit margin among the select industry groups both in 2006-07 and in 2007-08 (Statement 12). Companies in ‘Food products and beverages’, ‘Cotton textiles’, ‘Man-made textiles’ and ‘Transport, storage and communications’ appear to earn very low profit margin out of business as indicated by profit margin of below 10 per cent in all three years viz. 2005-06 to 2007-08. The debt-equity ratio in 2007-08 was the lowest at 13.7 per cent for companies in ‘Computer and related activities’ industry, whereas, it was at a significantly higher level in respect of companies in ‘Man-made textile’ (192.4 per cent), ‘Cotton textiles’ (157.7 per cent), ‘Transport, storage and communications’ (125.3 per cent) and ‘Sugar’ (111.8 per cent) industries. The higher effective tax rate in 2007-08 was observed for companies in ‘Cotton textiles’ industry (39.4 per cent) followed by companies in ‘Mining and quarrying’ industry (35.1 per cent), while lower rates prevailed for companies in industries like ‘Computer and related activities’ (18.1 per cent) and ‘Pharmaceuticals and medicines’ (22.6 per cent).
Statement 1: Growth rates of the select items of the select 3,114 Public Limited Companies, 2006-07 and 2007-08 |
(Per cent) |
Item |
2006-07 |
2007-08 |
1 |
2 |
3 |
1. |
Sales + |
27.3 |
18.6 |
2. |
Value of production |
27.2 |
18.9 |
3. |
Total Income |
27.2 |
20.3 |
4. |
Manufacturing expenses |
26.3 |
18.9 |
5. |
Remuneration to employees |
27.3 |
22.4 |
6. |
Depreciation provision |
14.8 |
15.7 |
7. |
Gross profits |
46.6 |
24.9 |
8. |
Interest |
25.8 |
29.4 |
9. |
Operating profits |
51.5 |
24.1 |
10. |
Non-operating surplus/deficit |
-21.4 |
65.2 |
11. |
Profits before tax |
46.0 |
25.7 |
12. |
Tax provision |
41.3 |
25.0 |
13. |
Profits after tax |
47.6 |
26.0 |
14. |
Dividend paid |
13.7 |
21.0 |
15. |
Profits retained |
60.3 |
27.3 |
16. |
Gross saving |
41.7 |
23.5 |
17. |
(a) |
Gross value added |
33.3 |
22.8 |
| |
(b) |
Net value added |
37.2 |
24.1 |
18. |
Net worth @ |
28.5 |
31.9 |
19. |
Total borrowings @ |
31.8 |
28.2 |
| |
of which, from banks @ |
37.9 |
34.1 |
20. |
Trade dues and other current liabilities @ |
31.2 |
27.8 |
21. |
(a) |
Gross fixed assets @ |
16.4 |
20.8 |
| |
(b) |
Net fixed assets @ |
19.1 |
25.0 |
22. |
Inventories @ |
28.5 |
29.0 |
23. |
(a) |
Gross physical assets @ |
18.4 |
22.2 |
| |
(b) |
Net physical assets @ |
21.3 |
26.0 |
24. |
(a) |
Total gross assets @ |
25.3 |
26.9 |
| |
(b) |
Total net assets @ |
28.5 |
29.9 |
25. |
Total earnings in foreign currencies |
42.0 |
22.3 |
| |
of which, Exports |
44.5 |
23.7 |
26. |
Total expenditure in foreign currencies |
34.3 |
30.7 |
| |
of which, Imports |
34.1 |
27.0 |
+ : Net of ‘Rebates and discounts’ and ‘excise duty and cess’
@ : Adjusted for revaluation, etc.
Note : Rates of growth of all items are adjusted for changes due to amalgamation of companies. |
Statement 2: Select financial ratios of the select 3,114 Public Limited Companies, 2005-06 to 2007-08 |
(Per cent) |
Select financial ratios |
2005-06 |
2006-07 |
2007-08 |
1 |
2 |
3 |
4 |
A. |
Capital structure ratios |
|
|
|
| |
1. |
Net fixed assets to total net assets |
42.8 |
39.8 |
38.5 |
| |
2. |
Net worth to total net assets |
42.1 |
42.0 |
42.9 |
| |
3. |
Debt to equity |
46.1 |
47.8 |
44.4 |
| |
4. |
Debt to equity
(equity adjusted for revaluation reserve) |
48.7 |
49.8 |
46.2 |
| |
5. |
Short term bank borrowings to inventories |
76.4 |
77.2 |
83.9 |
| |
6. |
Total outside liabilities to net worth |
137.3 |
137.9 |
133.0 |
B. |
Liquidity ratios |
|
|
|
| |
7. |
Current assets to current liabilities * |
1.2 |
1.3 |
1.3 |
| |
8. |
Quick assets to current liabilities |
59.5 |
61.1 |
53.9 |
| |
9. |
Current assets to total net assets |
46.9 |
48.5 |
48.1 |
| |
10. |
Sundry creditors to current assets |
26.9 |
25.9 |
25.1 |
| |
11. |
Sundry creditors to net working capital |
142.4 |
113.5 |
114.1 |
C. |
Assets utilization and turnover ratios |
|
|
|
| |
12. |
Sales to total net assets |
84.9 |
84.1 |
76.5 |
| |
13. |
Sales to gross fixed assets |
128.0 |
139.0 |
135.0 |
| |
14. |
Inventories to sales |
15.6 |
15.7 |
17.1 |
| |
15. |
Sundry debtors to sales |
15.0 |
14.5 |
15.0 |
| |
16. |
Exports to sales |
16.4 |
18.6 |
19.4 |
| |
17. |
Gross value added to gross fixed assets |
29.6 |
33.7 |
33.9 |
| |
18. |
Raw materials consumed to value of production |
54.9 |
54.7 |
54.5 |
D. |
Sources and uses of funds ratios @ |
|
|
|
| |
19. |
Gross fixed assets formation to total uses of funds |
|
34.9 |
38.7 |
| |
20. |
Gross capital formation to total uses of funds |
|
47.0 |
50.5 |
| |
21. |
External sources of funds to total sources of funds |
|
66.9 |
63.1 |
| |
22. |
Increase in bank borrowings to total external sources |
|
33.1 |
32.5 |
| |
23. |
Gross savings to gross capital formation |
|
80.5 |
69.2 |
E. |
Profitability and profit allocation ratios |
|
|
|
| |
24. |
Gross profits to total net assets |
10.4 |
11.9 |
11.4 |
| |
25. |
Gross profits to sales |
12.2 |
14.1 |
14.9 |
| |
26. |
Profits after tax to net worth |
16.1 |
18.5 |
17.5 |
| |
27. |
Tax provision to profits before tax |
25.7 |
24.9 |
24.8 |
| |
28. |
Profits retained to profits after tax |
72.8 |
79.1 |
79.9 |
| |
29. |
Dividends to net worth |
4.4 |
3.9 |
3.5 |
| |
30. |
Ordinary dividends to ordinary paid-up capital |
25.6 |
26.7 |
30.6 |
@ : Adjusted for revaluation, etc.
* : Item B.7 is the actual ratio of current assets to current liabilities. |
Statement 3: Combined Income, Value of Production, Expenditure and Appropriation accounts of the select 3,114 Public Limited Companies, 2005-06 to 2007-08 |
(Rs. crore) |
Item |
2005-06 |
2006-07 |
2007-08 |
1 |
2 |
3 |
4 |
Income and Value of Production |
|
|
|
1. |
Sales + |
8,56,007 |
10,89,391 |
12,92,146 |
2. |
Increase(+)/decrease(-) in value of stock |
|
|
|
| |
of finished goods and work in progress |
14,487 |
17,980 |
24,809 |
3. |
Value of production (1+2) |
8,70,494 |
11,07,370 |
13,16,955 |
4. |
Other income |
21,203 |
30,080 |
48,768 |
| |
of which, |
|
|
|
| |
(a) Dividends |
2,411 |
3,841 |
4,531 |
| |
(b) Interest |
5,041 |
6,899 |
10,065 |
| |
(c) Rent |
685 |
1,320 |
976 |
5. |
Non-operating surplus(+)/ deficit(-) |
6,858 |
5,390 |
8,903 |
6. |
Total (3+4+5) |
8,98,556 |
11,42,840 |
13,74,625 |
Expenditure and Appropriations |
|
|
|
7. |
Raw materials, components, etc., consumed |
4,77,827 |
6,06,240 |
7,17,687 |
8. |
Stores and spares consumed |
26,652 |
30,452 |
36,927 |
9. |
Power and fuel |
42,159 |
49,949 |
58,339 |
10. |
Other manufacturing expenses |
41,870 |
56,694 |
71,095 |
11. |
Salaries, wages and bonus |
50,414 |
64,903 |
79,543 |
12. |
Provident fund |
3,519 |
4,252 |
5,012 |
13. |
Employees’ welfare expenses |
5,086 |
5,957 |
7,401 |
14. |
Managerial remuneration |
1,938 |
2,581 |
3,355 |
15. |
Royalty |
2,457 |
3,099 |
3,323 |
16. |
Repairs to buildings |
1,327 |
1,605 |
1,770 |
17. |
Repairs to machinery |
6,849 |
7,813 |
9,768 |
18. |
Bad debts |
2,936 |
2,334 |
3,070 |
19. |
Selling commission |
8,298 |
10,828 |
12,182 |
20. |
Rent |
6,055 |
5,280 |
6,869 |
21. |
Rates and taxes |
2,695 |
3,422 |
4,163 |
22. |
Advertisement |
8,307 |
9,856 |
11,398 |
23. |
Insurance |
2,398 |
2,812 |
2,726 |
24. |
Research and development |
3,045 |
3,140 |
3,611 |
25. |
Other expenses |
57,495 |
72,327 |
88,476 |
26. |
Depreciation provision |
34,341 |
39,440 |
45,628 |
27. |
Other provisions
(other than tax and depreciation) |
1,175 |
746 |
1,317 |
28. |
Gross profits |
1,04,854 |
1,53,720 |
1,92,064 |
29. |
Less: Interest |
19,860 |
24,981 |
32,319 |
30. |
Operating profits |
84,994 |
1,28,739 |
1,59,745 |
31. |
Non-operating surplus(+)/ deficit(-) |
6,858 |
5,390 |
8,903 |
32. |
Profits before tax |
91,852 |
1,34,129 |
1,68,648 |
33. |
Less: Tax provision |
23,628 |
33,397 |
41,746 |
34. |
Profits after tax |
68,224 |
1,00,732 |
1,26,903 |
35. |
Dividends |
18,550 |
21,098 |
25,528 |
| |
(a) Ordinary |
18,324 |
20,808 |
25,293 |
| |
(b) Preference |
226 |
291 |
234 |
36. |
Profits retained |
49,674 |
79,633 |
1,01,375 |
37. |
Total (7 TO 28 + 31) |
8,98,556 |
11,42,840 |
13,74,625 |
+ : Net of ‘rebates and discounts’ and ‘excise duty and cess’. |
Statement 4: Combined Balance Sheet of the select 3,114 Public Limited Companies,
2005-06 to 2007-08 |
(Rs. crore) |
Capital and Liabilities |
2005-06 |
2006-07 |
2007-08 |
1 |
2 |
3 |
4 |
A. |
Share capital |
82,147 |
87,605 |
98,895 |
| |
1. |
Paid-up capital |
82,026 |
87,487 |
98,729 |
| |
|
(a) |
Ordinary |
71,704 |
77,789 |
82,707 |
| |
|
|
of which, bonus |
10,198 |
12,223 |
13,619 |
| |
|
(b) |
Preference |
10,322 |
9,698 |
16,023 |
| |
2. |
Forfeited shares |
121 |
118 |
166 |
B. |
Reserves and surplus |
3,42,704 |
4,56,799 |
6,26,039 |
| |
3. |
Capital reserve |
1,43,893 |
1,84,833 |
2,52,447 |
| |
|
of which, premium on shares |
1,10,557 |
1,50,255 |
2,11,030 |
| |
4. |
Investment allowance reserve |
372 |
399 |
230 |
| |
5. |
Sinking funds |
5,812 |
6,631 |
6,902 |
| |
6. |
Other reserves |
1,92,627 |
2,64,937 |
3,66,460 |
C. |
Borrowings |
3,21,008 |
4,22,779 |
5,41,966 |
| |
7. |
Debentures @ |
31,151 |
29,880 |
32,143 |
| |
8. |
Loans and advances |
2,78,910 |
3,81,487 |
4,90,854 |
| |
|
(a) |
From banks |
1,83,623 |
2,53,081 |
3,39,450 |
| |
|
|
of which, short-term borrowings |
1,01,903 |
1,32,395 |
1,85,578 |
| |
|
(b) |
From other Indian financial institutions |
35,819 |
36,107 |
38,764 |
| |
|
(c) |
From foreign institutional agencies |
26,832 |
52,832 |
68,868 |
| |
|
(d) |
From Government and semi-Government bodies |
6,901 |
6,461 |
6,401 |
| |
|
(e) |
From companies |
8,737 |
11,315 |
14,307 |
| |
|
(f) |
From others |
16,998 |
21,691 |
23,063 |
| |
9. |
Deferred payments |
6,539 |
7,461 |
15,011 |
| |
10. |
Public deposits |
4,409 |
3,950 |
3,958 |
| |
of total borrowings, debt |
1,95,985 |
2,60,215 |
3,22,208 |
D. |
Trade dues and other current liabilities |
2,03,596 |
2,68,440 |
3,43,157 |
| |
11. |
Sundry creditors |
1,27,091 |
1,62,420 |
2,04,010 |
| |
12. |
Acceptances |
12,966 |
14,546 |
20,429 |
| |
13. |
Liabilities to companies |
748 |
916 |
1,123 |
| |
14. |
Advances/ deposits from customers, agents, etc. |
30,028 |
44,168 |
61,373 |
| |
15. |
Interest accrued on loans |
9,318 |
9,004 |
9,211 |
| |
16. |
Others |
23,446 |
37,385 |
47,011 |
E. |
Provisions |
58,702 |
59,357 |
79,240 |
| |
17. |
Taxation (net of advance of income-tax) |
26,873 |
29,051 |
36,235 |
| |
18. |
Dividends |
15,546 |
12,639 |
21,428 |
| |
19. |
Other current provisions |
12,297 |
12,247 |
13,893 |
| |
20. |
Non-current provisions |
3,985 |
5,420 |
7,683 |
F. |
21. |
Miscellaneous non-current liabilities |
— |
— |
— |
| |
22. |
Total |
10,08,157 |
12,94,979 |
16,89,297 |
@ : Include privately placed debentures.
— : Nil or negligible. |
Statement 4: Combined Balance Sheet of the select 3,114 Public Limited Companies,
2005-06 to 2007-08 (Concld.) |
(Rs. crore) |
Assets |
2005-06 |
2006-07 |
2007-08 |
1 |
2 |
3 |
4 |
G. |
Gross fixed assets |
6,68,897 |
7,83,822 |
9,57,308 |
| |
23. |
Land |
21,571 |
29,021 |
38,509 |
| |
24. |
Buildings |
65,827 |
76,334 |
90,088 |
| |
25. |
Plant and machinery |
4,77,333 |
5,43,722 |
6,28,822 |
| |
26. |
Capital work-in-progress |
59,435 |
82,325 |
1,36,849 |
| |
27. |
Furniture, fixtures and office equipments |
16,224 |
21,078 |
23,684 |
| |
28. |
Others |
28,507 |
31,342 |
39,356 |
H. |
29. |
Depreciation |
2,37,347 |
2,68,713 |
3,06,108 |
I. |
30. |
Net fixed assets |
4,31,550 |
5,15,109 |
6,51,199 |
J. |
Inventories |
1,33,466 |
1,71,489 |
2,21,259 |
| |
31. |
Raw materials, components, etc. |
46,679 |
58,579 |
76,529 |
| |
32. |
Finished goods |
42,560 |
50,550 |
62,154 |
| |
33. |
Work-in-progress |
24,563 |
33,519 |
45,780 |
| |
34. |
Stores and spares |
14,309 |
16,038 |
19,286 |
| |
35. |
Others |
5,355 |
12,804 |
17,510 |
K. |
Loans and advances and other debtor balances |
2,39,464 |
3,17,968 |
4,43,856 |
| |
36. |
Sundry debtors |
1,28,423 |
1,57,894 |
1,93,820 |
| |
37. |
Loans and advances |
86,477 |
1,23,984 |
1,99,727 |
| |
|
(a) |
To subsidiaries and companies under |
|
|
|
| |
|
|
the same management |
16,765 |
28,052 |
44,830 |
| |
|
(b) |
Others |
69,712 |
95,932 |
1,54,897 |
| |
38. |
Interest accrued on loans and advances |
1,957 |
2,748 |
4,053 |
| |
39. |
Deposits/ balances with |
|
|
|
| |
|
Government/ others |
14,329 |
20,841 |
28,204 |
| |
40. |
Others |
8,278 |
12,501 |
18,052 |
L. |
Investments |
1,08,967 |
1,58,625 |
2,40,166 |
| |
of which, quoted investments |
20,475 |
29,542 |
40,943 |
| |
41. |
Foreign |
3,999 |
8,030 |
22,191 |
| |
42. |
Indian |
1,04,969 |
1,50,595 |
2,17,975 |
| |
|
(a) |
Government/ semi-Government securities |
1,216 |
696 |
1,235 |
| |
|
(b) |
Securities of Financial Institutions |
37,816 |
51,760 |
71,774 |
| |
|
(c) |
Industrial securities |
22,223 |
28,045 |
42,460 |
| |
|
(d) |
Shares and debentures of subsidiaries |
41,233 |
66,951 |
95,565 |
| |
|
(e) |
Others |
2,481 |
3,143 |
6,942 |
M. |
43. |
Advance of income-tax |
|
|
|
| |
|
(net of tax provision) |
- |
- |
- |
N. |
Other assets |
15,555 |
22,699 |
25,664 |
| |
44. |
Immovable property |
2,280 |
3,219 |
4,029 |
| |
45. |
Intangible assets |
13,272 |
19,464 |
21,536 |
| |
46. |
Miscellaneous non-current assets |
3 |
16 |
99 |
O. |
Cash and bank balances |
79,155 |
1,09,089 |
1,07,152 |
| |
47. |
Fixed deposits with banks |
57,033 |
79,259 |
78,251 |
| |
48. |
Other bank balances |
18,938 |
25,518 |
25,055 |
| |
49. |
Cash in hand |
3,184 |
4,312 |
3,845 |
| |
50. |
Total (I to O) |
10,08,157 |
12,94,979 |
16,89,297 |
Statement 5: Sources and Uses of funds of the select 3,114 Public Limited Companies, 2006-07 and 2007-08 |
(Rs. crore) |
Sources of funds |
2006-07 |
2007-08 |
1 |
2 |
3 |
Internal Sources |
1,04,250 |
1,55,319 |
A. |
1. |
Paid-up capital |
2,029 |
1,497 |
B. |
Reserves and Surplus |
74,012 |
1,00,117 |
| |
2. |
Capital reserve |
58 |
-535 |
| |
3. |
Investment allowance reserve |
28 |
-169 |
| |
4. |
Sinking funds |
819 |
267 |
| |
5. |
Other reserves |
73,109 |
1,00,554 |
C. |
Provisions |
28,209 |
53,705 |
| |
6. |
Depreciation |
27,554 |
33,823 |
| |
7. |
Taxation (net of advance of income tax) |
2,178 |
7,185 |
| |
8. |
Dividends |
-2,907 |
8,789 |
| |
9. |
Other current provisions |
-50 |
1,646 |
| |
10. |
Non-current provisions |
1,434 |
2,264 |
External Sources |
2,10,321 |
2,65,776 |
D. |
Paid-up capital |
44,137 |
71,329 |
| |
11. |
Net issues |
4,008 |
10,700 |
| |
12. |
Premium on shares |
40,129 |
60,629 |
E. |
13. |
Capital receipts |
795 |
689 |
F. |
Borrowings |
1,01,935 |
1,19,106 |
| |
14. |
Debentures |
-1,284 |
2,263 |
| |
15. |
Loans and advances |
1,02,756 |
1,09,286 |
| |
|
(a) |
From banks |
69,534 |
86,288 |
| |
|
(b) |
From other Indian financial institutions |
288 |
2,657 |
| |
|
(c) |
From foreign institutional agencies |
26,000 |
16,036 |
| |
|
(d) |
From Government and semi-Government bodies |
-439 |
-60 |
| |
|
(e) |
From companies |
2,681 |
2,993 |
| |
|
(f) |
From others |
4,693 |
1,372 |
| |
16. |
Deferred payments |
923 |
7,550 |
| |
17. |
Public deposits |
-459 |
8 |
G. |
Trade dues and other current liabilities |
63,453 |
74,652 |
| |
18. |
Sundry creditors |
33,956 |
41,525 |
| |
19. |
Acceptances |
1,581 |
5,883 |
| |
20. |
Liabilities to companies |
168 |
207 |
| |
21. |
Advances/ deposits from customers, agents, etc. |
14,140 |
17,206 |
| |
22. |
Interest accruded on loans |
-313 |
206 |
| |
23. |
Others |
13,921 |
9,626 |
H. |
24. |
Miscellaneous non-current liabilities |
- |
- |
| |
25. |
Total |
3,14,571 |
4,21,095 |
Note : This statement is derived from Statement 4. Figures have been adjusted for the changes consequent on amalgamation of companies and for revaluation, etc., wherever necessary.
— : Nil or negligible. |
Statement 5: Sources and Uses of funds of the select 3,114 Public Limited Companies, 2006-07 and 2007-08 (Concld.) |
(Rs. crore) |
Uses of funds |
2006-07 |
2007-08 |
1 |
2 |
3 |
I. |
Gross fixed assets |
1,09,888 |
1,62,753 |
| |
26. |
Land |
5,885 |
5,331 |
| |
27. |
Buildings |
9,890 |
13,382 |
| |
28. |
Plant and machinery |
63,625 |
81,065 |
| |
29. |
Capital work-in-progress |
22,878 |
54,522 |
| |
30. |
Furniture, fixtures and office equipments |
4,802 |
2,586 |
| |
31. |
Others |
2,808 |
5,866 |
J. |
Inventories |
38,096 |
49,773 |
| |
32. |
Raw materials, components, etc. |
11,967 |
17,945 |
| |
33. |
Finished goods |
7,996 |
11,604 |
| |
34. |
Work-in-progress |
8,955 |
12,256 |
| |
35. |
Stores and spares |
1,728 |
3,262 |
| |
36. |
Others |
7,450 |
4,706 |
K. |
Loans and advances and other debtor balances |
79,312 |
1,25,878 |
| |
37. |
Sundry debtors |
29,518 |
35,918 |
| |
38. |
Loans and advances |
38,526 |
75,740 |
| |
|
a) |
To subsidiaries and companies under the same management |
12,396 |
16,779 |
| |
|
b) |
Others |
26,131 |
58,961 |
| |
39. |
Interest accrued on loans and advances |
791 |
1,305 |
| |
40. |
Deposits/ balances with Government/ others |
6,511 |
7,364 |
| |
41. |
Others |
3,965 |
5,551 |
L. |
42. |
Investments |
49,929 |
81,602 |
M |
43. |
Other assets |
7,346 |
3,027 |
N. |
44. |
Cash and bank balances |
30,000 |
-1,938 |
| |
45. |
Total |
3,14,571 |
4,21,095 |
Statement 6: Earnings / Expenditure in Foreign Currencies of select 3,114 Public Limited Companies, 2005-06 to 2007-08 |
(Rs. crore) |
Item |
2005-06 |
2006-07 |
2007-08 |
1 |
2 |
3 |
4 |
I. |
Expenditure in foreign currencies |
2,21,678 |
2,97,784 |
3,89,251 |
| |
(a) |
Imports (on c.i.f. basis) |
1,85,932 |
2,49,426 |
3,16,889 |
| |
|
of which, |
|
|
|
| |
|
i) Raw materials |
1,47,763 |
1,96,598 |
2,46,233 |
| |
|
ii) Capital goods |
17,985 |
25,510 |
38,832 |
| |
|
iii) Stores and spares |
6,279 |
9,808 |
10,243 |
| |
(b) |
Other expenditure in foreign currencies |
35,745 |
48,358 |
72,362 |
II. |
Earnings in foreign currencies |
1,87,296 |
2,65,916 |
3,25,169 |
| |
of which, |
|
|
|
| |
Exports (on f.o.b. basis) |
1,40,319 |
2,02,787 |
2,50,841 |
III. |
Net inflow (+) / outflow (-) in foreign currencies |
-34,381 |
-31,868 |
-64,082 |
Statement 7: Growth rates of the select items of the select 3,114 Public Limited Companies – according to size of Sales, 2006-07 and 2007-08 |
(Per cent) |
Sales range |
Less than Rs. 25 crore (872) |
Rs. 25 crore - Rs 50 crore (397) |
Rs. 50 crore - Rs. 100 crore (462) |
Item |
2006-07 |
2007-08 |
2006-07 |
2007-08 |
2006-07 |
2007-08 |
1 |
2 |
3 |
4 |
5 |
6 |
7 |
1. |
Sales+ |
2.6 |
-2.4 |
11.9 |
9.6 |
16.9 |
9.6 |
2. |
Value of production |
5.0 |
0.3 |
13.7 |
10.2 |
17.1 |
12.8 |
3. |
Total Income |
6.9 |
11.7 |
11.6 |
10.3 |
18.9 |
14.7 |
4. |
Manufacturing expenses |
6.7 |
4.3 |
12.5 |
10.8 |
17.9 |
15.2 |
5. |
Remuneration to employees |
2.1 |
15.0 |
10.5 |
15.1 |
17.7 |
16.0 |
6. |
Depreciation provision |
-23.8 |
0.3 |
-6.3 |
7.9 |
12.9 |
14.9 |
7. |
Gross profits |
# |
36.8 |
63.0 |
-1.5 |
24.5 |
12.0 |
8. |
Interest |
-10.5 |
10.7 |
3.5 |
24.5 |
7.6 |
20.3 |
9. |
Operating profits |
# |
85.4 |
# |
-42.8 |
34.3 |
8.0 |
10. |
Non-operating surplus/deficit |
-5.6 |
109.3 |
-64.5 |
75.2 |
117.5 |
32.2 |
11. |
Profits before tax |
363.0 |
102.0 |
40.5 |
-14.7 |
44.5 |
12.5 |
12. |
Tax provision |
47.0 |
39.6 |
24.5 |
25.1 |
36.1 |
13.4 |
13. |
Profits after tax |
# |
134.3 |
52.9 |
-39.7 |
48.0 |
12.1 |
14. |
Dividend paid |
58.5 |
17.3 |
29.6 |
7.4 |
16.3 |
22.4 |
15. |
Profits retained |
# |
180.8 |
69.8 |
-65.6 |
57.4 |
9.9 |
16. |
Gross saving |
38.3 |
66.8 |
7.0 |
-12.5 |
34.9 |
12.0 |
17. |
(a) |
Gross value added |
19.7 |
13.0 |
20.8 |
8.8 |
20.5 |
14.5 |
| |
(b) |
Net value added |
49.8 |
17.4 |
30.6 |
9.1 |
22.1 |
14.4 |
18. |
Net worth @ |
25.1 |
39.5 |
24.2 |
23.1 |
30.5 |
31.3 |
19. |
Total borrowings @ |
8.4 |
1.8 |
9.9 |
15.6 |
19.6 |
17.7 |
| |
of which, from banks @ |
13.8 |
1.8 |
12.6 |
12.1 |
29.4 |
15.7 |
20. |
Trade dues and other |
|
|
|
|
|
|
| |
current liabilities @ |
6.1 |
12.8 |
17.9 |
24.8 |
56.7 |
-4.1 |
21. |
(a) |
Gross fixed assets @ |
8.6 |
5.0 |
8.2 |
11.7 |
13.5 |
15.2 |
| |
(b) |
Net fixed assets @ |
10.2 |
6.7 |
6.7 |
13.3 |
16.8 |
18.6 |
22. |
Inventories @ |
10.4 |
21.3 |
25.3 |
16.0 |
25.6 |
32.4 |
23. |
(a) |
Gross physical assets @ |
8.8 |
7.2 |
10.9 |
12.5 |
16.1 |
19.1 |
| |
(b) |
Net physical assets @ |
10.2 |
9.6 |
11.1 |
14.0 |
19.6 |
23.2 |
24. |
(a) |
Total gross assets @ |
11.8 |
15.6 |
14.6 |
17.5 |
26.8 |
15.2 |
| |
(b) |
Total net assets @ |
13.5 |
19.1 |
15.7 |
19.7 |
32.0 |
16.4 |
25. |
Total earnings in |
|
|
|
|
|
|
| |
foreign currencies |
10.3 |
-13.4 |
19.0 |
4.8 |
11.4 |
4.8 |
| |
of which, Exports |
8.0 |
-22.3 |
17.4 |
-0.6 |
14.8 |
6.5 |
26. |
Total expenditure in |
|
|
|
|
|
|
| |
foreign currencies |
-8.1 |
4.7 |
18.1 |
17.8 |
-17.1 |
6.8 |
| |
of which, Imports |
-3.6 |
-0.7 |
18.5 |
20.8 |
-18.4 |
10.3 |
+ : Net of ‘rebates and discounts’ and ‘excise duty and cess’.
@ : Adjusted for revaluation, etc.
— : Numerator is negative or nil or negligible.
# : Denominator is negative or nil or negligible.
& : Both numerator and denominator are negative or nil or negligible.
Note : 1. Figures in brackets below the sales range represent the number of companies in the sales range.
2. Rates of growth of all the items are adjusted for changes due to amalgamation of companies. |
Statement 7: Growth rates of the select items of the select 3,114 Public Limited Companies – according to size of Sales, 2006-07 and 2007-08 (Concld.) |
(Per cent) |
Sales range |
Rs. 100 crore - Rs 500 crore (910) |
Rs. 500 crore - Rs. 1000 crore (226) |
Rs. 1000 crore and above (247) |
Item |
2006-07 |
2007-08 |
2006-07 |
2007-08 |
2006-07 |
2007-08 |
1 |
8 |
9 |
10 |
11 |
12 |
13 |
1. |
Sales+ |
22.3 |
17.2 |
24.4 |
17.8 |
30.4 |
19.9 |
2. |
Value of production |
22.6 |
18.0 |
26.1 |
18.6 |
29.8 |
19.9 |
3. |
Total Income |
22.9 |
18.6 |
26.4 |
18.7 |
29.6 |
21.6 |
4. |
Manufacturing expenses |
23.6 |
18.5 |
27.1 |
16.5 |
27.9 |
20.1 |
5. |
Remuneration to employees |
20.2 |
21.9 |
19.4 |
26.3 |
33.4 |
22.6 |
6. |
Depreciation provision |
17.8 |
19.8 |
13.4 |
20.1 |
16.5 |
14.5 |
7. |
Gross profits |
37.7 |
17.3 |
43.1 |
26.5 |
48.8 |
26.7 |
8. |
Interest |
20.6 |
33.5 |
33.6 |
38.9 |
30.6 |
27.3 |
9. |
Operating profits |
44.3 |
12.0 |
45.6 |
23.5 |
52.0 |
26.6 |
10. |
Non-operating surplus/deficit |
-1.8 |
-1.0 |
52.4 |
14.8 |
-50.5 |
147.2 |
11. |
Profits before tax |
38.6 |
10.9 |
46.0 |
22.9 |
46.7 |
28.7 |
12. |
Tax provision |
29.8 |
25.2 |
47.4 |
25.9 |
43.0 |
25.0 |
13. |
Profits after tax |
41.9 |
6.1 |
45.5 |
21.9 |
47.9 |
29.9 |
14. |
Dividend paid |
15.6 |
14.2 |
17.3 |
12.3 |
12.4 |
23.6 |
15. |
Profits retained |
51.2 |
3.9 |
56.3 |
24.6 |
61.2 |
31.6 |
16. |
Gross saving |
36.3 |
10.0 |
38.1 |
23.0 |
44.1 |
26.3 |
17. |
(a) |
Gross value added |
26.8 |
18.7 |
28.7 |
26.2 |
36.8 |
23.9 |
| |
(b) |
Net value added |
28.6 |
18.5 |
31.7 |
27.2 |
41.0 |
25.5 |
18. |
Net worth @ |
35.5 |
31.0 |
30.3 |
31.6 |
26.7 |
32.1 |
19. |
Total borrowings @ |
25.7 |
29.2 |
34.8 |
26.0 |
35.6 |
30.2 |
| |
of which, from banks @ |
36.7 |
31.6 |
40.9 |
31.4 |
40.0 |
38.6 |
20. |
Trade dues and other |
|
|
|
|
|
|
| |
current liabilities @ |
19.6 |
22.9 |
38.9 |
30.8 |
33.0 |
31.4 |
21. |
(a) |
Gross fixed assets @ |
18.8 |
19.3 |
17.6 |
27.4 |
16.3 |
20.9 |
| |
(b) |
Net fixed assets @ |
22.7 |
23.0 |
19.9 |
33.7 |
18.8 |
24.9 |
22. |
Inventories @ |
20.5 |
26.4 |
50.2 |
32.5 |
27.2 |
29.3 |
23. |
(a) |
Gross physical assets @ |
19.1 |
20.8 |
23.6 |
28.5 |
17.9 |
22.2 |
| |
(b) |
Net physical assets @ |
22.1 |
24.0 |
27.5 |
33.4 |
20.6 |
25.9 |
24. |
(a) |
Total gross assets @ |
24.6 |
25.7 |
29.6 |
26.8 |
25.2 |
28.4 |
| |
(b) |
Total net assets @ |
27.5 |
28.4 |
33.1 |
29.1 |
28.5 |
31.6 |
25. |
Total earnings in |
|
|
|
|
|
|
| |
foreign currencies |
29.8 |
17.6 |
37.7 |
50.1 |
47.2 |
20.5 |
| |
of which, Exports |
27.9 |
19.3 |
39.6 |
60.2 |
51.1 |
20.9 |
26. |
Total expenditure in |
|
|
|
|
|
|
| |
foreign currencies |
27.7 |
14.9 |
40.9 |
45.5 |
36.1 |
31.2 |
| |
of which, Imports |
29.3 |
13.0 |
41.1 |
50.7 |
35.6 |
25.9 |
Statement 8: Select financial ratios of the select 3,114 Public Limited Companies – according to size of Sales,2005-06 to 2007-08 |
(Per cent) |
Sales range |
Less than Rs. 25 crore
(872) |
Rs. 25 crore - Rs. 50 crore (397) |
Rs. 50 crore - Rs. 100 crore (462) |
Item |
2005-06 |
2006-07 |
2007-08 |
2005-06 |
2006-07 |
2007-08 |
2005-06 |
2006-07 |
2007-08 |
1 |
2 |
3 |
4 |
5 |
6 |
7 |
8 |
9 |
10 |
A. |
Capital structure ratios |
|
|
|
|
|
|
|
|
|
1. |
Net fixed assets to total net assets |
41.4 |
41.0 |
36.7 |
45.3 |
41.7 |
39.5 |
39.2 |
34.9 |
35.7 |
2. |
Net worth to total net assets |
34.1 |
38.7 |
45.4 |
22.9 |
24.6 |
25.3 |
35.0 |
34.6 |
39.2 |
3. |
Debt to equity |
53.8 |
45.0 |
31.8 |
114.3 |
98.0 |
93.5 |
55.7 |
52.3 |
45.3 |
4. |
Debt to equity (equity adjus- ted For revaluation reserve) |
62.3 |
51.5 |
35.0 |
121.5 |
102.9 |
97.5 |
59.9 |
55.3 |
47.5 |
5. |
Short term bank borrowings to inventories |
110.5 |
103.6 |
91.1 |
108.9 |
97.5 |
88.5 |
72.2 |
65.5 |
56.8 |
6. |
Total outside liabilities to net worth |
193.0 |
158.3 |
120.2 |
335.9 |
306.2 |
294.7 |
185.9 |
189.1 |
155.3 |
B. |
Liquidity ratios |
|
|
|
|
|
|
|
|
|
7. |
Current assets to current liabilities * |
1.0 |
1.1 |
1.3 |
1.0 |
1.0 |
1.0 |
1.2 |
1.2 |
1.3 |
8. |
Quick assets to current liabilities |
46.6 |
49.4 |
57.6 |
44.7 |
46.5 |
45.4 |
53.0 |
63.1 |
51.2 |
9. |
Current assets to total net assets |
46.3 |
47.0 |
50.8 |
48.1 |
50.9 |
50.0 |
54.0 |
58.1 |
54.3 |
10. |
Sundry creditors to current assets |
24.2 |
20.9 |
18.6 |
25.8 |
24.8 |
26.1 |
24.9 |
20.6 |
22.0 |
11. |
Sundry creditors to net working capital |
# |
288.0 |
87.1 |
# |
# |
# |
150.3 |
107.2 |
102.6 |
C. |
Assets utilization and turnover ratios |
|
|
|
|
|
|
|
|
|
12. |
Sales to total net assets |
49.3 |
44.0 |
36.0 |
67.5 |
65.3 |
59.7 |
85.8 |
75.9 |
71.3 |
13. |
Sales to gross fixed assets |
69.4 |
64.4 |
59.7 |
93.1 |
96.3 |
94.4 |
124.8 |
127.9 |
121.1 |
14. |
Inventories to sales |
22.0 |
23.7 |
29.5 |
20.8 |
23.3 |
24.7 |
21.4 |
23.0 |
27.8 |
15. |
Sundry debtors to sales |
26.2 |
26.4 |
33.8 |
24.8 |
26.0 |
26.8 |
18.6 |
19.6 |
20.8 |
16. |
Exports to sales |
13.0 |
13.7 |
10.9 |
12.7 |
13.3 |
12.1 |
16.3 |
16.1 |
15.6 |
17. |
Gross value added to gross fixed assets |
14.8 |
16.0 |
17.2 |
19.7 |
22.0 |
21.4 |
28.3 |
29.9 |
29.6 |
18. |
Raw materials consumed to value of production |
51.4 |
51.0 |
51.6 |
49.9 |
50.1 |
50.6 |
54.7 |
54.3 |
53.5 |
D. |
Sources and uses of funds ratios @ |
|
|
|
|
|
|
|
|
|
19. |
Gross fixed assets formation to total uses of funds |
|
39.6 |
17.3 |
|
31.9 |
35.9 |
|
26.8 |
47.6 |
20. |
Gross capital formation to
total uses of funds |
|
47.0 |
28.5 |
|
50.9 |
46.9 |
|
40.3 |
77.5 |
21. |
External sources of funds to
total sources of funds |
|
69.9 |
68.7 |
|
71.1 |
85.5 |
|
76.2 |
60.0 |
22. |
Increase in bank borrowings to total external sources |
|
24.8 |
2.5 |
|
26.2 |
17.2 |
|
25.5 |
30.9 |
23. |
Gross savings to gross capital formation |
|
72.2 |
133.6 |
|
52.1 |
36.0 |
|
62.5 |
50.5 |
E. |
Profitability and profit allocation ratios |
|
|
|
|
|
|
|
|
|
24. |
Gross profits to total net assets |
0.5 |
3.1 |
3.5 |
4.2 |
5.9 |
4.9 |
8.1 |
7.7 |
7.3 |
25. |
Gross profits to sales |
0.9 |
7.0 |
9.8 |
6.2 |
9.0 |
8.1 |
9.5 |
10.1 |
10.3 |
26. |
Profits after tax to net worth |
- |
6.0 |
10.1 |
6.1 |
7.5 |
3.6 |
11.9 |
13.4 |
11.4 |
27. |
Tax provision to profits before tax |
107.5 |
34.1 |
23.6 |
43.6 |
38.6 |
56.6 |
29.0 |
27.3 |
27.5 |
28. |
Profits retained to profits after tax |
& |
71.6 |
85.8 |
58.1 |
64.5 |
36.8 |
77.1 |
82.0 |
80.3 |
29. |
Dividends to net worth |
1.4 |
1.7 |
1.4 |
2.5 |
2.6 |
2.3 |
2.7 |
2.4 |
2.2 |
30. |
Ordinary dividends to |
|
|
|
|
|
|
|
|
|
| |
ordinary paid-up capital |
1.8 |
2.7 |
3.0 |
3.1 |
3.9 |
3.8 |
6.5 |
7.1 |
8.2 |
* : Item B.7 is the actual ratio of current assets to current liabilities.
Note: 1. Figures in brackets below the sales range represent the number of companies in the sales range.
2. For footnotes, please refer to statement 7. |
Statement 8: Select financial ratios of the select 3,114 Public Limited Companies – according to size of Sales, 2005-06 to 2007-08 (Concld.) |
(Per cent) |
Sales range |
Rs. 100 crore -Rs. 500 crore (910) |
Rs. 500 crore-Rs. 1000 crore (226) |
Rs. 1000 crore and above (247) |
Item |
2005-06 |
2006-07 |
2007-08 |
2005-06 |
2006-07 |
2007-08 |
2005-06 |
2006-07 |
2007-08 |
1 |
|
11 |
12 |
13 |
14 |
15 |
16 |
17 |
18 |
19 |
A. |
Capital structure ratios |
|
|
|
|
|
|
|
|
|
1. |
Net fixed assets to total net assets |
38.2 |
36.9 |
35.7 |
43.1 |
39.1 |
41.1 |
44.1 |
40.8 |
38.9 |
2. |
Net worth to total net assets |
37.1 |
39.4 |
40.5 |
37.1 |
36.6 |
37.8 |
45.5 |
44.7 |
45.0 |
3. |
Debt to equity |
56.6 |
52.4 |
51.2 |
64.0 |
65.8 |
59.0 |
39.7 |
43.0 |
40.2 |
4. |
Debt to equity (equity adjusted for revaluation reserve) |
59.0 |
54.4 |
53.4 |
65.7 |
67.8 |
62.0 |
42.0 |
44.8 |
41.6 |
5. |
Short term bank borrowings to inventories |
71.6 |
77.0 |
78.5 |
74.8 |
65.5 |
68.4 |
76.8 |
80.0 |
91.5 |
6. |
Total outside liabilities to net worth |
169.7 |
154.1 |
146.9 |
169.7 |
173.5 |
164.3 |
119.7 |
123.7 |
122.2 |
B. |
Liquidity ratios |
|
|
|
|
|
|
|
|
|
7. |
Current assets to current liabilities * |
1.2 |
1.3 |
1.3 |
1.3 |
1.3 |
1.3 |
1.2 |
1.3 |
1.3 |
8. |
Quick assets to current liabilities |
59.2 |
60.5 |
58.6 |
69.0 |
59.8 |
55.7 |
59.0 |
62.4 |
52.5 |
9. |
Current assets to total net assets |
51.1 |
50.8 |
50.5 |
51.9 |
50.5 |
50.2 |
44.5 |
47.0 |
46.8 |
10. |
Sundry creditors to current assets |
26.0 |
24.5 |
22.9 |
25.7 |
28.2 |
29.1 |
27.6 |
26.2 |
25.1 |
11. |
Sundry creditors to net working capital |
141.3 |
112.5 |
94.9 |
103.2 |
125.0 |
136.5 |
144.6 |
107.7 |
113.7 |
C. |
Assets utilization and turnover ratios |
|
|
|
|
|
|
|
|
|
12. |
Sales to total net assets |
86.2 |
82.5 |
74.9 |
90.0 |
83.8 |
75.7 |
85.1 |
86.5 |
78.6 |
13. |
Sales to gross fixed assets |
139.9 |
143.4 |
139.2 |
141.0 |
147.9 |
134.3 |
125.7 |
140.1 |
137.5 |
14. |
Inventories to sales |
18.4 |
18.1 |
19.5 |
16.0 |
19.4 |
21.8 |
14.2 |
13.9 |
15.0 |
15. |
Sundry debtors to sales |
19.0 |
19.1 |
20.0 |
18.3 |
17.8 |
18.7 |
12.7 |
12.1 |
12.5 |
16. |
Exports to sales |
14.8 |
15.5 |
15.7 |
12.8 |
14.4 |
19.6 |
17.7 |
20.5 |
20.6 |
17. |
Gross value added to gross fixed assets |
31.0 |
32.9 |
32.4 |
29.6 |
32.1 |
31.2 |
30.1 |
35.2 |
35.7 |
18. |
Raw materials consumed to value of production |
53.3 |
54.3 |
54.7 |
58.6 |
58.8 |
57.6 |
54.7 |
54.2 |
54.0 |
D. |
Sources and uses of funds ratios @ |
|
38.0 |
35.8 |
|
31.5 |
49.3 |
|
35.3 |
37.5 |
19. |
Gross fixed assets formation to total uses of funds |
|
|
|
|
|
|
|
|
|
20. |
Gross capital formation to total uses of funds |
|
48.7 |
48.5 |
|
51.7 |
66.1 |
|
45.9 |
47.8 |
21. |
External sources of funds to total sources of funds |
|
67.5 |
73.8 |
|
72.6 |
67.5 |
|
64.8 |
59.4 |
22. |
Increase in bank borrowings to total external sources |
|
38.0 |
31.4 |
|
36.8 |
36.5 |
|
31.6 |
32.9 |
23. |
Gross savings to gross capital formation |
|
65.3 |
55.4 |
|
54.8 |
44.9 |
|
92.4 |
79.3 |
E. |
Profitability and profit allocation ratios |
|
|
|
|
|
|
|
|
|
24. |
Gross profits to total net assets |
8.9 |
9.6 |
8.7 |
9.3 |
9.9 |
9.6 |
11.6 |
13.4 |
12.9 |
25. |
Gross profits to sales |
10.3 |
11.6 |
11.6 |
10.3 |
11.8 |
12.7 |
13.6 |
15.5 |
16.4 |
26. |
Profits after tax to net worth |
14.4 |
15.0 |
12.0 |
15.8 |
17.4 |
15.7 |
17.1 |
20.1 |
19.6 |
27. |
Tax provision to profits before tax |
26.8 |
25.1 |
28.3 |
26.1 |
26.4 |
27.0 |
25.1 |
24.4 |
23.7 |
28. |
Profits retained to profits after tax |
73.7 |
78.6 |
77.0 |
72.4 |
77.7 |
79.5 |
72.9 |
79.4 |
80.4 |
29. |
Dividends to net worth |
3.8 |
3.2 |
2.8 |
4.4 |
3.9 |
3.2 |
4.6 |
4.1 |
3.9 |
30. |
Ordinary dividends to ordinary paid-up capital |
13.9 |
14.6 |
15.3 |
24.4 |
25.4 |
26.1 |
39.2 |
41.0 |
49.0 |
Statement 9: Growth rates of the select items of the select 3,114 Public Limited Companies -according to size of Paid-up capital, 2006-07 and 2007-08 |
(Per cent) |
PUC range |
Less than Rs. 1 crore (178) |
Rs. 1 crore -2 crore (182) |
Rs. 2 crore -5 crore (683) |
Rs. 5 crore -10 crore (665) |
Item |
2006-07 |
2007-08 |
2006-07 |
2007-08 |
2006-07 |
2007-08 |
2006-07 |
2007-08 |
1 |
2 |
3 |
4 |
5 |
6 |
7 |
8 |
9 |
1. |
Sales+ |
11.8 |
4.2 |
12.8 |
12.5 |
17.3 |
14.1 |
23.6 |
18.2 |
2. |
Value of production |
11.5 |
5.9 |
15.2 |
12.2 |
17.6 |
15.5 |
25.1 |
16.7 |
3. |
Total Income |
8.6 |
8.6 |
14.9 |
14.4 |
18.6 |
15.6 |
25.3 |
16.9 |
4. |
Manufacturing expenses |
10.9 |
-0.5 |
15.5 |
11.5 |
20.1 |
16.0 |
26.0 |
16.0 |
5. |
Remuneration to employees |
16.3 |
9.3 |
12.0 |
18.3 |
10.9 |
19.0 |
30.7 |
21.0 |
6. |
Depreciation provision |
-50.2 |
8.2 |
13.7 |
14.4 |
16.0 |
13.3 |
18.0 |
14.0 |
7. |
Gross profits |
43.9 |
35.3 |
20.6 |
19.4 |
14.9 |
23.0 |
32.5 |
21.8 |
8. |
Interest |
26.6 |
87.5 |
25.5 |
18.9 |
23.0 |
30.1 |
13.2 |
32.6 |
9. |
Operating profits |
48.0 |
24.8 |
19.3 |
19.5 |
12.1 |
20.2 |
39.0 |
18.8 |
10. |
Non-operating surplus/deficit |
-80.7 |
161.4 |
-45.9 |
405.1 |
73.4 |
-39.0 |
28.5 |
41.7 |
11. |
Profits before tax |
18.4 |
29.9 |
10.0 |
46.5 |
19.2 |
10.3 |
38.0 |
20.9 |
12. |
Tax provision |
46.3 |
31.1 |
24.1 |
19.8 |
15.1 |
28.3 |
33.6 |
24.5 |
13. |
Profits after tax |
6.8 |
29.3 |
4.7 |
58.5 |
20.9 |
3.2 |
39.8 |
19.5 |
14. |
Dividend paid |
34.2 |
-13.7 |
-32.6 |
62.8 |
3.9 |
2.0 |
3.7 |
42.5 |
15. |
Profits retained |
5.4 |
32.1 |
18.8 |
57.5 |
26.4 |
3.6 |
49.8 |
15.0 |
16. |
Gross saving |
-10.2 |
28.4 |
17.0 |
43.1 |
21.7 |
7.8 |
36.9 |
14.7 |
17. |
(a) |
Gross value added |
22.0 |
25.0 |
16.6 |
16.4 |
13.7 |
19.4 |
28.6 |
20.5 |
| |
(b) |
Net value added |
35.3 |
26.2 |
17.0 |
16.7 |
133 |
20.5 |
30.4 |
21.5 |
18. |
Net worth @ |
43.4 |
41.0 |
15.2 |
18.8 |
16.1 |
13.7 |
25.4 |
23.2 |
19. |
Total borrowings @ |
22.0 |
50.1 |
24.3 |
10.7 |
21.7 |
25.5 |
19.7 |
20.5 |
| |
of which, from banks @ |
10.3 |
19.7 |
33.6 |
12.4 |
24.0 |
21.9 |
23.6 |
22.5 |
20. |
Trade dues and other current liabilities @ |
9.5 |
27.3 |
38.1 |
24.3 |
22.4 |
19.1 |
26.3 |
15.6 |
21. |
(a) |
Gross fixed assets @ |
10.0 |
13.3 |
14.4 |
12.0 |
11.8 |
13.1 |
15.5 |
16.7 |
| |
(b) |
Net fixed assets @ |
9.6 |
15.6 |
17.2 |
14.7 |
14.0 |
15.0 |
19.5 |
19.8 |
22. |
Inventories @ |
5.0 |
23.2 |
52.7 |
17.1 |
19.3 |
22.7 |
28.6 |
18.6 |
23. |
(a) |
Gross physical assets @ |
8.4 |
16.4 |
24.9 |
13.7 |
13.7 |
15.6 |
18.9 |
17.2 |
| |
(b) |
Net physical assets @ |
7.5 |
19.0 |
30.9 |
15.8 |
16.0 |
17.9 |
22.9 |
19.4 |
24. |
(a) |
Total gross assets @ |
21.2 |
35.4 |
20.2 |
17.5 |
17.0 |
17.2 |
20.8 |
18.8 |
| |
(b) |
Total net assets @ |
23.0 |
39.2 |
22.4 |
19.4 |
19.2 |
18.9 |
23.5 |
20.3 |
25. |
Total earnings in foreign currencies |
-18.0 |
5.2 |
-0.8 |
25.1 |
28.2 |
6.2 |
19.2 |
17.8 |
| |
of which, Exports |
0.6 |
2.9 |
-0.9 |
25.1 |
30.5 |
6.8 |
16.4 |
15.2 |
26. |
Total expenditure in foreign currencies |
8.6 |
35.3 |
29.6 |
1.5 |
21.2 |
24.4 |
11.9 |
21.8 |
| |
of which, Imports |
4.5 |
16.7 |
27.4 |
4.1 |
19.8 |
29.3 |
15.5 |
19.2 |
Note: 1. Figures in brackets below the PUC range represent the number of companies in the PUC range.
2.Rates of growth of all the items are adjusted for changes due to amalgamation of companies.
3. For foot notes, please refer to statement 7. |
Statement 9: Growth rates of the select items of the select 3,114 Public Limited Companies -according to size of Paid-up capital, 2006-07 and 2007-08 (Concld.) |
(Per cent) |
PUC range |
Rs. 10 crore -25 crore (792) |
Rs. 25 crore -50 crore (316) |
Rs. 50 crore -100 crore (156) |
(Rs. 100 crore and above 142) |
Item |
2006-07 |
2007-08 |
2006-07 |
2007-08 |
2006-07 |
2007-08 |
2006-07 |
2007-08 |
1 |
10 |
11 |
12 |
13 |
14 |
15 |
16 |
17 |
1. |
Sales+ |
29.1 |
20.3 |
26.0 |
20.3 |
26.3 |
20.0 |
29.7 |
17.6 |
2. |
Value of production |
29.0 |
22.1 |
26.0 |
21.5 |
26.5 |
21.8 |
29.2 |
16.7 |
3. |
Total Income |
28.5 |
22.6 |
26.8 |
21.8 |
26.5 |
22.4 |
28.9 |
19.4 |
4. |
Manufacturing expenses |
29.3 |
22.2 |
25.4 |
19.5 |
24.9 |
23.0 |
27.2 |
17.3 |
5. |
Remuneration to employees |
25.6 |
21.9 |
23.9 |
24.1 |
21.1 |
23.4 |
34.1 |
22.7 |
6. |
Depreciation provision |
19.3 |
25.2 |
26.8 |
20.1 |
10.1 |
22.7 |
12.4 |
10.5 |
7. |
Gross profits |
42.2 |
24.6 |
33.6 |
32.5 |
56.2 |
17.4 |
53.6 |
24.9 |
8. |
Interest |
34.6 |
37.3 |
27.1 |
38.1 |
27.4 |
27.9 |
23.5 |
21.4 |
9. |
Operating profits |
44.2 |
21.5 |
35.1 |
31.4 |
63.8 |
15.3 |
59.7 |
25.4 |
10. |
Non-operating surplus/deficit |
-53.8 |
129.3 |
182.2 |
-17.7 |
-14.9 |
60.8 |
-82.7 |
496.0 |
11. |
Profits before tax |
37.0 |
24.2 |
41.1 |
27.4 |
49.8 |
19.9 |
52.8 |
28.0 |
12. |
Tax provision |
37.7 |
26.8 |
40.8 |
39.0 |
52.0 |
29.1 |
42.3 |
18.4 |
13. |
Profits after tax |
36.7 |
23.2 |
41.2 |
23.3 |
49.0 |
16.7 |
56.3 |
31.0 |
14. |
Dividend paid |
22.8 |
5.5 |
19.2 |
13.1 |
18.8 |
20.7 |
10.4 |
26.5 |
15. |
Profits retained |
40.8 |
27.8 |
48.4 |
26.0 |
60.6 |
15.6 |
76.4 |
32.2 |
16. |
Gross saving |
32.9 |
26.9 |
40.5 |
24.0 |
40.5 |
17.8 |
48.3 |
25.0 |
17. |
(a) |
Gross value added |
32.5 |
24.0 |
28.0 |
28.5 |
36.9 |
18.8 |
37.0 |
22.0 |
| |
(b) |
Net value added |
34.7 |
23.9 |
28.2 |
30.0 |
42.5 |
18.2 |
43.2 |
24.3 |
18. |
Net worth @ |
33.5 |
32.7 |
31.2 |
29.9 |
34.6 |
30.3 |
25.7 |
34.5 |
19. |
Total borrowings @ |
40.2 |
27.8 |
34.3 |
22.8 |
31.0 |
24.9 |
30.5 |
32.2 |
| |
of which, from banks @ |
42.5 |
30.9 |
37.9 |
32.7 |
42.4 |
20.7 |
38.5 |
43.8 |
20. |
Trade dues and other current liabilities @ |
30.2 |
19.7 |
41.9 |
32.1 |
28.0 |
31.0 |
29.9 |
31.3 |
21. |
(a) |
Gross fixed assets @ |
26.3 |
22.6 |
26.0 |
23.5 |
19.2 |
21.1 |
11.4 |
20.3 |
| |
(b) |
Net fixed assets @ |
32.9 |
26.4 |
32.1 |
27.6 |
24.8 |
27.5 |
11.9 |
24.3 |
22. |
Inventories @ |
22.7 |
36.8 |
30.6 |
34.6 |
28.5 |
34.2 |
32.2 |
23.4 |
23. |
(a) |
Gross physical assets @ |
25.5 |
25.8 |
27.1 |
26.1 |
20.8 |
23.5 |
13.7 |
20.7 |
| |
(b) |
Net physical assets @ |
29.6 |
29.5 |
31.6 |
29.8 |
25.8 |
29.3 |
15.1 |
24.2 |
24. |
(a) |
Total gross assets @ |
31.0 |
25.8 |
30.8 |
26.1 |
26.1 |
25.3 |
22.6 |
29.6 |
| |
(b) |
Total net assets @ |
34.3 |
27.7 |
33.8 |
28.0 |
30.1 |
28.6 |
25.6 |
33.5 |
25. |
Total earnings in foreign currencies |
36.1 |
24.9 |
27.2 |
21.8 |
31.2 |
20.7 |
57.7 |
23.3 |
| |
of which, Exports |
33.6 |
27.2 |
24.0 |
24.0 |
31.8 |
14.7 |
67.8 |
26.3 |
26. |
Total expenditure in foreign currencies |
22.3 |
21.1 |
21.6 |
19.8 |
27.8 |
90.4 |
44.9 |
27.4 |
| |
of which, Imports |
19.7 |
20.8 |
19.5 |
21.1 |
39.1 |
51.6 |
44.0 |
26.9 |
Statement 10: Select financial ratios of the select 3,114 Public Limited Companies -according to size of Paid-up capital, 2005-06 to 2007-08 |
(Per cent) |
PUC range |
Less than Rs. 1 crore
(178) |
Rs. 1 crore - Rs. 2 crore
(182) |
Rs. 2 crore - Rs. 5 crore
(683) |
Item |
2005-06 |
2006-07 |
2007-08 |
2005-06 |
2006-07 |
2007-08 |
2005-06 |
2006-07 |
2007-08 |
1 |
2 |
3 |
4 |
5 |
6 |
7 |
8 |
9 |
10 |
A. |
Capital structure ratios |
|
|
|
|
|
|
|
|
|
1. |
Net fixed assets to total net assets |
23.8 |
21.2 |
17.6 |
32.9 |
31.6 |
30.5 |
35.0 |
33.6 |
32.5 |
2. |
Net worth to total net assets |
27.4 |
32.0 |
32.4 |
41.6 |
39.0 |
38.9 |
38.3 |
37.3 |
35.7 |
3. |
Debt to equity |
49.3 |
35.8 |
69.0 |
26.1 |
28.1 |
24.5 |
39.6 |
42.1 |
45.6 |
| |
Debt to equity (equity adjusted for |
|
|
|
|
|
|
|
|
|
| |
revaluation reserve) |
50.0 |
36.2 |
69.7 |
27.9 |
29.9 |
25.9 |
42.7 |
45.1 |
48.6 |
5. |
Short term bank borrowings to |
|
|
|
|
|
|
|
|
|
| |
inventories |
60.9 |
64.8 |
64.9 |
54.4 |
48.3 |
49.2 |
66.1 |
67.8 |
66.0 |
6. |
Total outside liabilities to net worth |
264.5 |
212.7 |
208.9 |
140.6 |
156.6 |
157.0 |
161.4 |
167.9 |
180.0 |
B. |
Liquidity ratios |
|
|
|
|
|
|
|
|
|
7. |
Current assets to current liabilities * |
1.1 |
1.3 |
1.5 |
1.3 |
1.3 |
1.2 |
1.3 |
1.3 |
1.3 |
8. |
Quick assets to current liabilities |
47.5 |
49.0 |
53.1 |
60.9 |
53.3 |
52.4 |
61.3 |
59.6 |
54.6 |
9. |
Current assets to total net assets |
66.9 |
71.9 |
65.9 |
59.6 |
62.9 |
62.7 |
59.9 |
59.4 |
60.0 |
10. |
Sundry creditors to current assets |
25.0 |
20.3 |
18.1 |
25.9 |
24.0 |
23.6 |
28.5 |
29.1 |
28.1 |
11. |
Sundry creditors to net working capital |
205.4 |
93.6 |
57.1 |
125.1 |
114.8 |
128.6 |
125.3 |
134.9 |
135.6 |
C. |
Assets utilization and turnover ratios |
|
|
|
|
|
|
|
|
|
12. |
Sales to total net assets |
117.1 |
106.5 |
79.7 |
138.9 |
127.7 |
120.0 |
122.5 |
120.4 |
115.3 |
13. |
Sales to gross fixed assets |
288.1 |
292.7 |
269.3 |
257.2 |
252.4 |
252.2 |
192.2 |
201.1 |
202.1 |
14. |
Inventories to sales |
17.1 |
16.1 |
19.0 |
14.7 |
19.9 |
20.8 |
17.3 |
17.6 |
18.9 |
15. |
Sundry debtors to sales |
13.5 |
13.0 |
14.8 |
14.5 |
14.6 |
16.2 |
16.7 |
16.9 |
16.7 |
16. |
Exports to sales |
13.9 |
12.5 |
12.4 |
15.3 |
13.4 |
15.0 |
12.5 |
14.0 |
13.1 |
17. |
Gross value added to gross fixed assets |
69.7 |
77.3 |
85.3 |
42.4 |
43.1 |
44.6 |
33.3 |
33.8 |
35.5 |
18. |
Raw materials consumed to value of production |
49.4 |
49.3 |
45.0 |
65.6 |
66.1 |
65.0 |
62.3 |
64.0 |
64.6 |
D. |
Sources and uses of funds ratios @ |
|
|
|
|
|
|
|
|
|
19. |
Gross fixed assets formation to total uses of funds |
|
16.5 |
11.8 |
|
31.7 |
29.1 |
|
34.4 |
36.1 |
20. |
Gross capital formation to total uses of funds |
|
20.5 |
21.6 |
|
75.7 |
50.0 |
|
53.1 |
58.2 |
21. |
External sources of funds to total sources of funds |
|
44.5 |
63.7 |
|
69.6 |
47.6 |
|
63.3 |
63.9 |
22. |
Increase in bank borrowings to total external sources |
|
19.9 |
14.5 |
|
36.1 |
25.1 |
|
37.1 |
34.9 |
23. |
Gross savings to gross capital formation |
|
277.7 |
167.5 |
|
48.9 |
101.7 |
|
76.4 |
63.2 |
E. |
Profitability and profit allocation ratios |
|
|
|
|
|
|
|
|
|
24. |
Gross profits to total net assets |
16.0 |
18.7 |
18.2 |
10.5 |
10.3 |
10.3 |
8.9 |
8.6 |
8.8 |
25. |
Gross profits to sales |
13.6 |
17.6 |
22.8 |
7.6 |
8.1 |
8.6 |
7.3 |
7.1 |
7.7 |
26. |
Profits after tax to net worth |
43.3 |
32.3 |
29.6 |
16.9 |
15.3 |
20.4 |
13.8 |
14.3 |
12.9 |
27. |
Tax provision to profits before tax |
29.3 |
36.2 |
36.5 |
27.4 |
30.9 |
25.2 |
29.3 |
28.2 |
32.9 |
28. |
Profits retained to profits after tax |
95.1 |
93.8 |
95.9 |
72.7 |
82.4 |
81.9 |
75.5 |
79.0 |
79.2 |
29. |
Dividends to net worth |
2.1 |
2.0 |
1.2 |
4.6 |
2.7 |
3.7 |
3.4 |
3.0 |
2.7 |
30. |
Ordinary dividends to ordinary paid-up capital |
25.9 |
34.6 |
45.1 |
33.1 |
21.6 |
38.2 |
16.3 |
16.8 |
17.1 |
* : Item B7 is the actual ratio of current assets to current liabilities.
Notes : 1. Figures in brackets below the PUC Range represents the number of companies in the PUC Range. 2. For footnotes, please refer to statement 7. |
Statement 10: Select financial ratios of the select 3,114 Public Limited Companies -according to size of Paid-up capital, 2005-06 to 2007-08(Contd.) |
(Per cent) |
PUC range |
Rs. 5 crore - Rs. 10 crore
(665) |
Rs.10 crore - Rs. 25 crore (792) |
Rs. 25 crore - Rs. 50 crore
(316) |
Item |
2005-06 |
2006-07 |
2007-08 |
2005-06 |
2006-07 |
2007-08 |
2005-06 |
2006-07 |
2007-08 |
1 |
11 |
12 |
13 |
14 |
15 |
16 |
17 |
18 |
19 |
A. |
Capital structure ratios |
|
|
|
|
|
|
|
|
|
1. |
Net fixed assets to total net assets |
33.6 |
32.8 |
32.9 |
36.0 |
35.9 |
36.0 |
34.8 |
34.5 |
34.4 |
2. |
Net worth to total net assets |
36.4 |
37.2 |
38.4 |
38.3 |
38.2 |
40.2 |
40.6 |
40.0 |
40.6 |
3. |
Debt to equity |
41.2 |
40.5 |
38.2 |
47.6 |
50.3 |
44.1 |
47.6 |
47.7 |
44.2 |
4. |
Debt to equity (equity adjusted for revaluation reserve) |
43.2 |
42.3 |
39.9 |
48.9 |
51.7 |
45.9 |
48.8 |
48.8 |
45.0 |
5. |
Short term bank borrowings to inventories |
70.8 |
64.1 |
67.9 |
72.2 |
81.8 |
84.2 |
68.8 |
74.1 |
68.4 |
6. |
Total outside liabilities to net worth |
174.7 |
168.5 |
160.6 |
161.3 |
161.6 |
148.8 |
146.3 |
150.1 |
146.3 |
B. |
Liquidity ratios |
|
|
|
|
|
|
|
|
|
7. |
Current assets to current liabilities * |
1.3 |
1.3 |
1.3 |
1.3 |
1.3 |
1.3 |
1.3 |
1.3 |
1.3 |
8. |
Quick assets to current liabilities |
63.5 |
61.4 |
60.3 |
67.1 |
66.8 |
60.2 |
70.7 |
68.2 |
58.9 |
9. |
Current assets to total net assets |
61.7 |
61.5 |
61.3 |
56.7 |
55.6 |
53.9 |
53.7 |
54.0 |
52.9 |
10. |
Sundry creditors to current assets |
28.0 |
28.4 |
26.7 |
26.6 |
24.4 |
25.3 |
25.7 |
27.1 |
27.6 |
11. |
Sundry creditors to net working capital |
129.7 |
124.6 |
112.5 |
112.3 |
101.4 |
112.0 |
99.2 |
109.5 |
123.8 |
C. |
Assets utilization and turnover ratios |
|
|
|
|
|
|
|
|
|
12. |
Sales to total net assets |
120.2 |
119.8 |
117.3 |
100.9 |
96.8 |
90.5 |
91.2 |
85.5 |
80.4 |
13. |
Sales to gross fixed assets |
207.1 |
219.7 |
220.8 |
177.9 |
180.6 |
174.3 |
170.1 |
168.7 |
164.3 |
14. |
Inventories to sales |
17.2 |
17.9 |
18.0 |
16.7 |
15.9 |
18.0 |
17.5 |
18.1 |
20.2 |
15. |
Sundry debtors to sales |
18.7 |
18.0 |
18.5 |
18.9 |
18.3 |
18.8 |
17.5 |
17.9 |
17.9 |
16. |
Exports to sales |
15.7 |
14.8 |
14.4 |
14.7 |
15.2 |
16.1 |
18.3 |
18.0 |
18.6 |
17. |
Gross value added to gross fixed assets |
36.6 |
40.4 |
41.4 |
37.8 |
39.4 |
39.2 |
36.5 |
36.8 |
38.3 |
18. |
Raw materials consumed to value of production |
61.1 |
62.5 |
61.3 |
58.2 |
58.5 |
57.8 |
58.0 |
58.2 |
56.0 |
D. |
Sources and uses of funds ratios @ |
|
|
|
|
|
|
|
|
|
19. |
Gross fixed assets formation to total uses of funds |
|
34.7 |
39.7 |
|
40.0 |
40.0 |
|
38.1 |
39.2 |
20. |
Gross capital formation to total uses of funds |
|
57.5 |
57.2 |
|
50.2 |
58.6 |
|
51.4 |
56.8 |
21. |
External sources of funds to total sources of funds |
|
60.4 |
55.6 |
|
68.4 |
64.3 |
|
73.3 |
68.6 |
22. |
Increase in bank borrowings to total external sources |
|
34.4 |
40.1 |
|
36.0 |
36.2 |
|
27.4 |
31.2 |
23. |
Gross savings to gross capital formation |
|
70.5 |
74.2 |
|
58.8 |
58.5 |
|
58.1 |
58.6 |
E. |
Profitability and profit allocation ratios |
|
|
|
|
|
|
|
|
|
24. |
Gross profits to total net assets |
9.9 |
10.5 |
10.6 |
10.7 |
11.3 |
10.9 |
10.3 |
10.2 |
10.6 |
25. |
Gross profits to sales |
8.2 |
8.8 |
9.1 |
10.6 |
11.7 |
12.1 |
11.3 |
12.0 |
13.2 |
26. |
Profits after tax to net worth |
16.0 |
17.6 |
16.9 |
17.7 |
18.0 |
16.4 |
16.1 |
17.2 |
16.3 |
27. |
Tax provision to profits before tax |
28.9 |
28.0 |
28.8 |
25.5 |
25.6 |
26.1 |
25.8 |
25.8 |
28.1 |
28. |
Profits retained to profits after tax |
78.1 |
83.8 |
80.7 |
77.4 |
79.7 |
82.6 |
75.3 |
79.2 |
80.9 |
29. |
Dividends to net worth |
3.5 |
2.9 |
3.3 |
4.0 |
3.7 |
2.9 |
4.0 |
3.6 |
3.1 |
30. |
Ordinary dividends to ordinary paid-up capital |
16.2 |
16.1 |
22.3 |
23.0 |
25.7 |
25.8 |
30.8 |
34.0 |
36.1 |
Statement 10: Select financial ratios of the select 3,114 Public Limited Companies -according to size of Paid-up capital, 2005-06 to 2007-08 (Concld.) |
(Per cent) |
PUC range |
Rs. 50 crore - Rs. 100 crore (156) |
Rs. 100 crore and above
(142) |
Item |
2005-06 |
2006-07 |
2007-08 |
2005-06 |
2006-07 |
2007-08 |
1 |
20 |
21 |
22 |
23 |
24 |
25 |
A. |
Capital structure ratios |
|
|
|
|
|
|
1. |
Net fixed assets to total net assets |
39.5 |
38.1 |
38.6 |
50.6 |
45.1 |
42.1 |
2. |
Net worth to total net assets |
40.1 |
41.4 |
42.6 |
45.6 |
45.3 |
45.8 |
3. |
Debt to equity |
51.8 |
51.4 |
49.7 |
44.9 |
47.4 |
43.7 |
4. |
Debt to equity (equity adjusted for revaluation reserve) |
54.3 |
53.4 |
52.6 |
48.2 |
49.8 |
45.4 |
5. |
Short term bank borrowings to inventories |
72.3 |
71.5 |
65.8 |
88.6 |
84.2 |
108.5 |
6. |
Total outside liabilities to net worth |
149.4 |
141.8 |
134.8 |
119.3 |
120.6 |
118.4 |
B. |
Liquidity ratios |
|
|
|
|
|
|
7. |
Current assets to current liabilities * |
1.2 |
1.3 |
1.3 |
1.1 |
1.3 |
1.3 |
8. |
Quick assets to current liabilities |
62.6 |
65.8 |
61.4 |
50.1 |
54.3 |
46.0 |
9. |
Current assets to total net assets |
47.8 |
49.1 |
48.1 |
38.1 |
41.2 |
42.2 |
10. |
Sundry creditors to current assets |
23.3 |
22.1 |
22.4 |
28.5 |
26.7 |
24.4 |
11. |
Sundry creditors to net working capital |
124.5 |
89.7 |
87.8 |
229.4 |
128.3 |
121.4 |
C. |
Assets utilization and turnover ratios |
|
|
|
|
|
|
12. |
Sales to total net assets |
77.7 |
75.6 |
69.6 |
72.1 |
74.6 |
65.6 |
13. |
Sales to gross fixed assets |
119.2 |
125.9 |
121.8 |
95.1 |
109.9 |
106.3 |
14. |
Inventories to sales |
17.7 |
18.0 |
20.2 |
13.1 |
13.4 |
14.0 |
15. |
Sundry debtors to sales |
17.0 |
16.6 |
16.9 |
10.7 |
9.9 |
10.6 |
16. |
Exports to sales |
13.0 |
13.5 |
12.9 |
17.9 |
23.2 |
24.9 |
17. |
Gross value added to gross fixed assets |
28.6 |
32.7 |
31.3 |
25.0 |
30.5 |
30.6 |
18. |
Raw materials consumed to value of production |
46.3 |
45.9 |
46.7 |
52.5 |
51.7 |
52.4 |
D. |
Sources and uses of funds ratios @ |
|
|
|
|
|
|
19. |
Gross fixed assets formation to total uses of funds |
|
38.1 |
41.1 |
|
30.6 |
38.0 |
20. |
Gross capital formation to total uses of funds |
|
50.1 |
56.2 |
|
41.4 |
44.4 |
21. |
External sources of funds to total sources of funds |
|
69.3 |
66.9 |
|
63.7 |
60.7 |
22. |
Increase in bank borrowings to total external sources |
|
35.1 |
20.8 |
|
33.7 |
34.6 |
23. |
Gross savings to gross capital formation |
|
69.8 |
60.1 |
|
109.3 |
79.1 |
E. |
Profitability and profit allocation ratios |
|
|
|
|
|
|
24. |
Gross profits to total net assets |
9.5 |
11.4 |
10.3 |
10.7 |
13.1 |
12.2 |
25. |
Gross profits to sales |
12.2 |
15.1 |
14.7 |
14.8 |
17.5 |
18.6 |
26. |
Profits after tax to net worth |
17.0 |
18.9 |
16.4 |
15.3 |
19.2 |
18.6 |
27. |
Tax provision to profits before tax |
25.3 |
25.7 |
27.7 |
25.3 |
23.5 |
21.8 |
28. |
Profits retained to profits after tax |
72.3 |
77.9 |
77.1 |
69.5 |
78.5 |
79.2 |
29. |
Dividends to net worth |
4.7 |
4.2 |
3.8 |
4.7 |
4.1 |
3.9 |
30. |
Ordinary dividends to ordinary paid-up capital |
28.8 |
31.9 |
35.1 |
25.9 |
26.0 |
31.1 |
Statement 11: Growth rates of the select items of the select 3,114 Public Limited Companies –
Industry wise, 2006-07 and 2007-08 |
(Per cent) |
Industry/Industry group |
Tea Plantations (28) |
Mining and Quarrying (39) |
Food Products and Beverages (231) |
Sugar (49) |
Item |
2006-07 |
2007-08 |
2006-07 |
2007-08 |
2006-07 |
2007-08 |
2006-07 |
2007-08 |
1 |
2 |
3 |
4 |
5 |
6 |
7 |
8 |
9 |
1. |
Sales+ |
11.0 |
6.7 |
23.7 |
20.2 |
23.6 |
19.7 |
27.2 |
-2.9 |
2. |
Value of production |
10.5 |
5.9 |
33.5 |
14.5 |
21.8 |
23.8 |
24.3 |
6.8 |
3. |
Total Income |
14.0 |
8.1 |
32.9 |
16.0 |
21.8 |
25.2 |
26.2 |
10.8 |
4. |
Manufacturing expenses |
10.5 |
19.0 |
44.5 |
0.5 |
22.2 |
27.5 |
29.2 |
18.3 |
5. |
Remuneration to employees |
2.1 |
-5.4 |
12.8 |
15.9 |
16.0 |
28.5 |
20.6 |
27.9 |
6. |
Depreciation provision |
-2.7 |
-11.4 |
21.7 |
-3.7 |
5.3 |
28.1 |
31.7 |
51.1 |
7. |
Gross profits |
36.0 |
2.6 |
81.7 |
62.3 |
32.5 |
-5.7 |
8.2 |
-67.8 |
8. |
Interest |
52.0 |
39.6 |
17.2 |
93.2 |
22.9 |
44.4 |
16.3 |
48.1 |
9. |
Operating profits |
31.7 |
-9.0 |
89.9 |
59.9 |
36.4 |
-23.9 |
5.5 |
— |
10. |
Non-operating surplus/deficit |
108.2 |
31.0 |
& |
& |
& |
# |
& |
# |
11. |
Profits before tax |
52.3 |
5.8 |
88.1 |
65.5 |
34.9 |
-8.7 |
15.5 |
-100.0 |
12. |
Tax provision |
-5.6 |
84.7 |
33.8 |
75.1 |
9.6 |
13.6 |
-7.2 |
-60.4 |
13. |
Profits after tax |
72.2 |
-9.1 |
135.5 |
60.7 |
45.9 |
-16.0 |
21.9 |
— |
14. |
Dividend paid |
24.6 |
119.3 |
43.9 |
21.7 |
12.0 |
0.1 |
20.1 |
-63.0 |
15. |
Profits retained |
104.7 |
-62.5 |
176.9 |
69.9 |
62.5 |
-21.4 |
22.2 |
— |
16. |
Gross saving |
72.0 |
-53.7 |
113.2 |
52.6 |
33.9 |
-1.9 |
25.1 |
-62.3 |
17. |
(a) |
Gross value added |
17.9 |
-9.4 |
63.8 |
51.4 |
22.6 |
8.2 |
12.5 |
-30.8 |
| |
(b) |
Net value added |
19.6 |
-9.3 |
72.1 |
59.1 |
26.3 |
4.6 |
9.9 |
-43.9 |
18. |
Net worth @ |
21.4 |
12.4 |
29.7 |
38.7 |
40.9 |
23.4 |
59.8 |
2.4 |
19. |
Total borrowings @ |
69.3 |
16.4 |
32.4 |
24.1 |
35.3 |
45.7 |
40.1 |
64.2 |
| |
of which, from banks @ |
125.4 |
-25.3 |
36.2 |
31.5 |
31.9 |
55.9 |
30.4 |
87.3 |
20. |
Trade dues and other current |
|
|
|
|
|
|
|
|
| |
liabilities @ |
10.6 |
16.2 |
154.6 |
71.7 |
26.3 |
36.4 |
27.2 |
46.4 |
21. |
(a) |
Gross fixed assets @ |
1.7 |
-11.6 |
-17.2 |
66.4 |
29.5 |
30.0 |
46.4 |
39.6 |
| |
(b) |
Net fixed assets @ |
-0.3 |
-11.6 |
-23.6 |
79.1 |
37.1 |
35.5 |
58.5 |
45.3 |
22. |
Inventories @ |
8.4 |
8.1 |
369.2 |
34.7 |
14.0 |
46.4 |
-0.9 |
32.5 |
23. |
(a) |
Gross physical assets @ |
2.8 |
-8.1 |
6.6 |
57.8 |
24.9 |
34.5 |
31.2 |
37.9 |
| |
(b) |
Net physical assets @ |
2.0 |
-6.1 |
4.5 |
65.0 |
28.1 |
39.3 |
34.5 |
41.5 |
24. |
(a) |
Total gross assets @ |
26.0 |
13.0 |
41.9 |
35.3 |
30.8 |
32.3 |
39.5 |
34.6 |
| |
(b) |
Total net assets @ |
30.5 |
17.1 |
43.9 |
36.6 |
34.2 |
35.0 |
43.7 |
36.6 |
25. |
Total earnings in foreign currencies |
8.1 |
14.8 |
81.2 |
197.8 |
47.7 |
36.5 |
235.2 |
22.9 |
| |
of which, Exports |
16.0 |
-4.8 |
107.6 |
220.5 |
48.4 |
36.2 |
259.9 |
24.5 |
26. |
Total expenditure in foreign currencies |
5.5 |
19.2 |
139.6 |
97.6 |
-4.0 |
38.8 |
-35.3 |
-0.8 |
| |
of which, Imports |
3.9 |
22.7 |
149.5 |
100.6 |
-14.0 |
46.9 |
-73.8 |
91.0 |
Notes : 1. Figures in brackets below the industry name represent the number of companies in the industry.
2. Rates of growth of all the items are adjusted for changes due to amalgamation of companies.
3. Industry group ‘Sugar’ is subgroup of ‘Food Products and Beverages’.
4. For footnotes, please refer to statement 7. |
Statement 11: Growth rates of the select items of the select 3,114 Public Limited Companies – Industry wise, 2006-07 and 2007-08 (Contd.) |
(Per cent) |
Industry/Industry group |
Edible Oils and Oil Cakes (58) |
Cotton Textiles (151) |
Man-made Textiles (62) |
Apparel (40) |
Item |
2006-07 |
2007-08 |
2006-07 |
2007-08 |
2006-07 |
2007-08 |
2006-07 |
2007-08 |
1 |
10 |
11 |
12 |
13 |
14 |
15 |
16 |
17 |
1. |
Sales+ |
19.7 |
31.1 |
18.5 |
12.7 |
6.5 |
18.1 |
34.9 |
25.4 |
2. |
Value of production |
19.1 |
33.6 |
19.6 |
13.7 |
6.4 |
19.0 |
41.8 |
24.9 |
3. |
Total Income |
17.3 |
33.3 |
19.7 |
14.7 |
6.7 |
19.2 |
42.8 |
27.1 |
4. |
Manufacturing expenses |
17.2 |
33.3 |
20.8 |
19.1 |
5.1 |
18.6 |
41.1 |
24.7 |
5. |
Remuneration to employees |
3.6 |
25.2 |
20.8 |
16.7 |
6.8 |
13.2 |
47.2 |
25.6 |
6. |
Depreciation provision |
-46.6 |
8.6 |
17.5 |
14.5 |
29.8 |
9.8 |
44.1 |
31.0 |
7. |
Gross profits |
189.0 |
60.7 |
14.2 |
-16.4 |
18.8 |
55.7 |
48.8 |
25.3 |
8. |
Interest |
28.5 |
40.4 |
14.6 |
40.1 |
40.7 |
47.4 |
92.4 |
72.3 |
9. |
Operating profits |
# |
69.4 |
13.8 |
-62.6 |
-15.7 |
77.5 |
39.4 |
11.3 |
10. |
Non-operating surplus/deficit |
— |
& |
-50.9 |
303.2 |
-24.9 |
-24.2 |
& |
# |
11. |
Profits before tax |
67.2 |
70.9 |
10.8 |
-55.1 |
-19.9 |
34.5 |
35.9 |
15.7 |
12. |
Tax provision |
90.7 |
98.1 |
10.8 |
-28.8 |
33.3 |
10.8 |
37.7 |
39.7 |
13. |
Profits after tax |
62.0 |
63.8 |
10.7 |
-63.8 |
-30.9 |
44.0 |
35.2 |
6.5 |
14. |
Dividend paid |
17.8 |
16.1 |
-8.3 |
-29.1 |
0.7 |
-12.4 |
30.4 |
-4.8 |
15. |
Profits retained |
74.8 |
73.0 |
16.0 |
-71.3 |
-42.0 |
78.2 |
36.1 |
8.5 |
16. |
Gross saving |
-3.5 |
50.1 |
17.0 |
-15.0 |
4.9 |
23.0 |
38.7 |
16.2 |
17. |
(a) |
Gross value added |
44.1 |
44.9 |
16.9 |
1.2 |
15.4 |
25.9 |
50.3 |
30.3 |
| |
(b) |
Net value added |
121.1 |
52.3 |
16.7 |
-4.0 |
9.3 |
34.1 |
51.0 |
30.2 |
18. |
Net worth @ |
46.2 |
52.0 |
20.4 |
3.5 |
9.2 |
11.7 |
43.8 |
23.8 |
19. |
Total borrowings @ |
11.6 |
61.9 |
30.6 |
26.4 |
39.3 |
40.9 |
68.6 |
43.1 |
| |
of which, from banks @ |
-3.1 |
57.7 |
44.6 |
31.8 |
58.7 |
48.1 |
71.4 |
51.7 |
20. |
Trade dues and other current |
|
|
|
|
|
|
|
|
| |
liabilities @ |
18.0 |
74.0 |
27.0 |
11.4 |
22.8 |
27.7 |
-21.1 |
42.1 |
21. |
(a) |
Gross fixed assets @ |
9.5 |
37.5 |
27.2 |
16.5 |
19.8 |
17.9 |
44.9 |
22.5 |
| |
(b) |
Net fixed assets @ |
10.6 |
50.9 |
34.4 |
19.7 |
27.8 |
27.1 |
52.2 |
20.0 |
22. |
Inventories @ |
25.9 |
81.8 |
14.8 |
17.2 |
15.0 |
24.3 |
66.8 |
44.1 |
23. |
(a) |
Gross physical assets @ |
16.0 |
56.5 |
24.7 |
16.7 |
19.2 |
18.7 |
54.9 |
33.1 |
| |
(b) |
Net physical assets @ |
18.5 |
67.8 |
28.7 |
19.1 |
25.2 |
26.6 |
60.2 |
33.7 |
24. |
(a) |
Total gross assets @ |
19.7 |
57.2 |
23.9 |
16.1 |
22.2 |
23.7 |
33.6 |
33.4 |
| |
(b) |
Total net assets @ |
21.9 |
64.2 |
26.4 |
17.7 |
27.5 |
30.8 |
34.2 |
33.8 |
25. |
Total earnings in foreign currencies |
47.2 |
66.4 |
27.5 |
21.2 |
25.1 |
26.6 |
23.5 |
4.4 |
| |
of which, Exports |
45.9 |
69.5 |
27.3 |
22.2 |
35.1 |
32.1 |
26.6 |
4.0 |
26. |
Total expenditure in foreign currencies |
-9.4 |
56.9 |
46.6 |
-4.5 |
-5.3 |
5.2 |
16.8 |
-10.8 |
| |
of which, Imports |
-16.3 |
61.3 |
45.0 |
-5.7 |
-5.8 |
3.4 |
15.0 |
-16.0 |
Note : Industry group ‘Edible Oils and Oil Cakes’ is subgroup of ‘Food Products and Beverages’. |
Statement 11: Growth rates of the select items of the select 3,114 Public Limited Companies – Industry wise, 2006-07 and 2007-08 (Contd.) |
(Per cent) |
Industry/Industry group |
Paper and Paper Products (62) |
Chemicals and Chemical Products (416) |
Basic Chemicals (60) |
Chemical Fertilizers and Pesticides (49) |
Item |
2006-07 |
2007-08 |
2006-07 |
2007-08 |
2006-07 |
2007-08 |
2006-07 |
2007-08 |
1 |
18 |
19 |
20 |
21 |
22 |
23 |
24 |
25 |
1. |
Sales+ |
11.3 |
11.3 |
17.3 |
12.2 |
20.6 |
8.9 |
9.0 |
11.5 |
2. |
Value of production |
12.2 |
11.8 |
17.6 |
11.7 |
19.4 |
9.5 |
7.6 |
11.0 |
3. |
Total Income |
11.4 |
12.6 |
17.4 |
13.3 |
16.8 |
12.3 |
10.2 |
12.2 |
4. |
Manufacturing expenses |
12.4 |
13.6 |
16.1 |
12.5 |
16.4 |
14.6 |
7.6 |
11.7 |
5. |
Remuneration to employees |
7.6 |
11.1 |
14.7 |
18.3 |
5.6 |
20.7 |
8.7 |
20.8 |
6. |
Depreciation provision |
9.9 |
11.7 |
5.8 |
11.0 |
12.0 |
5.4 |
11.9 |
-1.2 |
7. |
Gross profits |
21.6 |
11.8 |
31.5 |
11.2 |
40.1 |
-11.4 |
6.5 |
16.9 |
8. |
Interest |
4.4 |
30.2 |
13.8 |
11.0 |
5.7 |
-0.5 |
17.2 |
-1.0 |
9. |
Operating profits |
29.7 |
4.9 |
35.7 |
11.3 |
54.5 |
-14.5 |
3.2 |
23.2 |
10. |
Non-operating surplus/deficit |
— |
& |
48.5 |
51.0 |
& |
# |
326.4 |
-2.9 |
11. |
Profits before tax |
14.2 |
7.3 |
36.8 |
15.0 |
42.8 |
7.2 |
29.4 |
16.2 |
12. |
Tax provision |
26.2 |
10.8 |
24.8 |
18.4 |
32.0 |
8.2 |
22.0 |
18.7 |
13. |
Profits after tax |
11.9 |
6.6 |
41.2 |
13.9 |
45.9 |
6.9 |
32.7 |
15.3 |
14. |
Dividend paid |
12.9 |
8.3 |
13.9 |
17.5 |
10.5 |
17.7 |
-11.3 |
54.6 |
15. |
Profits retained |
11.7 |
6.1 |
56.3 |
12.5 |
51.4 |
5.7 |
56.5 |
3.2 |
16. |
Gross saving |
10.8 |
8.9 |
34.3 |
12.0 |
33.8 |
5.6 |
34.9 |
1.4 |
17. |
(a) |
Gross value added |
14.1 |
10.7 |
21.7 |
13.3 |
27.1 |
-3.3 |
7.1 |
13.8 |
| |
(b) |
Net value added |
15.4 |
10.5 |
25.2 |
13.7 |
31.7 |
-5.5 |
5.8 |
17.9 |
18. |
Net worth @ |
14.0 |
20.2 |
21.3 |
22.2 |
25.8 |
23.0 |
13.7 |
21.5 |
19. |
Total borrowings @ |
34.9 |
18.1 |
20.4 |
11.3 |
7.6 |
8.4 |
15.3 |
2.9 |
| |
of which, from banks @ |
33.7 |
31.0 |
23.6 |
21.9 |
26.0 |
11.9 |
19.1 |
28.6 |
20. |
Trade dues and other current |
|
|
|
|
|
|
|
|
| |
liabilities @ |
9.6 |
7.9 |
11.6 |
12.9 |
7.8 |
5.3 |
-8.7 |
27.9 |
21. |
(a) |
Gross fixed assets @ |
13.9 |
13.9 |
14.2 |
11.9 |
12.9 |
9.8 |
7.7 |
6.4 |
| |
(b) |
Net fixed assets @ |
18.5 |
15.5 |
14.6 |
12.2 |
12.2 |
9.7 |
4.8 |
3.5 |
22. |
Inventories @ |
14.4 |
17.9 |
14.6 |
15.4 |
4.9 |
24.5 |
7.7 |
13.3 |
23. |
(a) |
Gross physical assets @ |
14.0 |
14.4 |
14.3 |
12.6 |
12.0 |
11.4 |
7.7 |
7.5 |
| |
(b) |
Net physical assets @ |
17.9 |
15.9 |
14.6 |
13.1 |
11.0 |
12.0 |
5.6 |
6.2 |
24. |
(a) |
Total gross assets @ |
17.4 |
15.3 |
17.6 |
15.6 |
15.5 |
13.5 |
9.4 |
13.7 |
| |
(b) |
Total net assets @ |
21.6 |
16.7 |
18.5 |
16.7 |
15.9 |
14.7 |
8.9 |
15.0 |
25. |
Total earnings in foreign currencies |
5.6 |
7.8 |
23.1 |
14.3 |
24.7 |
1.6 |
-11.9 |
20.0 |
| |
of which, Exports |
9.3 |
9.4 |
19.1 |
14.7 |
10.3 |
-1.0 |
-14.5 |
19.5 |
26. |
Total expenditure in foreign currencies |
10.0 |
22.6 |
31.8 |
15.8 |
294.4 |
19.8 |
9.5 |
19.1 |
| |
of which, Imports |
9.4 |
22.2 |
32.0 |
15.3 |
371.2 |
22.0 |
5.3 |
15.9 |
Note : Industry groups viz., ‘Basic Chemicals’ and ‘Chemical Fertilizers and Pesticides’ are subgroups of ‘Chemicals and Chemical Products’. |
Statement 11: Growth rates of the select items of the select 3,114 Public Limited Companies – Industry wise, 2006-07 and 2007-08 (Contd.) |
(Per cent) |
Industry/Industry group |
Paints and Varnishes (21) |
Pharmaceuticals and Medicines (147) |
Rubber and Plastic Products (147) |
Tyres and Tubes
(15) |
Item |
2006-07 |
2007-08 |
2006-07 |
2007-08 |
2006-07 |
2007-08 |
2006-07 |
2007-08 |
1 |
26 |
27 |
28 |
29 |
30 |
31 |
32 |
33 |
1. |
Sales+ |
20.7 |
10.5 |
26.1 |
14.9 |
25.8 |
16.7 |
27.7 |
10.0 |
2. |
Value of production |
21.6 |
9.6 |
26.9 |
14.2 |
25.8 |
17.4 |
27.4 |
10.6 |
3. |
Total Income |
27.1 |
4.0 |
25.4 |
17.3 |
24.6 |
17.8 |
26.4 |
10.3 |
4. |
Manufacturing expenses |
26.3 |
6.5 |
22.8 |
17.0 |
24.8 |
15.6 |
25.1 |
8.7 |
5. |
Remuneration to employees |
11.0 |
8.7 |
19.2 |
21.6 |
14.0 |
20.0 |
15.0 |
14.6 |
6. |
Depreciation provision |
-27.3 |
-4.9 |
18.3 |
22.8 |
11.1 |
11.8 |
17.2 |
12.5 |
7. |
Gross profits |
24.8 |
36.1 |
59.8 |
9.4 |
70.4 |
35.3 |
82.1 |
21.5 |
8. |
Interest |
-12.5 |
-5.9 |
33.2 |
21.7 |
18.5 |
20.0 |
17.4 |
10.5 |
9. |
Operating profits |
35.1 |
43.7 |
63.2 |
8.1 |
111.7 |
42.0 |
117.7 |
24.8 |
10. |
Non-operating surplus/deficit |
# |
— |
-87.5 |
# |
— |
# |
— |
& |
11. |
Profits before tax |
101.0 |
-12.6 |
48.7 |
15.3 |
63.8 |
51.5 |
93.5 |
22.3 |
12. |
Tax provision |
54.6 |
-14.1 |
35.1 |
23.2 |
56.5 |
50.4 |
90.9 |
29.7 |
13. |
Profits after tax |
136.5 |
-11.8 |
52.8 |
13.2 |
67.0 |
51.9 |
94.6 |
19.1 |
14. |
Dividend paid |
38.2 |
-19.2 |
16.4 |
11.3 |
-13.1 |
12.2 |
49.5 |
0.4 |
15. |
Profits retained |
362.9 |
-6.8 |
74.3 |
13.9 |
134.8 |
64.3 |
108.5 |
23.3 |
16. |
Gross saving |
76.6 |
-6.2 |
56.6 |
16.0 |
48.1 |
36.7 |
53.4 |
18.3 |
17. |
(a) |
Gross value added |
7.6 |
24.1 |
41.6 |
14.4 |
36.6 |
26.5 |
42.0 |
18.1 |
| |
(b) |
Net value added |
16.0 |
28.5 |
45.0 |
13.4 |
45.1 |
30.3 |
48.8 |
19.3 |
18. |
Net worth @ |
19.6 |
11.6 |
27.7 |
22.2 |
14.6 |
28.7 |
17.4 |
12.2 |
19. |
Total borrowings @ |
18.6 |
7.1 |
31.6 |
16.9 |
7.8 |
19.1 |
2.9 |
2.0 |
| |
of which, from banks @ |
32.2 |
3.5 |
12.6 |
31.9 |
17.8 |
16.4 |
12.8 |
3.9 |
20. |
Trade dues and other current |
|
|
|
|
|
|
|
|
| |
liabilities @ |
16.3 |
16.9 |
22.1 |
10.1 |
25.2 |
15.7 |
24.0 |
10.9 |
21. |
(a) |
Gross fixed assets @ |
9.7 |
14.2 |
21.4 |
18.5 |
12.3 |
11.4 |
10.9 |
8.0 |
| |
(b) |
Net fixed assets @ |
7.3 |
20.1 |
22.6 |
18.3 |
12.5 |
13.0 |
9.5 |
7.2 |
22. |
Inventories @ |
16.8 |
11.4 |
20.0 |
14.3 |
19.0 |
25.6 |
16.3 |
22.0 |
23. |
(a) |
Gross physical assets @ |
11.7 |
13.4 |
21.0 |
17.3 |
13.4 |
13.9 |
11.8 |
10.6 |
| |
(b) |
Net physical assets @ |
11.5 |
16.0 |
21.7 |
17.0 |
14.2 |
16.3 |
11.4 |
11.4 |
24. |
(a) |
Total gross assets @ |
16.0 |
11.3 |
26.5 |
18.9 |
13.4 |
19.5 |
13.2 |
9.1 |
| |
(b) |
Total net assets @ |
17.1 |
11.9 |
27.6 |
19.0 |
13.8 |
22.9 |
13.4 |
9.1 |
25. |
Total earnings in foreign currencies |
13.7 |
15.4 |
37.3 |
14.9 |
42.7 |
4.7 |
52.9 |
2.2 |
| |
of which, Exports |
13.9 |
15.4 |
33.6 |
16.3 |
43.7 |
4.7 |
53.2 |
2.4 |
26. |
Total expenditure in foreign currencies |
20.9 |
17.3 |
16.4 |
19.7 |
26.3 |
14.7 |
24.9 |
10.8 |
| |
of which, Imports |
17.0 |
16.7 |
20.0 |
20.5 |
27.7 |
17.0 |
23.6 |
13.5 |
Note : 1. Industry groups viz., ‘Paints and varnishes’ and ‘Pharmaceuticals and Medicines’ are subgroups of ‘Chemicals and Chemical Products’. 2, Industry group ‘Tyres and Tubes’ is subgroup of ‘Rubber and Plastic Products’. |
Statement 11: Growth rates of the select items of the select 3,114 Public Limited Companies – Industry wise, 2006-07 and 2007-08 (Contd.) |
(Per cent) |
Industry/Industry group |
Plastic Products
(106) |
Ceramics
(36) |
Cement
and Cement
Products (42) |
Iron and Steel
(135) |
Item |
2006-07 |
2007-08 |
2006-07 |
2007-08 |
2006-07 |
2007-08 |
2006-07 |
2007-08 |
1 |
34 |
35 |
36 |
37 |
38 |
39 |
40 |
41 |
1. |
Sales+ |
24.5 |
26.7 |
22.6 |
15.9 |
36.0 |
21.9 |
30.4 |
20.8 |
2. |
Value of production |
25.1 |
27.5 |
22.7 |
13.2 |
36.7 |
22.7 |
29.1 |
22.1 |
3. |
Total Income |
23.7 |
28.3 |
22.5 |
13.7 |
34.0 |
22.9 |
28.0 |
23.6 |
4. |
Manufacturing expenses |
25.4 |
25.5 |
25.7 |
14.7 |
17.5 |
18.3 |
27.6 |
23.0 |
5. |
Remuneration to employees |
14.6 |
30.3 |
23.1 |
23.8 |
20.4 |
28.7 |
19.2 |
28.4 |
6. |
Depreciation provision |
6.0 |
9.5 |
16.9 |
6.9 |
28.8 |
17.0 |
17.7 |
14.5 |
7. |
Gross profits |
64.6 |
51.3 |
10.1 |
13.4 |
131.9 |
34.4 |
53.1 |
28.5 |
8. |
Interest |
19.0 |
25.3 |
21.3 |
28.7 |
6.1 |
16.7 |
22.4 |
33.0 |
9. |
Operating profits |
116.3 |
67.6 |
4.4 |
4.5 |
178.6 |
36.9 |
64.7 |
27.2 |
10. |
Non-operating surplus/deficit |
— |
# |
& |
& |
-66.3 |
-13.8 |
— |
# |
11. |
Profits before tax |
44.4 |
92.8 |
3.1 |
7.8 |
124.4 |
35.2 |
45.6 |
30.9 |
12. |
Tax provision |
31.2 |
86.0 |
11.8 |
14.8 |
177.0 |
33.0 |
49.2 |
16.6 |
13. |
Profits after tax |
49.9 |
95.3 |
-0.5 |
4.5 |
109.2 |
36.1 |
44.1 |
37.0 |
14. |
Dividend paid |
-24.0 |
9.8 |
18.0 |
-4.4 |
60.9 |
32.5 |
27.3 |
28.2 |
15. |
Profits retained |
171.9 |
134.7 |
-4.3 |
6.8 |
120.6 |
36.7 |
48.5 |
38.9 |
16. |
Gross saving |
40.9 |
60.4 |
6.6 |
6.9 |
84.4 |
31.3 |
35.8 |
30.2 |
17. |
(a) |
Gross value added |
34.1 |
37.8 |
14.8 |
15.4 |
87.8 |
29.7 |
39.3 |
26.6 |
| |
(b) |
Net value added |
46.2 |
46.7 |
14.3 |
17.5 |
104.9 |
32.0 |
44.9 |
29.1 |
18. |
Net worth @ |
13.2 |
47.2 |
26.8 |
24.3 |
39.4 |
41.0 |
31.2 |
61.5 |
19. |
Total borrowings @ |
10.6 |
32.3 |
15.2 |
5.5 |
19.9 |
23.8 |
33.5 |
36.2 |
| |
of which, from banks @ |
19.0 |
25.8 |
32.6 |
3.5 |
39.3 |
46.2 |
18.9 |
40.4 |
20. |
Trade dues and other current |
|
|
|
|
|
|
|
|
| |
liabilities @ |
25.8 |
20.4 |
19.8 |
13.2 |
22.3 |
48.6 |
27.9 |
24.4 |
21. |
(a) |
Gross fixed assets @ |
13.5 |
14.6 |
13.3 |
12.9 |
22.7 |
27.9 |
16.9 |
21.6 |
| |
(b) |
Net fixed assets @ |
15.0 |
18.4 |
13.0 |
13.4 |
28.9 |
36.6 |
16.6 |
23.8 |
22. |
Inventories @ |
22.7 |
30.2 |
25.4 |
11.4 |
11.5 |
31.0 |
21.2 |
33.3 |
23. |
(a) |
Gross physical assets @ |
14.9 |
17.1 |
15.7 |
12.6 |
21.5 |
28.2 |
17.5 |
23.4 |
| |
(b) |
Net physical assets @ |
16.8 |
21.3 |
16.5 |
12.8 |
26.1 |
35.8 |
17.5 |
25.6 |
24. |
(a) |
Total gross assets @ |
13.7 |
29.6 |
18.2 |
13.2 |
23.1 |
30.1 |
28.8 |
37.8 |
| |
(b) |
Total net assets @ |
14.4 |
35.9 |
19.5 |
13.6 |
26.6 |
35.6 |
31.2 |
42.2 |
25. |
Total earnings in foreign currencies |
37.9 |
6.6 |
34.9 |
-11.3 |
17.9 |
-12.5 |
36.5 |
6.4 |
| |
of which, Exports |
38.2 |
6.2 |
34.0 |
-10.4 |
18.9 |
-13.2 |
38.1 |
5.0 |
26. |
Total expenditure in foreign currencies |
29.6 |
20.2 |
43.0 |
6.9 |
73.8 |
244.4 |
30.7 |
32.6 |
| |
of which, Imports |
34.8 |
21.0 |
47.2 |
5.9 |
78.6 |
52.3 |
24.0 |
29.7 |
Note : Industry group ‘Plastic Products’ is subgroup of ‘Rubber and plastic Products’. |
Statement 11: Growth rates of the select items of the select 3,114 Public Limited Companies – Industry wise, 2006-07 and 2007-08 (Contd.) |
(Per cent) |
Industry/Industry group |
Fabricated Metal Products (86) |
Machinery and Machine Tools (196) |
Electrical Machinery and Apparatus (112) |
Radio, Television & Communication Equip. & Apparatus (54) |
Item |
2006-07 |
2007-08 |
2006-07 |
2007-08 |
2006-07 |
2007-08 |
2006-07 |
2007-08 |
1 |
42 |
43 |
44 |
45 |
46 |
47 |
48 |
49 |
1. |
Sales+ |
26.1 |
23.5 |
27.7 |
20.6 |
36.9 |
29.4 |
27.8 |
3.5 |
2. |
Value of production |
26.4 |
23.9 |
28.2 |
21.5 |
36.5 |
29.4 |
31.6 |
-0.6 |
3. |
Total Income |
26.0 |
25.6 |
28.7 |
21.6 |
36.8 |
28.2 |
37.5 |
-1.9 |
4. |
Manufacturing expenses |
25.7 |
24.6 |
29.3 |
21.5 |
39.4 |
28.4 |
37.8 |
-2.5 |
5. |
Remuneration to employees |
13.9 |
26.9 |
21.4 |
18.7 |
22.7 |
25.1 |
6.3 |
-4.1 |
6. |
Depreciation provision |
17.7 |
15.1 |
13.7 |
19.5 |
12.8 |
14.9 |
12.9 |
10.3 |
7. |
Gross profits |
48.2 |
24.4 |
42.7 |
22.9 |
47.5 |
38.8 |
82.7 |
11.8 |
8. |
Interest |
21.0 |
31.3 |
13.5 |
35.3 |
36.7 |
38.7 |
-9.4 |
32.2 |
9. |
Operating profits |
56.4 |
22.7 |
46.5 |
21.6 |
49.1 |
38.8 |
# |
-1.1 |
10. |
Non-operating surplus/deficit |
— |
# |
47.6 |
29.4 |
79.2 |
-72.3 |
# |
-90.9 |
11. |
Profits before tax |
46.9 |
35.3 |
46.6 |
22.3 |
50.6 |
32.1 |
# |
-39.9 |
12. |
Tax provision |
61.1 |
17.4 |
39.7 |
27.8 |
59.0 |
44.4 |
96.4 |
14.5 |
13. |
Profits after tax |
41.6 |
42.8 |
50.0 |
19.7 |
47.9 |
27.8 |
# |
-51.1 |
14. |
Dividend paid |
34.8 |
17.0 |
10.9 |
20.9 |
25.5 |
21.4 |
35.3 |
15.0 |
15. |
Profits retained |
43.2 |
48.8 |
66.8 |
19.4 |
53.5 |
29.1 |
# |
-59.4 |
16. |
Gross saving |
33.7 |
37.7 |
46.2 |
19.5 |
43.9 |
26.5 |
# |
-35.7 |
17. |
(a) |
Gross value added |
34.0 |
22.9 |
30.0 |
20.9 |
36.2 |
33.7 |
34.8 |
5.5 |
| |
(b) |
Net value added |
37.3 |
24.2 |
32.8 |
21.1 |
38.9 |
35.5 |
41.1 |
4.4 |
18. |
Net worth @ |
39.0 |
35.1 |
23.9 |
21.3 |
31.6 |
48.0 |
16.1 |
16.9 |
19. |
Total borrowings @ |
23.5 |
8.7 |
14.9 |
34.8 |
31.2 |
40.9 |
19.3 |
9.7 |
| |
of which, from banks @ |
49.9 |
26.9 |
20.2 |
39.1 |
48.8 |
24.8 |
15.2 |
-22.5 |
20. |
Trade dues and other current |
|
|
|
|
|
|
|
|
| |
liabilities @ |
15.5 |
31.7 |
31.0 |
21.7 |
29.3 |
37.7 |
11.2 |
-1.5 |
21. |
(a) |
Gross fixed assets @ |
23.2 |
21.3 |
14.4 |
17.9 |
16.2 |
18.9 |
13.4 |
5.5 |
| |
(b) |
Net fixed assets @ |
27.7 |
24.9 |
16.4 |
23.2 |
21.4 |
24.6 |
14.2 |
10.5 |
22. |
Inventories @ |
19.6 |
35.3 |
22.9 |
24.9 |
30.7 |
26.2 |
41.9 |
-5.1 |
23. |
(a) |
Gross physical assets @ |
22.2 |
24.9 |
16.6 |
19.8 |
20.8 |
21.4 |
17.8 |
3.6 |
| |
(b) |
Net physical assets @ |
24.8 |
28.4 |
19.0 |
23.9 |
25.6 |
25.4 |
20.2 |
6.4 |
24. |
(a) |
Total gross assets @ |
25.4 |
22.8 |
21.7 |
22.2 |
27.0 |
38.2 |
15.9 |
7.5 |
| |
(b) |
Total net assets @ |
27.6 |
24.5 |
24.1 |
24.6 |
30.2 |
42.6 |
16.8 |
10.0 |
25. |
Total earnings in foreign currencies |
16.5 |
45.9 |
25.7 |
5.0 |
93.5 |
37.3 |
15.1 |
-2.8 |
| |
of which, Exports |
11.8 |
41.2 |
24.6 |
4.3 |
99.0 |
37.7 |
18.4 |
12.3 |
26. |
Total expenditure in foreign currencies |
27.5 |
57.8 |
29.9 |
19.1 |
14.3 |
33.2 |
54.6 |
-9.2 |
| |
of which, Imports |
31.3 |
53.4 |
26.0 |
19.0 |
13.0 |
30.8 |
43.7 |
-11.4 |
Statement 11: Growth rates of the select items of the select 3,114 Public Limited Companies – Industry wise, 2006-07 and 2007-08 (Contd.) |
(Per cent) |
Industry/Industry group |
Motor Vehicles and
Other Transport
Equipments
(138) |
Construction (95) |
Wholesale and Retail Trade (155) |
Hotels and Restaurants (58) |
Item |
2006-07 |
2007-08 |
2006-07 |
2007-08 |
2006-07 |
2007-08 |
2006-07 |
2007-08 |
1 |
50 |
51 |
52 |
53 |
54 |
55 |
56 |
57 |
1 |
Sales+ |
24.7 |
10.0 |
61.3 |
47.7 |
26.7 |
12.1 |
25.4 |
18.6 |
2 |
Value of production |
23.5 |
12.5 |
63.7 |
45.6 |
28.5 |
13.4 |
25.4 |
18.6 |
3 |
Total Income |
23.6 |
12.0 |
63.6 |
46.7 |
27.3 |
13.8 |
25.8 |
20.1 |
4 |
Manufacturing expenses |
25.9 |
10.2 |
53.4 |
46.7 |
27.7 |
10.6 |
19.2 |
17.5 |
5 |
Remuneration to employees |
19.7 |
15.8 |
79.4 |
57.5 |
33.5 |
34.4 |
15.6 |
26.5 |
6 |
Depreciation provision |
11.1 |
23.5 |
46.7 |
38.8 |
21.3 |
33.2 |
1.9 |
16.7 |
7 |
Gross profits |
28.3 |
4.4 |
144.5 |
49.8 |
22.8 |
16.0 |
46.0 |
21.8 |
8 |
Interest |
24.0 |
15.1 |
71.5 |
71.8 |
29.3 |
24.6 |
3.6 |
-4.4 |
9 |
Operating profits |
28.8 |
3.3 |
170.0 |
44.9 |
19.7 |
11.6 |
56.6 |
26.2 |
10 |
Non-operating surplus/deficit |
-59.9 |
-7.0 |
-72.8 |
251.5 |
105.1 |
237.0 |
-96.4 |
? |
11 |
Profits before tax |
16.8 |
2.8 |
151.0 |
46.7 |
22.8 |
25.0 |
47.4 |
24.7 |
12 |
Tax provision |
8.7 |
-5.7 |
192.6 |
49.2 |
7.9 |
38.6 |
66.9 |
33.2 |
13 |
Profits after tax |
20.4 |
6.3 |
138.4 |
45.8 |
30.6 |
19.1 |
39.6 |
20.7 |
14 |
Dividend paid |
9.0 |
-0.3 |
86.2 |
34.4 |
-35.0 |
21.6 |
17.4 |
20.4 |
15 |
Profits retained |
25.0 |
8.6 |
146.2 |
47.1 |
95.7 |
18.3 |
48.2 |
20.8 |
16 |
Gross saving |
20.4 |
13.2 |
118.4 |
45.5 |
65.1 |
22.8 |
32.7 |
19.8 |
17 |
(a) |
Gross value added |
18.4 |
13.2 |
102.6 |
49.2 |
37.8 |
28.0 |
31.8 |
21.1 |
| |
(b) |
Net value added |
19.6 |
11.6 |
108.9 |
50.0 |
39.8 |
27.4 |
36.2 |
21.6 |
18 |
Net worth @ |
25.2 |
20.9 |
84.2 |
63.3 |
30.2 |
22.6 |
18.4 |
21.9 |
19 |
Total borrowings @ |
39.1 |
28.7 |
119.6 |
46.2 |
73.1 |
31.7 |
3.2 |
31.5 |
| |
of which, from banks @ |
47.4 |
39.4 |
124.4 |
55.5 |
53.7 |
37.2 |
15.0 |
11.6 |
20 |
Trade dues and other current |
|
|
|
|
|
|
|
|
| |
liabilities @ |
15.9 |
32.1 |
66.0 |
49.9 |
31.8 |
29.2 |
14.8 |
27.2 |
21 |
(a) |
Gross fixed assets @ |
22.2 |
27.7 |
47.5 |
37.3 |
33.8 |
31.2 |
11.6 |
20.8 |
| |
(b) |
Net fixed assets @ |
32.2 |
39.2 |
57.6 |
39.5 |
37.7 |
32.5 |
12.4 |
23.0 |
22 |
Inventories @ |
19.1 |
26.7 |
111.7 |
51.9 |
49.4 |
44.9 |
2.8 |
22.1 |
23 |
(a) |
Gross physical assets @ |
21.5 |
27.5 |
81.4 |
46.2 |
40.5 |
37.4 |
11.4 |
20.8 |
| |
(b) |
Net physical assets @ |
27.8 |
35.3 |
90.9 |
47.9 |
43.7 |
39.1 |
12.2 |
23.0 |
24 |
(a) |
Total gross assets @ |
21.2 |
23.3 |
82.1 |
52.6 |
40.2 |
27.9 |
12.7 |
23.7 |
| |
(b) |
Total net assets @ |
23.9 |
26.0 |
86.2 |
53.7 |
41.2 |
27.9 |
13.5 |
25.8 |
25 |
Total earnings in foreign currencies |
21.7 |
11.3 |
58.1 |
70.0 |
16.3 |
37.0 |
29.3 |
12.0 |
| |
of which, Exports |
23.7 |
10.5 |
101.0 |
6.9 |
20.5 |
37.6 |
304.3 |
-22.1 |
26 |
Total expenditure in foreign currencies |
26.5 |
15.4 |
68.6 |
70.3 |
13.0 |
17.3 |
7.1 |
40.5 |
| |
of which, Imports |
25.0 |
17.6 |
54.7 |
39.0 |
15.3 |
16.4 |
104.1 |
69.5 |
Statement 11: Growth rates of the select items of the select 3,114 Public Limited Companies – Industry wise, 2006-07 and 2007-08 (Concld.) |
(Per cent) |
Industry / Industry group |
Transport,
Storage and
Communications (90) |
Real Estate Activities (32) |
Computer and
Related
Activities (178) |
All Industries (3114) |
Item |
2006-07 |
2007-08 |
2006-07 |
2007-08 |
2006-07 |
2007-08 |
2006-07 |
2007-08 |
1 |
58 |
59 |
60 |
61 |
62 |
63 |
64 |
65 |
1. |
Sales+s |
32.1 |
26.0 |
64.1 |
41.7 |
39.8 |
23.9 |
27.3 |
18.6 |
2. |
Value of production |
32.1 |
26.2 |
49.2 |
47.0 |
39.8 |
23.8 |
27.2 |
18.9 |
3. |
Total Income |
34.0 |
27.8 |
35.0 |
51.8 |
40.4 |
26.0 |
27.2 |
20.3 |
4. |
Manufacturing expenses |
48.4 |
22.8 |
26.2 |
48.6 |
41.7 |
39.5 |
26.3 |
18.9 |
5. |
Remuneration to employees |
47.7 |
32.6 |
35.5 |
58.6 |
41.2 |
20.9 |
27.3 |
22.4 |
6. |
Depreciation provision |
17.4 |
20.3 |
41.8 |
30.9 |
17.5 |
21.2 |
14.8 |
15.7 |
7. |
Gross profits |
18.8 |
68.4 |
134.1 |
45.3 |
51.1 |
25.2 |
46.6 |
24.9 |
8. |
Interest |
60.0 |
39.8 |
58.8 |
45.3 |
48.6 |
89.1 |
25.8 |
29.4 |
9. |
Operating profits |
-61.1 |
296.7 |
170.6 |
45.4 |
51.2 |
23.9 |
51.5 |
24.1 |
10 |
Non-operating surplus/deficit |
47.8 |
23.4 |
-72.2 |
232.6 |
58.4 |
59.1 |
-21.4 |
65.2 |
11 |
Profits before tax |
-11.9 |
89.6 |
40.9 |
65.1 |
51.3 |
24.6 |
46.0 |
25.7 |
12 |
Tax provision |
-9.7 |
1.6 |
184.0 |
58.1 |
10.4 |
75.6 |
41.3 |
25.0 |
13 |
Profits after tax |
-14.3 |
190.0 |
22.0 |
67.2 |
60.1 |
17.1 |
47.6 |
26.0 |
14 |
Dividend paid |
11.0 |
5.5 |
84.3 |
51.2 |
-12.9 |
50.4 |
13.7 |
21.0 |
15 |
Profits retained |
— |
# |
15.8 |
69.8 |
116.1 |
6.7 |
60.3 |
27.3 |
16 |
Gross saving |
13.4 |
42.2 |
18.0 |
65.8 |
85.2 |
9.6 |
41.7 |
23.5 |
17 |
(a) |
Gross value added |
21.4 |
36.7 |
95.0 |
41.0 |
42.2 |
21.2 |
33.3 |
22.8 |
| |
(b) |
Net value added |
24.9 |
50.4 |
98.5 |
41.5 |
44.0 |
21.2 |
37.2 |
24.1 |
18 |
Net worth @ |
15.3 |
21.1 |
187.1 |
107.4 |
45.3 |
23.6 |
28.5 |
31.9 |
19 |
Total borrowings @ |
35.5 |
48.1 |
42.2 |
22.5 |
77.1 |
143.7 |
31.8 |
28.2 |
| |
of which, from banks @ |
53.7 |
36.5 |
51.5 |
18.0 |
26.6 |
156.7 |
37.9 |
34.1 |
20 |
Trade dues and other current |
|
|
|
|
|
|
|
|
| |
liabilities @ |
43.9 |
36.3 |
49.5 |
8.6 |
78.3 |
14.2 |
31.2 |
27.8 |
21 |
(a) |
Gross fixed assets @ |
29.9 |
28.5 |
57.4 |
26.1 |
32.7 |
30.6 |
16.4 |
20.8 |
| |
(b) |
Net fixed assets @ |
32.2 |
34.5 |
78.9 |
30.8 |
38.6 |
36.6 |
19.1 |
25.0 |
22 |
Inventories @ |
16.6 |
26.3 |
20.2 |
64.0 |
21.9 |
65.6 |
28.5 |
29.0 |
23 |
(a) |
Gross physical assets @ |
29.7 |
28.4 |
43.1 |
38.4 |
32.3 |
31.7 |
18.4 |
22.2 |
| |
(b) |
Net physical assets @ |
31.9 |
34.3 |
50.8 |
43.5 |
37.6 |
38.1 |
21.3 |
26.0 |
24 |
(a) |
Total gross assets @ |
28.3 |
32.6 |
75.6 |
50.4 |
40.5 |
34.7 |
25.3 |
26.9 |
| |
(b) |
Total net assets @ |
29.1 |
36.9 |
80.2 |
52.2 |
42.6 |
36.2 |
28.5 |
29.9 |
25 |
Total earnings in foreign currencies |
6.2 |
-19.1 |
51.6 |
48.8 |
40.2 |
21.5 |
42.0 |
22.3 |
| |
of which, Exports |
-5.5 |
# |
-15.1 |
140.2 |
29.4 |
69.2 |
44.5 |
23.7 |
26 |
Total expenditure in foreign currencies |
27.4 |
103.7 |
7.0 |
102.7 |
43.0 |
24.9 |
34.3 |
30.7 |
| |
of which, Imports |
73.2 |
141.3 |
-3.1 |
157.9 |
34.3 |
23.0 |
34.1 |
27.0 |
Statement 12: Select financial ratios of the select 3,114 Public Limited Companies – Industry wise, 2005-06 to 2007-08 |
(Per cent) |
Industry / Industry group |
Tea Plantations
(28) |
Mining and Quqrrying
(39) |
Food Products and Beverages (231) |
Item |
2005-06 |
2006-07 |
2007-08 |
2005-06 |
2006-07 |
2007-08 |
2005-06 |
2006-07 |
2007-08 |
1 |
2 |
3 |
4 |
5 |
6 |
7 |
8 |
9 |
10 |
A. |
Capital structure ratios |
|
|
|
|
|
|
|
|
|
1. |
Net fixed assets to total net assets |
27.8 |
21.4 |
17.0 |
53.9 |
28.9 |
37.8 |
40.6 |
41.7 |
42.0 |
2. |
Net worth to total net assets |
59.4 |
55.4 |
53.6 |
38.9 |
35.2 |
35.8 |
32.6 |
33.8 |
31.0 |
3. |
Debt to equity |
21.0 |
14.8 |
19.6 |
94.4 |
95.6 |
85.5 |
58.8 |
60.5 |
63.7 |
4. |
Debt to equity (equity adjusted for |
|
|
|
|
|
|
|
|
|
| |
revaluation reserve) |
23.3 |
16.0 |
21.4 |
94.6 |
96.6 |
86.1 |
62.6 |
63.3 |
66.4 |
5. |
Short term bank borrowings to |
|
|
|
|
|
|
|
|
|
| |
inventories |
91.6 |
257.0 |
177.1 |
128.0 |
26.2 |
40.4 |
58.1 |
69.5 |
80.2 |
6. |
Total outside liabilities to net worth |
68.3 |
80.6 |
86.6 |
157.1 |
183.7 |
179.5 |
206.7 |
196.2 |
222.7 |
B. |
Liquidity ratios |
|
|
|
|
|
|
|
|
|
7. |
Current assets to current liabilities * |
1.6 |
0.8 |
1.0 |
1.5 |
1.5 |
1.3 |
1.1 |
1.1 |
1.1 |
8. |
Quick assets to current liabilities |
80.1 |
38.8 |
42.4 |
68.9 |
55.2 |
42.7 |
32.8 |
39.4 |
30.0 |
9. |
Current assets to total net assets |
44.1 |
29.2 |
36.7 |
35.6 |
45.2 |
43.4 |
52.4 |
50.9 |
51.1 |
10. |
Sundry creditors to current assets |
21.8 |
25.4 |
21.1 |
18.8 |
33.5 |
45.7 |
29.7 |
28.5 |
31.8 |
11. |
Sundry creditors to net working capital |
59.9 |
# |
# |
58.8 |
106.0 |
201.8 |
352.8 |
241.8 |
# |
C. |
Assets utilization and turnover ratios |
|
|
|
|
|
|
|
|
|
12. |
Sales to total net assets |
59.7 |
50.7 |
45.7 |
53.8 |
46.1 |
40.6 |
132.5 |
122.9 |
108.7 |
13. |
Sales to gross fixed assets |
122.9 |
133.4 |
155.2 |
85.1 |
126.0 |
91.0 |
217.3 |
207.3 |
190.1 |
14. |
Inventories to sales |
16.8 |
16.4 |
16.6 |
7.7 |
29.2 |
32.8 |
19.6 |
18.1 |
22.1 |
15. |
Sundry debtors to sales |
6.2 |
6.6 |
7.0 |
13.6 |
15.8 |
18.2 |
7.4 |
7.5 |
7.9 |
16. |
Exports to sales |
11.5 |
12.1 |
10.8 |
19.1 |
32.0 |
85.3 |
5.8 |
7.0 |
7.9 |
17. |
Gross value added to gross fixed assets |
46.4 |
53.6 |
52.9 |
18.6 |
36.4 |
33.1 |
32.0 |
30.3 |
25.1 |
18. |
Raw materials consumed to |
|
|
|
|
|
|
|
|
|
| |
value of production |
24.0 |
26.3 |
36.0 |
47.6 |
54.3 |
46.7 |
64.8 |
65.5 |
68.1 |
D. |
Sources and uses of funds ratios @ |
|
|
|
|
|
|
|
|
|
19. |
Gross fixed assets formation to |
|
|
|
|
|
|
|
|
|
| |
total uses of funds |
|
2.6 |
— |
|
— |
63.8 |
|
48.5 |
46.8 |
20. |
Gross capital formation to |
|
|
|
|
|
|
|
|
|
| |
total uses of funds |
|
5.3 |
— |
|
9.8 |
76.1 |
|
58.2 |
73.9 |
21. |
External sources of funds to |
|
|
|
|
|
|
|
|
|
| |
total sources of funds |
|
76.5 |
77.2 |
|
76.8 |
74.3 |
|
74.2 |
80.8 |
22. |
Increase in bank borrowings to |
|
|
|
|
|
|
|
|
|
| |
total external sources |
|
81.7 |
— |
|
25.0 |
25.6 |
|
29.8 |
46.4 |
23. |
Gross savings to gross capital formation |
|
# |
# |
|
224.3 |
36.6 |
|
42.9 |
24.3 |
E. |
Profitability and profit allocation ratios |
|
|
|
|
|
|
|
|
|
24. |
Gross profits to total net assets |
8.0 |
8.4 |
7.2 |
8.8 |
11.0 |
13.1 |
10.4 |
10.3 |
7.2 |
25. |
Gross profits to sales |
13.4 |
16.5 |
15.8 |
16.3 |
23.9 |
32.3 |
7.8 |
8.4 |
6.6 |
26. |
Profits after tax to net worth |
10.8 |
15.3 |
12.1 |
10.3 |
18.6 |
21.6 |
15.8 |
16.7 |
11.3 |
27. |
Tax provision to profits before tax |
25.5 |
15.8 |
27.6 |
46.6 |
33.2 |
35.1 |
30.2 |
24.5 |
30.5 |
28. |
Profits retained to profits after tax |
59.4 |
70.6 |
29.2 |
68.9 |
81.0 |
85.6 |
67.1 |
74.8 |
69.9 |
29. |
Dividends to net worth |
4.4 |
4.5 |
8.6 |
3.2 |
3.5 |
3.1 |
5.2 |
4.2 |
3.4 |
30. |
Ordinary dividends to ordinary |
|
|
|
|
|
|
|
|
|
| |
paid-up capital |
52.6 |
63.3 |
142.5 |
10.0 |
13.5 |
15.6 |
20.7 |
20.9 |
20.3 |
* : Item B.7 is the actual ratio of current assets to current liabilities.
Notes : 1. Figures in brackets below the industry name represent the number of companies in the industry. 2. For footnotes, please refer to statement 7. |
Statement 12: Select financial ratios of the select 3,114 Public Limited Companies – Industry wise, 2005-06 to 2007-08 (Contd.) |
(Per cent) |
Industry / Industry group |
Sugar
(49) |
Edible Oils and Oil Cakes
(58) |
Cotton Textiles
(151) |
Item |
2005-06 |
2006-07 |
2007-08 |
2005-06 |
2006-07 |
2007-08 |
2005-06 |
2006-07 |
2007-08 |
1 |
11 |
12 |
13 |
14 |
15 |
16 |
17 |
18 |
19 |
A. |
Capital structure ratios |
|
|
|
|
|
|
|
|
|
1. |
Net fixed assets to total net assets |
46.5 |
51.2 |
54.4 |
29.2 |
27.6 |
25.4 |
49.9 |
53.3 |
54.2 |
2. |
Net worth to total net assets |
30.7 |
34.1 |
25.6 |
26.5 |
28.8 |
26.7 |
28.9 |
27.9 |
24.6 |
3. |
Debt to equity |
82.4 |
82.4 |
111.8 |
55.9 |
45.3 |
48.9 |
114.4 |
127.7 |
157.7 |
4. |
Debt to equity (equity adjusted for |
|
|
|
|
|
|
|
|
|
| |
revaluation reserve) |
86.6 |
84.9 |
115.4 |
58.8 |
46.9 |
50.1 |
116.3 |
132.0 |
163.5 |
5. |
Short term bank borrowings to |
|
|
|
|
|
|
|
|
|
| |
inventories |
51.8 |
58.9 |
98.4 |
51.2 |
48.5 |
45.9 |
82.8 |
89.0 |
92.5 |
6. |
Total outside liabilities to net worth |
225.4 |
193.1 |
290.8 |
276.8 |
247.6 |
274.8 |
246.3 |
258.7 |
306.3 |
B. |
Liquidity ratios |
|
|
|
|
|
|
|
|
|
7. |
Current assets to current liabilities * |
1.2 |
1.2 |
0.9 |
1.1 |
1.2 |
1.2 |
1.2 |
1.2 |
1.2 |
8. |
Quick assets to current liabilities |
19.7 |
29.7 |
14.6 |
43.0 |
44.9 |
42.7 |
44.5 |
38.4 |
36.6 |
9. |
Current assets to total net assets |
50.3 |
45.2 |
41.9 |
64.1 |
68.0 |
71.4 |
46.9 |
42.0 |
42.4 |
10 |
Sundry creditors to current assets |
29.1 |
28.2 |
35.4 |
31.9 |
33.8 |
37.3 |
16.0 |
16.7 |
16.1 |
11 |
Sundry creditors to net working capital |
219.2 |
146.7 |
# |
367.3 |
231.7 |
238.2 |
84.7 |
125.9 |
113.4 |
C. |
Assets utilization and turnover ratios |
|
|
|
|
|
|
|
|
|
12. |
Sales to total net assets |
86.7 |
76.9 |
54.6 |
260.4 |
267.2 |
213.2 |
74.4 |
69.3 |
66.3 |
13. |
Sales to gross fixed assets |
131.2 |
114.1 |
79.2 |
# |
# |
# |
90.4 |
83.6 |
80.7 |
14. |
Inventories to sales |
36.2 |
28.2 |
38.5 |
11.8 |
12.4 |
17.3 |
27.8 |
27.0 |
28.0 |
15. |
Sundry debtors to sales |
5.6 |
6.0 |
6.8 |
5.2 |
4.4 |
5.0 |
14.6 |
14.0 |
15.4 |
16. |
Exports to sales |
1.6 |
4.6 |
5.9 |
4.8 |
5.9 |
7.6 |
27.3 |
29.3 |
31.8 |
17. |
Gross value added to gross fixed assets |
32.9 |
25.3 |
12.5 |
26.9 |
35.4 |
37.2 |
18.7 |
17.1 |
14.8 |
18. |
Raw materials consumed to |
|
|
|
|
|
|
|
|
|
| |
value of production |
62.5 |
65.9 |
72.4 |
81.4 |
82.5 |
83.0 |
55.4 |
57.0 |
60.7 |
D. |
Sources and uses of funds ratios @ |
|
|
|
|
|
|
|
|
|
19. |
Gross fixed assets formation to total uses of funds |
|
64.9 |
66.5 |
|
19.2 |
24.8 |
|
70.8 |
65.5 |
20. |
Gross capital formation to total uses of funds |
|
64.3 |
84.0 |
|
53.6 |
65.6 |
|
80.5 |
80.9 |
21. |
External sources of funds to total sources of funds |
|
72.7 |
93.4 |
|
75.1 |
81.2 |
|
76.8 |
76.1 |
22. |
Increase in bank borrowings to total external sources |
|
25.6 |
61.1 |
|
— |
22.9 |
|
68.2 |
84.2 |
23. |
Gross savings to gross capital formation |
|
34.4 |
8.2 |
|
69.6 |
25.5 |
|
30.2 |
30.4 |
E. |
Profitability and profit allocation ratios |
|
|
|
|
|
|
|
|
|
24. |
Gross profits to total net assets |
14.4 |
10.8 |
2.6 |
4.2 |
10.5 |
10.3 |
6.7 |
6.0 |
4.3 |
25. |
Gross profits to sales |
16.6 |
14.1 |
4.7 |
1.6 |
3.9 |
4.8 |
9.0 |
8.6 |
6.4 |
26. |
Profits after tax to net worth |
22.1 |
16.9 |
— |
15.5 |
19.9 |
21.3 |
10.0 |
9.1 |
3.2 |
27. |
Tax provision to profits before tax |
22.2 |
17.8 |
# |
18.2 |
20.8 |
24.1 |
24.9 |
24.9 |
39.4 |
28. |
Profits retained to profits after tax |
85.1 |
85.3 |
& |
77.6 |
83.7 |
88.4 |
78.4 |
82.1 |
65.0 |
29. |
Dividends to net worth |
3.3 |
2.5 |
0.9 |
3.5 |
3.2 |
2.5 |
2.2 |
1.6 |
1.1 |
30. |
Ordinary dividends to ordinary paid-up capital |
17.7 |
18.7 |
6.2 |
10.5 |
11.1 |
14.0 |
5.9 |
4.9 |
3.6 |
Notes : Industry groups viz, ‘Sugar’ and ‘Edible Oil and oil cakes’ are subgroups of ‘Food products and Beverages’. |
Statement 12: Select financial ratios of the select 3,114 Public Limited Companies – Industry wise, 2005-06 to 2007-08 (Contd.) |
(Per cent) |
Industry / Industry group |
Man-made Textiles (62) |
Apparel (40) |
Paper and Paper Products (62) |
Item |
2005-06 |
2006-07 |
2007-08 |
2005-06 |
2006-07 |
2007-08 |
2005-06 |
2006-07 |
2007-08 |
1 |
20 |
21 |
22 |
23 |
24 |
25 |
26 |
27 |
28 |
A. |
Capital structure ratios |
|
|
|
|
|
|
|
|
|
1. |
Net fixed assets to total net assets |
55.5 |
56.1 |
54.8 |
24.2 |
27.4 |
24.8 |
62.5 |
60.9 |
60.2 |
2. |
Net worth to total net assets |
27.6 |
24.4 |
21.3 |
42.0 |
45.0 |
41.8 |
40.0 |
37.4 |
38.5 |
3. |
Debt to equity |
127.6 |
151.1 |
192.4 |
22.4 |
28.5 |
31.9 |
61.8 |
79.0 |
73.3 |
4. |
Debt to equity (equity adjusted for revaluation reserve) |
143.7 |
171.7 |
220.7 |
22.4 |
28.5 |
32.2 |
63.6 |
80.9 |
74.9 |
5. |
Short term bank borrowings to inventories |
111.4 |
146.1 |
155.7 |
62.7 |
64.2 |
66.1 |
97.4 |
84.8 |
112.0 |
6. |
Total outside liabilities to net worth |
262.9 |
309.3 |
369.8 |
138.1 |
122.3 |
139.4 |
150.3 |
167.2 |
159.5 |
B. |
Liquidity ratios |
|
|
|
|
|
|
|
|
|
7. |
Current assets to current liabilities * |
1.1 |
1.0 |
1.1 |
1.4 |
1.6 |
1.5 |
1.0 |
1.2 |
1.1 |
8. |
Quick assets to current liabilities |
46.9 |
48.7 |
53.5 |
61.0 |
46.1 |
40.1 |
40.4 |
54.6 |
47.2 |
9. |
Current assets to total net assets |
40.3 |
39.8 |
42.0 |
68.1 |
65.3 |
68.8 |
34.9 |
38.0 |
35.9 |
10. |
Sundry creditors to current assets |
19.8 |
20.4 |
19.5 |
15.3 |
16.1 |
15.4 |
28.8 |
22.1 |
22.5 |
11. |
Sundry creditors to net working capital |
239.3 |
# |
183.3 |
53.0 |
45.3 |
44.0 |
# |
165.5 |
280.9 |
C. |
Assets utilization and turnover ratios |
|
|
|
|
|
|
|
|
|
12. |
Sales to total net assets |
85.8 |
70.8 |
63.6 |
100.8 |
101.3 |
94.6 |
77.9 |
71.3 |
68.0 |
13. |
Sales to gross fixed assets |
92.0 |
80.7 |
80.1 |
291.9 |
271.8 |
276.0 |
78.2 |
76.4 |
74.6 |
14. |
Inventories to sales |
16.5 |
17.8 |
18.7 |
28.9 |
35.7 |
41.0 |
15.6 |
16.0 |
16.9 |
15. |
Sundry debtors to sales |
13.0 |
17.0 |
16.8 |
12.9 |
13.0 |
13.0 |
13.1 |
14.5 |
15.4 |
16. |
Exports to sales |
13.1 |
16.6 |
18.5 |
59.4 |
55.7 |
46.2 |
5.9 |
5.8 |
5.7 |
17. |
Gross value added to gross fixed assets |
12.7 |
12.1 |
12.8 |
65.2 |
67.7 |
71.4 |
18.4 |
18.5 |
17.9 |
18. |
Raw materials consumed to value of production |
67.3 |
65.7 |
65.4 |
51.2 |
51.4 |
51.7 |
43.9 |
44.5 |
45.4 |
D. |
Sources and uses of funds ratios @ |
|
|
|
|
|
|
|
|
|
19. |
Gross fixed assets formation to total uses of funds |
|
60.5 |
50.2 |
|
41.7 |
22.8 |
|
58.1 |
64.1 |
20. |
Gross capital formation to total uses of funds |
|
67.4 |
60.0 |
|
94.1 |
66.2 |
|
65.4 |
74.2 |
21. |
External sources of funds to total sources of funds |
|
84.6 |
91.3 |
|
75.3 |
78.1 |
|
67.0 |
60.4 |
22. |
Increase in bank borrowings to total external sources |
|
83.2 |
76.1 |
|
64.6 |
58.2 |
|
53.5 |
70.7 |
23. |
Gross savings to gross capital formation |
|
27.7 |
29.0 |
|
27.6 |
34.2 |
|
60.0 |
55.7 |
E. |
Profitability and profit allocation ratios |
|
|
|
|
|
|
|
|
|
24. |
Gross profits to total net assets |
4.4 |
4.0 |
4.7 |
9.3 |
10.3 |
9.6 |
8.6 |
8.6 |
8.2 |
25. |
Gross profits to sales |
5.1 |
5.7 |
7.5 |
9.2 |
10.2 |
10.1 |
11.0 |
12.0 |
12.1 |
26. |
Profits after tax to net worth |
9.3 |
5.6 |
7.0 |
13.1 |
12.3 |
10.5 |
13.2 |
13.0 |
11.5 |
27. |
Tax provision to profits before tax |
17.2 |
28.7 |
23.6 |
27.3 |
27.7 |
33.4 |
16.3 |
18.0 |
18.6 |
28. |
Profits retained to profits after tax |
74.1 |
62.3 |
77.1 |
84.8 |
85.3 |
86.9 |
80.2 |
80.0 |
79.7 |
29. |
Dividends to net worth |
2.4 |
2.1 |
1.6 |
2.0 |
1.8 |
1.4 |
2.6 |
2.6 |
2.3 |
30. |
Ordinary dividends to ordinary paid-up capital |
6.5 |
6.8 |
6.5 |
11.8 |
12.1 |
10.7 |
11.9 |
12.8 |
12.7 |
Statement 12: Select financial ratios of the select 3,114 Public Limited Companies – Industry wise, 2005-06 to 2007-08 (Contd.) |
(Per cent) |
Industry / Industry group |
Chemicals and Chemical products(416) |
Basic Chemicals (60) |
Chemical Fertiliser and Pesticides (49) |
Item |
2005-06 |
2006-07 |
2007-08 |
2005-06 |
2006-07 |
2007-08 |
2005-06 |
2006-07 |
2007-08 |
1 |
29 |
30 |
31 |
32 |
33 |
34 |
35 |
36 |
37 |
A. |
Capital structure ratios |
|
|
|
|
|
|
|
|
|
1. |
Net fixed assets to total net assets |
40.5 |
39.2 |
38.4 |
62.5 |
60.5 |
57.8 |
37.7 |
36.3 |
32.7 |
2. |
Net worth to total net assets |
41.6 |
42.5 |
45.2 |
35.0 |
38.0 |
40.7 |
37.7 |
39.3 |
41.6 |
3. |
Debt to equity |
46.5 |
45.2 |
35.9 |
95.7 |
72.7 |
55.6 |
51.3 |
53.9 |
37.0 |
4. |
Debt to equity (equity adjusted for revaluation reserve) |
48.5 |
46.7 |
37.7 |
96.9 |
73.6 |
56.1 |
57.0 |
58.6 |
39.3 |
5. |
Short term bank borrowings to inventories |
71.7 |
77.1 |
88.6 |
54.7 |
84.5 |
98.7 |
102.4 |
98.6 |
124.1 |
6. |
Total outside liabilities to net worth |
140.4 |
135.1 |
121.3 |
186.0 |
163.5 |
145.7 |
165.6 |
154.2 |
140.5 |
B. |
Liquidity ratios |
|
|
|
|
|
|
|
|
|
7. |
Current assets to current liabilities * |
1.3 |
1.3 |
1.2 |
1.1 |
1.0 |
1.0 |
1.2 |
1.2 |
1.1 |
8. |
Quick assets to current liabilities |
63.6 |
60.8 |
53.5 |
39.4 |
41.4 |
35.8 |
58.3 |
58.7 |
47.4 |
9. |
Current assets to total net assets |
49.7 |
47.9 |
45.9 |
33.4 |
34.2 |
35.6 |
49.6 |
48.4 |
47.4 |
10. |
Sundry creditors to current assets |
26.7 |
25.1 |
26.0 |
33.4 |
28.7 |
28.3 |
31.1 |
23.4 |
27.7 |
11. |
Sundry creditors to net working capital |
120.0 |
119.6 |
154.2 |
# |
# |
# |
219.8 |
120.2 |
286.7 |
C. |
Assets utilization and turnover ratios |
|
|
|
|
|
|
|
|
|
12. |
Sales to total net assets |
86.1 |
85.2 |
81.0 |
78.5 |
81.7 |
77.6 |
83.6 |
83.7 |
81.2 |
13. |
Sales to gross fixed assets |
131.5 |
135.0 |
132.8 |
82.9 |
88.6 |
87.9 |
121.2 |
122.7 |
128.6 |
14. |
Inventories to sales |
18.0 |
17.5 |
18.0 |
15.8 |
13.8 |
15.7 |
16.4 |
16.2 |
16.5 |
15. |
Sundry debtors to sales |
19.2 |
18.6 |
18.0 |
10.4 |
10.6 |
11.5 |
25.4 |
22.4 |
18.1 |
16. |
Exports to sales |
22.1 |
22.4 |
22.9 |
18.6 |
17.0 |
15.4 |
15.4 |
12.1 |
12.9 |
17. |
Gross value added to gross fixed assets |
28.6 |
30.4 |
30.2 |
19.4 |
21.9 |
19.3 |
22.4 |
22.2 |
23.8 |
18. |
Raw materials consumed to value of production |
56.0 |
54.9 |
55.5 |
57.6 |
54.7 |
58.0 |
61.4 |
60.4 |
61.4 |
D. |
Sources and uses of funds ratios @ |
|
|
|
|
|
|
|
|
|
19. |
Gross fixed assets formation to total uses of funds |
|
42.4 |
38.6 |
|
59.6 |
50.5 |
|
43.0 |
24.1 |
20. |
Gross capital formation to total uses of funds |
|
52.7 |
50.5 |
|
62.7 |
65.9 |
|
51.6 |
34.1 |
21. |
External sources of funds to total sources of funds |
|
51.9 |
50.4 |
|
26.6 |
33.9 |
|
31.5 |
63.9 |
22. |
Increase in bank borrowings to total external sources |
|
38.0 |
42.9 |
|
124.0 |
55.5 |
|
85.2 |
47.1 |
23. |
Gross savings to gross capital formation |
|
90.1 |
100.5 |
|
99.8 |
99.0 |
|
138.7 |
134.1 |
E. |
Profitability and profit allocation ratios |
|
|
|
|
|
|
|
|
|
24. |
Gross profits to total net assets |
10.5 |
11.6 |
11.0 |
11.2 |
13.5 |
10.4 |
9.0 |
8.8 |
9.0 |
25. |
Gross profits to sales |
12.2 |
13.7 |
13.5 |
14.2 |
16.5 |
13.4 |
10.8 |
10.5 |
11.1 |
26. |
Profits after tax to net worth |
16.4 |
19.0 |
17.3 |
17.5 |
20.3 |
17.6 |
13.9 |
16.2 |
15.3 |
27. |
Tax provision to profits before tax |
26.5 |
24.2 |
24.9 |
21.7 |
20.1 |
20.3 |
30.4 |
28.7 |
29.3 |
28. |
Profits retained to profits after tax |
64.3 |
71.2 |
70.3 |
86.5 |
89.8 |
88.7 |
64.9 |
76.5 |
68.5 |
29. |
Dividends to net worth |
5.8 |
5.5 |
5.1 |
2.4 |
2.1 |
2.0 |
4.9 |
3.8 |
4.8 |
30. |
Ordinary dividends to ordinary paid-up capital |
30.5 |
32.3 |
38.1 |
5.9 |
6.4 |
7.5 |
22.1 |
16.1 |
29.5 |
Note : Industry groups viz., ‘Basic Chemicals’ and ‘Chemical Fertilizers and Pesticides’ are subgroups of ‘Chemicals and Chemical Products’. |
Statement 12:Select financial ratios of the select 3,114 Public Limited Companies – Industry wise, 2005-06 to 2007-08 (Contd.) |
(Per cent) |
Industry / Industry group |
Paints and Varnishes (21) |
Pharmaceuticals and Medicines (147) |
Rubber and Plastic products(147) |
Item |
2005-06 |
2006-07 |
2007-08 |
2005-06 |
2006-07 |
2007-08 |
2005-06 |
2006-07 |
2007-08 |
1 |
38 |
39 |
40 |
41 |
42 |
43 |
44 |
45 |
46 |
A. |
Capital structure ratios |
|
|
|
|
|
|
|
|
|
1. |
Net fixed assets to total net assets |
26.5 |
24.3 |
27.0 |
33.2 |
31.9 |
31.8 |
45.1 |
44.8 |
41.2 |
2. |
Net worth to total net assets |
43.0 |
43.9 |
44.6 |
48.8 |
48.9 |
50.2 |
35.4 |
35.8 |
37.5 |
3. |
Debt to equity |
21.6 |
18.1 |
20.4 |
32.9 |
35.2 |
30.3 |
64.6 |
56.5 |
52.2 |
4. |
Debt to equity (equity adjusted for revaluation reserve) |
22.0 |
18.4 |
21.3 |
33.1 |
35.3 |
30.4 |
69.4 |
59.2 |
53.9 |
5. |
Short term bank borrowings to inventories |
36.4 |
45.1 |
35.7 |
72.4 |
73.7 |
87.7 |
94.0 |
95.0 |
91.5 |
6. |
Total outside liabilities to net worth |
132.4 |
127.5 |
124.3 |
104.7 |
104.6 |
99.4 |
182.9 |
179.1 |
166.4 |
B. |
Liquidity ratios |
|
|
|
|
|
|
|
|
|
7. |
Current assets to current liabilities * |
1.2 |
1.1 |
1.2 |
1.7 |
1.6 |
1.5 |
1.1 |
1.1 |
1.2 |
8. |
Quick assets to current liabilities |
54.3 |
55.8 |
53.8 |
91.1 |
81.8 |
69.4 |
54.9 |
52.3 |
60.0 |
9. |
Current assets to total net assets |
54.5 |
54.7 |
53.8 |
59.1 |
53.5 |
50.0 |
46.3 |
47.3 |
50.7 |
10. |
Sundry creditors to current assets |
30.5 |
32.3 |
33.6 |
20.3 |
20.4 |
20.8 |
27.5 |
28.8 |
24.8 |
11. |
Sundry creditors to net working capital |
225.2 |
252.2 |
232.2 |
49.1 |
54.5 |
65.2 |
272.6 |
367.6 |
140.6 |
C. |
Assets utilization and turnover ratios |
|
|
|
|
|
|
|
|
|
12. |
Sales to total net assets |
118.6 |
122.3 |
119.1 |
75.2 |
74.3 |
71.7 |
97.8 |
107.7 |
102.3 |
13. |
Sales to gross fixed assets |
218.8 |
240.7 |
226.9 |
163.8 |
169.6 |
164.3 |
124.0 |
138.2 |
144.7 |
14. |
Inventories to sales |
18.3 |
17.7 |
17.8 |
23.1 |
22.0 |
21.9 |
15.9 |
15.1 |
16.2 |
15. |
Sundry debtors to sales |
17.7 |
17.4 |
16.9 |
23.9 |
23.8 |
24.1 |
16.5 |
16.4 |
16.5 |
16. |
Exports to sales |
15.5 |
14.7 |
15.3 |
35.5 |
37.6 |
38.1 |
15.9 |
18.2 |
16.3 |
17. |
Gross value added to gross fixed assets |
43.8 |
42.9 |
45.5 |
44.2 |
51.3 |
49.5 |
20.0 |
24.2 |
27.5 |
18. |
Raw materials consumed to value of production |
57.5 |
60.5 |
58.8 |
46.2 |
44.4 |
45.3 |
66.1 |
65.9 |
65.1 |
D. |
Sources and uses of funds ratios @ |
|
|
|
|
|
|
|
|
|
19. |
Gross fixed assets formation to total uses of funds |
|
25.8 |
50.7 |
|
32.9 |
38.2 |
|
54.2 |
34.3 |
20. |
Gross capital formation to total uses of funds |
|
43.6 |
68.0 |
|
44.5 |
49.2 |
|
70.7 |
50.3 |
21. |
External sources of funds to total sources of funds |
|
42.4 |
49.9 |
|
60.7 |
43.1 |
|
56.3 |
60.7 |
22. |
Increase in bank borrowings to total external sources |
|
47.4 |
7.1 |
|
12.6 |
56.1 |
|
43.3 |
26.3 |
23. |
Gross savings to gross capital formation |
|
124.2 |
91.2 |
|
94.7 |
109.8 |
|
66.2 |
76.8 |
E. |
Profitability and profit allocation ratios |
|
|
|
|
|
|
|
|
|
24. |
Gross profits to total net assets |
11.2 |
12.0 |
14.4 |
11.6 |
14.6 |
13.4 |
6.3 |
9.5 |
10.4 |
25. |
Gross profits to sales |
9.5 |
9.8 |
12.1 |
15.5 |
19.6 |
18.7 |
6.5 |
8.8 |
10.2 |
26. |
Profits after tax to net worth |
12.8 |
25.3 |
19.4 |
17.9 |
21.4 |
19.9 |
8.8 |
12.7 |
15.0 |
27. |
Tax provision to profits before tax |
43.3 |
33.3 |
32.7 |
23.3 |
21.1 |
22.6 |
30.4 |
29.1 |
28.9 |
28. |
Profits retained to profits after tax |
30.3 |
59.3 |
62.7 |
63.0 |
71.8 |
72.3 |
54.1 |
76.1 |
82.4 |
29. |
Dividends to net worth |
8.9 |
10.3 |
7.2 |
6.6 |
6.0 |
5.5 |
4.0 |
3.0 |
2.6 |
30. |
Ordinary dividends to ordinary paid-up capital |
70.6 |
90.1 |
71.1 |
69.3 |
69.1 |
72.4 |
19.7 |
17.4 |
18.9 |
Note : Industry groups viz., ‘Paints and Varnishes’ and ‘Pharmaceuticals and Medicines’ are subgroups of ‘Chemicals and Chemical Products’. |
Statement 12: Select financial ratios of the select 3,114 Public Limited Companies – Industry wise, 2005-06 to 2007-08 (Contd.) |
(Per cent) |
Industry / Industry group |
Tyres and Tubes (15) |
Plastic Products
(106) |
Ceramics (36) |
Item |
2005-06 |
2006-07 |
2007-08 |
2005-06 |
2006-07 |
2007-08 |
2005-06 |
2006-07 |
2007-08 |
1 |
47 |
48 |
49 |
50 |
51 |
52 |
53 |
54 |
55 |
A. |
Capital structure ratios |
|
|
|
|
|
|
|
|
|
1. |
Net fixed assets to total net assets |
47.5 |
46.3 |
45.4 |
43.6 |
43.8 |
38.2 |
52.2 |
49.4 |
49.3 |
2. |
Net worth to total net assets |
35.9 |
37.7 |
38.7 |
33.9 |
33.6 |
36.4 |
32.6 |
34.6 |
37.9 |
3. |
Debt to equity |
63.1 |
50.7 |
41.4 |
69.9 |
64.2 |
61.6 |
75.3 |
66.4 |
53.4 |
4. |
Debt to equity (equity adjusted for |
|
|
|
|
|
|
|
|
|
| |
revaluation reserve) |
73.1 |
55.3 |
44.4 |
70.7 |
64.9 |
62.0 |
75.3 |
66.4 |
53.5 |
5. |
Short term bank borrowings to |
|
|
|
|
|
|
|
|
|
| |
inventories |
74.5 |
76.7 |
70.5 |
120.6 |
117.5 |
116.2 |
64.3 |
67.5 |
63.5 |
6. |
Total outside liabilities to net worth |
178.3 |
165.3 |
158.1 |
194.9 |
197.6 |
174.6 |
206.6 |
189.0 |
164.0 |
B. |
Liquidity ratios |
|
|
|
|
|
|
|
|
|
7. |
Current assets to current liabilities * |
1.2 |
1.1 |
1.1 |
1.0 |
1.0 |
1.3 |
1.0 |
1.1 |
1.1 |
8. |
Quick assets to current liabilities |
55.5 |
53.0 |
49.1 |
53.2 |
50.6 |
68.7 |
43.8 |
46.8 |
45.4 |
9. |
Current assets to total net assets |
48.2 |
48.9 |
49.6 |
44.3 |
45.6 |
51.4 |
44.2 |
46.9 |
47.3 |
10. |
Sundry creditors to current assets |
33.8 |
34.1 |
35.5 |
22.4 |
24.2 |
17.7 |
31.1 |
31.4 |
30.5 |
11. |
Sundry creditors to net working capital |
230.1 |
277.3 |
370.8 |
# |
# |
76.7 |
# |
312.4 |
254.4 |
C. |
Assets utilization and turnover ratios |
|
|
|
|
|
|
|
|
|
12. |
Sales to total net assets |
121.1 |
135.3 |
136.4 |
78.1 |
85.0 |
79.2 |
80.9 |
83.0 |
84.7 |
13. |
Sales to gross fixed assets |
145.4 |
165.9 |
168.9 |
103.8 |
113.7 |
125.5 |
99.5 |
107.7 |
110.6 |
14. |
Inventories to sales |
15.2 |
13.9 |
15.4 |
16.8 |
16.5 |
17.0 |
25.2 |
25.8 |
24.8 |
15. |
Sundry debtors to sales |
14.1 |
13.8 |
12.6 |
19.1 |
19.5 |
20.5 |
17.2 |
17.3 |
17.9 |
16. |
Exports to sales |
15.1 |
18.1 |
16.9 |
15.3 |
17.0 |
14.2 |
8.1 |
8.9 |
6.9 |
17. |
Gross value added to gross fixed assets |
22.1 |
28.0 |
30.6 |
17.5 |
20.7 |
24.8 |
24.4 |
24.8 |
25.3 |
18. |
Raw materials consumed to |
|
|
|
|
|
|
|
|
|
| |
value of production |
68.0 |
67.1 |
66.1 |
65.0 |
65.5 |
64.9 |
40.6 |
43.2 |
44.3 |
D. |
Sources and uses of funds ratios @ |
|
|
|
|
|
|
|
|
|
19. |
Gross fixed assets formation to |
|
|
|
|
|
|
|
|
|
| |
total uses of funds |
|
50.5 |
52.9 |
|
56.5 |
28.2 |
|
45.9 |
58.7 |
20. |
Gross capital formation to |
|
|
|
|
|
|
|
|
|
| |
total uses of funds |
|
67.2 |
86.3 |
|
73.0 |
39.2 |
|
68.0 |
73.1 |
21. |
External sources of funds to |
|
|
|
|
|
|
|
|
|
| |
total sources of funds |
|
50.6 |
33.6 |
|
59.0 |
69.1 |
|
56.9 |
61.3 |
22. |
Increase in bank borrowings to |
|
|
|
|
|
|
|
|
|
| |
total external sources |
|
33.9 |
22.5 |
|
46.8 |
26.2 |
|
68.6 |
10.5 |
23. |
Gross savings to gross capital formation |
|
83.4 |
97.5 |
|
53.9 |
65.5 |
|
51.0 |
58.9 |
E. |
Profitability and profit allocation ratios |
|
|
|
|
|
|
|
|
|
24. |
Gross profits to total net assets |
6.9 |
11.0 |
12.3 |
5.9 |
8.5 |
9.4 |
9.7 |
9.0 |
9.0 |
25. |
Gross profits to sales |
5.7 |
8.1 |
9.0 |
7.5 |
10.0 |
11.9 |
12.0 |
10.8 |
10.6 |
26. |
Profits after tax to net worth |
9.5 |
15.4 |
16.3 |
8.3 |
11.0 |
14.5 |
13.6 |
10.7 |
9.0 |
27. |
Tax provision to profits before tax |
30.3 |
29.9 |
31.7 |
29.5 |
26.8 |
25.9 |
29.2 |
31.7 |
33.7 |
28. |
Profits retained to profits after tax |
76.5 |
81.9 |
84.8 |
37.7 |
68.4 |
82.2 |
82.9 |
79.8 |
81.5 |
29. |
Dividends to net worth |
2.2 |
2.8 |
2.5 |
5.2 |
3.5 |
2.6 |
2.3 |
2.2 |
1.7 |
30. |
Ordinary dividends to |
|
|
|
|
|
|
|
|
|
| |
ordinary paid-up capital |
31.2 |
45.7 |
44.1 |
17.5 |
13.8 |
14.1 |
10.2 |
10.2 |
9.4 |
Note : Industry groups viz, ‘Tyres and Tubes’ and ‘Plastic products’ are sub groups of ‘Rubber and Plastic Products’. |
Statement 12: Select financial ratios of the select 3,114 Public Limited Companies – Industry wise, 2005-06 to 2007-08 (Contd.) |
(Per cent) |
Industry / Industry group |
Cement and Cement Products (42) |
Iron and Steel (135) |
Fabricated Metal Products (86) |
Item |
2005-06 |
2006-07 |
2007-08 |
2005-06 |
2006-07 |
2007-08 |
2005-06 |
2006-07 |
2007-08 |
1 |
56 |
57 |
58 |
59 |
60 |
61 |
62 |
63 |
64 |
A. |
Capital structure ratios |
|
|
|
|
|
|
|
|
|
1. |
Net fixed assets to total net assets |
54.3 |
55.3 |
55.7 |
58.7 |
52.5 |
45.9 |
38.9 |
38.9 |
39.4 |
2. |
Net worth to total net assets |
36.2 |
39.8 |
41.3 |
32.1 |
32.7 |
37.3 |
31.7 |
34.5 |
37.9 |
3. |
Debt to equity |
92.0 |
81.5 |
68.5 |
103.2 |
104.4 |
82.1 |
79.7 |
71.1 |
52.3 |
4. |
Debt to equity (equity adjusted for revaluation reserve) |
105.7 |
88.2 |
72.1 |
105.6 |
108.8 |
84.1 |
82.0 |
72.4 |
54.1 |
5. |
Short term bank borrowings to inventories |
42.7 |
41.4 |
58.2 |
57.2 |
56.1 |
70.3 |
58.8 |
63.2 |
55.6 |
6. |
Total outside liabilities to net worth |
176.4 |
151.2 |
141.9 |
211.7 |
206.2 |
167.9 |
215.4 |
190.2 |
164.1 |
B. |
Liquidity ratios |
|
|
|
|
|
|
|
|
|
7. |
Current assets to current liabilities * |
1.2 |
1.3 |
1.1 |
1.0 |
1.4 |
1.6 |
1.4 |
1.4 |
1.3 |
8. |
Quick assets to current liabilities |
55.6 |
61.2 |
51.2 |
37.4 |
72.3 |
31.7 |
69.5 |
68.9 |
54.9 |
9. |
Current assets to total net assets |
37.1 |
35.2 |
34.3 |
34.5 |
44.8 |
48.0 |
58.3 |
57.0 |
54.8 |
10. |
Sundry creditors to current assets |
22.1 |
22.9 |
25.4 |
37.2 |
27.0 |
21.3 |
22.3 |
24.0 |
24.5 |
11. |
Sundry creditors to net working capital |
116.9 |
101.9 |
201.0 |
# |
93.1 |
59.4 |
83.7 |
84.9 |
105.1 |
C. |
Assets utilization and turnover ratios |
|
|
|
|
|
|
|
|
|
12. |
Sales to total net assets |
65.5 |
70.5 |
63.5 |
75.8 |
74.7 |
63.2 |
98.3 |
97.1 |
95.6 |
13. |
Sales to gross fixed assets |
74.7 |
82.8 |
79.0 |
93.6 |
103.1 |
101.7 |
165.9 |
169.8 |
170.4 |
14. |
Inventories to sales |
15.9 |
13.0 |
14.0 |
18.5 |
17.2 |
19.0 |
21.7 |
20.6 |
22.5 |
15. |
Sundry debtors to sales |
6.6 |
5.7 |
5.7 |
10.6 |
10.7 |
10.4 |
17.7 |
17.8 |
18.0 |
16. |
Exports to sales |
4.6 |
4.0 |
2.9 |
18.4 |
19.4 |
16.9 |
23.4 |
20.7 |
23.7 |
17. |
Gross value added to gross fixed assets |
18.7 |
28.7 |
29.1 |
21.6 |
25.5 |
26.3 |
29.6 |
32.2 |
32.2 |
18. |
Raw materials consumed to value of production |
20.0 |
17.8 |
17.1 |
53.9 |
52.3 |
55.2 |
65.9 |
66.0 |
66.0 |
D. |
Sources and uses of funds ratios @ |
|
|
|
|
|
|
|
|
|
| 19. |
Gross fixed assets formation to total uses of funds |
|
64.8 |
60.7 |
|
38.9 |
34.5 |
|
44.9 |
45.1 |
| 20. |
Gross capital formation to total uses of funds |
|
68.7 |
68.0 |
|
47.3 |
44.0 |
|
58.6 |
71.2 |
| 21. |
External sources of funds to total sources of funds |
|
46.1 |
50.7 |
|
64.2 |
70.8 |
|
60.7 |
56.7 |
| 22. |
Increase in bank borrowings to total external sources |
|
46.4 |
43.1 |
|
18.6 |
25.2 |
|
51.0 |
39.1 |
23. |
Gross savings to gross capital formation |
|
81.6 |
67.3 |
|
71.0 |
58.3 |
|
58.5 |
58.8 |
E. |
Profitability and profit allocation ratios |
|
|
|
|
|
|
|
|
|
24. |
Gross profits to total net assets |
9.6 |
17.6 |
17.5 |
11.3 |
13.0 |
11.8 |
10.4 |
12.1 |
12.0 |
25. |
Gross profits to sales |
14.7 |
25.0 |
27.6 |
14.9 |
17.5 |
18.6 |
10.6 |
12.5 |
12.6 |
26. |
Profits after tax to net worth |
19.3 |
29.1 |
28.1 |
20.1 |
21.5 |
18.0 |
19.3 |
19.7 |
20.4 |
27. |
Tax provision to profits before tax |
22.3 |
27.5 |
27.1 |
29.0 |
29.8 |
26.5 |
27.2 |
29.8 |
25.9 |
28. |
Profits retained to profits after tax |
80.9 |
85.3 |
85.7 |
79.4 |
81.8 |
83.0 |
80.4 |
81.4 |
84.7 |
29. |
Dividends to net worth |
3.7 |
4.3 |
4.0 |
4.1 |
3.9 |
3.1 |
3.8 |
3.7 |
3.1 |
30. |
Ordinary dividends to |
|
|
|
|
|
|
|
|
|
| |
ordinary paid-up capital |
25.9 |
35.5 |
46.6 |
24.7 |
30.2 |
35.9 |
20.3 |
24.6 |
25.8 |
Statement 12: Select financial ratios of the select 3,114 Public Limited Companies – Industry wise, 2005-06 to 2007-08 (Contd.) |
(Per cent) |
Industry / Industry group |
Machinery and Machine Tools (196) |
Electrical Machinery and Apparatus (112) |
Radio, Television and
Communication Equip. and Apparatus (54) |
Item |
2005-06 |
2006-07 |
2007-08 |
2005-06 |
2006-07 |
2007-08 |
2005-06 |
2006-07 |
2007-08 |
1 |
65 |
66 |
67 |
68 |
69 |
70 |
71 |
72 |
73 |
A. |
Capital structure ratios |
|
|
|
|
|
|
|
|
|
1. |
Net fixed assets to total net assets |
27.5 |
25.8 |
25.5 |
23.4 |
21.9 |
19.1 |
42.6 |
41.0 |
39.3 |
2. |
Net worth to total net assets |
44.7 |
44.6 |
43.4 |
42.9 |
43.4 |
45.1 |
36.8 |
35.9 |
36.1 |
3. |
Debt to equity |
18.4 |
21.3 |
23.1 |
30.5 |
24.6 |
26.6 |
36.1 |
38.9 |
59.8 |
4. |
Debt to equity (equity adjusted for revaluation reserve) |
18.9 |
21.8 |
23.5 |
31.1 |
24.9 |
26.8 |
65.1 |
62.6 |
81.0 |
5. |
Short term bank borrowings to inventories |
54.1 |
41.6 |
47.5 |
43.5 |
55.5 |
56.6 |
177.3 |
149.1 |
117.7 |
6. |
Total outside liabilities to net worth |
123.6 |
124.2 |
130.6 |
132.8 |
130.3 |
121.8 |
171.8 |
178.6 |
177.0 |
B. |
Liquidity ratios |
|
|
|
|
|
|
|
|
|
7. |
Current assets to current liabilities * |
1.4 |
1.5 |
1.4 |
1.6 |
1.5 |
1.5 |
1.1 |
1.1 |
1.2 |
8. |
Quick assets to current liabilities |
84.1 |
85.3 |
78.9 |
92.4 |
85.1 |
89.8 |
60.5 |
55.6 |
67.4 |
9. |
Current assets to total net assets |
66.7 |
67.6 |
66.5 |
69.5 |
69.3 |
65.4 |
52.1 |
55.3 |
50.5 |
10. |
Sundry creditors to current assets |
28.6 |
30.3 |
30.2 |
27.7 |
28.2 |
27.3 |
31.3 |
30.4 |
26.7 |
11. |
Sundry creditors to net working capital |
95.7 |
93.4 |
98.7 |
74.2 |
82.0 |
78.3 |
# |
273.6 |
149.1 |
C. |
Assets utilization and turnover ratios |
|
|
|
|
|
|
|
|
|
12. |
Sales to total net assets |
112.8 |
116.1 |
112.5 |
105.2 |
110.4 |
100.2 |
72.5 |
80.2 |
78.0 |
13. |
Sales to gross fixed assets |
210.7 |
235.1 |
240.4 |
249.7 |
292.5 |
318.2 |
111.1 |
125.2 |
122.8 |
14. |
Inventories to sales |
16.2 |
15.6 |
16.2 |
18.4 |
17.5 |
17.1 |
16.3 |
18.1 |
16.6 |
15. |
Sundry debtors to sales |
23.4 |
22.7 |
21.9 |
28.4 |
27.2 |
30.3 |
27.2 |
23.6 |
25.8 |
16. |
Exports to sales |
14.3 |
14.0 |
12.1 |
10.3 |
14.9 |
15.9 |
6.0 |
5.6 |
6.0 |
17. |
Gross value added to gross fixed assets |
44.5 |
50.5 |
51.7 |
51.8 |
60.4 |
67.8 |
17.7 |
21.1 |
21.1 |
18. |
Raw materials consumed to value of production |
63.2 |
64.0 |
64.2 |
65.3 |
66.8 |
66.7 |
65.4 |
70.3 |
69.0 |
D. |
Sources and uses of funds ratios @ |
|
|
|
|
|
|
|
|
|
19. |
Gross fixed assets formation to |
|
|
|
|
|
|
|
|
|
| |
total uses of funds |
|
28.3 |
32.2 |
|
21.3 |
16.1 |
|
44.9 |
38.6 |
20. |
Gross capital formation to |
|
|
|
|
|
|
|
|
|
| |
total uses of funds |
|
43.6 |
48.6 |
|
39.8 |
27.5 |
|
70.4 |
30.5 |
21. |
External sources of funds to |
|
|
|
|
|
|
|
|
|
| |
total sources of funds |
|
50.9 |
52.4 |
|
56.0 |
66.9 |
|
58.6 |
50.2 |
22. |
Increase in bank borrowings to |
|
|
|
|
|
|
|
|
|
| |
total external sources |
|
20.1 |
36.5 |
|
36.1 |
12.7 |
|
31.1 |
— |
23. |
Gross savings to gross capital formation |
|
111.0 |
95.4 |
|
109.2 |
110.8 |
|
62.5 |
170.4 |
E. |
Profitability and profit allocation ratios |
|
|
|
|
|
|
|
|
|
24. |
Gross profits to total net assets |
12.3 |
14.1 |
13.9 |
13.4 |
15.1 |
14.7 |
3.9 |
6.2 |
6.5 |
25. |
Gross profits to sales |
10.9 |
12.1 |
12.4 |
12.7 |
13.7 |
14.7 |
5.4 |
7.7 |
8.3 |
26. |
Profits after tax to net worth |
17.7 |
21.4 |
21.2 |
21.6 |
24.2 |
20.9 |
— |
15.4 |
7.0 |
27. |
Tax provision to profits before tax |
32.9 |
31.3 |
32.7 |
24.5 |
25.9 |
28.3 |
# |
17.0 |
32.4 |
28. |
Profits retained to profits after tax |
70.0 |
77.8 |
77.6 |
79.9 |
82.9 |
83.8 |
& |
88.8 |
73.7 |
29. |
Dividends to net worth |
5.3 |
4.8 |
4.7 |
4.3 |
4.1 |
3.4 |
1.4 |
1.7 |
1.9 |
30. |
Ordinary dividends to |
|
|
|
|
|
|
|
|
|
| |
ordinary paid-up capital |
33.2 |
35.5 |
40.9 |
30.9 |
37.5 |
43.3 |
10.3 |
13.2 |
13.9 |
Statement 12: Select financial ratios of the select 3,114 Public Limited Companies – Industry wise, 2005-06 to 2007-08 (Contd.) |
(Per cent) |
Industry / Industry group |
Motor Vehicles and other Transport Equipments (138) |
Construction (95) |
Wholesale and Retail Trade (155) |
Item |
2005-06 |
2006-07 |
2007-08 |
2005-06 |
2006-07 |
2007-08 |
2005-06 |
2006-07 |
2007-08 |
1 |
74 |
75 |
76 |
77 |
78 |
79 |
80 |
81 |
82 |
A. |
Capital structure ratios |
|
|
|
|
|
|
|
|
|
1. |
Net fixed assets to total net assets |
30.3 |
32.6 |
36.1 |
16.2 |
13.9 |
12.7 |
16.6 |
16.4 |
16.9 |
2. |
Net worth to total net assets |
43.0 |
43.7 |
42.0 |
30.9 |
30.8 |
32.7 |
34.3 |
31.8 |
30.4 |
3. |
Debt to equity |
30.3 |
31.3 |
32.2 |
42.0 |
56.4 |
45.6 |
36.6 |
53.7 |
43.0 |
4. |
Debt to equity (equity adjusted for revaluation reserve) |
30.7 |
32.0 |
32.8 |
42.6 |
57.3 |
46.1 |
37.2 |
54.8 |
43.7 |
5. |
Short term bank borrowings to inventories |
43.1 |
56.5 |
62.1 |
37.1 |
35.9 |
37.3 |
75.7 |
84.1 |
93.1 |
6. |
Total outside liabilities to net worth |
132.6 |
128.9 |
138.3 |
223.6 |
225.0 |
206.0 |
191.6 |
214.9 |
228.6 |
B. |
Liquidity ratios |
|
|
|
|
|
|
|
|
|
7. |
Current assets to current liabilities * |
1.2 |
1.2 |
1.1 |
1.3 |
1.5 |
1.5 |
1.4 |
1.5 |
1.3 |
8. |
Quick assets to current liabilities |
53.3 |
54.0 |
45.7 |
48.0 |
44.3 |
40.5 |
88.4 |
81.7 |
63.8 |
9. |
Current assets to total net assets |
53.5 |
52.3 |
46.6 |
74.2 |
75.1 |
76.0 |
74.5 |
74.5 |
72.4 |
10. |
Sundry creditors to current assets |
32.2 |
33.5 |
36.1 |
20.0 |
16.4 |
15.1 |
36.1 |
31.8 |
33.7 |
11. |
Sundry creditors to net working capital |
172.7 |
169.7 |
# |
81.8 |
52.6 |
48.3 |
125.5 |
101.2 |
152.7 |
C. |
Assets utilization and turnover ratios |
|
|
|
|
|
|
|
|
|
12. |
Sales to total net assets |
133.6 |
133.9 |
116.8 |
67.7 |
58.5 |
56.2 |
202.0 |
180.9 |
158.4 |
13. |
Sales to gross fixed assets |
231.1 |
234.0 |
201.3 |
290.8 |
312.9 |
336.6 |
# |
# |
# |
14. |
Inventories to sales |
11.4 |
10.9 |
12.5 |
38.3 |
50.3 |
51.8 |
8.5 |
10.1 |
13.0 |
15. |
Sundry debtors to sales |
8.3 |
8.0 |
8.1 |
22.2 |
23.4 |
26.4 |
16.7 |
13.7 |
13.1 |
16. |
Exports to sales |
8.2 |
8.1 |
8.2 |
1.7 |
2.1 |
1.5 |
16.5 |
15.7 |
19.2 |
17. |
Gross value added to gross fixed assets |
42.3 |
40.6 |
36.0 |
65.5 |
88.6 |
96.3 |
63.3 |
64.5 |
62.9 |
18. |
Raw materials consumed to value of production |
66.4 |
68.4 |
68.0 |
38.2 |
38.7 |
34.1 |
89.8 |
89.0 |
86.7 |
D. |
Sources and uses of funds ratios @ |
|
|
|
|
|
|
|
|
|
19. |
Gross fixed assets formation to total uses of funds |
|
47.5 |
54.6 |
|
12.6 |
12.5 |
|
18.1 |
23.1 |
20. |
Gross capital formation to total uses of funds |
|
58.2 |
68.0 |
|
45.7 |
39.9 |
|
38.1 |
50.9 |
21. |
External sources of funds to total sources of funds |
|
55.3 |
58.1 |
|
87.4 |
79.8 |
|
89.3 |
83.9 |
22. |
Increase in bank borrowings to total external sources |
|
31.3 |
27.4 |
|
25.0 |
23.1 |
|
29.2 |
34.0 |
23. |
Gross savings to gross capital formation |
|
81.7 |
59.2 |
|
30.0 |
42.0 |
|
38.7 |
36.4 |
E. |
Profitability and profit allocation ratios |
|
|
|
|
|
|
|
|
|
24. |
Gross profits to total net assets |
13.8 |
14.3 |
11.8 |
7.4 |
9.7 |
9.4 |
9.8 |
8.5 |
7.7 |
25. |
Gross profits to sales |
10.4 |
10.7 |
10.1 |
10.9 |
16.5 |
16.8 |
4.8 |
4.7 |
4.8 |
26. |
Profits after tax to net worth |
23.2 |
22.1 |
19.4 |
14.7 |
18.9 |
16.9 |
13.0 |
13.0 |
12.6 |
27. |
Tax provision to profits before tax |
31.1 |
28.9 |
26.5 |
23.3 |
27.2 |
27.6 |
34.6 |
30.4 |
33.7 |
28. |
Profits retained to profits after tax |
71.5 |
74.2 |
75.8 |
86.9 |
89.8 |
90.6 |
50.2 |
75.2 |
74.7 |
29. |
Dividends to net worth |
6.6 |
5.7 |
4.7 |
1.9 |
1.9 |
1.6 |
6.5 |
3.2 |
3.2 |
30. |
Ordinary dividends to ordinary paid-up capital |
67.3 |
66.8 |
66.8 |
19.1 |
20.2 |
20.5 |
32.1 |
17.8 |
20.7 |
Statement 12: Select financial ratios of the select 3,114 Public Limited Companies – Industry wise, 2005-06 to 2007-08 (Contd.) |
(Per cent) |
Industry / Industry group |
Hotels and Restaurants (58) |
Transport, Storage and Communications (90) |
Real Estate Activities (32) |
Item |
2005-06 |
2006-07 |
2007-08 |
2005-06 |
2006-07 |
2007-08 |
2005-06 |
2006-07 |
2007-08 |
1 |
83 |
84 |
85 |
86 |
87 |
88 |
89 |
90 |
91 |
A. |
Capital structure ratios |
|
|
|
|
|
|
|
|
|
1. |
Net fixed assets to total net assets |
68.0 |
69.7 |
68.6 |
53.9 |
56.2 |
57.4 |
15.4 |
15.3 |
13.0 |
2. |
Net worth to total net assets |
47.2 |
52.8 |
50.6 |
37.1 |
31.6 |
31.4 |
24.1 |
38.3 |
52.1 |
3. |
Debt to equity |
61.0 |
46.7 |
55.0 |
91.5 |
120.4 |
125.3 |
68.9 |
43.6 |
31.0 |
4. |
Debt to equity (equity adjusted for revaluation reserve) |
70.7 |
60.9 |
68.1 |
93.2 |
122.3 |
149.6 |
76.5 |
45.1 |
31.4 |
5. |
Short term bank borrowings to inventories |
121.2 |
155.7 |
110.3 |
# |
# |
# |
80.4 |
80.4 |
62.3 |
6. |
Total outside liabilities to net worth |
111.7 |
89.2 |
97.6 |
169.9 |
216.5 |
218.1 |
315.8 |
161.0 |
91.8 |
B. |
Liquidity ratios |
|
|
|
|
|
|
|
|
|
7. |
Current assets to current liabilities * |
1.0 |
1.0 |
1.1 |
1.2 |
1.1 |
1.0 |
1.0 |
1.3 |
2.0 |
8. |
Quick assets to current liabilities |
47.6 |
51.8 |
61.5 |
59.3 |
49.1 |
45.3 |
36.6 |
42.7 |
63.7 |
9. |
Current assets to total net assets |
22.8 |
21.9 |
23.5 |
33.6 |
32.9 |
28.8 |
58.3 |
57.5 |
63.4 |
10. |
Sundry creditors to current assets |
18.5 |
17.1 |
15.7 |
22.8 |
27.2 |
26.6 |
18.7 |
15.8 |
12.9 |
11. |
Sundry creditors to net working capital |
# |
# |
170.3 |
164.7 |
343.4 |
# |
# |
72.4 |
25.7 |
C. |
Assets utilization and turnover ratios |
|
|
|
|
|
|
|
|
|
12. |
Sales to total net assets |
38.7 |
39.8 |
37.5 |
42.4 |
43.6 |
38.2 |
44.3 |
40.4 |
37.7 |
13. |
Sales to gross fixed assets |
44.5 |
46.0 |
44.8 |
55.9 |
55.4 |
50.8 |
195.7 |
204.0 |
229.3 |
14. |
Inventories to sales |
4.1 |
3.4 |
3.3 |
2.5 |
2.2 |
2.2 |
32.1 |
23.5 |
27.2 |
15. |
Sundry debtors to sales |
11.4 |
12.6 |
14.6 |
12.4 |
13.0 |
13.3 |
43.0 |
34.3 |
38.0 |
16. |
Exports to sales |
0.7 |
2.1 |
1.4 |
0.1 |
0.1 |
0.7 |
6.6 |
3.4 |
5.8 |
17. |
Gross value added to gross fixed assets |
24.7 |
26.8 |
26.7 |
17.4 |
15.8 |
15.7 |
61.2 |
75.8 |
84.8 |
18. |
Raw materials consumed to value of production |
5.3 |
4.1 |
4.1 |
3.3 |
4.0 |
3.3 |
23.0 |
16.8 |
20.5 |
D. |
Sources and uses of funds ratios @ |
|
|
|
|
|
|
|
|
|
19. |
Gross fixed assets formation to total uses of funds |
|
66.9 |
64.8 |
|
66.0 |
56.8 |
|
16.1 |
9.8 |
20. |
Gross capital formation to total uses of funds |
|
67.2 |
65.9 |
|
66.5 |
57.4 |
|
19.6 |
21.3 |
21. |
External sources of funds to total sources of funds |
|
25.4 |
59.1 |
|
86.0 |
84.2 |
|
84.4 |
77.3 |
22. |
Increase in bank borrowings to total external sources |
|
81.4 |
13.8 |
|
49.0 |
35.4 |
|
15.9 |
7.9 |
23. |
Gross savings to gross capital formation |
|
107.2 |
58.3 |
|
31.6 |
35.3 |
|
74.5 |
97.0 |
E. |
Profitability and profit allocation ratios |
|
|
|
|
|
|
|
|
|
24. |
Gross profits to total net assets |
12.4 |
14.8 |
14.3 |
3.3 |
3.1 |
3.6 |
7.9 |
10.3 |
9.8 |
25. |
Gross profits to sales |
32.0 |
37.2 |
38.2 |
7.8 |
7.0 |
9.4 |
17.8 |
25.4 |
26.1 |
26. |
Profits after tax to net worth |
16.0 |
16.3 |
16.4 |
2.7 |
2.1 |
4.2 |
41.9 |
17.8 |
14.4 |
27. |
Tax provision to profits before tax |
28.4 |
32.1 |
34.3 |
52.0 |
53.3 |
28.6 |
11.7 |
23.5 |
22.5 |
28. |
Profits retained to profits after tax |
72.2 |
76.6 |
76.7 |
13.7 |
? |
59.4 |
90.9 |
86.2 |
87.6 |
29. |
Dividends to net worth |
4.4 |
3.8 |
3.8 |
2.3 |
2.3 |
1.7 |
3.8 |
2.5 |
1.8 |
30. |
Ordinary dividends to ordinary paid-up capital |
20.1 |
22.0 |
24.7 |
4.0 |
4.1 |
4.0 |
14.9 |
24.0 |
26.8 |
Statement 12: Select financial ratios of the select 3,114 Public Limited Companies – Industry wise, 2005-06 to 2007-08 (Concld.) |
(Per cent) |
Industry / Industry group |
Computer and Related Activities
(178) |
All Industries
(3114) |
Item |
2005-06 |
2006-07 |
2007-08 |
2005-06 |
2006-07 |
2007-08 |
1 |
92 |
93 |
94 |
95 |
96 |
97 |
A. |
Capital structure ratios |
|
|
|
|
|
|
1. |
Net fixed assets to total net assets |
18.7 |
18.1 |
18.2 |
42.8 |
39.8 |
38.5 |
2. |
Net worth to total net assets |
71.8 |
73.1 |
66.4 |
42.1 |
42.0 |
42.9 |
3. |
Debt to equity |
5.4 |
6.9 |
13.7 |
46.1 |
47.8 |
44.4 |
| 4. |
Debt to equity (equity adjusted for revaluation reserve) |
5.4 |
6.9 |
13.8 |
48.7 |
49.8 |
46.2 |
5. |
Short term bank borrowings to inventories |
194.2 |
242.5 |
# |
76.4 |
77.2 |
83.9 |
6. |
Total outside liabilities to net worth |
39.2 |
36.7 |
50.6 |
137.3 |
137.9 |
133.0 |
B. |
Liquidity ratios |
|
|
|
|
|
|
7. |
Current assets to current liabilities * |
2.7 |
2.8 |
2.5 |
1.2 |
1.3 |
1.3 |
8. |
Quick assets to current liabilities |
211.3 |
216.3 |
177.6 |
59.5 |
61.1 |
53.9 |
9. |
Current assets to total net assets |
63.2 |
58.4 |
58.8 |
46.9 |
48.5 |
48.1 |
10. |
Sundry creditors to current assets |
9.6 |
8.1 |
8.8 |
26.9 |
25.9 |
25.1 |
11. |
Sundry creditors to net working capital |
15.4 |
12.7 |
14.7 |
142.4 |
113.5 |
114.1 |
C. |
Assets utilization and turnover ratios |
|
|
|
|
|
|
12. |
Sales to total net assets |
83.1 |
81.4 |
74.0 |
84.9 |
84.1 |
76.5 |
13. |
Sales to gross fixed assets |
263.1 |
277.1 |
262.4 |
128.0 |
139.0 |
135.0 |
14. |
Inventories to sales |
1.4 |
1.2 |
1.6 |
15.6 |
15.7 |
17.1 |
15. |
Sundry debtors to sales |
27.2 |
26.3 |
26.9 |
15.0 |
14.5 |
15.0 |
16. |
Exports to sales |
1.8 |
1.6 |
2.2 |
16.4 |
18.6 |
19.4 |
17. |
Gross value added to gross fixed assets |
177.1 |
189.8 |
175.9 |
29.6 |
33.7 |
33.9 |
18. |
Raw materials consumed to value of production |
8.6 |
8.3 |
9.9 |
54.9 |
54.7 |
54.5 |
D. |
Sources and uses of funds ratios @ |
|
|
|
|
|
|
| 19. |
Gross fixed assets formation to total uses of funds |
|
23.0 |
22.8 |
|
34.9 |
38.7 |
20. |
Gross capital formation to total uses of funds |
|
23.6 |
24.5 |
|
47.0 |
50.5 |
| 21. |
External sources of funds to total sources of funds |
|
67.9 |
49.9 |
|
66.9 |
63.1 |
| 22. |
Increase in bank borrowings to total external sources |
|
3.3 |
26.8 |
|
33.1 |
32.5 |
23. |
Gross savings to gross capital formation |
|
211.8 |
178.8 |
|
80.5 |
69.2 |
E. |
Profitability and profit allocation ratios |
|
|
|
|
|
|
24. |
Gross profits to total net assets |
17.8 |
18.9 |
17.3 |
10.4 |
11.9 |
11.4 |
25. |
Gross profits to sales |
21.5 |
23.2 |
23.4 |
12.2 |
14.1 |
14.9 |
26. |
Profits after tax to net worth |
20.4 |
22.5 |
21.3 |
16.1 |
18.5 |
17.5 |
27. |
Tax provision to profits before tax |
17.6 |
12.9 |
18.1 |
25.7 |
24.9 |
24.8 |
28. |
Profits retained to profits after tax |
56.6 |
76.4 |
69.6 |
72.8 |
79.1 |
79.9 |
29. |
Dividends to net worth |
8.9 |
5.3 |
6.5 |
4.4 |
3.9 |
3.5 |
30. |
Ordinary dividends to ordinary paid-up capital |
87.6 |
66.6 |
84.4 |
25.6 |
26.7 |
30.6 |
Appendix
Explanatory notes to various statements
- Internal Sources: These are own sources comprising capitalized reserves, retained profits, depreciation provision and other provisions.
- External Sources: These are other than own sources comprising funds raised from capital markets, borrowed funds, trade dues and other current liabilities and miscellaneous non-current liabilities.
- The growth rates of all the items and data on sources and uses of funds are adjusted for changes due to amalgamation of companies. These are also adjusted for revaluation, etc., wherever necessary.
- Due to rounding off of figures, the constituent items may not add up to the totals.
- Sales are net of ‘rebates and discounts’ and ‘excise duty and cess’.
- Manufacturing expenses comprise (a) raw materials, components, etc. consumed, (b) stores and spares consumed, (c) power and fuel and (d) other manufacturing expenses.
- Raw materials, components, etc., consumed includes purchases of traded goods in the case of trading companies and consumption of stores and provisions for hotels, restaurants and eating houses.
- Other manufacturing expenses include expenses like construction expenses of construction companies, operating expenses of shipping companies, etc.
- Remuneration to employees comprises (a) salaries, wages and bonus, (b) provident fund and (c) employees’ welfare expenses.
- Non-operating surplus/deficit comprises (a) profit/loss on account of sale of fixed assets, investments, etc., (b) provisions no longer required written back, (c) insurance claims realised and (d) income or expenditure relating to the previous years and such other items of non-current nature.
- Gross profits are net of depreciation provision but before interest.
- Gross saving is measured as the sum of retained profits and depreciation provision.
- Gross value added comprises (a) net value added and (b) depreciation provision.
- Net value added comprises (a) salaries, wages and bonus, (b) provident fund, (c) employees’ welfare expenses, (d) managerial remuneration, (e) rent paid net of rent received, (f) interest paid net of interest received, (g) tax provision, (h) dividends paid net of dividends received and (i) retained profits net of non-operating surplus/deficit.
- Debt comprises (a) all borrowings from Government and semi-Government bodies, financial institutions other than banks, and from foreign institutional agencies, (b) borrowings from banks against mortgages and other long term securities, (c) borrowings from companies and others against mortgages and other long term securities, (d) debentures, deferred payment liabilities and public deposits.
- Equity or Net worth comprises (a) paid-up capital, (b) forfeited shares and (c) all reserves and surplus.
- Current assets comprise (a) inventories, (b) loans and advances and other debtor balances, (c) book value of quoted investments, (d) cash and bank balances and (e) advance of income-tax in excess of tax provision.
- Current liabilities comprise (a) short term borrowings from banks, (b) unsecured loans and other short term borrowings from companies and others, (c) trade dues and other current liabilities and (d) tax provision in excess of advance of income-tax and other current provisions.
- Quick assets comprise (a) sundry debtors, (b) book value of quoted investments and (c) cash and bank balances.
- Capital reserves include profits on sale of investments and fixed assets.
- Other reserves include profits retained in the form of various specific reserves and profit/loss carried to balance sheet.
- Debentures include privately placed debentures with financial institutions.
|