| This article undertakes a review and an assessment of the finances of the Central Government during April-September 2007. The Union Budget 2007-08 committed to further strengthen the path of fiscal consolidation stipulated under the Fiscal Responsibility and Budget Management (FRBM) Rules, 2004 in 2007-08, with the continued strategy of revenue-led correction along with desired reallocation of expenditure. The Central Government finances during the first half of 2007-08 showed that all the key deficit indicators, viz., revenue deficit (RD), gross fiscal deficit (GFD) and Primary Deficit (PD), both in absolute terms as well as per cent of GDP, were lower than a year ago. However, due to greater front loading of expenditure vis-à-vis revenue receipts, the Central Government missed the envisaged half yearly target for revenue and fiscal deficit stipulated under FRBM Rules, 2004.
Finances of the Central Government1 during the first half of the current fiscal year (April-September 2007) indicate improvement in all the key deficit indicators, both in absolute terms as well as per cent of GDP, over the corresponding period of the preceding year. As per cent of budget estimates, while GFD and PD were lower than last year, RD was higher due to a combination of expenditure pressure and budgeted absolute reduction in the deficit. Despite some moderation, growth in revenue receipts was high supported by buoyant tax collections as well as higher non-tax revenue. Growth in revenue expenditure decelerated though there were expenditure pressures on account of higher interest payments and expenditure on major subsidies and grants to States and Union Territories. Expenditure on rural development, health and family welfare, school education and literacy etc., in the first half of the financial year also contributed to higher revenue expenditure. Capital expenditure witnessed a positive growth as against decline in preceding year on account of higher loans and advances as well as non-defence capital outlay. Despite the continued revenue buoyancy of the Central Government, the envisaged half yearly Fiscal Responsibility and Budget Management targets for revenue and fiscal deficit stipulated under the FRBM Rules, 2004 could not be met due to greater front-loading of expenditure vis-à-vis revenue receipts. Major Trends
A. Deficit Indicators
The Union Budget for 2007-08 continued the process of fiscal consolidation as per the FRBM Rules, 2004 and the revenue deficit was budgeted to decline by 0.5 per cent of GDP to Rs.71,478 crore (1.5 per cent of GDP) in 2007-08. During the first half of 2007-08, the revenue deficit at Rs.61,124 crore formed 85.5 per cent of the budget estimates (BE) as against 81.8 per cent during April-September 2006 (Statement 1). The trends in RD as a per cent of BE during the first half of 2007-08, however, indicate that it was much higher than the corresponding period of previous two years and peaked in August (123.0 per cent of BE) primarily due to expenditure pressure emanating from interest payments, subsidies, grants to States/UTs and other economic services. By the end-September, however, RD came down close to the level of the preceding year (Chart 1). As per cent of GDP, during April-September 2007, revenue deficit at 1.3 per cent of GDP was lower than the corresponding period of the preceding year (1.7 per cent). 
During 2007-08, GFD was budgeted to decline by 0.4 per cent of GDP (more than the minimum reduction of 0.3 per cent of GDP stipulated under the FRBM Rules, 2004) to Rs.1,50,948 crore (3.3 per cent of GDP). During the first half of 2007-08, GFD at Rs.79,977 crore was 53.0 per cent of the budget estimates, lower than 58.2 per cent a year ago. Up to the months of July and August, it, however, was higher due to increase in revenue deficit mentioned earlier (Statement 1 and Chart 2)2 . In absolute terms, GFD declined by 7.5 per cent as against an increase of 3.1 per cent during the corresponding half of the previous year. The decline in GFD was on account of pick up in revenue buoyancy since August 2007 combined with some moderation in expenditure. Consequently, GFD as per cent of GDP at 1.7 per cent during April-September 2007 was lower than that of 2.1 per cent during the corresponding period of the previous year . 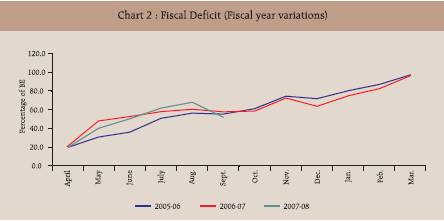
Gross primary deficit during the first half of 2007-08 stood at Rs.7,157 crore as against the envisaged surplus of Rs. 8,047 crore in 2007-08 (BE). However, it showed a decline of 68.1 per cent from the corresponding period of the previous year (Statement 1 and Chart 3). 
B. Revenue Position
During April-September 2007-08, revenue receipts at Rs.1,97,956 crore, registered an increase of 22.6 per cent, lower than 31.4 per cent recorded during April-September 2006. The moderation in revenue receipts growth was on account of deceleration in tax revenue, as non-tax revenue accelerated marginally (Statement 1). As per cent of BE, revenue receipts constituted 40.7 per cent as against 40.0 per cent in the first half of the previous year (Chart 4). 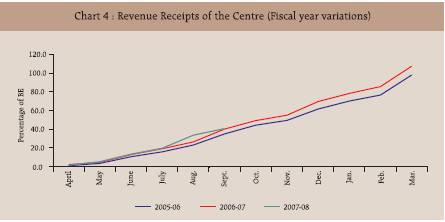
Tax Revenue
Growth of gross tax collection of the Centre during April-September 2007 decelerated to 24.5 per cent from 30.5 per cent during the corresponding period of the previous year. As per cent of BE, at 40.8 per cent it was marginally higher than 40.6 per cent during April-September 2006. On the other hand, assignment of taxes to States/UTs increased by 27.0 per cent as against the increase of 19.4 per cent during corresponding period of previous year (Statement 2). Net tax revenue to the Centre after adjusting for the assignment to States/ UTs and surcharge for financing National Calamity Contingency Fund (NCCF) showed a growth rate of 23.5 per cent during April-September 2007 compared to 35.1 per cent in the corresponding period of the previous year. It accounted for 39.7 per cent of BE, same as in April-September 2006 (Chart 5).
Among the major taxes, corporation tax, income tax and custom duties registered impressive growth during the first half of 2007-08, though, barring for income tax, there were deceleration from the corresponding period of last year. Propelled by the growth of its major component viz., taxes on income other than corporation tax (35.3 per cent), income tax witnessed a growth of 38.2 per cent as compared with 29.1 per cent in the corresponding period of the previous year. All the other remaining components of income tax, with the exception of fringe benefit tax, experienced moderation in growth from a high level during the corresponding period of last year. Corporation tax showed growth of 38.6 per cent as compared with 49.2 per cent a year ago. All the indirect taxes recorded a much lower growth as compared with the corresponding period of last year. Among these indirect taxes, customs duties and service tax despite the deceleration, however, continued to show reasonably high growth rates of 15.9 per cent and 37.2 per cent, respectively, which were on top of growth rates of 32.7 per cent and 63.8 per cent in the corresponding period of the previous year. The Union excise duties continued to show subdued growth of only 3.4 per cent, decelerating further from 7.4 per cent growth recorded during April-September 2006 (Statement 2). It may thus be noted that growth in all the indirect taxes during the first half of 2007-08 not only decelerated but also recorded growths lower than those envisaged for the full year, while all direct taxes, barring banking cash transaction tax, in contrast, recorded significantly higher growth rates.
Non-Tax Revenue
Non-tax revenue at Rs.37,456 crore accelerated to 19.2 per cent in April-September 2007 compared to 18.1 per cent in the corresponding period of previous year, mainly on account of higher interest receipts and dividends and profits. Dividends and profits at Rs.18,062 crore showed an increase of Rs.3,844 crore, interest receipts ( Rs.8,318 crore) an increase of Rs.2,021 crore and 'other non-tax revenue' (Rs.10,720 crore) an increase of Rs.137 crore. 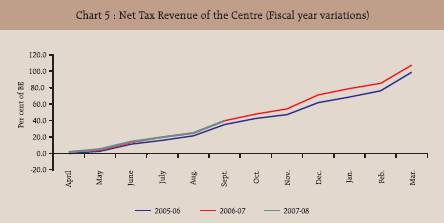
C. Non-Debt Capital Receipts
Non-debt capital receipts comprising recovery of loans and other receipts at Rs 4,428 crore recorded a growth of 8.6 per cent during April-September 2007 as against decline of 5.1 per cent during the corresponding period of 2006. As per cent of budget estimates, non-debt capital receipts were 140.5 per cent in April-September 2007 as compared with 34.4 per cent a year ago. The Union Government in the Budget for 2007-08 announced that it would acquire the Reserve Bank's stake in SBI. Accordingly, during the year, Reserve Bank's entire equity holding in State Bank of India of 31,43,39,200 shares (Book value Rs.1,222.73 crore) was transferred to the Government of India at market rate, resulting in a profit of Rs.34,308.6 crore (Box 1). D. Expenditure Pattern
As envisaged in BE, aggregate expenditure during April-September 2007, at Rs.2,82,361 crore, registered a lower growth of 12.1 per cent than 19.4 per cent a year ago. As per cent of BE also, it was marginally lower at 44.1 per cent as against 44.7 per cent in April-September 2006 (Chart 6).

Plan Expenditure
Plan expenditure at Rs.86,758 crore increased by 26.0 per cent, much higher than 15.9 per cent a year ago. As per cent of the BE also, at 42.3 per cent, it was higher than 39.9 per cent in the preceding year (Statement 1 and Chart 7). The higher increase in Plan expenditure was due to expenditure towards road transport and highways, grants to States and Union Territories and rural development (Table 1).
Within total plan expenditure, the revenue component during the first half of 2007-08, at Rs.71,571 crore, recorded marginally lower growth, constituting 41.0 per cent of BE as against 40.2 per cent in the corresponding period of the previous year. The increase in plan revenue expenditure by Rs.13,814 crore was primarily on account of grants to States and Union Territories and other economic services. On the other hand, capital component at Rs. 15,187 crore increased by 36.5 per cent as against a decline of 16.3 per cent (Table 2 and Statement 2). Non-Plan Expenditure
Non-Plan expenditure, at Rs.1,95,603 crore during April-September 2007, also registered a substantially lower growth of 6.8 per cent than 20.8 per cent in the corresponding period of the previous year (Chart 8). As per cent of budget estimates, it stood at 44.9 per cent during the period under review as against 46.8 per cent a year ago. The deceleration in non-plan expenditure came from decline in the revenue component under grants to States/UTs and non-plan capital expenditure (Statement 1).
All the other remaining major items of non-plan revenue expenditure, however, increased during the first six months of the current fiscal year as compared with the corresponding period of the previous year (Table 2). Interest payments and defence expenditure constituted 53.3 per cent of non-plan expenditure in April-September 2007-08 as compared with 52.5 per cent in corresponding period of the previous year (Chart 9). During the first half of 2007-08, increase in expenditure on major subsidies by Rs.6,093 crore was primarily due to increase in fertiliser subsidies, viz., on indigenous fertiliser (Rs.3,484 crore), imported fertiliser (Rs.1,878 crore) and decontrolled fertiliser (Rs.2,316 crore). Capital Outlay
Capital outlay during the period under review, at Rs.18,278 crore, increased by 1.7 per cent as compared with a decline of 5.5 per cent in the preceding year. While the non-defence capital outlay was higher by 36.4 per cent, defence capital outlay declined by 34.9 per cent from its level in April-September 2006 (Table 2).
E. Financing of Gross Fiscal Deficit
The net outgo of funds from the autonomous sources of financing GFD such as national small savings fund and other capital receipts increased significantly from the corresponding half of the previous year. Consequently, market borrowings constituted 107.1 per cent of GFD of Rs. 81,2003 crore during April-September, 2007, as against 69.8 per cent a year ago. Short term borrowing met 14.3 per cent of GFD, as compared with 5.0 per cent in corresponding period 
Box 1: Acquisition of Reserve Bank of India Share Holding in State Bank of India by Government of India The Committee on Banking Sector Reforms (Chairman: Shri M. Narasimham) had recommended that the Reserve Bank should not own the institutions it regulates due to conflict of interest. Consequently an internal Group was set up by the Reserve Bank in 2001 to finalise the modalities of transfer of its investment in State Bank of India, NABARD and NHB and the Group's Report was forwarded to the Government for necessary action. The Central Government had announced in the Union Budget 2007-08 their proposal for acquisition of Reserve Bank's stake in SBI and an amount of Rs.40,000 crore was provided in the Budget. An ordinance was promulgated on June 21, 2007 for certain amendments in SBI Act to enable transfer of shares from Reserve Bank to Government. The treatment of expenditure and receipts of SBI transaction in the budget are: expenditure amounting of Rs.40,000 crore was budgeted under the head 'investments in general financial and trading institutions'; on the receipts side, under 'other capital receipts' the RBI would make one time transfer of equal amount of proceeds (Rs.40,000 crore) on account of transfer of its stake in SBI to the Government of India. Since the capital expenditure ensuing from the above transactions was to be matched by an equivalent amount of non-debt capital receipts, the transaction was treated neutral to gross fiscal deficit (GFD), revenue deficit (RD) and debt. Accordingly, 31,43,39,200 shares which were held by the Reserve Bank were sold to the Government of India (GOI) on June 29, 2007 at the rate of Rs.1130.35 per share constituting the acquisition cost amounting to Rs.35,531 crore. Consequently, Government of India had made one time capital expenditure of Rs. 35,531 crore. The resultant increase in gross fiscal deficit of this transaction was largely neutralised in the month of August 2007 through one time transfer of surplus from the RBI of Rs. 34,308 crore to the Union Government, which is the cost of acquisition less the book value of shares i.e., Rs1,223 crore. As announced in the budget the surplus transfer on account of transfer of RBI stake in SBI to the GOI was included under 'other capital receipts', by the Controller General of Accounts (CGA) in its release of October 31, 2007 on summary information for the Central Government's Accounts for April-September 2007. Thereby the transactions are revenue deficit neutral and had a minimal impact on gross fiscal deficit to the extent of the book value of the shares (Rs.1,223 crore).
Table 2: Expenditure of the Centre |
(Rupees crore) |
Itam |
April-September |
Variation |
2007 |
2006 |
Amount |
Per cent |
1 |
2 |
3 |
4 |
5 |
A. |
Revenue Expenditure |
259080 |
230683 |
28397 |
12.3 |
|
Non-Plan Revenue Expenditure |
187509 |
172926 |
14583 |
8.4 |
|
Interest Payments |
72820 |
64003 |
8817 |
13.8 |
|
Major Subsidies |
34954 |
28861 |
6093 |
21.1 |
|
Defence Revenue |
25817 |
23354 |
2463 |
10.5 |
|
Pension |
10685 |
9507 |
1178 |
12.4 |
|
Grants to States/UTs |
16673 |
18289 |
-1616 |
-8.8 |
|
Plan Revenue Expenditure |
71571 |
57757 |
13814 |
23.9 |
|
Social Services |
13508 |
12759 |
749 |
5.9 |
|
Grants to States /UTs |
29733 |
21850 |
7883 |
36.1 |
|
Other Economic Services |
28255 |
23068 |
5187 |
22.5 |
B. |
Capital Expenditure |
23281* |
21261 |
2020 |
9.5 |
|
Loans & Advances |
5003 |
3290 |
1713 |
52.1 |
|
Non-Defence Capital Outlay |
12584* |
9228 |
3356 |
36.4 |
|
Defence Capital Outlay |
5694 |
8743 |
-3049 |
-34.9 |
C. |
Total Expenditure |
282361* |
251944 |
30417 |
12.1 |
*: Net of SBI transactions. |
|
|
|
|
of the previous year. The remaining financing gap of 25.0 per cent of GFD was met through draw down of cash balances with the RBI (Table 3). F. Cash Management 4
The Central Government had maintained a surplus of Rs. 50,092 crore (investment of Rs. 20,000 crore and cash balance of Rs. 30,092 crore) at the beginning of the year largely as a result of investment of the State Governments' cash surplus of Rs. 39,217 crore in the 14-day Intermediate Treasury Bills (ITBs) of the Central Government. However, the Centre's cash balances eroded rapidly during April 2007, and turned into a deficit by April 27, 2007, reflecting a sharp reduction in the holding of Central Government Treasury Bills by the States on account of higher than anticipated spending and lower collections under the National Small Savings Fund (NSSF), which persisted till June 17, 2007. With the transfer of RBI stake in SBI to the Central Government involving a cash outgo of Rs. 35,531 crore, Central Government cash balances again fell into a deficit mode from June 29, 2007 to August 8, 2007. Subsequently, following the transfer of RBI surplus on August 9, 2007, cash balance of Central Government returned to a surplus mode. With the fluctuating cash balances position, upto end-September, 2007, the Government availed WMA on 90 days and resorted to overdraft on three occasions, as against 39 days and none, respectively in the corresponding period of previous year. As on September 29, 2007, however, the Central Government had built up cash surplus of Rs. 31,814 crore (including investment of Rs. 20,000 crore) of which the State Governments' cash surplus invested in 14-day ITBs being Rs. 34,734 crore. 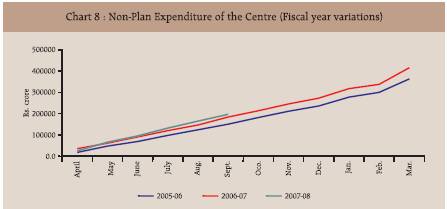
G. Progress in Achieving the FRBM Targets for the first Half of 2006-07
With the continued buoyancy of revenue receipts, the half yearly non-debt receipts as a per cent of BE stood at 44.8 per cent, exceeding the FRBM target of no less than 40 per cent. However, due to expenditure pressure emanating from revenue account, the half yearly revenue deficit (85.5 per cent) and fiscal deficit (53.8 per cent) were higher than the stipulated FRBM targets of not more than 45 per cent of BE (Table 4). Higher expenditure on fertiliser subsidies, interest payments as a result of higher borrowing under market stabilisation scheme and front loading of expenditure in respect of departments like rural development, department of road transport and highways were the prime reason for the considerable slippage in revenue deficit. 
Table 3: Sources of Financing GFD: April-September, 2007-08 and 2006-07 |
(Rupees crore) |
|
|
2007-08 |
2006-07 |
|
|
Amount |
Share (%) |
Amount |
Share (%) |
1 |
Gross Fiscal Deficit* |
81,200 |
100.0 |
86,461 |
100.0 |
2 |
Market Borrowings (dated securities and 364-day T-Bills) |
86,960 |
107.1 |
60,328 |
69.8 |
3 |
Short-Term Borrowings (91 and 182-day T-Bills) |
11,583 |
14.3 |
4,337 |
5.0 |
4 |
14-day Intermediate T-Bills |
-4,422 |
-5.4 |
4,700 |
5.4 |
5 |
Sate Provident Funds |
191 |
0.2 |
471 |
0.5 |
6 |
National Small Saving Fund (Net) |
-13,891 |
-17.1 |
2,381 |
2.8 |
7 |
Special Deposits |
865 |
1.1 |
-228 |
-0.3 |
8 |
Securities against Small Savings |
-545 |
-0.7 |
-394 |
-0.5 |
9 |
Deposit Scheme for Retiring Employees |
-254 |
-0.3 |
-220 |
-0.3 |
10 |
External Assistance |
2,478 |
3.1 |
2,433 |
2.8 |
11 |
Others |
-22,025 |
-27.1 |
-11,820 |
-13.7 |
|
Of which: |
|
|
|
|
|
i. Suspense and Remittances |
-5,551 |
-6.8 |
-7,703 |
-8.9 |
|
ii. Other Capital Receipts |
-16,475 |
-20.3 |
-4,115 |
-4.8 |
|
Of which: |
|
|
|
|
|
(a) Compensation and other Bonds |
-4,662 |
-5.7 |
-4,123 |
-4.8 |
|
(b) Advances |
-1,759 |
-2.2 |
-895 |
-1.0 |
|
(c) Marketable Securities issued in Conversion of Special Securities |
-5,000 |
-6.2 |
-3,471 |
-4.0 |
|
(d) Special Securities issued to Nationalised Banks |
-12,101 |
-14.9 |
-97.0 |
-0.1 |
12 |
Disinvestment of Surplus Cash |
0.0 |
0.0 |
0.0 |
0.0 |
13 |
Drawdown of Cash Balances |
20,260 |
25.0 |
24,473 |
28.3 |
14 |
Ways and Means Advances and Over draft |
0.0 |
0.0 |
0.0 |
0.0 |
*Gross Fiscal Deficit in this table includes Rs.35,531 crore, acquisition cost of RBI's stake in State Bank of India (SBI) and neutralized to the extent of transfer from RBI with regard to the transaction. |
Concluding Observations and Broad Assessment
Finances of the Central Government during the first half of the current fiscal year (April-September 2007) indicate the continuation of the fiscal consolidation process stipulated under the FRBM Rules, 2004. During the first half of 2007-08 all the key deficit indicators, viz., revenue deficit (RD), gross fiscal deficit (GFD) and Primary Deficit (PD), both in absolute terms as well as per cent of GDP, were lower than a year ago. Revenue deficit as per cent of budget estimates, however, was somewhat higher than last year due to a combination of expenditure pressure along with the envisaged absolute reduction in the deficit. Growth in tax revenue decelerated somewhat from the previous year, but remained buoyant and higher than the envisaged growth for the full year primarily on account of direct taxes, viz., corporation tax and income tax. Indirect taxes, particularly, the custom duties and excise duties displayed subdued growths; much lower than those envisaged in the budget 2007-08. There was expenditure pressure due to the higher increase in plan expenditure over the comparable period of the preceding year on account of grants to States and Union Territories, other economic services and non-defence capital outlay. Though total non-plan expenditure decelerated, interest payments and major subsidies continued to exert pressure. With regard to market borrowings, the Central Government, up to end-September, 2007, raised gross and net market borrowings of Rs.1,15,036 crore and Rs. 69,737 crore, respectively. As per cent of budget estimates, gross and net market borrowing work out to 61.3 per cent and 62.9 per cent as compared with 59.3 per cent, and 50.1 per cent, respectively, a year ago. During the year 2007-08 so far (up to January 4, 2008), the Central Government has raised gross and net market borrowings of Rs. 1,62,310 crore and Rs. 95,257 crore, respectively. As per cent of budget estimates, gross and net market borrowings constitute 86.4 per cent and 86.0 per cent as compared with 81.1 per cent and 76.5 per cent, respectively, a year ago.
It is thus apparent that in the second half of the fiscal year, Government will require taking more active recourse to expenditure management and further improve the revenue performance in order to meet the various deficit targets, in particular revenue deficit, set for 2007-08. In the 'Mid-Year Review', the Government has expressed its optimism to meet the FRBM targets for the full year, despite expenditure pressure. It states that 'the outlook for receipts in the subsequent part of the year looks more optimistic than anticipated at the time of budget estimates. Slippage from half-yearly targets were also due to various cash management initiatives being introduced to avoid bunching of expenditure in the second half-of the year. Thus, by the end of the year, and notwithstanding the deviations witnessed in the first half of the year, the Government is confident of successfully navigating through the FRBM road map and ensuring compliance of the end-of-the-year fiscal targets on the strength of determined pursuit of various fiscal consolidation measures in conjunction with growth dividends'. It may be emphasised that meeting the deficit targets for 2007-08 would crucially hinge upon the continuance of observed buoyancy of revenue receipts in the first half of the year into the second half. This would necessitate strengthening the revenue flow from indirect taxes viz., customs and excise duties, which have been showing a decelerating trend and have so far recorded a much lower growth than envisaged in the budget. Fiscal outcome, at the same time, would also depend on the expenditure management through reallocation along the desired sectors. In the second half, the Central Government will need to sustain the momentum of enhancing capital outlay within the overall trend of curtailing growth in total expenditure. The concerted efforts towards fiscal consolidation need to be carried forward by the Government without affecting the growth momentum of the economy.
Table 4: Half Yearly FRBM Targets |
Item |
Actuals (as per cent of BE) |
2007 |
2006 |
2005 |
|
(April-September) |
|
Non-Debt Receipts |
Not less than 40 per cent of BE |
44.8 |
39.9 |
35.0 |
Fiscal Deficit |
Not more than 45 per cent of BE |
53.8 |
58.2 |
55.5 |
Revenue Deficit |
Not more than 45 per cent of BE |
85.5 |
81.8 |
68.3 |
Source: Mid-Year Review, Ministry of Finance, Government of India. |
Annex-1 Financial Position of the Central Government during April-September, 2007 A comparative position of fiscal indicators being affected by the transactions relating to the acquisition of Reserve Bank of India's stake in State Bank of India by the Government of India are provided in the Table below.
Table: Financial position of the Central Government during April-September 2007 |
Items |
Including cost of acquisition of RBI's share in SBI/ |
Excluding cost of acquisition of RBI's share in SBI 5 |
transfer of RBI's profit to the Government of India |
/ transfer of RBI's profit to the Government of India |
Capital |
Capital receipts at Rs.1,19,936 crore is 32.5 per cent |
Capital receipts at Rs.85,628 crore is 5.4 per cent |
Receipts |
higher than the corresponding period of previous |
lower than the corresponding period of previous year. |
|
year. This constitutes 61.8 per cent of the budget |
This constitutes 55.6 per cent of the budget estimates. |
|
estimates as against 56.4 per cent in the |
|
|
corresponding period of the preceding year. |
|
Total receipts |
Total receipts at Rs.3,17,892 crore is 26.2 per cent |
Total receipts at Rs.2,83,584 crore is 12.6 per cent |
|
higher than the corresponding period of previous |
higher than the corresponding period of preceding |
|
year. This constitutes 46.7 per cent of the budget |
year constituting 44.3 per cent of the budget |
|
estimate as against 44.7 per cent in the |
estimates. |
|
corresponding period of the preceding year. |
|
Non-plan |
Non-plan capital expenditure at Rs.43,625 crore is |
Non-plan capital expenditure at Rs.8,094 crore is 20.2 |
capital |
330.3 per cent higher than that in the corresponding |
per cent lower than that in the corresponding period |
expenditure |
period of the previous year. This 47.5 per cent of |
of the previous year constituting 15.6 per cent of the |
|
the budget estimate as against 21.6 per cent in the |
budget estimates. |
|
corresponding period of last year. |
|
Capital |
Capital expenditure at Rs.58,812 crore is 176.6 |
Capital expenditure at Rs.23,281 crore is 9.5 per cent |
expenditure |
per cent higher than the corresponding period of |
higher than the corresponding period of preceding |
|
last year. This is 48.0 per cent of the budget estimate |
year constituting 28.2 per cent of the budget |
|
as against 28.0 per cent in the corresponding period |
estimates. |
|
of previous year. |
|
Total |
Total expenditure at Rs.3,17,892 crore is 26.2 per |
Total expenditure at Rs.2,82,361 crore is 12.1 per cent |
expenditure |
cent higher than the corresponding period of last |
higher than the corresponding period of preceding |
|
year. This is 46.7 per cent of the budget estimate as |
year constituting 44.1 per cent of the budget |
|
against 44.7 per cent in the corresponding period |
estimates. |
|
of previous year. |
|
Gross fiscal |
Gross fiscal deficit at Rs.81,200 crore is 6.1 per cent |
Gross fiscal deficit at Rs.79,977 crore is 7.5 per cent |
deficit |
lower than the corresponding period of the previous |
lower than the corresponding period of the previous |
|
year. GFD constituted 53.8 per cent of the budget |
year constituting 53.0 per cent of the budget |
|
estimate as against 58.2 per cent in the |
estimates. |
|
corresponding period of preceding year. |
|
Gross primary |
Gross primary deficit at Rs.8,380 crore is 62.7 per |
Gross primary deficit at Rs.7,157 crore is 68.1 per |
deficit |
cent lower than the corresponding period of the |
cent lower than the corresponding period of the |
|
|
previous year. |
5As SBI transaction took place in 2007, fiscal indicators for previous year are not affected. |
Statement 1: Budgetary Position of the Central Government
(Contd.) |
(Rupees Crore) |
Item |
Actuals |
Budget Estimates |
(April-September) |
(Financial Year) |
2007-08 |
2006-07 |
2007-08 |
2006-07 |
1 |
|
2 |
3 |
4 |
5 |
1. |
Revenue Receipts |
197,956 |
161,406 |
486,422 |
403,465 |
2. |
Tax Revenue (Net) |
160,500 |
129,986 |
403,872 |
327,205 |
3. |
Non-Tax Revenue |
37,456 |
31,420 |
82,550 |
76,260 |
|
of which : |
|
|
|
|
|
(i) Interest Receipts |
8,318 |
6,297 |
19,308 |
19,263 |
4. |
Capital Receipts |
119,936 |
90,538 |
194,099 |
160,526 |
|
|
(85,628) |
|
(154,099) |
|
|
Non Debt Capital Receipts |
38,736 |
4,077 |
43,151 |
11,840 |
|
of which : |
(4,428) |
|
(3,151) |
|
5. |
Recovery of Loans |
2,030 |
4,077 |
1,500 |
8,000 |
6. |
Other Receipts |
36,706 |
0 |
41,651 |
3,840 |
|
|
(2,398) |
|
(1,651) |
|
7. |
Borrowings |
81,200 |
86,461 |
150,948 |
148,686 |
8. |
Total Receipts (1+4) |
317,892 |
251,944 |
680,521 |
563,991 |
|
|
(283,584) |
|
(640,521) |
|
9. |
Non-Plan Expenditure |
231,134 |
183,065 |
475,421 |
391,263 |
|
|
(195,603) |
|
(435,421) |
|
10. |
On Revenue Account |
187,509 |
172,926 |
383,546 |
344,430 |
|
of which : |
|
|
|
|
|
(i) Interest Payments |
72,820 |
64,003 |
158,995 |
139,823 |
11. |
On Capital Account |
43,625 |
10,139 |
91,875 |
46,833 |
|
|
(8,094) |
|
(51,875) |
|
12. |
Plan Expenditure |
86,758 |
68,879 |
205,100 |
172,728 |
13. |
On Revenue Account |
71,571 |
57,757 |
174,354 |
143,762 |
14. |
On Capital Account |
15,187 |
11,122 |
30,746 |
28,966 |
15. |
Total Expenditure (9+12) |
317,892 |
251,944 |
680,521 |
563,991 |
|
|
(282,361) |
|
(640,521) |
|
16. |
Revenue Expenditure (10+13) |
259,080 |
230,683 |
557,900 |
488,192 |
17. |
Capital Expenditure (11+14) |
58,812 |
21,261 |
122,621 |
75,799 |
|
of which : |
(23,281) |
|
(82,621) |
|
|
(i). Loans and Advances |
5,003 |
3,290 |
7,498 |
8,861 |
18. |
Revenue Deficit (16-1) |
61,124 |
69,277 |
71,478 |
84,727 |
19. |
Fiscal Deficit {15-(1+5+6)} |
81,200 |
86,461 |
150,948 |
148,686 |
|
|
(79,977) |
|
|
|
20. |
Gross Primary Deficit {19-10(i)} |
8,380 |
22,458 |
-8,047 |
8,863 |
|
|
(7,157) |
|
|
|
Note : Figures in parentheses are net of SBI transactions.
Source : Controller General of Accounts. Ministry of Finance, Government of India. |
Statement 1: Budgetary Position of the Central Government
(Contd.) |
(Rupees Crore) |
Item |
Actuals |
Budget Estimates |
(April-September) |
(Financial Year) |
2007-08 |
2006-07 |
2007-08 |
2006-07 |
1 |
2 |
3 |
4 |
5 |
1. |
Revenue Receipts |
197,956 |
161,406 |
486,422 |
403,465 |
2. |
Tax Revenue (Net) |
160,500 |
129,986 |
403,872 |
327,205 |
3. |
Non-Tax Revenue |
37,456 |
31,420 |
82,550 |
76,260 |
|
of which : |
|
|
|
|
|
(i) Interest Receipts |
8,318 |
6,297 |
19,308 |
19,263 |
4. |
Capital Receipts |
119,936 |
90,538 |
194,099 |
160,526 |
|
|
(85,628) |
|
(154,099) |
|
|
Non Debt Capital Receipts |
38,736 |
4,077 |
43,151 |
11,840 |
|
of which : |
(4,428) |
|
(3,151) |
|
5. |
Recovery of Loans |
2,030 |
4,077 |
1,500 |
8,000 |
6. |
Other Receipts |
36,706 |
0 |
41,651 |
3,840 |
|
|
(2,398) |
|
(1,651) |
|
7. |
Borrowings |
81,200 |
86,461 |
150,948 |
148,686 |
8. |
Total Receipts (1+4) |
317,892 |
251,944 |
680,521 |
563,991 |
|
|
(283,584) |
|
(640,521) |
|
9. |
Non-Plan Expenditure |
231,134 |
183,065 |
475,421 |
391,263 |
|
|
(195,603) |
|
(435,421) |
|
10. |
On Revenue Account |
187,509 |
172,926 |
383,546 |
344,430 |
|
of which : |
|
|
|
|
|
(i) Interest Payments |
72,820 |
64,003 |
158,995 |
139,823 |
11. |
On Capital Account |
43,625 |
10,139 |
91,875 |
46,833 |
|
|
(8,094) |
|
(51,875) |
|
12. |
Plan Expenditure |
86,758 |
68,879 |
205,100 |
172,728 |
13. |
On Revenue Account |
71,571 |
57,757 |
174,354 |
143,762 |
14. |
On Capital Account |
15,187 |
11,122 |
30,746 |
28,966 |
15. |
Total Expenditure (9+12) |
317,892 |
251,944 |
680,521 |
563,991 |
|
|
(282,361) |
|
(640,521) |
|
16. |
Revenue Expenditure (10+13) |
259,080 |
230,683 |
557,900 |
488,192 |
17. |
Capital Expenditure (11+14) |
58,812 |
21,261 |
122,621 |
75,799 |
|
of which : |
(23,281) |
|
(82,621) |
|
|
(i). Loans and Advances |
5,003 |
3,290 |
7,498 |
8,861 |
18. |
Revenue Deficit (16-1) |
61,124 |
69,277 |
71,478 |
84,727 |
19. |
Fiscal Deficit {15-(1+5+6)} |
81,200 |
86,461 |
150,948 |
148,686 |
|
|
(79,977) |
|
|
|
20. |
Gross Primary Deficit {19-10(i)} |
8,380 |
22,458 |
-8,047 |
8,863 |
|
|
(7,157) |
|
|
|
Note : Figures in parentheses are net of SBI transactions.
Source : Controller General of Accounts, Ministry of Finance, Government of India. |
Statement 2 : Tax Collection of the Central Government during April September-2007
(Concld.) |
Item |
April-September |
Percentage to Budget Estimates |
Growth Rate(per cent) |
2007-08 |
2006-07 |
2007-08 |
2006-07 |
1 |
6 |
7 |
8 |
9 |
A . |
Gross Tax Revenue (1 to 6 ) |
40.8 |
40.6 |
24.5 |
30.5 |
|
1. |
Corporation Tax |
41.7 |
38.1 |
38.6 |
49.2 |
|
2. |
Income Tax |
41.6 |
38.4 |
38.2 |
29.1 |
|
|
(a) Taxes on Income other than |
40.8 |
35.7 |
35.3 |
24.3 |
|
|
Corporation Tax |
|
|
|
|
|
|
(b) Securities Transaction Tax |
68.9 |
60.9 |
45.4 |
106.8 |
|
|
( c) Banking Cash Transaction Tax |
42.8 |
46.8 |
17.9 |
162.9 |
|
|
(d) Fringe Benefit Tax |
32.9 |
- |
94.0 |
40.3 |
|
3. |
Customs Duties |
48.7 |
53.9 |
15.9 |
32.7 |
|
4. |
Union Excise Duties |
34.5 |
36.5 |
3.4 |
7.4 |
|
5. |
Service Tax |
36.5 |
38.7 |
37.2 |
63.8 |
|
6. |
Other Taxes |
52.9 |
73.3 |
8.5 |
15.7 |
B . |
Surcharge for Financing NCCF |
63.3 |
53.9 |
40.9 |
57.4 |
C . |
Balance Gross Tax Revenue |
40.7 |
40.5 |
24.4 |
30.4 |
D . |
Assignment to States/UTs |
43.4 |
42.9 |
27.0 |
19.4 |
E . |
Net Tax Revenue |
39.7 |
39.7 |
23.5 |
35.1 |
NCCF : National Calamity Contingency Fund.
UTs : Union Territories.
Source : Controller General of Accounts, Ministry of Finance, Government of India. |
1 The review in this article is based on the provisional data on Union Government Accounts for April-September 2007, received from the Controller General of Accounts, Ministry of Finance, Government of India. The analysis is based on net of transactions involved in the acquisition of RBI's stake in SBI by the Union Government i.e., capital expenditure of Rs.35,531 made by the Government of India on June 29, 2007 for acquisition of RBI stake in SBI and the one time transfer of surplus from the RBI of Rs.34,308 crore to the Union Government on August 09, 2007 (also see Annex-1).
2 It may be noted that GFD inclusive of SBI transactions increased substantially during June and July, 2007, as Government made capital expenditure of Rs. 35,531 crore in June 2007 for acquisition of RBI stake in SBI, which was largely neutralised only in August 2007 by the one time transfer of surplus of Rs. 34,308 crore by the RBI to the Union Government. * Prepared in the Division of Central Finances, Department of Economic Analysis and Policy. 3 GFD includes the net impact of transactions involved in acquisition of RBI's stake in SBI by the Central Government of Rs. 1,223 crore.
4 Mid-Year Review, Ministry of Finance, Government of India.
5As SBI transaction took place in 2007, fiscal indicators for previous year are not affected. |


