Flow of Funds Accounts of the Indian Economy 2001-02 to 2007-08* The basic objective of the present article is to provide an overview of the flow of funds (FoF) accounts of the Indian economy for the period 2001-02 to 2007-08. This is the period that witnessed economic reforms towards (i) assigning greater role to the private sector in economic activities; (ii) enabling the entry of variety of domestic and external players to impart depth and liquidity to the financial markets; and (iii) growing integration of Indian economy with the global financial sector. The impacts of these developments are reflected in terms of a number of changes in the flow of funds accounts during the course of the seven years period of 2001-02 to 2007-08. First, the ustained reforms in the financial sector have resulted in a rise in financial deepening, which is reflected in the rise in the finance ratio from 0.52 in 2001-02 to 0.77 in 2007-08. Second, reflecting the progressive liberalisation of the external transactions, the share of financial issues of the ‘rest of world sector’ in total financial issues more than doubled from 6.5 per cent in 2001-02 to 13.0 per cent in 2007-08. Third, the preferred instruments for households’ savings moved away from Government sector instruments towards bank deposit, shares and debentures and contractual instruments, reflecting increased market accessibility and portfolio diversification of the households in response to the increasing choice of financial instruments. Fourth,the decline in government deficit during the period of study covers the period of FRBM Act; Fifth, despite all these developments, the banking sector continued to dominate the Indian financial landscape during the entire period of study.
Flow of funds (FOF) accounts show the transactions in financial instruments among major sectors of the economy. These accounts provide a broad framework for analysing issues related to financial sector and its relationships with the real economy and thereby facilitate insights into the role of the financial sector in the development process. Keeping in view the analytical uses of the FOF, the Reserve Bank of India has been compiling and disseminating FOF accounts in a detailed form from time to time since December 1964. The latest detailed ‘flow of funds accounts’ for the Indian economy are available for the period 1994-95 to 2000-01, which were published in the Reserve Bank of India Bulletin, September 2007.
The present article gives a brief overview of the flow of funds accounts of the Indian economy for the period 2001-02 to 2007-08. This is the period that witnessed growing integration of Indian economy with the global financial sector. Measures taken in pursuance of economic reforms that assigned greater role to the private sector in economic activities, enabled entry of variety of domestic and external players imparting depth and liquidity to the financial markets. While these dynamics reflect in enhanced role of external capital and of non-banking institutions such as mutual funds, insurance companies, provident funds etc., the banking sector, however, continued to play a dominant role in meeting the financing needs of the deficit sectors. The FOF accounts presented in the ensuing sections have inter alia attempted to capture these developments.
As is obvious for any exercise of this magnitude, major challenge before FOF has been to bridge data gaps in certain sectors particularly that related to non-availability of detailed data on the cooperative sector. Absence of such detailed data for various segments of cooperative (credit and non-credit) sector have been overcome by estimates based on the information available from alternative sources and other sectors covered in the FOF accounts.
The present article is organised as follows: Section I provides an introductory backdrop by briefly discussing the role of FOF and the major economic developments during the period covered in this article. Section II presents the methodology employed for compilation of FOF including estimation of data wherever relevant data are not available. Sector-wise and instrument-wise financial flows are presented in Section III and Section IV, respectively. Select indicators of financial development estimated from flow of funds are analysed in Section V. Section VI examines the consistency of FOF with NAS data. Recommendations of HLC pertaining to flow of funds are presented in Section VII. Section VIII sums up the findings of the article and highlights the emerging issues.
I. Introduction
Role of FOF
Flow of funds accounts is a set of accounts which depicts the inter-sectoral flow of funds among major sectors of the economy on ‘from whom to whom’ basis. Specifically the account analyses economic data on borrowings, lending and investment among major sectors of the economy. FOF facilitates to track the funds movement from those sectors that serve as sources of capital, through intermediaries (such as banks, mutual funds, and pension funds), to sectors that use the capital to acquire physical and financial assets. The flow of funds accounts are used primarily as an economy wide performance indicator. The data from flow of funds accounts can be compared to prior data to analyse whether the financial strength of the economy has improved over time.
Data in the FOF accounts are useful in documenting central economic trends. For example, the flow of funds accounts show the growth of debt for each sector; changes in the sources of credit to households, businesses, and governments; and the development of new financial instruments for providing credit. The accounts can be used to study wealth effect - the effect of changes in households’ net worth on their decisions about saving and consumption. The accounts can also be used in analysis of business investment and its implications for the macro-economy. They also document the growth of important economic institutions, such as mutual funds, financial corporations, etc; and show how these institutions have got woven into the financial fabric of the economy. Thus,the accounts by revealing inter-linkages and inter dependence among sectors, throw light on the likely impact that changes in liquidity conditions may have on growth prospects and, therefore, enable fine tuning of policy measures.
In the Indian economy, all institutional units, which correspond to economic entities capable of engaging in transactions with other units, are grouped into six categories, called the institutional sectors: banking, other financial institutions (OFI), private corporate business (PCB), government, rest of the world (ROW) and household sectors. Financial assets and liabilities are classified under ten major categories of financial instruments: currency, deposits, investments, loans and advances, small savings, life funds, provident funds, trade debts, foreign claims not elsewhere classified (NEC) and other claims NEC.
Period of Analysis
The period under analysis occupies an important place in Indian economic development, primarily for the following two reasons: first, this period covers tenth five year plan in which Indian economy recorded highest average annual growth rate in comparison with earlier five year plans; second, this is the period of second generation economic reforms in which reforms initiatives taken in the first phase were strengthened further. Some salient developments during this period are presented below.
-
The period of this FOF starts from 2001-02, the year of global economic slowdown, followed by a period of sustained high growth phase and ends in 2007-08, which witnessed the initial phase of cyclical slowdown. While in the initial years, growth in GDP remained low, it accelerated unprecedentedly to average more than 9 per cent during 2005-08. This rise in the growth of the Indian economy concomitantly led to a rise in demand for the funds.
- During this period the Indian economy had witnessed a jump in the investment activity in the economy. The investment rate increased to 39.1 per cent in 2007-08 form 22.8 per cent in 2001-02. The rate of investment of private corporate sector tripled during this period.
- Industrial upturn started in April 2002 and peaked by the end of 2006-07 and then moderated in the subsequent year, 2007-08.
- Capital market, which remained subdued in the initial years, witnessed a sharp growth from 2005-06. Mutual funds recorded a sharp increase in the assets under their management.
- During this period significant macro-economic and financial reforms were implemented in several sectors of the economy – trade, industry, foreign investment, exchange rate, financial sector and monetary and fiscal policies that greatly enhanced the inter linkages among various sectors.
- With significant opening up of the capital account, there were sustained capital inflows, particularly since 2003-04.
- Government sector turned from a dissaver to savings generating sector on account of improved performance of government administration and departmental enterprises.
- Reliance of private corporate sector on the internal sources of finance increased during this period. Notwithstanding some deterioration of profitability of firms in the second half of 1990s, private corporate business sector during the period under review effected improvements in management practices (cost reduction, inventory management, etc.) and registered improved performance resulting in rise in profitability.
- Although there was a current account surplus during 2001-02 to 2003-04, the subsequent years, however, witnessed current account deficit along with net capital inflows.
- The process of financial development continued to hinge effectively on commercial banks, which have a dominant share in total financial assets and are the main source of financing for the deficit sectors like government and private corporate sector.
- The non-bank segment of the financial system became far more varied with emergence of a well diversified structure of financial institutions, financial companies and mutual funds. Doors of insurance and mutual fund business were thrown open to the private sector. While, another important development has been merger/conversion of two major all- India financial institutions, viz., the ICICI and the IDBI Bank into banks, presence of private players in the banking sector significantly increased.
- Increased financial market liberalisation enhanced competition among market participants during this period. Capital markets became an important source of financing corporate investments. There was exponential increase in foreign investment during this period. Increase in financial activity was also reflected in the growing importance of mutual funds.
- The financial development in the banking and non-bank financial sector has supported saving and investment in the non-financial sectors of the economy and contributed to growth in real activity. Period witnessed turnaround from dissaving to positive a savings by the public sector and enhanced savings by the private corporate sector.
II. Data Sources, Gap and Estimation
The flow of fund compilation is designed to study changes in the financial activities in the economy across six major sectors. It requires detailed instrument wise data ‘from whom to whom’ basis. Generally data as per requirement of flow of funds is not available for all sectors immediately after the end of accounting period. This has been a primary reason for the lag in publication of FOF accounts. This article attempts to bridge the data gaps through collection of data from different sources and through some estimation. Since data for the years 2006-07 and 2007-08 are largely estimated, figures for these years are provisional. Details of data sources and the methodology for bridging the data gaps are presented in Annex I.
III. Sectoral Trends in Flow of Funds
Funds flow from a surplus sector to meet the investment-savings gap of a deficit sector. Flow of funds accounts are used to study the pattern of inter-sectoral financial flows in the economy. Analysis of these flows is expected to provide insights which would be useful for formulation of appropriate development strategies.
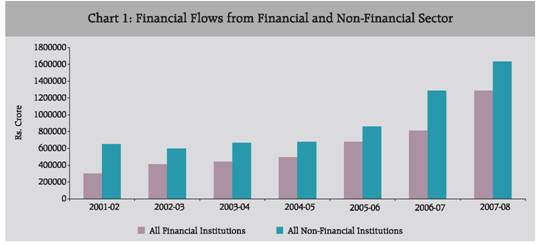
Financial claims raised by different sectors during the period 2001-02 to 2007-08 are set out in Table 1. The share of all financial institutions (AFIs) in total claims issued (i.e., secondary issues) has moved up from 31.7 per cent in 2001-02 to 44.0 per cent in 2005-06; the share, however, marginally increased to 44.1 per cent in 2007-08. The share of non-financial institutions, on the other hand declined from 68.3 per cent in 2001-02 to 56.0 per cent in 2005-06 before rising to 55.9 per cent in 2007-08. The rising trend in the share of AFIs corresponds to the boom period. Acceleration in growth rate in GDP during 2002-03 to 2005-06 has led to larger resource mobilisation by the financial sector, indicating growing financial intermediation (Chart 1). Sectoral trends in financial claims issued are discussed below.
Table 1: Financial Flows By Sectors |
(Rs. crore) |
Sectors |
2001-02 |
2002-03 |
2003-04 |
2004-05 |
2005-06 |
2006-07 |
2007-08 |
1 |
2 |
3 |
4 |
5 |
6 |
7 |
8 |
1. |
Banking |
209044 |
275497 |
295078 |
374411 |
460259 |
598267 |
830477 |
|
|
(21.9) |
(27.2) |
(26.6) |
(31.9) |
(29.9) |
(28.5) |
(28.5) |
2. |
Other Financial Institutions |
93592 |
136798 |
146635 |
121474 |
217832 |
214032 |
455605 |
|
|
(9.8) |
(13.5) |
(13.2) |
(10.4) |
(14.1) |
(10.2) |
(15.6) |
3. |
All Financial Institutions (1+ 2) |
302636 |
412295 |
441713 |
495885 |
678092 |
812299 |
1286082 |
|
|
(31.7) |
(40.8) |
(39.9) |
(42.3) |
(44.0) |
(38.7) |
(44.1) |
4. |
Private Corporate Business |
286571 |
116756 |
104042 |
134310 |
308172 |
677979 |
886994 |
|
|
(30.0) |
(11.5) |
(9.4) |
(11.4) |
(20.0) |
(32.3) |
(30.4) |
5. |
Government |
252555 |
358063 |
349987 |
297930 |
268654 |
201949 |
192381 |
|
|
(26.4) |
(35.4) |
(31.6) |
(25.4) |
(17.4) |
(9.6) |
(6.6) |
6. |
Rest of the World |
62131 |
63648 |
141760 |
124392 |
102111 |
229761 |
379395 |
|
|
(6.5) |
(6.3) |
(12.8) |
(10.6) |
(6.6) |
(10.9) |
(13.0) |
7. |
Households |
51727 |
60304 |
69982 |
120566 |
183424 |
176787 |
173136 |
|
|
(5.4) |
(6.0) |
(6.3) |
(10.3) |
(11.9) |
(8.4) |
(5.9) |
8. |
All Non-Financial Institutions |
652984 |
598771 |
665771 |
677199 |
862361 |
1286476 |
1631905 |
|
(4 to 7) |
(68.3) |
(59.2) |
(60.1) |
(57.7) |
(56.0) |
(61.3) |
(55.9) |
9. |
Total Claims Issued ( 3+8) |
955620 |
1011067 |
1107484 |
1173084 |
1540452 |
2098776 |
2917987 |
|
|
(100.0) |
(100.0) |
(100.0) |
(100.0) |
(100.0) |
(100.0) |
(100.0) |
Note: Figures in brackets are percentages to total claims issued. |
All Financial Institutions
Historically, financial intermediation by banks has played a central role in India in supporting the growth process by mobilising savings. Banks are the major repository and mobiliser of deposits from the household sector, the major surplus sector of the economy. Thus banks have helped in raising the financial savings of the household sector and hence the overall saving rate. Notwithstanding the liberalisation of the financial sector and proliferation of other saving instruments, banks continue to play a dominant role in the financial intermediation of the Indian economy. The deregulation of interest rates has opened up new avenues for banks to mobilise funds at competitive rates.
With acceleration of GDP and the per capita income, the share of banking sector in total claims issued increased from 21.9 per cent in 2001-02 to 31.9 per cent in 2004-05 (Table 1). However, it declined marginally to 28.5 per cent in 2007-08. The decline in the share of banking sector after 2004-05 can be attributed to increased risk appetite of investors and larger capital market issues by private corporate sector. The share of other financial institutions moved in the range of 9.8 per cent and 15.6 per cent between 2001-02 and 2007-08. Part of the decline in share during 2004-05 can be attributed to the conversion/merger of two major FIs into banks.
Table 2: Financing of the Private Corporate Business Sector |
(Rs. crore) |
Item |
2001-02 |
2002-03 |
2003-04 |
2004-05 |
2005-06 |
2006-07 |
2007-08 |
1 |
2 |
3 |
4 |
5 |
6 |
7 |
8 |
1. |
Net Savings |
14351 |
30308 |
49298 |
119092 |
164675 |
206655 |
250426 |
2. |
Capital Transfers received (net) |
189 |
-2465 |
3665 |
-426 |
-3959 |
4 |
-20757 |
3. |
Investment |
61073 |
76557 |
110464 |
245799 |
380108 |
475415 |
583384 |
4. |
Resource Gap (3-2-1) |
46533 |
48714 |
57501 |
127133 |
219392 |
268756 |
353715 |
5. |
Financial Sources |
286571 |
116756 |
104042 |
134310 |
308172 |
677979 |
886994 |
6. |
Financial Uses |
106336 |
75316 |
129121 |
121779 |
146714 |
386174 |
526954 |
7. |
Financial Deficit (5-6) |
180235 |
41440 |
-25079 |
12532 |
161458 |
291805 |
360039 |
|
|
(100.0) |
(100.0) |
(100.0) |
(100.0) |
(100.0) |
(100.0) |
(100.0) |
8. |
Deficit Financed by Net Issues from the following Sectors |
|
|
|
|
|
|
|
|
(i) Banking |
52294 |
68218 |
46949 |
22470 |
43485 |
171168 |
371554 |
|
|
(29.0) |
(164.6) |
-(187.2) |
(179.3) |
(26.9) |
(58.7) |
(103.2) |
|
(ii) Other Financial Institutions |
108925 |
-6886 |
-97184 |
-5786 |
62381 |
42711 |
75861 |
|
|
(60.4) |
-(16.6) |
(387.5) |
-(46.2) |
(38.6) |
(14.6) |
(21.1) |
|
(iii) Government |
-1230 |
10825 |
-17673 |
-22989 |
12804 |
-28248 |
-37599 |
|
|
-(0.7) |
(26.1) |
(70.5) |
-(183.5) |
(7.9) |
-(9.7) |
-(10.4) |
|
(iv) Rest of the World |
1818 |
-12892 |
1306 |
9893 |
56087 |
76171 |
16909 |
|
|
(1.0) |
-(31.1) |
-(5.2) |
(78.9) |
(34.7) |
(26.1) |
(4.7) |
|
(v) Households |
2081 |
93 |
1385 |
3956 |
5972 |
23988 |
34130 |
|
|
(1.2) |
(0.2) |
-(5.5) |
(31.6) |
(3.7) |
(8.2) |
(9.5) |
|
(vi) Others # |
16347 |
-17917 |
40138 |
4987 |
-19272 |
6015 |
-100816 |
|
|
(9.1) |
-(43.2) |
-(160.0) |
(39.8) |
-(11.9) |
(2.1) |
-(28.0) |
#: The surge in others components is mainly due to rise in components of other current liabilities. Notes: 1. Figures in brackets are percentages to total financial deficit.
2. Item no 1, 2, 3 and 4 are sourced from National Accounts Statistics, CSO. |
Private Corporate Business
The private corporate business sector remained as the deficit sector all the years except in 2003-04 when the sector had large internal sources of funds (Table 2). The banking sector continued to be the dominant sector in financing the deficit of private corporate business sector. Quantitatively, the share of banking sector in the private corporate sector’s pool of resources increased from 29.0 per cent in 2001-02 to 103.2 per cent in 2007-08.The rise in the share of banks in 2007-08 was due to shift in banks investment from Government securities to corporate securities apart from increase in supply of bank credit.
‘Others’ (sector not elsewhere classified) component of source of funds of PCB has been significantly volatile and its share in the financing of PCB sector has increased significantly during 2003-04 and 2007-08. This is mainly due to rise in the other liabilities1 of private corporate sector.
Reflecting liberalisation of foreign financing and increasing reliance of PCB sector on foreign funds for acquisition of raw material and technology from abroad, the share of rest of the world (ROW) has increased manifold from 1.0 per cent in 2001-02 to 78.9 per cent in 2004-05. During the period under analysis, a distinct rise in the financing of deficit from the rest of the world sector marks a departure from the past. In absolute terms, it increased from Rs.1,818 crore in 2001-02 to Rs.76,171 crore in 2006-07. The contribution of the ROW sector in financing the PCB sector, however, moderated subsequently and stood at Rs.16,909 crore in 2007-08, mainly reflecting the impact of global financial crisis.
The household sector’s share fluctuated in the range between -5.5 per cent and 9.5 per cent, except in 2004-05, when the share stood at 31.6 per cent, although the mobilisation of funds by the corporate sector has increased manifold in absolute terms, through the initial public offers. The share of the OFI sector in financing deficit fluctuated and does not provide any fixed pattern of financing the deficit of private corporate business sector.
Government
As mentioned earlier, the period under analysis witnessed considerable improvement in government finances. Government sector turned from a dissaver to savings generating sector on account of implementation of FRBM leading to lower revenue deficit and improved performance of government administration and departmental enterprises. A substantial portion of the financial deficit of the government sector is met by the banking sector whose share has, however, been fluctuating (Table 3). Mirroring the growth in financing of the private corporate sector, the share of deficit of the government financed by the banks increased from 26.0 per cent in 2001-02 to 33.4 per cent in 2004-05, recorded disinvestment during 2005-07 and then increased to 63.7 per cent in 2007-08. On the other hand, the share of OFI almost doubled between 2001-02 and 2002-03, but declined in the subsequent years and stood at 6.4 per cent in 2007-08. The share of ROW sector rose to 10.1 per cent in 2007-08 from 5.0 per cent in 2001-02 due to the inflow of funds into the economy through the official channel. It may be noted that the share of external finance used in financing of gross fiscal deficit of the centre increased from 4.0 per cent in 2001-02 to 7.2 per cent in 2007-08.
Table 3: Financing Pattern of the Government Sector |
(Rs. crore) |
Item |
2001-02 |
2002-03 |
2003-04 |
2004-05 |
2005-06 |
2006-07 |
2007-08 |
1 |
2 |
3 |
4 |
5 |
6 |
7 |
8 |
1. |
Net Savings |
-130,553 |
-105,562 |
-67,237 |
-39,851 |
-33,255 |
6,923 |
66,527 |
2. |
Capital Transfers received (net) |
3823 |
6460 |
1021 |
4113 |
7788 |
3464 |
23699 |
3. |
Investment |
72170 |
59773 |
77821 |
108160 |
151757 |
198676 |
282998 |
4. |
Resource Gap (3-2-1) |
198,900 |
158,875 |
144,037 |
143,898 |
177,224 |
188,289 |
192,772 |
5. |
Financial Sources |
252555 |
358063 |
349987 |
297930 |
268654 |
201949 |
192381 |
6. |
Financial Uses |
52436 |
50980 |
91777 |
16497 |
47614 |
89253 |
72698 |
7. |
Financial Deficit (5-6) |
200119 |
307083 |
258210 |
281434 |
221040 |
112696 |
119683 |
|
|
(100.0) |
(100.0) |
(100.0) |
(100.0) |
(100.0) |
(100.0) |
(100.0) |
8. |
Deficit Financed by Net Issues from the following Sectors |
|
|
|
|
|
|
|
|
(i) Banking |
51975 |
99709 |
54868 |
93924 |
-7172 |
-29143 |
76193 |
|
|
(26.0) |
(32.5) |
(21.2) |
(33.4) |
-(3.2) |
-(25.9) |
(63.7) |
|
(ii) Other Financial Institutions |
52976 |
147357 |
79136 |
50465 |
33727 |
204513 |
7618 |
|
|
(26.5) |
(48.0) |
(30.6) |
(17.9) |
(15.3) |
(181.5) |
(6.4) |
|
(iii) Private Corporate Business |
-108 |
-388 |
-248 |
-416 |
-724 |
-545 |
-63 |
|
|
-(0.1) |
-(0.1) |
-(0.1) |
-(0.1) |
-(0.3) |
-(0.5) |
-(0.1) |
|
(iv) Rest of the World |
10012 |
-16653 |
-15366 |
12550 |
36348 |
14586 |
12105 |
|
|
(5.0) |
-(5.4) |
-(6.0) |
(4.5) |
(16.4) |
(12.9) |
(10.1) |
|
(v) Households |
76975 |
84749 |
115474 |
137616 |
122277 |
56671 |
6439 |
|
|
(38.5) |
(27.6) |
(44.7) |
(48.9) |
(55.3) |
(50.3) |
(5.4) |
|
(vi) Others |
8288 |
-7691 |
24347 |
-12706 |
36584 |
-133387 |
17390 |
|
|
(4.1) |
-(2.5) |
(9.4) |
-(4.5) |
(16.6) |
-(118.4) |
(14.5) |
Notes: 1. Figures in brackets are percentages to total financial deficit.
2. Item no 1, 2, 3 and 4 are sourced from National Accounts Statistics, CSO. |
Rest of the World (ROW)
The ROW sector captures the transactions between domestic and external sectors. With a range of liberalisation measures undertaken both on the current and capital account, ROW sector steadily gained prominence in the economy. While India adopted the convertibility of rupee for current account transactions by accepting the Article VIII of the IMF in 1994, various measures have been undertaken to further liberalise the capital account as well. The norms for external commercial borrowings (ECBs) and foreign direct investment (FDI) were further relaxed and limits of investment were increased. The foreign institutional investors (FIIs) were allowed to invest in Government securities subject to certain limits. Reflecting this, net capital inflow as percentage to GDP increased from 1.8 per cent in 2001-02 to 9.2 per cent in 2007-08.
Increased liberalisation of current as well as capital account transactions has resulted in larger inflows and outflows between the domestic sectors and ROW. Gross flows to ROW increased from 6.5 per cent of total financial flows in 2001-02 to 13.0 per cent in 2007-08 (Table 1). Increase in uses vis-à-vis sources of ROW since 2004-05 indicate larger capital inflows into the economy (Statement 5). Households
For the purpose of FOF compilation, the household sector is a residual entity, comprising heterogeneous entities like the individuals, unincorporated business enterprises (like sole proprietorships and partnership concerns), farm production units and a number of non-profit institutions. This is a surplus sector, which lends to other sectors. During the period, the surplus funds (uses minus sources) of the sector steadily increased from Rs.2,44,854 crore in 2001-02 to Rs.5,43,114 crore in 2007-08 (Table 4). Relative magnitudes of household surplus flowing to other sectors varied considerably over the years. This has been result of availability of diversified financial products and extension of fiscal benefits to other instruments besides small savings. During the recent period, i.e., in 2006-07 and 2007-08, there is a significant fall in the claims on the Government of the household sector. The trend is particularly evident in the instruments such as small savings. This outcome largely reflects the availability of diversified financial products providing higher returns (Table 4).
Between 2001-02 and 2007-08, on an average, 39.6 per cent of the surplus of the household sector was absorbed by the banking sector, followed by nearly 31.3 per cent by OFI sector, over 26.8 per cent by the Government sector and nearly 2.2 per cent by the PCB sector.
During the period under study, the households’ financing to the Government sector has decreased secularly from 31.4 per cent in 2001-02 to 1.2 per cent in 2007-08, whereas that to the private corporate sector has increased from 0.8 per cent in 2001-02 to 6.3 per cent in 2007-08.
Table 4: Sector Financing: Household Sector |
(Rs. crore) |
Item |
2001-02 |
2002-03 |
2003-04 |
2004-05 |
2005-06 |
2006-07 |
2007-08 |
1 |
2 |
3 |
4 |
5 |
6 |
7 |
8 |
1. |
Savings |
422790 |
471268 |
558576 |
589591 |
716294 |
824493 |
953212 |
2. |
Household Investments |
175314 |
218013 |
245316 |
272045 |
295320 |
341671 |
399923 |
3. |
Surplus Resources (1+2-3) |
247476 |
253255 |
313260 |
317546 |
420974 |
482822 |
553289 |
4. |
Financial Sources |
51727 |
60304 |
69982 |
120566 |
183424 |
176787 |
173136 |
5. |
Financial Uses |
296581 |
322585 |
377385 |
434317 |
597889 |
650429 |
716250 |
6. |
Financial Surplus (6-5) |
244854 |
262282 |
307403 |
313751 |
414466 |
473641 |
543114 |
|
|
(100.0) |
(100.0) |
(100.0) |
(100.0) |
(100.0) |
(100.0) |
(100.0) |
7. |
Surplus made available to the following Sectors |
|
|
|
|
|
|
|
|
(i) Banking |
97977 |
97972 |
126587 |
83670 |
152740 |
209322 |
277784 |
|
|
(40.0) |
(37.4) |
(41.2) |
(26.7) |
(36.9) |
(44.2) |
(51.1) |
|
(ii) Other Financial Institutions |
67821 |
79468 |
63958 |
88509 |
133477 |
183660 |
224760 |
|
|
(27.7) |
(30.3) |
(20.8) |
(28.2) |
(32.2) |
(38.8) |
(41.4) |
|
(iii) Private Corporate Business |
2081 |
93.5 |
1385 |
3956 |
5972 |
23988 |
34130 |
|
|
(0.8) |
(0.0) |
(0.5) |
(1.3) |
(1.4) |
(5.1) |
(6.3) |
|
(iv) Government |
76975 |
84749 |
115474 |
137616 |
122277 |
56671 |
6439 |
|
|
(31.4) |
(32.3) |
(37.6) |
(43.9) |
(29.5) |
(12.0) |
(1.2) |
Notes: 1. Figures in brackets are percentages to total financial deficit.
2. Item no 1, 2 and 3 are sourced from National Accounts Statistics, CSO. |
IV. Instrument-wise Financial Flows
The instrument-wise analysis of financial flows throws light on the aggregate preference pattern of various agents for different financial instruments. An analysis of the trend during the period under study showed that the share of currency and deposits in total claims issued increased from 21.0 per cent in 2001-02 to 25.0 per cent in 2007-08 (Table 5 and Statement 8).
Table 5: Financial Flows by type of Instruments |
(Rs. crore) |
Instruments |
2001-02 |
2002-03 |
2003-04 |
2004-05 |
2005-06 |
2006-07 |
2007-08 |
1 |
2 |
3 |
4 |
5 |
6 |
7 |
8 |
1. |
Currency and Deposits |
200220 |
212376 |
266387 |
304983 |
380777 |
597551 |
728936 |
|
|
(21.0) |
(21.0) |
(24.1) |
(26.0) |
(24.6) |
(28.5) |
(25.0) |
2. |
Investments |
278470 |
306277 |
396147 |
322096 |
390091 |
445342 |
1014479 |
|
|
(29.1) |
(30.3) |
(35.8) |
(27.5) |
(25.2) |
(21.2) |
(34.8) |
|
(a) Central and State |
106533 |
178176 |
194438 |
161969 |
105037 |
110359 |
193990 |
|
Governments’ Securities |
(11.1) |
(17.6) |
(17.6) |
(13.8) |
(6.8) |
(5.3) |
(6.6) |
|
(b) Other Securities |
171937 |
128101 |
201709 |
160128 |
285054 |
334983 |
820489 |
|
of which : |
(18.0) |
(12.7) |
(18.2) |
(13.7) |
(18.4) |
(16.0) |
(28.1) |
|
(i) Units of UTI |
-2660 |
-7190 |
-10893 |
-23153 |
-28617 |
-63423 |
-13751 |
|
|
-(0.3) |
-(0.7) |
-(1.0) |
-(2.0) |
-(1.8) |
-(3.0) |
-(0.5) |
|
(ii) Other Mutual Funds |
9204 |
10008 |
21723 |
-8402 |
49557 |
47181 |
213405 |
|
|
(1.0) |
(1.0) |
(2.0) |
-(0.7) |
(3.2) |
(2.2) |
(7.3) |
3. |
Loans and Advances |
238707 |
268204 |
212491 |
264663 |
424149 |
649187 |
737305 |
|
|
(25.0) |
(26.5) |
(19.2) |
(22.6) |
(27.4) |
(30.9) |
(25.3) |
4. |
Small Savings |
35100 |
47986 |
58903 |
85106 |
81243 |
17544 |
-13601 |
|
|
(3.7) |
(4.7) |
(5.3) |
(7.3) |
(5.2) |
(0.8) |
-(0.5) |
5. |
Life Fund |
41088 |
51348 |
51931 |
66296 |
81243 |
112075 |
125561 |
|
|
(4.3) |
(5.1) |
(4.7) |
(5.7) |
(5.2) |
(5.3) |
(4.3) |
6. |
Provident Fund |
65839 |
71190 |
69752 |
81578 |
89477 |
104558 |
98067 |
|
|
(6.9) |
(7.0) |
(6.3) |
(7.0) |
(5.8) |
(5.0) |
(3.4) |
7. |
Trade Debt |
10535 |
8126 |
11508 |
12554 |
8223 |
21682 |
36922 |
|
|
(1.1) |
(0.8) |
(1.0) |
(1.1) |
(0.5) |
(1.0) |
(1.3) |
8. |
Foreign claims not |
-3661 |
-2306 |
-7955 |
-2749 |
-4778 |
-19264 |
-36476 |
|
elsewhere classified |
-(0.4) |
-(0.2) |
-(0.7) |
-(0.2) |
-(0.3) |
-(0.9) |
-(1.3) |
9. |
Other claims not elsewhere |
89322 |
47866 |
48320 |
38557 |
98493 |
170102 |
226794 |
|
classified |
(9.3) |
(4.7) |
(4.4) |
(3.3) |
(6.4) |
(8.1) |
(7.8) |
10. |
Total Claims Issued |
955620 |
1011067 |
1107484 |
1173084 |
1548917 |
2098776 |
2917987 |
Note: Figures in brackets are percentages to Total Claims Issued. |
The share of investments has fluctuated between 21.2 per cent and 35.8 per cent during 2001-02 to 2007-08. The share of Government securities decreased from 11.1 per cent in 2001-02 to 6.6 per cent in 2007-08. The fall in the share of central and state government securities has been accompanied by a corresponding rise in the share of other securities including mutual funds (Table 5). The share of the other important instrument, namely loans and advances, ranged between 19.2 – 30.9 per cent during 2001-02 to 2007-08 and hovered around 28.0 per cent during the boom period of 2005-07. During 2001-02 to 2007-08, the share of contractual savings instruments such as, provident fund and small savings witnessed a general declining trend. The share of life fund fluctuated in the range of 4.3 per cent and 5.7 per cent.
V. Select Indicators of Financial Development
Each sector of an economy borrows from other sectors by issuing claims on itself, or it lends to other sectors by accepting their claims. Incidentally, a sector may also engage itself in both the activities simultaneously. Financial claims issued in the economy by various economic units are classified into primary issues and secondary issues. Claims issued by non-financial sectors or the ultimate borrower (which include households, private corporate business, the Government and the “rest of the world”) are called primary issues, whereas claims issued by financial intermediaries (such as banks and other financial institutions) are termed as secondary issues. Volumes of these financial flows form the basis of the several indicators of financial development. The period of coverage for the FoF analysis constitutes a significant block in post-reforms period of the Indian economy. Measures taken in pursuance of economic reforms had opened up the external sector for private capital inflows. Besides, the assignment of greater role to the private sector in the economic activities took place. The impact of these policy initiatives was reflected in the trends in FOF accounts. During this period, the economy witnessed a phenomenal surge in the foreign exchange. All these were reflected in large increases in the financial issues, both from the ‘domestic’ and ‘rest of the world’ sectors during 2001-02 to 2007-08 (Table 6 and Statement 7).
Table 6: Selected Indicators of Financial Development |
(Rs. crore) |
|
2001-02 |
2002-03 |
2003-04 |
2004-05 |
2005-06 |
2006-07 |
2007-08 |
1 |
2 |
3 |
4 |
5 |
6 |
7 |
8 |
1. |
Secondary Issues# |
302636 |
412295 |
441713 |
495885 |
678092 |
812299 |
1286082 |
2. |
Primary Issues## |
652984 |
598771 |
665771 |
677199 |
862361 |
1286476 |
1631905 |
|
2.1 Domestic Sectors |
590853 |
535123 |
524011 |
552807 |
760250 |
1056715 |
1252510 |
|
2.2 Rest of the World |
62131 |
63648 |
141760 |
124392 |
102111 |
229761 |
379395 |
3. |
Total Issues (1+2) |
955620 |
1011067 |
1107484 |
1173084 |
1540452 |
2098776 |
2917987 |
4. |
Net Domestic Capital Formation@ |
292359 |
367528 |
479277 |
682171 |
892318 |
1084768 |
1336064 |
5. |
National Income** |
1849361 |
1994217 |
2237414 |
2526285 |
2875958 |
3312569 |
3787596 |
# Refers to issues by financial intermediaries ( i.e., Banks and Other Financial Institutions).
## Refers to issues by all sectors other than financial intermediaries.
@ At Current Prices.
** Net National Product at Factor Cost at Current Prices.
Note: Item nos 4 and 5 are sourced from National Accounts Statistics, CSO. |
Over the period, in consonance with the financial development, total financial issues rose by 205.4 per cent from Rs.9,55,620 crore in 2001-02 to Rs.29,17,987 crore in 2007-08. Secondary issues increased by nearly 325.0 per cent while primary issues rose by 149.9 per cent during the same period (Table 6).
This rise in the financial claims issued by various sectors may be further analysed in terms of financial deepening and widening during the period with a corresponding rise in the role of financial development in national income and capital formation. Various financial development ratios that can be derived from the flow-of-funds data are used for this purpose. These ratios include Finance Ratio, Financial Interrelations Ratio, Intermediation Ratio and New Issue Ratio. On the basis of these ratios, following assessment can be made:
- The finance ratio, the ratio of total financial claims to national income, is an indicator of the rate of financial development in relation to economic growth. The ratio fluctuated with an increasing trend from 0.52 in 2001-02 to 0.77 in 2007-08, reflecting a rise in financial development during the period (Table 7). The rise in finance ratio during 2006-07 and 2007-08 can be attributed to increased borrowings by household as well as corporate sector along with increase in investment abroad.
- The financial inter-relations ratio (i.e., the ratio between total issues to net domestic capital formation) reflects the relation between the financial development and growth of physical investment. The ratio exhibited year-to-year fluctuation ranging between 1.72 and 3.27 during the period. It may be noted that a sharp fall and rise in the net investment (net domestic capital formation) activity has resulted in emergence of kinks in the ratio at least on two occasions. First, during 2001-02, the investment activity collapsed (declined by 5.7 per cent at current market prices) amid global economic slowdown led by dotcom burst. This resulted in a sharp rise in the value of the ratio in 2001-02. Second, a fall in this ratio was witnessed during 2004-05 and 2005-06 when the investment activity accelerated (grew by 42.3 per cent and 30.8 per cent at current prices, respectively) (Chart 2 and Table 7). It may also be noted that during these two years, the claims issued by ROW also declined, which contributed to the fall in financial interrelation ratio.
Table 7: Select Finance Ratio |
Year |
Finance Ratio |
Finance Interrelation Ratio |
New Issue Ratio |
Inter mediation Ratio |
1 |
2 |
3 |
4 |
5 |
1994-95 |
0.51 |
2.48 |
1.35 |
0.84 |
1995-96 |
0.41 |
1.92 |
1.22 |
0.57 |
1996-97 |
0.37 |
2.06 |
1.12 |
0.83 |
1997-98 |
0.49 |
2.71 |
1.63 |
0.67 |
1998-99 |
0.46 |
2.87 |
1.63 |
0.76 |
1999-2000 |
0.34 |
1.9 |
1.01 |
0.89 |
2000-01 |
0.42 |
2.58 |
1.6 |
0.61 |
2001-02 |
0.52 |
3.27 |
2.23 |
0.46 |
2002-03 |
0.51 |
2.75 |
1.63 |
0.69 |
2003-04 |
0.49 |
2.31 |
1.39 |
0.66 |
2004-05 |
0.46 |
1.72 |
0.99 |
0.73 |
2005-06 |
0.54 |
1.73 |
0.97 |
0.79 |
2006-07 |
0.63 |
1.93 |
1.19 |
0.63 |
2007-08 |
0.77 |
2.18 |
1.22 |
0.79 |
Finance Ratio= Total Issue /Net National Product at factors cost
Finance Inter-Relation Ratio= Total Issue/ Net Domestic Capital Formation
New Issue Ratio = Primary Issue/ Net Domestic Capital Formation
Intermediation Ratio= Secondary Issue/Primary Issue |
- The new issue ratio (i.e., the ratio of primary issues to net domestic capital formation) is indicative of the extent of dependence of the non-financial sector on its own funds in financing the capital formation. A downward movement in the ratio suggests increase in the role of financial intermediation in capital formation. This ratio ranged from 0.97 to 2.23 during the period covered in Table 7. As in the case of financial inter-relation ratio, the extreme values of new issue ratio relate to the years when investment declined or increased sharply viz, 2001-02 and 2005-06. The new issue ratio increased in 2006-07 and 2007-08, reflecting increased primary issues by PCB and ROW (Table 7).
- The importance of intermediation by banks and other financial institutions in financing real activities is also reflected in the intermediation ratio (the ratio between the financial instruments issued by the financial institutions and the financial instruments issued by non-financial units). The intermediation ratio fluctuated in a range from 0.46 to 0.79 during the period.
VI. Consistency Check of Flow of Funds Accounts with National Accounts Statistics
Some consistency checks were conducted in the last published FOF accounts in the light of comments and observations received from select external experts at that time. These checks have been conducted for present exercise as well. Various consistency checks undertaken are listed below:
- The reference of earlier financial development ratios has been given in the present study in order to provide historical behavioural movement of financial ratios.
- The ‘rest of world’ sector captures the transactions between domestic sector and external sectors. Therefore, the financial balance (financial sources-financial uses) should reflect the current account balance of the nation. In this regard, the financial balance of ROW is broadly in line with current account balance.
- The household savings estimates which are available from the national accounts statistics and saving as derived from the flow of fund accounts are comparable.
- The sources and uses of small savings are matching in all the years.
- The external experts had also raised some technical issues in compilation of flow of funds accounts such as absence of systematic data sources on household savings in the form of shares and debentures or deposits of non-banking companies and practice of using global paid up capital for blowing up to arrive at population estimates from sample. Further, in the case of local authorities, data for only port trusts are available. These limitations still exist in the present study. In this regard, it may be mentioned that these issued have also been highlighted in the Report of High Level Committee on Savings and Investment (HLC). Accordingly, some recommendations have been made. With the implementation of recommendations of the HLC, some limitations are expected to be taken care of in the next flow of funds accounts.
VII. Recommendations of High Level Committee on Savings and Investment (HLC) Pertaining to Flow Fund Accounts
The High Level Committee on Savings and Investment (2009) made recommendations for timely compilation of flow of funds accounts by removing data gaps. In this regard, the HLC also made various other recommendations to improve the quality of data so as to broaden the coverage of flow of funds accounts. HLC has inter alia assigned important role to apex bodies such as SEBI, IRDA, NABARD to gather information from financial entities under their respective jurisdictions. Some of the select recommendations and their present status are stated in Annex III.
VIII. Emerging Issues and Summing Up
Progressive liberalisation of the Indian economy, growing integration with the global economy and other policy measures are reflected in the fluctuations in growth performance and the pattern of financial flows in the Indian economy. Some of the salient features of the flow of funds accounts during the period of analysis are presented below.
-
Traditionally, the financial system in India was based on large network of public sector banks. Since the economic reforms of 1991, the financial sector has matured in tandem with emergence of other financial institutions providing wide diversified instruments of investment for households and corporates. This broadening of institutions and instruments has enabled intermediation of savings, predominantly by the household sector. The sustained reforms in the financial sector have resulted into rise in financial deepening during this period. The finance ratio increased from 0.52 in 2001-02 to 0.77 in 2007-08.
- In the post-reform period, the external sector has played a significant role in the financial sector. The large external flows, particularly non-debt creating flows have witnessed notable uptrend in foreign investment flows. The ‘rest of the world sector’ started playing an increasingly important role in FOF. The financial flows by sector shows that the share of financial issues of the ‘rest of world sector’ in total financial issues more than doubled from 6.5 per cent in 2001-02 to 13.0 per cent in 2007-08.
- Household sector continued to remain the net surplus sector providing finance to deficit sectors like the PCB and the Government sector. The preferred instruments for households’ savings turned out to be bank deposit, shares and debentures and contractual instruments, like insurance funds. This shift in saving pattern of household sector away from the Government sector instruments shows the increased market accessibility and portfolio diversification in response to the increasing choice of financial instruments.
- The period of FOF also corresponds the period of FRBM Act, where bulk of the Government expenditures has been curtailed to achieve the fiscal prudence. This principle of containment of Government expenditure is also witnessed in FOF accounts as well. The deficit in the Government sector recorded a declining trend.
- Sustained rise in saving and investment during the period under consideration is financed by two means: domestic savings rate and capital inflows from abroad. There was significant improvement in the Government sector in reducing their deficit. Private corporate business sector has been increasingly financing its deficit from their own resources and other sectors.
- The financial interrelation ratio shows that the share of internal resources in capital formation in physical assets has increased.
- With the development in the financial sector and innovation of new instruments, the economy has witnessed a rise in financial deepening during 2001-02 to 2007-08.
Statement 1: Banking Sector |
(Rs. crore) |
Sources |
2001-02 |
2002-03 |
2003-04 |
2004-05 |
2005-06 |
2006-07 |
2007-08 |
1 |
2 |
3 |
4 |
5 |
6 |
7 |
8 |
1. |
Notes in Circulation |
34268 |
25299 |
48316 |
39501 |
80581 |
38674 |
95672 |
|
a) |
Other Financial Institutions |
-166 |
254 |
-82 |
110 |
-216 |
966 |
2932 |
|
b) |
Private Corporate Business |
-5409 |
237 |
-100 |
168 |
-188 |
433 |
16321 |
|
c) |
Government |
11969 |
-3538 |
6250 |
2616 |
28445 |
-28336 |
-4047 |
|
d) |
Households |
27874 |
28346 |
42248 |
36607 |
52540 |
65611 |
80465 |
2. |
Deposits |
143218 |
184763 |
221567 |
263000 |
286984 |
518064 |
636015 |
|
a) |
Other Financial Institutions |
4677 |
5813 |
9937 |
9206 |
10287 |
19931 |
27208 |
|
b) |
Private Corporate Business |
5403 |
6705 |
14002 |
7963 |
13143 |
29023 |
32556 |
|
c) |
Government |
16128 |
17421 |
26234 |
97740 |
-14142 |
144634 |
206058 |
|
d) |
Households |
113255 |
123625 |
142112 |
158467 |
274843 |
311325 |
360970 |
|
e) |
Rest of the World |
4229 |
31142 |
29271 |
-10402 |
2953 |
10479 |
9992 |
|
f) |
Others |
-474 |
57 |
11 |
26 |
-100 |
2672 |
-769 |
3. |
Borrowings |
-8 |
23665 |
19806 |
52257 |
26412 |
12668 |
36935 |
|
a) |
Other Financial Institutions |
45 |
8141 |
7767 |
17200 |
40215 |
-14144 |
11459 |
|
b) |
Government |
60 |
530 |
391 |
389 |
227 |
593 |
527 |
|
c) |
Rest of the World |
-462 |
12385 |
9974 |
33103 |
-14871 |
23688 |
22788 |
|
d) |
Others |
349 |
2609 |
1674 |
1565 |
841 |
2531 |
2161 |
4. |
Debentures |
2558 |
1741 |
640 |
2560 |
2846 |
6280 |
5713 |
|
a) |
Other Financial Institutions |
2315 |
1575 |
579 |
2316 |
2575 |
5683 |
5169 |
|
b) |
Government |
243 |
166 |
61 |
244 |
271 |
597 |
544 |
|
c) |
Households |
0 |
0 |
0 |
0 |
0 |
0 |
0 |
5. |
Paid-up Capital |
3619 |
356 |
1939 |
4327 |
6275 |
3570 |
12961 |
|
a) |
Government |
1969 |
-259 |
1399 |
2719 |
3151 |
1078 |
2354 |
|
b) |
Non-Credit Societies |
94 |
89 |
83 |
76 |
81 |
113 |
106 |
|
c) |
Insurance |
0 |
0 |
0 |
0 |
0 |
0 |
0 |
|
d) |
Households |
202 |
117 |
111 |
263 |
366 |
206 |
766 |
|
e) |
Others |
1354 |
409 |
346 |
1269 |
2676 |
2173 |
9735 |
6. |
Bills Payable |
95 |
7597 |
12227 |
-1106 |
13933 |
3950 |
7643 |
|
a) |
Government |
-16 |
0 |
1 |
7 |
11 |
-19 |
21 |
|
b) |
Non-Credit Societies |
0 |
0 |
2 |
0 |
27 |
-28 |
6 |
|
c) |
Other Financial Institutions |
0 |
0 |
0 |
1 |
4 |
-5 |
3 |
|
d) |
Households |
3 |
4 |
4 |
-2 |
13 |
-22 |
47 |
|
e) |
Others |
108 |
7592 |
12220 |
-1111 |
13877 |
4024 |
7566 |
7. |
Due to Branches or Parent Offices Abroad |
62 |
505 |
17 |
784 |
770 |
-568 |
1326 |
8. |
Other Liabilities |
25232 |
31573 |
-9434 |
13089 |
42458 |
15629 |
34213 |
TOTAL |
209044 |
275497 |
295078 |
374411 |
460259 |
598267 |
830477 |
Statement 1: Banking Sector (Concld.) |
(Rs. crore) |
Uses |
2001-02 |
2002-03 |
2003-04 |
2004-05 |
2005-06 |
2006-07 |
2007-08 |
1 |
2 |
3 |
4 |
5 |
6 |
7 |
8 |
1. |
Gold, Coin and Bullion |
1762 |
1566 |
1169 |
1202 |
7183 |
894 |
8619 |
2. |
Foreign Assets |
64608 |
92346 |
116039 |
119061 |
122203 |
118523 |
346335 |
3. |
One Rupee Notes and Coins |
114 |
-81 |
-161 |
96 |
152 |
-109 |
154 |
4. |
Balances with : |
23 |
17 |
-546 |
493 |
-585 |
1480 |
923 |
|
a) |
Government |
9 |
4 |
-28 |
31 |
-42 |
99 |
64 |
|
b) |
Others |
14 |
13 |
-518 |
462 |
-543 |
1381 |
859 |
5. |
Loans and Advances |
90068 |
120272 |
113206 |
258707 |
396154 |
364288 |
449058 |
|
a) |
Other Financial Institutions |
-13780 |
-2694 |
-931 |
166 |
525 |
2043 |
-531 |
|
b) |
Private Corporate Business |
30965 |
65541 |
55301 |
114658 |
177611 |
140125 |
238506 |
|
c) |
Government |
22607 |
1131 |
-1025 |
30799 |
41743 |
50847 |
44166 |
|
d) |
Households |
43354 |
54116 |
57885 |
111667 |
175010 |
167820 |
164418 |
|
e) |
Others |
6922 |
2178 |
1976 |
1417 |
1265 |
3452 |
2499 |
6. |
Investments |
77257 |
92020 |
136460 |
39637 |
9086 |
53044 |
186220 |
|
a) |
Government Securities |
74306 |
87370 |
125758 |
48823 |
4993 |
60363 |
183360 |
|
|
i) Central/State Government Securities |
73969 |
86513 |
122213 |
51269 |
4838 |
62943 |
181835 |
|
|
ii) Other Government Securities |
337 |
857 |
3545 |
-2446 |
155 |
-2580 |
1525 |
|
b) |
Shares/Debentures of Other Financial Institutions |
951 |
1037 |
2210 |
-2916 |
52 |
-1638 |
988 |
|
c) |
Shares/Debentures of Private Corporate Business |
43 |
451 |
997 |
-3908 |
-1034 |
-2357 |
1685 |
|
d) |
Rest of the World |
21 |
121 |
264 |
-303 |
48 |
-93 |
70 |
|
e) |
Others |
1936 |
3040 |
7231 |
-2059 |
5028 |
-3230 |
118 |
7. |
Due from Branches or Parent Offices Abroad |
62 |
505 |
17 |
784 |
770 |
-568 |
1326 |
8. |
Other Assets |
15493 |
-4910 |
20661 |
54987 |
-20266 |
-7021 |
134636 |
TOTAL |
249387 |
301735 |
386845 |
474966 |
514697 |
530530 |
1127272 |
Statement 1.1: Reserve Bank of India |
(Rs. crore) |
Sources |
2001-02 |
2002-03 |
2003-04 |
2004-05 |
2005-06 |
2006-07 |
2007-08 |
1 |
2 |
3 |
4 |
5 |
6 |
7 |
8 |
1. |
Paid-up Capital |
0 |
0 |
0 |
0 |
0 |
0 |
0 |
2. |
Deposits |
1795 |
-98 |
23469 |
81693 |
-7594 |
116416 |
265471 |
|
a) |
Banking |
2116 |
-466 |
23907 |
7826 |
28282 |
59919 |
132596 |
|
|
i) Commercial Banks |
1682 |
-584 |
23166 |
8031 |
27982 |
58490 |
129194 |
|
|
ii) Co-operatives |
434 |
118 |
741 |
-205 |
300 |
1429 |
3402 |
|
b) |
Other Financial Institutions |
428 |
407 |
-428 |
2123 |
554 |
-4313 |
1682 |
|
|
i) Financial Corporations |
161 |
-19 |
-185 |
-123 |
33 |
48 |
1582 |
|
|
ii) Insurance |
1 |
1 |
-1 |
323 |
-187 |
-138 |
0 |
|
|
iii) Provident Fund |
266 |
425 |
-242 |
1923 |
708 |
-4223 |
100 |
|
|
iv) NABARD |
0 |
0 |
0 |
0 |
0 |
0 |
0 |
|
c) |
Government |
208 |
-274 |
0 |
69913 |
-37019 |
59671 |
132013 |
|
|
i) Central Government |
0 |
1 |
0 |
69913 |
-37019 |
59671 |
132013 |
|
|
ii) State Governments |
208 |
-274 |
0 |
0 |
0 |
0 |
0 |
|
d) |
Rest of the World |
-483 |
178 |
-21 |
1805 |
689 |
-1533 |
-51 |
|
e) |
Others |
-474 |
57 |
11 |
26 |
-100 |
2672 |
-769 |
3. |
Borrowings |
0 |
0 |
0 |
0 |
0 |
0 |
0 |
|
a) |
Rest of the World |
0 |
0 |
0 |
0 |
0 |
0 |
0 |
4. |
Notes In Circulation |
36113 |
26501 |
44163 |
41237 |
84637 |
42506 |
97879 |
|
a) |
Banking |
1845 |
1202 |
-4153 |
1736 |
4056 |
3832 |
2207 |
|
|
i) Commercial Banks |
568 |
1291 |
45 |
1562 |
3809 |
3079 |
1886 |
|
|
ii) Co-operatives |
1278 |
-89 |
-4199 |
173 |
250 |
753 |
321 |
|
b) |
Other Financial Institutions |
-166 |
254 |
-82 |
110 |
-216 |
966 |
2932 |
|
|
i) Financial Corporations |
-163 |
234 |
-88 |
113 |
-224 |
976 |
2889 |
|
|
ii) Insurance |
-4 |
19 |
7 |
-3 |
8 |
-10 |
43 |
|
c) |
Private Corporate Business |
-5409 |
237 |
-100 |
168 |
-188 |
433 |
16321 |
|
|
i) Non-Credit Societies |
0 |
0 |
0 |
0 |
0 |
0 |
0 |
|
|
ii) Companies |
-5409 |
237 |
-100 |
168 |
-188 |
433 |
16321 |
|
d) |
Government |
11969 |
-3538 |
6250 |
2616 |
28445 |
-28336 |
-4047 |
|
|
i) Central Government } |
-1057 |
-93 |
90 |
-103 |
96 |
-17 |
243 |
|
|
ii) State Governments } |
0 |
0 |
0 |
0 |
0 |
0 |
0 |
|
|
iii) Local Authorities |
-12 |
-10 |
-5 |
-2 |
-3 |
-20 |
-22 |
|
|
iv) Commercial Undertakings |
10373 |
-3435 |
6165 |
2721 |
28352 |
-28299 |
-4268 |
|
e) |
Households |
27874 |
28346 |
42248 |
36607 |
52540 |
65611 |
80465 |
5. |
Bills Payable |
-28 |
8 |
6 |
9 |
104 |
57 |
-122 |
|
a) |
Banking |
0 |
1 |
-1 |
0 |
0 |
0 |
0 |
|
|
i) Commercial Banks |
0 |
0 |
0 |
0 |
0 |
0 |
0 |
|
b) |
Other Financial Institutions |
0.04 |
0.09 |
0.06 |
1 |
4.28 |
-4.79 |
3 |
|
|
i) Insurance |
0 |
0 |
0 |
1 |
-1 |
0 |
0 |
|
c) |
Private Corporate Business |
0 |
0 |
2 |
0 |
27 |
-28 |
6 |
|
|
i) Companies |
0 |
0 |
2 |
0 |
27 |
-28 |
6 |
|
d) |
Government |
-15.98 |
0 |
1 |
7 |
11 |
-19 |
21 |
|
|
i) Central Government |
-15 |
0 |
0 |
1 |
-1 |
0 |
3 |
|
|
ii) Local Authorities. |
0 |
0 |
1 |
2 |
8 |
-11 |
0 |
|
e) |
Households |
2.85 |
3.76 |
3.7 |
-1.93 |
13.14 |
-22.26 |
47.27 |
|
f) |
Others |
-15 |
2 |
0 |
3 |
48 |
131 |
-199 |
6. |
Other Liabilities(Net) |
24189 |
27174 |
-17209 |
14191 |
40130 |
9956 |
31577 |
TOTAL |
62352 |
53228 |
50591 |
137373 |
115984 |
177787 |
382542 |
Statement 1.1: Reserve Bank of India (Concld.) |
(Rs. crore) |
Uses |
2001-02 |
2002-03 |
2003-04 |
2004-05 |
2005-06 |
2006-07 |
2007-08 |
1 |
2 |
3 |
4 |
5 |
6 |
7 |
8 |
1. |
Gold, Coin and Bullion |
1762 |
1566 |
1169 |
1202 |
7183 |
894 |
8619 |
2. |
Foreign Assets |
64608 |
92346 |
116039 |
119061 |
122203 |
118523 |
346335 |
3. |
Rupee Coins and Small Coins |
83 |
-92 |
22 |
57 |
2 |
-137 |
120 |
4. |
Loans and Advances |
-14158 |
-15503 |
-1612 |
-2328 |
-1587 |
6769 |
-1666 |
|
a) |
Banking |
-2116 |
-2881 |
-143 |
105 |
-106 |
6411 |
-1823 |
|
|
i) Commercial Banks |
-2119 |
-2821 |
-102 |
95 |
-93 |
6308 |
-1739 |
|
|
ii) Co-operatives |
3 |
-59 |
-41 |
10 |
-13 |
103 |
-84 |
|
b) |
Other Financial Institutions |
-13864 |
-2881 |
-1087 |
-172 |
-5 |
153 |
251 |
|
|
i) Financial Corporations |
-13864 |
-2881 |
-1087 |
-172 |
-5 |
153 |
251 |
|
c) |
Government |
1728 |
-9806 |
-338 |
-2220 |
-1465 |
179 |
-113 |
|
|
i) Central Government |
-219 |
-5176 |
0 |
0 |
0 |
0 |
0 |
|
|
ii) State Governments |
1947 |
-4630 |
-338 |
-2220 |
-1465 |
179 |
-113 |
|
d) |
Private Corporate Business |
45 |
40 |
-20 |
-20 |
-11 |
16 |
14 |
|
|
i) Non- Credit Societies |
45 |
40 |
-20 |
-20 |
-11 |
16 |
14 |
|
e) |
Households** |
45 |
28 |
-20 |
-20 |
-12 |
15 |
6 |
|
f ) |
Others |
5 |
-3 |
-5 |
-1 |
12 |
-5 |
-1 |
5. |
Investments |
877 |
-26771 |
-37216 |
-4254 |
1179 |
-11489 |
-6042 |
|
a) |
Banking |
0 |
0 |
0 |
0 |
0 |
0 |
-1223 |
|
|
i) Commercial Banks |
0 |
0 |
0 |
0 |
0 |
0 |
-1223 |
|
b) |
Other Financial Institutions |
1107 |
0 |
100 |
-500 |
0 |
0 |
0 |
|
|
i) Financial Corporations |
1107 |
0 |
100 |
-500 |
0 |
0 |
0 |
|
c) |
Government |
-259 |
-26783 |
-37342 |
-3758 |
1185 |
-11493 |
-4818 |
|
|
i) Central Government |
-259 |
-26783 |
-37342 |
-3758 |
1185 |
-11493 |
-4818 |
|
|
(a) Treasury Bills |
0 |
0 |
-16688 |
0 |
0 |
0 |
0 |
|
|
(b) Other Central Government |
|
|
|
|
|
|
|
|
|
Securities |
-259 |
-26783 |
-20654 |
-3758 |
1185 |
-11493 |
-4818 |
|
d) |
Rest of the world |
29 |
12 |
26 |
4 |
-6 |
5 |
0 |
|
e) |
Others |
0 |
0 |
0 |
0 |
0 |
0 |
0 |
6. |
Other Assets (Net) |
0 |
0 |
0 |
0 |
0 |
0 |
0 |
TOTAL |
53172 |
51547 |
78401 |
113738 |
128979 |
114560 |
347367 |
**Data relate to loans to employees. |
Statement 1.2: Commercial Banks |
(Rs. crore) |
Sources |
2001-02 |
2002-03 |
2003-04 |
2004-05 |
2005-06 |
2006-07 |
2007-08 |
1 |
2 |
3 |
4 |
5 |
6 |
7 |
8 |
1. |
Paid-Up Capital |
3423 |
162 |
1480 |
4101 |
5817 |
3053 |
12526 |
|
a) |
Banking |
-3 |
7 |
14 |
25 |
14 |
243 |
204 |
|
|
i) Reserve Bank of India |
0 |
0 |
0 |
0 |
0 |
0 |
0 |
|
b) |
Other Financial Institutions |
0 |
0 |
0 |
0 |
0 |
0 |
0 |
|
|
i) Insurance |
0 |
0 |
0 |
0 |
0 |
0 |
0 |
|
c) |
Government |
1882 |
-343 |
1033 |
2566 |
2785 |
457 |
1850 |
|
|
i) Central Government |
1883 |
-345 |
1027 |
2555 |
2780 |
353 |
1763 |
|
|
ii) State Governments |
-2 |
3 |
6 |
11 |
6 |
104 |
87 |
|
d) |
Households |
190 |
89 |
87 |
241 |
342 |
180 |
737 |
|
e) |
Others |
1354 |
409 |
346 |
1269 |
2676 |
2173 |
9735 |
2. |
Deposits |
115466 |
195816 |
225278 |
192754 |
327321 |
480499 |
522036 |
|
a) |
Banking |
-16327 |
11981 |
2098 |
5918 |
3908 |
19891 |
20679 |
|
|
i) Co-operatives |
2994 |
2956 |
5727 |
4255 |
5318 |
16197 |
14673 |
|
b) |
Other Financial Institutions |
4249 |
5406 |
10365 |
7083 |
9733 |
24244 |
25526 |
|
|
i) Financial Corporations |
2590 |
3087 |
5920 |
4141 |
5538 |
14559 |
14722 |
|
|
ii) Insurance |
736 |
1036 |
2123 |
1266 |
2072 |
4297 |
5108 |
|
|
iii) Provident Fund |
326 |
520 |
733 |
719 |
568 |
1980 |
1831 |
|
c) |
Private Corporate Business |
5104 |
6536 |
13395 |
8255 |
13020 |
29123 |
32638 |
|
|
i) Companies |
4851 |
6233 |
12893 |
7824 |
12588 |
27695 |
31358 |
|
|
ii) Non-Credit Societies |
253 |
303 |
502 |
431 |
431 |
1428 |
1280 |
|
d) |
Government |
14990 |
17385 |
28155 |
25295 |
23649 |
84013 |
72425 |
|
|
i) Central & State Governments |
4420 |
5596 |
8483 |
8092 |
6830 |
25293 |
21744 |
|
|
ii) Local Authorities |
6573 |
7138 |
11682 |
10596 |
9829 |
36324 |
30359 |
|
|
iii) Commercial Undertakings |
3996 |
4651 |
7990 |
6607 |
6989 |
22395 |
20321 |
|
e) |
Rest Of the World |
4712 |
30964 |
29292 |
-12207 |
2265 |
12012 |
10043 |
|
f) |
Households |
102738 |
123544 |
141973 |
158410 |
274747 |
311215 |
360727 |
3. |
Borrowings |
-5127 |
12622 |
15690 |
47717 |
29855 |
13586 |
29128 |
|
a) |
Banking |
-4273 |
-3752 |
360 |
482 |
6768 |
9543 |
-241 |
|
|
i) Reserve Bank Of India |
-5003 |
-3224 |
-92 |
103 |
6506 |
7849 |
263 |
|
|
ii) Co-operatives |
730 |
-528 |
452 |
379 |
261 |
1694 |
-504 |
|
b) |
Other Financial Institutions |
-392 |
3989 |
5356 |
14132 |
37958 |
-19646 |
6581 |
|
|
i) Financial Corporations |
-392 |
3989 |
5356 |
14132 |
37958 |
-19646 |
6581 |
|
c) |
Rest Of the World |
-462 |
12385 |
9974 |
33103 |
-14871 |
23688 |
22788 |
4. |
Bills Payable |
123 |
7590 |
12220 |
-1114 |
13829 |
3893 |
7766 |
|
a) |
In India |
94 |
7604 |
12126 |
-977 |
13732 |
3906 |
7711 |
|
b) |
Outside India |
29 |
-14 |
94 |
-137 |
97 |
-13 |
55 |
5. |
Other Liabilities |
0 |
0 |
0 |
0 |
0 |
0 |
0 |
6. |
Branch adjustment with offices outside India |
3329 |
-313 |
5353 |
30743 |
-26743 |
-6840 |
15213 |
7. |
Due to Branches/Parent offices abroad |
62 |
505 |
17 |
784 |
770 |
-568 |
1326 |
|
TOTAL |
117276 |
216382 |
260038 |
274985 |
350849 |
493622 |
587995 |
Statement 1.2: Commercial Banks (Concld.) |
(Rs. crore) |
Uses |
2001-02 |
2002-03 |
2003-04 |
2004-05 |
2005-06 |
2006-07 |
2007-08 |
1 |
2 |
3 |
4 |
5 |
6 |
7 |
8 |
1. |
Cash in Hand |
587 |
1322 |
-4219 |
1955 |
7743 |
3092 |
1906 |
|
a) |
RBI Notes |
568 |
1309 |
-4120 |
1920 |
7598 |
3079 |
1886 |
|
b) |
One Rupee Notes and Coins |
19 |
13 |
-99 |
35 |
145 |
13 |
20 |
2. |
Balances with RBI |
2858 |
-4067 |
10662 |
41106 |
16958 |
53161 |
76900 |
3. |
Investments |
70438 |
113633 |
133564 |
39164 |
-3023 |
69698 |
186624 |
|
a) |
Banking |
-8 |
-4 |
1 |
-16 |
-8 |
-2 |
2 |
|
|
i) Co-operatives |
-8 |
-4 |
1 |
-16 |
-8 |
-2 |
2 |
|
b) |
Other Financial Institutions |
-451 |
470 |
1880 |
-2022 |
-426 |
-1409 |
1012 |
|
|
i) Financial Corporations |
-451 |
470 |
1880 |
-2022 |
-426 |
-1409 |
1012 |
|
c) |
Private Corporate Business |
43 |
451 |
997 |
-3908 |
-1034 |
-2357 |
1685 |
|
|
i) Companies |
43 |
451 |
997 |
-3908 |
-1034 |
-2357 |
1685 |
|
d) |
Government |
70862 |
112607 |
130448 |
45417 |
-1609 |
73564 |
183856 |
|
|
i) Central Government |
60331 |
93557 |
91584 |
44493 |
2619 |
72543 |
141066 |
|
|
ii) State Governments |
10811 |
18684 |
38178 |
3719 |
-3268 |
2773 |
41538 |
|
|
iii) Commercial Undertakings |
-166 |
258 |
609 |
-2645 |
-772 |
-1494 |
1068 |
|
|
iv) Local Authorities |
-29 |
-7 |
-15 |
-23 |
-6 |
-20 |
15 |
|
|
v) Other Government Securities |
-85 |
115 |
92 |
-127 |
-182 |
-237 |
170 |
|
e) |
Rest of the World |
-8 |
109 |
238 |
-307 |
54 |
-98 |
70 |
4. |
Bank Credit |
87878 |
122179 |
104317 |
252125 |
388835 |
350084 |
433885 |
|
a) |
Banking |
15 |
34 |
28 |
62 |
97 |
2197 |
-1995 |
|
|
i) Co-operatives |
15 |
34 |
28 |
62 |
97 |
2197 |
-1995 |
|
b) |
Other Financial Institutions |
84 |
187 |
156 |
338 |
530 |
1890 |
-782 |
|
c) |
Private Corporate Business |
27563 |
61725 |
51304 |
111403 |
174500 |
132185 |
232662 |
|
|
i) Non-Credit Societies |
492 |
1104 |
917 |
1991 |
3120 |
3205 |
3317 |
|
|
ii) Companies |
27071 |
60621 |
50387 |
109412 |
171381 |
128980 |
229345 |
|
d) |
Government |
20879 |
10937 |
-687 |
33019 |
43208 |
50668 |
44279 |
|
|
i) State Governments |
2637 |
-148 |
-1776 |
1976 |
1657 |
2762 |
1480 |
|
|
ii) Commercial Undertakings |
17499 |
9421 |
-295 |
28039 |
36845 |
43071 |
37795 |
|
|
iii) Quasi-Government Bodies |
743 |
1664 |
1384 |
3004 |
4706 |
4835 |
5004 |
|
e) |
Households |
39337 |
49296 |
53516 |
107303 |
170500 |
163144 |
159721 |
5. |
Branch Adjustment |
-1696 |
-9253 |
-5928 |
-1727 |
37586 |
-32733 |
19222 |
|
a) |
With Offices outside India |
113 |
2832 |
-3132 |
1429 |
32953 |
-32259 |
676 |
6. |
Other Assets |
8367 |
-1629 |
36043 |
53625 |
-20334 |
-9787 |
132935 |
TOTAL |
168432 |
222185 |
274439 |
386248 |
427765 |
433515 |
851473 |
Statement 1.3: Co-Operative Banks and Credit Societies |
(Rs. crore) |
Sources |
2001-02 |
2002-03 |
2003-04 |
2004-05 |
2005-06 |
2006-07 |
2007-08 |
1 |
2 |
3 |
4 |
5 |
6 |
7 |
8 |
1. |
Paid-Up Capital |
193 |
201 |
473 |
250 |
471 |
761 |
639 |
|
a) |
Non-Credit Societies |
94 |
89 |
83 |
76 |
81 |
113 |
106 |
|
b) |
Government |
87 |
84 |
366 |
153 |
366 |
621 |
503 |
|
c) |
Households |
12 |
28 |
24 |
21 |
24 |
27 |
29 |
|
d) |
Others |
0 |
0 |
0 |
0 |
0 |
0 |
0 |
2. |
Debentures |
13229 |
1926 |
819 |
2771 |
3114 |
6766 |
6217 |
|
a) |
Commercial Banks |
154 |
104 |
39 |
154 |
172 |
377 |
344 |
|
b) |
Financial Corporations |
2315 |
1575 |
579 |
2316 |
2575 |
5683 |
5169 |
|
c) |
Insurance |
0 |
0 |
0 |
0 |
0 |
0 |
0 |
|
d) |
Government |
243 |
166 |
61 |
244 |
271 |
597 |
544 |
|
e) |
Households |
0 |
0 |
0 |
0 |
0 |
0 |
0 |
3. |
Deposits |
11746 |
560 |
-1174 |
2297 |
-553 |
959 |
1782 |
|
a) |
Non-Credit Societies |
299 |
169 |
607 |
-292 |
123 |
-100 |
-82 |
|
b) |
Local Bodies |
930 |
310 |
-1921 |
2532 |
-772 |
950 |
1620 |
|
c) |
Households |
10517 |
81 |
140 |
57 |
96 |
109 |
243 |
|
d) |
Others |
0 |
0 |
0 |
0 |
0 |
0 |
0 |
4. |
Borrowings |
1113 |
9027 |
5047 |
6886 |
5325 |
13073 |
11595 |
|
a) |
R B I |
0 |
0 |
0 |
0 |
0 |
0 |
0 |
|
b) |
Commercial Banks |
267 |
1736 |
571 |
1864 |
2000 |
4447 |
4028 |
|
c) |
Other Financial Institutions |
437 |
4152 |
2411 |
3068 |
2257 |
5502 |
4879 |
|
d) |
Government |
60 |
530 |
391 |
389 |
227 |
593 |
527 |
|
e) |
Others |
349 |
2609 |
1674 |
1565 |
841 |
2531 |
2161 |
5. |
Other Liabilities |
1043 |
4399 |
7775 |
-1102 |
2328 |
5673 |
2636 |
TOTAL |
27324 |
16112 |
12939 |
11103 |
10684 |
27232 |
22869 |
Statement 1.3: Co-Operative Banks and Credit Societies (Concld.) |
(Rs. crore) |
Uses |
2001-02 |
2002-03 |
2003-04 |
2004-05 |
2005-06 |
2006-07 |
2007-08 |
1 |
2 |
3 |
4 |
5 |
6 |
7 |
8 |
1. |
Cash in Hand |
612 |
-93 |
-4309 |
175 |
254 |
761 |
699 |
|
a) |
Reserve Bank Of India |
600 |
-91 |
-4225 |
172 |
249 |
746 |
685 |
|
b) |
One Rupee Notes and Coins |
12 |
-2 |
-84 |
3 |
5 |
15 |
14 |
2. |
Deposits |
308 |
176 |
-3416 |
3253 |
-3985 |
9775 |
6111 |
|
a) |
Reserve Bank Of India |
165 |
48 |
-236 |
330 |
-475 |
998 |
653 |
|
b) |
Commercial Banks |
120 |
111 |
-2634 |
2430 |
-2925 |
7297 |
4535 |
|
c) |
Government |
9 |
4 |
-28 |
31 |
-42 |
99 |
64 |
|
d) |
Others |
14 |
13 |
-518 |
462 |
-543 |
1381 |
859 |
3. |
Loans and Advances |
14246 |
10749 |
10387 |
9077 |
8897 |
16042 |
13021 |
|
a) |
Non-Credit Societies |
3357 |
3776 |
4017 |
3275 |
3122 |
7924 |
5830 |
|
b) |
Households |
3972 |
4792 |
4389 |
4384 |
4522 |
4661 |
4691 |
|
c) |
Others |
6917 |
2181 |
1981 |
1418 |
1253 |
3457 |
2500 |
4. |
Investments |
5934 |
5153 |
40113 |
4711 |
10923 |
-5167 |
4416 |
|
a) |
Shares of Non-Credit Societies |
0 |
0 |
0 |
0 |
0 |
0 |
0 |
|
b) |
Shares/Debentures of Other Financial Institutions |
295 |
567 |
230 |
-394 |
478 |
-229 |
-23 |
|
c) |
Government Securities |
3086 |
1055 |
29793 |
6815 |
4302 |
-880 |
4049 |
|
d) |
Semi-Government Securities |
617 |
491 |
2859 |
349 |
1115 |
-828 |
273 |
|
e) |
Others |
1936 |
3040 |
7231 |
-2059 |
5028 |
-3230 |
118 |
5. |
Other Assets |
7126 |
-3281 |
-15382 |
1362 |
68 |
2766 |
1701 |
|
TOTAL |
28226 |
12704 |
27393 |
18578 |
16157 |
24177 |
25949 |
Statement 2: Other Financial Institutions |
(Rs. crore) |
Sources |
2001-02 |
2002-03 |
2003-04 |
2004-05 |
2005-06 |
2006-07 |
2007-08 |
1 |
2 |
3 |
4 |
5 |
6 |
7 |
8 |
1. |
Paid-up Capital |
8315 |
-5923 |
11020 |
4362 |
18943 |
8518 |
-2345 |
|
a) |
Banking |
791 |
6 |
-36 |
-879 |
246 |
-73 |
7 |
|
|
i) Reserve Bank of India |
0 |
100 |
0 |
-150 |
0 |
100 |
10 |
|
|
ii) Commercial Banks |
789 |
-92 |
-19 |
-730 |
243 |
-170 |
-1 |
|
|
iii) Co-operatives |
1 |
-2 |
-16 |
1 |
3 |
-3 |
-3 |
|
b) |
Private Corporate Business |
-306 |
9 |
-19 |
74 |
-64 |
121 |
25 |
|
c) |
Government |
700 |
131 |
167 |
1176 |
261 |
38 |
977 |
|
|
i) Central Government |
300 |
285 |
144 |
973 |
194 |
471 |
308 |
|
|
ii) State Governments |
400 |
-154 |
23 |
203 |
67 |
-433 |
669 |
|
d) |
Rest of the World |
-367 |
-4 |
2 |
3 |
263 |
-525 |
65 |
|
e) |
Households |
1375 |
-3680 |
333 |
2853 |
-3135 |
3494 |
2371 |
|
f) |
Others |
6121 |
-2386 |
10573 |
1134 |
21372 |
5464 |
-5790 |
2. |
Bonds and Debentures |
-13344 |
8925 |
8857 |
-468 |
10325 |
-8023 |
5159 |
|
a) |
Banking |
-15470 |
1888 |
13408 |
-7215 |
698 |
-3732 |
-2884 |
|
|
i) Reserve Bank of India |
-8 |
-3 |
-2 |
-2 |
0 |
0 |
0 |
|
|
ii) Commercial Banks |
-14931 |
2042 |
13283 |
-6400 |
574 |
-3953 |
-2966 |
|
|
iii) Co-operatives |
-531 |
-151 |
128 |
-813 |
124 |
221 |
82 |
|
b) |
Private Corporate Business |
-5594 |
10873 |
-8378 |
14593 |
4273 |
-10003 |
-3671 |
|
c) |
Government |
7436 |
-3009 |
-173 |
-5330 |
-77 |
370 |
-15 |
|
d) |
Rest of the World |
-2766 |
-388 |
860 |
1939 |
1451 |
-1922 |
1089 |
|
e) |
Households |
147 |
5248 |
2633 |
-834 |
5319 |
2115 |
4279 |
|
f) |
Others |
2902 |
-5686 |
505 |
-3621 |
-1339 |
5149 |
6360 |
3. |
Deposits |
2363 |
6276 |
-4090 |
-3013 |
-2733 |
23197 |
15262 |
|
a) |
Banking |
-7146 |
-1335 |
823 |
4336 |
-4854 |
20849 |
11330 |
|
b) |
Companies |
-119 |
23 |
-11 |
-419 |
36 |
9 |
38 |
|
c) |
Government |
-202 |
61 |
0 |
-103 |
-9 |
-34 |
36 |
|
d) |
Households |
3566 |
5389 |
-122 |
-455 |
2103 |
2316 |
2107 |
|
e) |
Others |
6265 |
2138 |
-4780 |
-6373 |
-8 |
57 |
1751 |
4. |
Borrowings |
3008 |
26457 |
20214 |
30273 |
27308 |
23725 |
41464 |
|
a) |
Banking |
15433 |
15193 |
13529 |
32192 |
38529 |
12501 |
29851 |
|
|
i) Reserve Bank of India |
-3305 |
-1209 |
-2729 |
-675 |
-932 |
-3001 |
184 |
|
|
ii) Commercial Banks |
18737 |
16400 |
16255 |
32863 |
39456 |
15495 |
29660 |
|
|
iii) Co-operatives |
1 |
2 |
3 |
4 |
5 |
6 |
7 |
|
b) |
Private Corporate Business |
150 |
16845 |
2582 |
-16278 |
-4907 |
-1059 |
-1183 |
|
c) |
Government |
-6059 |
-2714 |
664 |
-3066 |
-107 |
-700 |
-189 |
|
|
i) Central Government |
-4870 |
-2666 |
686 |
-3376 |
-96 |
-844 |
-32 |
|
|
ii) State Governments |
-1189 |
-48 |
-21 |
311 |
-11 |
144 |
-157 |
|
d) |
Rest of the World |
-7849 |
-941 |
374 |
1589 |
-2425 |
2268 |
2294 |
|
e) |
Households |
2 |
568 |
678 |
1692 |
2514 |
3038 |
3646 |
|
f) |
Others |
1331 |
-2494 |
2388 |
14144 |
-6296 |
7678 |
7045 |
Statement 2: Other Financial Institutions (Contd.) |
(Rs. crore) |
Sources |
2001-02 |
2002-03 |
2003-04 |
2004-05 |
2005-06 |
2006-07 |
2007-08 |
1 |
2 |
3 |
4 |
5 |
6 |
7 |
8 |
5. |
Life Fund |
39043 |
49190 |
49118 |
63887 |
77722 |
108188 |
121053 |
|
a) |
In India |
39191 |
49234 |
48749 |
63886 |
77509 |
107926 |
120776 |
|
b) |
Outside India |
-148 |
-44 |
369 |
2 |
213 |
262 |
277 |
6. |
Provident /Pension /DLI Funds |
46609 |
48441 |
48952 |
56551 |
62581 |
72106 |
70879 |
|
a) |
Private Corporate Business |
0 |
0 |
0 |
0 |
0 |
0 |
0 |
|
b) |
Government |
19230 |
22749 |
20800 |
25026 |
26896 |
32452 |
27188 |
|
c) |
Households |
27379 |
25692 |
28152 |
31525 |
35685 |
39654 |
43691 |
7. |
Unit Capital |
-2660 |
-7190 |
-10893 |
-23153 |
-28617 |
-63423 |
-13751 |
|
a) |
Banking |
0 |
0 |
0 |
0 |
0 |
0 |
0 |
|
b) |
Companies |
0 |
0 |
0 |
0 |
0 |
0 |
0 |
|
c) |
Households |
-1857 |
-1618 |
-8586 |
-3146 |
-444 |
-310 |
-324 |
|
d) |
Rest of the World |
1 |
2 |
3 |
4 |
5 |
6 |
7 |
|
e) |
Others |
-804 |
-5574 |
-2310 |
-20011 |
-28178 |
-63120 |
-13434 |
8. |
Other Mutual Funds |
9204 |
10008 |
21723 |
-8402 |
49557 |
47181 |
213405 |
|
a) |
Banking |
-825 |
3236 |
4310 |
468 |
-5970 |
241 |
16128 |
|
b) |
Companies |
2059 |
4839 |
4009 |
5903 |
30719 |
40479 |
87859 |
|
c) |
Households |
5079 |
4293 |
4519 |
1550 |
22606 |
34709 |
56799 |
|
d) |
ROW |
3696 |
3215 |
11196 |
3687 |
30379 |
34873 |
66053 |
|
e) |
Others |
-804 |
-5574 |
-2310 |
-20011 |
-28178 |
-63120 |
-13434 |
9. |
Trade Debt |
-182 |
-411 |
-137 |
-243 |
-264 |
105 |
118 |
10 |
Other Liabilities |
1236 |
1024 |
1871 |
1680 |
3009 |
2458 |
4364 |
|
a) |
In India |
1236 |
1024 |
1871 |
1680 |
3009 |
2458 |
4364 |
|
b) |
Outside India |
0 |
0 |
0 |
0 |
0 |
0 |
0 |
TOTAL |
93592 |
136798 |
146635 |
121474 |
217832 |
214032 |
455605 |
Statement 2: Other Financial Institutions (Concld.) |
(Rs. crore) |
Uses |
2001-02 |
2002-03 |
2003-04 |
2004-05 |
2005-06 |
2006-07 |
2007-08 |
1 |
2 |
3 |
4 |
5 |
6 |
7 |
8 |
1. |
Currency |
2610 |
4162 |
609 |
-496 |
1529 |
-1132 |
13273 |
|
a) |
RBI Notes |
1464 |
2194 |
-42 |
-171 |
682 |
-101 |
8898 |
|
b) |
One Rupee Notes and Coins |
1146 |
1968 |
651 |
-325 |
847 |
-1031 |
4375 |
2. |
Deposits |
-7248 |
347 |
13607 |
13352 |
20785 |
21263 |
18446 |
|
a) |
Reserve Bank of India |
274 |
-140 |
357 |
498 |
-926 |
-150 |
-4 |
|
b) |
Commercial Banks |
-10013 |
12336 |
9408 |
13319 |
17111 |
28390 |
19363 |
|
c) |
Co-operatives |
-116 |
24 |
-3 |
-13 |
177 |
-135 |
73 |
|
d) |
Companies |
-239 |
0 |
-1 |
32 |
271 |
-240 |
4 |
|
e) |
Government |
-6348 |
-1 |
34 |
-3 |
-6 |
-15 |
150 |
|
f) |
Rest of the World |
-1372 |
-1086 |
-31 |
-796 |
-109 |
334 |
300 |
|
g) |
Others |
10565 |
-10786 |
3843 |
314 |
4268 |
-6921 |
-1440 |
3. |
Loans and Advances |
-10586 |
36147 |
41529 |
69913 |
57758 |
124918 |
117894 |
|
a) |
Banking |
-370 |
4436 |
759 |
15713 |
890 |
10749 |
-711 |
|
|
i) Commercial banks |
-1763 |
2741 |
-1063 |
13594 |
-937 |
7730 |
-1691 |
|
|
ii) Co-operatives |
1393 |
1695 |
1822 |
2120 |
1827 |
3019 |
980 |
|
b) |
Private Corporate Business |
-87134 |
25560 |
55721 |
77231 |
56996 |
52966 |
82637 |
|
|
i) Companies |
-87140 |
24522 |
55712 |
77474 |
57368 |
53361 |
82605 |
|
|
ii) Non-credit Societies |
6 |
1038 |
10 |
-243 |
-372 |
-395 |
32 |
|
c) |
Government |
-9448 |
-6839 |
8492 |
-26060 |
24012 |
38747 |
24711 |
|
|
i) Central Government |
2993 |
-10937 |
653 |
-2702 |
-48 |
24342 |
7642 |
|
|
ii) State Governments |
-4567 |
4357 |
945 |
-3224 |
16756 |
-14524 |
17098 |
|
|
iii) Local Authorities |
0 |
0 |
0 |
0 |
0 |
0 |
0 |
|
|
iv) Electricity Boards |
-6709 |
0 |
0 |
0 |
0 |
0 |
0 |
|
|
v) Commercial Undertakings |
-1165 |
-259 |
6894 |
-20133 |
7304 |
28929 |
-29 |
|
d) |
Rest of the World |
-25 |
530 |
-331 |
-35 |
2246 |
2279 |
2886 |
|
e) |
Households |
6879 |
5247 |
12261 |
8318 |
8414 |
9388 |
8702 |
|
f) |
Others |
79511 |
7212 |
-35372 |
-5254 |
-34799 |
10788 |
-332 |
4. |
Investments |
218405 |
81874 |
125606 |
208459 |
272913 |
323414 |
290274 |
|
a) |
Banking |
-2876 |
2773 |
19092 |
1615 |
1244 |
22066 |
-36562 |
|
|
i) Commercial banks |
-3429 |
1170 |
17192 |
-565 |
-539 |
18900 |
-37442 |
|
|
ii) Co-operatives |
553 |
1603 |
1899 |
2180 |
1783 |
3166 |
880 |
|
b) |
Private Corporate Business |
31340 |
2551 |
4686 |
-24503 |
10197 |
28299 |
28725 |
|
|
i) Companies |
31339 |
2549 |
4683 |
-24507 |
10192 |
28293 |
28718 |
|
|
(1) Shares |
20979 |
14935 |
-679 |
-7046 |
10902 |
29561 |
27790 |
|
|
(2) Debentures |
10360 |
-12386 |
5362 |
-17461 |
-710 |
-1268 |
928 |
|
|
ii) Non-credit Societies |
1 |
2 |
3 |
4 |
5 |
6 |
7 |
|
c) |
Government |
162047 |
46370 |
78149 |
245635 |
240212 |
237886 |
242718 |
|
|
i) Central Government |
104415 |
88308 |
84053 |
268519 |
225268 |
200507 |
271881 |
|
|
ii) State Governments |
17300 |
-2946 |
-5752 |
-25035 |
1496 |
15118 |
-7122 |
|
|
iii) Small Savings |
0 |
0 |
0 |
0 |
0 |
0 |
0 |
|
|
iv) Local Authorities |
0 |
0 |
0 |
0 |
0 |
0 |
0 |
|
|
v) Electricity Boards |
-598 |
0 |
0 |
0 |
0 |
0 |
0 |
|
|
vi) Commercial Undertakings |
40930 |
-38992 |
-151 |
2151 |
13448 |
22261 |
-22041 |
|
d) |
Rest of the World |
-1111 |
4 |
73 |
0 |
-13 |
-46 |
-36 |
|
e) |
Others |
29004 |
30176 |
23606 |
-14287 |
21273 |
35209 |
55428 |
5. |
Other Assets |
1358 |
8176 |
-1978 |
9325 |
-18492 |
19424 |
-10243 |
|
a) |
Banking |
0 |
2405 |
851 |
1792 |
-2462 |
-608 |
207 |
|
b) |
Central Government |
0 |
0 |
0 |
0 |
0 |
0 |
153 |
|
c) |
Rest of the World |
-52 |
0 |
0 |
10 |
-6 |
153 |
-139 |
|
d) |
Others |
1410 |
5771 |
-2830 |
7524 |
-16023 |
19879 |
-10463 |
TOTAL |
204539 |
130706 |
179373 |
300554 |
334493 |
487887 |
429643 |
Statement 2.1: Financial Corporations and Companies |
(Rs. crore) |
Sources |
2001-02 |
2002-03 |
2003-04 |
2004-05 |
2005-06 |
2006-07 |
2007-08 |
1 |
2 |
3 |
4 |
5 |
6 |
7 |
8 |
1. |
Paid-up Capital |
8711 |
-5861 |
11210 |
4829 |
19410 |
8743 |
-1614 |
|
a) |
Banking |
791 |
6 |
-36 |
-879 |
246 |
-73 |
7 |
|
|
i) Reserve Bank of India |
0 |
100 |
0 |
-150 |
0 |
100 |
10 |
|
|
ii) Commercial Banks |
789 |
-92 |
-19 |
-730 |
243 |
-170 |
-1 |
|
|
iii) Co-operatives |
1 |
-2 |
-16 |
1 |
3 |
-3 |
-3 |
|
b) |
Other Financial Institutions |
397 |
62 |
190 |
467 |
467 |
225 |
732 |
|
|
i) Insurance |
397 |
62 |
190 |
467 |
467 |
225 |
732 |
|
c) |
Private Corporate Business |
-306 |
9 |
-19 |
74 |
-64 |
121 |
25 |
|
|
i) Companies |
-306 |
9 |
-19 |
74 |
-64 |
121 |
25 |
|
d) |
Government |
700 |
131 |
167 |
1176 |
261 |
38 |
977 |
|
|
i) Central Government |
300 |
285 |
144 |
973 |
194 |
471 |
308 |
|
|
ii) State Governments |
400 |
-154 |
23 |
203 |
67 |
-433 |
669 |
|
e) |
Rest of the World |
-367 |
-4 |
2 |
3 |
263 |
-525 |
65 |
|
f) |
Households |
1375 |
-3680 |
333 |
2853 |
-3135 |
3494 |
2371 |
|
g) |
Others |
6121 |
-2386 |
10573 |
1134 |
21372 |
5464 |
-5790 |
2. |
Unit Capital |
3443 |
9618 |
12255 |
9118 |
65164 |
71388 |
161991 |
|
a) |
Banking |
-825 |
3236 |
4310 |
468 |
-5970 |
241 |
16128 |
|
b) |
Financial Institutions |
-3120 |
434 |
1408 |
-2082 |
1435 |
-612 |
2063 |
|
c) |
Private Corporate Business |
2059 |
4839 |
4009 |
5903 |
30719 |
40479 |
87859 |
|
d) |
Rest of the World |
3696 |
3215 |
11196 |
3687 |
30379 |
34873 |
66053 |
|
e) |
Households |
2438 |
3469 |
-6358 |
21152 |
36779 |
59527 |
3322 |
|
f) |
Others |
-804 |
-5574 |
-2310 |
-20011 |
-28178 |
-63120 |
-13434 |
3. |
Bonds and Debentures |
-1405 |
7013 |
23095 |
8068 |
26362 |
36503 |
38559 |
|
a) |
Banking |
-15470 |
1888 |
13408 |
-7215 |
698 |
-3732 |
-2884 |
|
|
i) Reserve Bank of India |
-8 |
-3 |
-2 |
-2 |
0 |
0 |
0 |
|
|
ii) Commercial Banks |
-14931 |
2042 |
13283 |
-6400 |
574 |
-3953 |
-2966 |
|
|
iii) Co-operatives |
-531 |
-151 |
128 |
-813 |
124 |
221 |
82 |
|
b) |
Other Financial Institutions |
-6450 |
2010 |
3833 |
-327 |
2311 |
13268 |
2142 |
|
|
i) Insurance |
-6567 |
1619 |
3779 |
-692 |
1969 |
13491 |
-3693 |
|
|
ii) Provident Fund |
117 |
391 |
55 |
364 |
342 |
-223 |
5835 |
|
c) |
Private Corporate Business |
-5594 |
10873 |
-8378 |
14593 |
4273 |
-10003 |
-3671 |
|
|
i) Companies |
-5594 |
10873 |
-8378 |
14593 |
4273 |
-10003 |
-3671 |
|
d) |
Government |
7436 |
-3009 |
-173 |
-5330 |
-77 |
370 |
-15 |
|
e) |
Rest of the World |
-2766 |
-388 |
860 |
1939 |
1451 |
-1922 |
1089 |
|
f) |
Households |
147 |
5248 |
2633 |
-834 |
5319 |
2115 |
4279 |
|
g) |
Others |
2902 |
-5686 |
505 |
-3621 |
-1339 |
5149 |
6360 |
4. |
Borrowings |
4054 |
25206 |
21896 |
33645 |
27533 |
23312 |
40355 |
|
a) |
Banking |
15432 |
15191 |
13526 |
32188 |
38524 |
12495 |
29844 |
|
|
i) Reserve Bank of India |
-3305 |
-1209 |
-2729 |
-675 |
-932 |
-3001 |
184 |
|
|
ii) Commercial Banks |
18737 |
16400 |
16255 |
32863 |
39456 |
15495 |
29660 |
|
b) |
Other Financial Institutions |
1047 |
-1248 |
1684 |
3376 |
230 |
-407 |
-1101 |
|
c) |
Private Corporate Business |
150 |
16845 |
2582 |
-16278 |
-4907 |
-1059 |
-1183 |
|
d) |
Government |
-6059 |
-2714 |
664 |
-3066 |
-107 |
-700 |
-189 |
|
|
i) Central Government |
-4870 |
-2666 |
686 |
-3376 |
-96 |
-844 |
-32 |
|
|
ii) State Governments |
-1189 |
-48 |
-21 |
311 |
-11 |
144 |
-157 |
|
e) |
Rest of the World |
-7849 |
-941 |
374 |
1589 |
-2425 |
2268 |
2294 |
|
f) |
Households |
0 |
0 |
0 |
0 |
0 |
0 |
0 |
|
g) |
Others |
1331 |
-2494 |
2388 |
14144 |
-6296 |
7678 |
7045 |
5. |
Other Liabilities |
-2397 |
1043 |
5400 |
-7888 |
6464 |
-4485 |
5248 |
6. |
Deposits |
2363 |
6276 |
-4090 |
-3013 |
-2733 |
23197 |
15262 |
|
a) |
Banking |
-7146 |
-1335 |
823 |
4336 |
-4854 |
20849 |
11330 |
|
b) |
Private Corporate Business |
-119 |
23 |
-11 |
-419 |
36 |
9 |
38 |
|
c) |
Government |
-202 |
61 |
0 |
-103 |
-9 |
-34 |
36 |
|
d) |
Households |
3566 |
5389 |
-122 |
-455 |
2103 |
2316 |
2107 |
|
e) |
Others |
6265 |
2138 |
-4780 |
-6373 |
-8 |
57 |
1751 |
7. |
Trade Debt |
-182 |
-411 |
-137 |
-243 |
-264 |
105 |
118 |
TOTAL |
14587 |
42885 |
69629 |
44516 |
141937 |
158763 |
259918 |
Statement 2.1: Financial Corporations and Companies (Concld.) |
(Rs. crore) |
Uses |
2001-02 |
2002-03 |
2003-04 |
2004-05 |
2005-06 |
2006-07 |
2007-08 |
1 |
2 |
3 |
4 |
5 |
6 |
7 |
8 |
1. |
Currency and Deposits |
-3252 |
3306 |
11264 |
11507 |
15720 |
18713 |
26480 |
|
a) |
Cash in Hand |
1464 |
2194 |
-42 |
-171 |
682 |
-101 |
8898 |
|
b) |
Deposits |
-4716 |
1112 |
11306 |
11678 |
15038 |
18814 |
17582 |
|
|
i) Reserve Bank of India |
276 |
-140 |
356 |
499 |
-927 |
-150 |
-4 |
|
|
ii) Commercial Banks |
-5283 |
7774 |
8852 |
11777 |
13243 |
22223 |
18449 |
|
|
iii) Cooperative Banks |
-116 |
24 |
-3 |
-13 |
177 |
-135 |
73 |
|
|
iv) Companies |
-228 |
0 |
-1 |
32 |
131 |
-100 |
4 |
|
|
v) Government |
-3168 |
-1 |
34 |
-3 |
-6 |
-15 |
150 |
|
|
vi) Rest of the World |
-1451 |
-1069 |
-63 |
-683 |
-109 |
334 |
300 |
|
|
vii) Others |
5255 |
-5476 |
2130 |
69 |
2529 |
-3343 |
-1390 |
2. |
Loans and Advances |
50579 |
35546 |
17668 |
36326 |
39528 |
145078 |
115958 |
|
a) |
Banking |
-74 |
4436 |
759 |
15663 |
891 |
10757 |
-691 |
|
|
i) Commercial banks |
-1467 |
2741 |
-1064 |
13543 |
-936 |
7738 |
-1671 |
|
|
ii) Cooperatives |
1393 |
1695 |
1822 |
2120 |
1827 |
3019 |
980 |
|
b) |
Private Corporate Business |
-85412 |
25597 |
47647 |
73816 |
55886 |
51241 |
77950 |
|
|
i) Companies |
-85418 |
24559 |
47637 |
74059 |
56258 |
51636 |
77918 |
|
|
ii) Non-credit Societies |
6 |
1038 |
10 |
-243 |
-372 |
-395 |
32 |
|
c) |
Government |
68098 |
-6194 |
-16145 |
-40161 |
-9823 |
64109 |
28239 |
|
|
i) Commercial Undertakings |
-1165 |
-259 |
6894 |
-20133 |
7304 |
28929 |
-29 |
|
|
ii) Central Government |
2993 |
-10937 |
653 |
-2702 |
-48 |
24342 |
7642 |
|
|
iii) State Governments |
3510 |
4760 |
945 |
-3224 |
-2388 |
4620 |
17098 |
|
d) |
Rest of the World |
-13 |
530 |
-331 |
-35 |
2246 |
2279 |
2886 |
|
e) |
Households |
5639 |
3605 |
10014 |
6608 |
6704 |
7499 |
6932 |
|
f) |
Others |
62341 |
7570 |
-24275 |
-19564 |
-16375 |
9194 |
642 |
3. |
Investments |
109431 |
78094 |
74609 |
106870 |
142257 |
178094 |
168151 |
|
a) |
Banking |
-2876 |
2773 |
19089 |
1614 |
1233 |
21963 |
-36923 |
|
|
i) Commercial banks |
-3429 |
1170 |
17190 |
-566 |
-550 |
18797 |
-37803 |
|
|
ii) Cooperatives |
553 |
1603 |
1899 |
2180 |
1783 |
3166 |
880 |
|
b) |
Private Corporate Business |
7590 |
14954 |
-1228 |
-7982 |
9620 |
22415 |
26463 |
|
|
i) Shares |
20979 |
14935 |
-679 |
-7046 |
10893 |
23125 |
26007 |
|
|
ii) Debentures |
-13389 |
19 |
-549 |
-936 |
-1273 |
-710 |
456 |
|
c) |
Government |
86038 |
36181 |
37418 |
111574 |
111993 |
110217 |
119471 |
|
|
i) Central Government Securities |
57485 |
48866 |
45248 |
122598 |
110592 |
98140 |
134334 |
|
|
ii) State Government Securities |
28553 |
-12685 |
-7831 |
-11024 |
1401 |
12077 |
-14863 |
|
|
iii) Commercial Undertakings |
20448 |
-19437 |
145 |
1077 |
7033 |
10675 |
-16310 |
|
|
iv) Small Savings |
0 |
0 |
0 |
0 |
0 |
0 |
0 |
|
d) |
Rest of the World |
-667 |
0 |
65 |
1 |
-8 |
-42 |
-36 |
|
e) |
Households |
0 |
0 |
0 |
0 |
0 |
0 |
0 |
|
f) |
Others |
19347 |
24185 |
19264 |
1663 |
19419 |
23542 |
59176 |
4. |
Other Assets |
-2857 |
6080 |
-1884 |
5912 |
-11270 |
10986 |
-4954 |
|
a) |
Banking |
0 |
2405 |
851 |
1792 |
-2462 |
-608 |
207 |
|
b) |
Government |
0 |
0 |
0 |
0 |
0 |
0 |
153 |
|
c) |
Others |
-2857 |
3675 |
-2736 |
4120 |
-8808 |
11594 |
-5314 |
TOTAL |
153901 |
123025 |
101656 |
160616 |
186234 |
352872 |
305634 |
Statement 2.2: Insurance Sector |
(Rs. crore) |
Sources |
2001-02 |
2002-03 |
2003-04 |
2004-05 |
2005-06 |
2006-07 |
2007-08 |
1 |
2 |
3 |
4 |
5 |
6 |
7 |
8 |
1. |
Paid-up Capital |
272 |
60 |
144 |
284 |
386 |
125 |
166 |
|
a) |
Government |
272 |
60 |
144 |
284 |
386 |
125 |
166 |
2. |
Life Fund |
39043 |
49190 |
49118 |
63887 |
77722 |
108188 |
121053 |
|
a) |
In India |
39191 |
49234 |
48749 |
63886 |
77509 |
107926 |
120776 |
|
b) |
Outside India |
-148 |
-44 |
369 |
2 |
213 |
262 |
277 |
3. |
Borrowings |
0 |
0 |
0 |
0 |
0 |
0 |
0 |
|
a) |
Commercial Banks |
0 |
0 |
0 |
0 |
0 |
0 |
0 |
4. |
Other Liabilities |
1236 |
1024 |
1871 |
1680 |
3009 |
2458 |
4364 |
|
a) |
In India |
1236 |
1024 |
1871 |
1680 |
3009 |
2458 |
4364 |
|
b) |
Outside India |
0 |
0 |
0 |
0 |
0 |
0 |
0 |
TOTAL |
40551 |
50274 |
51132 |
65851 |
81117 |
110771 |
125583 |
Statement 2.2: Insurance Sector (Concld.) |
(Rs. crore) |
Uses |
2001-02 |
2002-03 |
2003-04 |
2004-05 |
2005-06 |
2006-07 |
2007-08 |
1 |
2 |
3 |
4 |
5 |
6 |
7 |
8 |
1. |
Cash in Hand |
1146 |
1968 |
651 |
-325 |
847 |
-1031 |
4375 |
2. |
Deposits |
-2532 |
-765 |
2301 |
1674 |
5748 |
2449 |
864 |
|
a) |
Reserve Bank of India |
-2 |
0 |
0 |
0 |
1 |
0 |
0 |
|
b) |
Commercial Banks |
-4730 |
4562 |
556 |
1542 |
3869 |
6167 |
914 |
|
c) |
Co-operative Banks |
0 |
0 |
0 |
0 |
0 |
0 |
0 |
|
d) |
Companies |
-11 |
0 |
0 |
0 |
140 |
-140 |
0 |
|
e) |
Government |
-3179 |
0 |
0 |
0 |
0 |
0 |
0 |
|
f) |
Rest of the World |
79 |
-17 |
32 |
-113 |
0 |
0 |
0 |
|
g) |
Others |
5310 |
-5310 |
1713 |
245 |
1738 |
-3578 |
-50 |
3. |
Loans and Advances |
1589 |
3235 |
-125 |
16805 |
3559 |
10326 |
13108 |
|
a) |
Commercial banks |
-296 |
0 |
0 |
50 |
-1 |
-8 |
-20 |
|
b) |
Financial Corporations |
-325 |
-2 |
0 |
0 |
72 |
-73 |
0 |
|
c) |
Private Corporate Business |
-1721 |
-38 |
8075 |
3415 |
1110 |
1725 |
4687 |
|
|
i) Companies |
-1721 |
-38 |
8075 |
3415 |
1110 |
1725 |
4687 |
|
|
ii) Non-credit Societies |
0 |
0 |
0 |
0 |
0 |
0 |
0 |
|
d) |
Government |
-14466 |
1990 |
650 |
-2680 |
19092 |
5198 |
7644 |
|
|
i) Central government |
319 |
2393 |
650 |
-2680 |
-51 |
24341 |
7644 |
|
|
ii) State and Union Territories |
-8077 |
-402 |
0 |
0 |
19144 |
-19144 |
0 |
|
|
iii) Local Authorities |
0 |
0 |
0 |
0 |
0 |
0 |
0 |
|
|
iv) Electricity Boards |
-6709 |
0 |
0 |
0 |
0 |
0 |
0 |
|
|
v) Commercial Undertakings |
0 |
0 |
0 |
0 |
0 |
0 |
0 |
|
e) |
Rest of the World |
-13 |
0 |
0 |
0 |
0 |
0 |
0 |
|
f) |
Households |
1240 |
1642 |
2247 |
1710 |
1710 |
1889 |
1770 |
|
g) |
Others |
17170 |
-358 |
-11097 |
14310 |
-18423 |
1595 |
-974 |
4. |
Investments |
50567 |
44200 |
79617 |
65775 |
137760 |
113475 |
144590 |
|
a) |
Banking |
0 |
0 |
2 |
1 |
11 |
103 |
361 |
|
|
i) Commercial banks |
0 |
0 |
2 |
1 |
11 |
103 |
361 |
|
|
ii) Co-operatives |
0 |
0 |
0 |
0 |
0 |
0 |
0 |
|
b) |
Financial Corporations |
23519 |
-12180 |
5749 |
-16365 |
402 |
5883 |
2280 |
|
|
i) Shares |
0 |
0 |
0 |
0 |
9 |
6437 |
1783 |
|
|
ii) Debentures |
23749 |
-12405 |
5911 |
-16525 |
563 |
-559 |
472 |
|
|
iii) Units of UTI |
-230 |
225 |
-162 |
160 |
-170 |
5 |
25 |
|
c) |
Private Corporate Business |
-37729 |
20759 |
28930 |
-34893 |
14313 |
-21168 |
6139 |
|
|
i) Companies |
-37729 |
20759 |
28930 |
-34893 |
14313 |
-21168 |
6139 |
|
|
(1) Shares |
-11462 |
21199 |
28863 |
-35147 |
14407 |
-21277 |
6078 |
|
|
(2) Debentures |
-26267 |
-440 |
67 |
254 |
-94 |
108 |
61 |
|
|
ii) Non-credit Societies |
0 |
0 |
0 |
0 |
0 |
0 |
0 |
|
d) |
Government |
55562 |
29626 |
40587 |
132983 |
121186 |
116994 |
139558 |
|
|
i) Central Government Securities |
46930 |
39442 |
38805 |
145921 |
114676 |
102367 |
137547 |
|
|
ii) State Government Securities |
-11252 |
9739 |
2079 |
-14012 |
95 |
3041 |
7741 |
|
|
iii) Local Authorities |
0 |
0 |
0 |
0 |
0 |
0 |
0 |
|
|
iv) Electricity Boards |
-598 |
0 |
0 |
0 |
0 |
0 |
0 |
|
|
v) Commercial Undertakings |
20482 |
-19555 |
-296 |
1074 |
6414 |
11586 |
-5731 |
|
e) |
Rest of the World |
-443 |
4 |
7 |
-1 |
-6 |
-4 |
0 |
|
f) |
Others |
9658 |
5991 |
4342 |
-15950 |
1854 |
11667 |
-3748 |
5. |
Other Assets |
4215 |
2096 |
-94 |
3414 |
-7221 |
8438 |
-5289 |
|
a) |
Central Government |
0 |
0 |
0 |
0 |
0 |
0 |
0 |
|
b) |
Rest of the World |
-52 |
0 |
0 |
10 |
-6 |
153 |
-139 |
|
c) |
Others |
4267 |
2096 |
-94 |
3404 |
-7215 |
8286 |
-5149 |
TOTAL |
54985 |
50735 |
82350 |
87342 |
140692 |
133657 |
157648 |
Statement 3: Private Corporate Business |
(Rs. crore) |
Sources |
2001-02 |
2002-03 |
2003-04 |
2004-05 |
2005-06 |
2006-07 |
2007-08 |
1 |
2 |
3 |
4 |
5 |
6 |
7 |
8 |
1. |
Paid-up |
75999 |
14459 |
-17835 |
23711 |
141413 |
90926 |
159767 |
|
a) |
Banking |
43 |
451 |
997 |
-3908 |
-1034 |
-2357 |
1685 |
|
b) |
Other Financial Institutions |
74142 |
13222 |
-19847 |
23861 |
136655 |
74976 |
133608 |
|
c) |
Government |
105 |
139 |
0 |
0 |
0 |
0 |
0 |
|
d) |
Rest Of the World |
0 |
0 |
0 |
0 |
0 |
0 |
0 |
|
e) |
Households |
1709 |
646 |
1015 |
3759 |
5792 |
18307 |
24475 |
2. |
Debentures |
6351 |
5940 |
2105 |
8601 |
-18535 |
17553 |
9978 |
|
a) |
Banking |
0 |
0 |
0 |
0 |
0 |
0 |
0 |
|
b) |
OFI |
5217 |
5607 |
1811 |
8254 |
-18592 |
17714 |
9365 |
|
c) |
Government |
0 |
0 |
0 |
0 |
0 |
0 |
0 |
|
d) |
Rest Of the World |
0 |
0 |
0 |
0 |
0 |
0 |
0 |
|
e) |
Households |
1134 |
333 |
294 |
347 |
58 |
-161 |
613 |
3. |
Fixed Deposits |
3385 |
5237 |
-3708 |
-2228 |
-7641 |
-2066 |
86 |
|
a) |
Households |
-377 |
-533 |
158 |
124 |
358 |
-347 |
60 |
|
b) |
Other Financial Institutions |
3762 |
5771 |
-3866 |
-2352 |
-7999 |
-1720 |
25 |
4. |
Borrowings |
144526 |
95099 |
82214 |
80319 |
139202 |
419437 |
530834 |
|
a) |
Banking |
87209 |
93662 |
86931 |
83924 |
135812 |
298074 |
401698 |
|
b) |
Other Financial Institutions |
39714 |
-6829 |
-27649 |
-21207 |
-45561 |
6703 |
18544 |
|
c) |
Government |
6208 |
15960 |
1358 |
-5110 |
-4728 |
735 |
1967 |
|
d) |
Rest Of the World |
4130 |
-10526 |
2881 |
5576 |
62953 |
90042 |
68649 |
|
e) |
Others |
7265 |
2833 |
18692 |
17136 |
-9274 |
23883 |
39976 |
5. |
Trade Credit (Net) |
-1 |
70 |
23 |
31 |
41 |
6418 |
9227 |
6. |
Other Liabilities |
56310 |
-4049 |
41243 |
23876 |
53692 |
145712 |
177102 |
TOTAL |
286571 |
116756 |
104042 |
134310 |
308172 |
677979 |
886994 |
Statement 3: Private Corporate Business (Concld.) |
(Rs. crore) |
Uses |
2001-02 |
2002-03 |
2003-04 |
2004-05 |
2005-06 |
2006-07 |
2007-08 |
1 |
2 |
3 |
4 |
5 |
6 |
7 |
8 |
1. |
Cash in Hand |
1308 |
1865 |
1162 |
250 |
1422 |
4035 |
-834 |
|
a) |
RBI Notes |
1272 |
1819 |
1145 |
255 |
1407 |
3952 |
-821 |
|
b) |
One Rupee Notes |
36 |
46 |
18 |
-5 |
15 |
83 |
-13 |
2. |
Fixed Deposits |
36985 |
22356 |
57117 |
60600 |
98049 |
150440 |
69573 |
|
a) |
Commercial Banks |
33292 |
23816 |
39142 |
57503 |
89677 |
120578 |
32619 |
|
b) |
Co-operatives |
300 |
171 |
610 |
-288 |
128 |
-94 |
-75 |
|
c) |
Government |
3393 |
-1632 |
17365 |
3385 |
8243 |
29956 |
37030 |
3. |
Loans and Advances |
45809 |
19535 |
16890 |
29736 |
63959 |
157345 |
299854 |
|
a) |
Households |
384 |
422 |
105 |
304 |
277 |
229 |
245 |
|
b) |
Others |
45425 |
19113 |
16785 |
29432 |
63682 |
157116 |
299609 |
4. |
Investments |
22203 |
31394 |
54011 |
30926 |
-16466 |
74158 |
157912 |
|
a) |
Co-operatives |
94 |
89 |
83 |
76 |
81 |
113 |
106 |
|
b) |
Other Financial Institutions |
13911 |
24657 |
47633 |
14342 |
2122 |
54963 |
85681 |
|
c) |
Government |
4114 |
6860 |
1648 |
14499 |
-25791 |
-1056 |
2549 |
|
d) |
Rest Of the World |
2311 |
2366 |
1576 |
-4317 |
6865 |
13871 |
51740 |
|
e) |
Others |
1772 |
-2577 |
3071 |
6327 |
257 |
6268 |
17835 |
5. |
Other Assets |
31 |
165 |
-59 |
266 |
-250 |
196 |
449 |
TOTAL |
106336 |
75316 |
129121 |
121779 |
146714 |
386174 |
526954 |
Statement 3.1: Private Non-financial Companies |
(Rs. crore) |
Sources |
2001-02 |
2002-03 |
2003-04 |
2004-05 |
2005-06 |
2006-07 |
2007-08 |
1 |
2 |
3 |
4 |
5 |
6 |
7 |
8 |
1. |
Paid-up Capital |
75697 |
14173 |
-17995 |
23543 |
141255 |
90764 |
159605 |
|
a) |
Banking |
43 |
451 |
997 |
-3908 |
-1034 |
-2357 |
1685 |
|
b) |
Other Financial Institutions |
74142 |
13222 |
-19847 |
23861 |
136655 |
74976 |
133608 |
|
c) |
Government |
0 |
0 |
0 |
0 |
0 |
0 |
0 |
|
d) |
Rest Of the World |
0 |
0 |
0 |
0 |
0 |
0 |
0 |
|
e) |
Households |
1512 |
500 |
855 |
3591 |
5634 |
18145 |
24312 |
2. |
Debentures |
6351 |
5940 |
2105 |
8601 |
-18535 |
17553 |
9978 |
|
a) |
Banking |
0 |
0 |
0 |
0 |
0 |
0 |
0 |
|
b) |
Other Financial Institutions |
5217 |
5607 |
1811 |
8254 |
-18592 |
17714 |
9365 |
|
c) |
Government |
0 |
0 |
0 |
0 |
0 |
0 |
0 |
|
d) |
Rest Of the World |
0 |
0 |
0 |
0 |
0 |
0 |
0 |
|
e) |
Households |
1134 |
333 |
294 |
347 |
58 |
-161 |
613 |
3. |
Fixed Deposits |
3704 |
5399 |
-3563 |
-2020 |
-7663 |
-2089 |
63 |
|
a) |
Households |
-58 |
-371 |
303 |
332 |
336 |
-369 |
38 |
|
b) |
Other Financial Institutions |
3762 |
5771 |
-3866 |
-2352 |
-7999 |
-1720 |
25 |
4. |
Borrowings |
140402 |
88754 |
77038 |
74807 |
132494 |
408126 |
521555 |
|
a) |
Banking |
83360 |
88782 |
81997 |
78658 |
129570 |
286945 |
392551 |
|
b) |
Other Financial Institutions |
39708 |
-7867 |
-27658 |
-20964 |
-45189 |
7098 |
18513 |
|
c) |
Government |
5939 |
15533 |
1125 |
-5599 |
-5566 |
158 |
1867 |
|
d) |
Rest Of the World |
4130 |
-10526 |
2881 |
5576 |
62953 |
90042 |
68649 |
|
e) |
Others |
7265 |
2833 |
18692 |
17136 |
-9274 |
23883 |
39976 |
5. |
Trade Credit (Net) |
-1 |
70 |
23 |
31 |
41 |
6418 |
9227 |
6. |
Other Liabilities |
56310 |
-4049 |
41243 |
23876 |
53692 |
145712 |
177102 |
TOTAL |
282464 |
110288 |
98850 |
128838 |
301284 |
666484 |
877530 |
Statement 3.1: Private Non-financial Companies (Concld.) |
(Rs. crore) |
Uses |
2001-02 |
2002-03 |
2003-04 |
2004-05 |
2005-06 |
2006-07 |
2007-08 |
1 |
2 |
3 |
4 |
5 |
6 |
7 |
8 |
1 |
Cash in Hand |
1251 |
1815 |
1188 |
301 |
1488 |
4015 |
-852 |
|
a) |
RBI Notes |
1227 |
1779 |
1165 |
295 |
1459 |
3936 |
-835 |
|
b) |
One Rupee Notes & Coins |
24 |
35 |
23 |
6 |
29 |
78 |
-17 |
2 |
Fixed Deposits |
36433 |
21884 |
56008 |
60461 |
97494 |
149112 |
68375 |
|
a) |
Commercial Banks |
33039 |
23513 |
38640 |
57072 |
89246 |
119150 |
31338 |
|
b) |
Co-operatives |
1 |
2 |
3 |
4 |
5 |
6 |
7 |
|
c) |
Government |
3393 |
-1632 |
17365 |
3385 |
8243 |
29956 |
37030 |
3. |
Loans and Advances |
45425 |
19113 |
16785 |
29432 |
63682 |
157116 |
299609 |
|
a) |
Households |
0 |
0 |
0 |
0 |
0 |
0 |
0 |
|
b) |
Others |
45425 |
19113 |
16785 |
29432 |
63682 |
157116 |
299609 |
4 |
Investments |
22109 |
31305 |
53928 |
30850 |
-16547 |
74045 |
157806 |
|
a) |
Co-operatives |
0 |
0 |
0 |
0 |
0 |
0 |
0 |
|
b) |
Other Financial Institutions |
13911 |
24657 |
47633 |
14342 |
2122 |
54963 |
85681 |
|
c) |
Government |
4114 |
6860 |
1648 |
14499 |
-25791 |
-1056 |
2549 |
|
d) |
Rest Of the World |
2311 |
2366 |
1576 |
-4317 |
6865 |
13871 |
51740 |
|
e) |
Others |
1772 |
-2577 |
3071 |
6327 |
257 |
6268 |
17835 |
5. |
Other Assets |
31 |
165 |
-59 |
266 |
-250 |
196 |
449 |
TOTAL |
105249 |
74282 |
127849 |
121311 |
145867 |
384484 |
525387 |
Statement 3.2: Co-operative Non-credit Societies |
(Rs. crore) |
Sources |
2001-02 |
2002-03 |
2003-04 |
2004-05 |
2005-06 |
2006-07 |
2007-08 |
1 |
2 |
3 |
4 |
5 |
6 |
7 |
8 |
1. |
Paid-up Capital |
302 |
285 |
160 |
168 |
158 |
162 |
163 |
|
a) |
Co-op. Banks & Credit Societies |
0 |
0 |
0 |
0 |
0 |
0 |
0 |
|
b) |
Government |
105 |
139 |
0 |
0 |
0 |
0 |
0 |
|
c) |
Households |
197 |
146 |
160 |
168 |
158 |
162 |
163 |
2. |
Fixed Deposits |
-319 |
-162 |
-145 |
-208 |
22 |
22 |
23 |
|
a) |
Households |
-319 |
-162 |
-145 |
-208 |
22 |
22 |
23 |
3. |
Borrowings |
4124 |
6345 |
5177 |
5512 |
6708 |
11311 |
9279 |
|
a) |
Banking |
3849 |
4880 |
4934 |
5266 |
6242 |
11129 |
9147 |
|
|
i) Commercial Banks |
492 |
1104 |
917 |
1991 |
3120 |
3205 |
3317 |
|
|
ii) Co-operatives |
3357 |
3776 |
4017 |
3275 |
3122 |
7924 |
5830 |
|
b) |
Other Financial Institutions |
6 |
1038 |
10 |
-243 |
-372 |
-395 |
32 |
|
|
i) Financial Corps. |
6 |
1038 |
10 |
-243 |
-372 |
-395 |
32 |
|
|
ii) L I C |
0 |
0 |
0 |
0 |
0 |
0 |
0 |
|
c) |
Government |
269 |
427 |
233 |
489 |
838 |
577 |
100 |
|
d) |
Others |
0 |
0 |
0 |
0 |
0 |
0 |
0 |
4. |
Other Liabilities |
0 |
0 |
0 |
0 |
0 |
0 |
0 |
TOTAL |
4107 |
6468 |
5192 |
5472 |
6888 |
11495 |
9464 |
Statement 3.2: Co-operative Non-credit Societies (Concld.) |
(Rs. crore) |
Uses |
2001-02 |
2002-03 |
2003-04 |
2004-05 |
2005-06 |
2006-07 |
2007-08 |
1 |
2 |
3 |
4 |
5 |
6 |
7 |
8 |
1. |
Cash in Hand |
57 |
51 |
-25 |
-51 |
-66 |
20 |
18 |
|
a) |
RBI Notes |
45 |
40 |
-20 |
-40 |
-52 |
16 |
14 |
|
b) |
One Rupee Notes & Coins |
12 |
11 |
-5 |
-11 |
-14 |
4 |
4 |
2. |
Balances with Banks |
552 |
472 |
1109 |
139 |
554 |
1328 |
1198 |
|
a) |
Commercial Banks |
253 |
303 |
502 |
431 |
431 |
1428 |
1280 |
|
b) |
Co-operatives |
299 |
169 |
607 |
-292 |
123 |
-100 |
-82 |
3. |
Loans and Advances (Households) |
384 |
422 |
105 |
304 |
277 |
229 |
245 |
4. |
Investments |
94 |
89 |
83 |
76 |
81 |
113 |
106 |
|
a) |
Co-operatives |
94 |
89 |
83 |
76 |
81 |
113 |
106 |
|
b) |
Government Securities |
0 |
0 |
0 |
0 |
0 |
0 |
0 |
|
c) |
Other Financial Institutions |
0 |
0 |
0 |
0 |
0 |
0 |
0 |
5. |
Other Assets |
0 |
0 |
0 |
0 |
0 |
0 |
0 |
TOTAL |
1087 |
1034 |
1272 |
468 |
847 |
1690 |
1567 |
Statement 4: Government Sector |
(Rs. crore) |
Sources |
2001-02 |
2002-03 |
2003-04 |
2004-05 |
2005-06 |
2006-07 |
2007-08 |
1 |
2 |
3 |
4 |
5 |
6 |
7 |
8 |
1. |
Government Securities (Other Than Treasury Bills) |
100075 |
167013 |
196917 |
160799 |
87374 |
111211 |
172744 |
|
(a) |
Banking |
60445 |
100658 |
83363 |
69274 |
-19158 |
25346 |
76536 |
|
(b) |
Other Financial Institutions |
34335 |
50816 |
54203 |
90215 |
40748 |
176516 |
52748 |
|
(c) |
Households |
74 |
96 |
114 |
70 |
104 |
102 |
232 |
|
(d) |
Others |
5221 |
15443 |
59237 |
1240 |
65680 |
-90753 |
43228 |
2. |
Treasury Bills |
6458 |
11163 |
-2479 |
1170 |
17663 |
-852 |
21246 |
|
(a) |
Banking |
5568 |
9624 |
-2137 |
1009 |
15227 |
-8119 |
8960 |
|
(b) |
Other Financial Institutions |
807 |
1395 |
-310 |
146 |
2208 |
7815 |
10837 |
|
(c) |
Rest of the World |
83 |
144 |
-32 |
15 |
228 |
-548 |
1449 |
3. |
Bonds and Debentures |
-575 |
-171 |
1851 |
-209 |
-3803 |
-1036 |
-1125 |
|
(a) |
Banking |
-256 |
-114 |
747 |
-275 |
-1374 |
-428 |
-961 |
|
(b) |
Other Financial Institutions |
-59 |
-26 |
108 |
-13 |
-302 |
-98 |
-179 |
|
(c) |
Households |
187 |
167 |
173 |
176 |
172 |
237 |
328 |
|
(d) |
Others |
-447 |
-198 |
823 |
-97 |
-2299 |
-747 |
-313 |
4. |
Paid-up Capital |
2171 |
939 |
1069 |
1340 |
415 |
743 |
909 |
|
(a) |
Other Financial Institutions |
263 |
114 |
129 |
162 |
50 |
90 |
110 |
|
(b) |
Rest of the World |
64 |
27 |
31 |
39 |
12 |
22 |
27 |
|
(c) |
Others |
1844 |
798 |
909 |
1139 |
353 |
631 |
772 |
5. |
Government Bonds |
16765 |
8006 |
28354 |
21243 |
14307 |
1569 |
-14863 |
|
(a) |
Relief Bonds |
16727 |
7988 |
26838 |
18657 |
7945 |
-1880 |
-11903 |
|
(b) |
Special Bearer Bonds |
0 |
0 |
0 |
0 |
-11 |
0 |
0 |
|
(c) |
Capital Investments Bonds |
0 |
0 |
0 |
0 |
0 |
0 |
0 |
|
(d) |
National Rural Development Bonds |
0 |
0 |
0 |
0 |
0 |
0 |
0 |
|
(e) |
National Deposit Scheme |
0 |
-17 |
0 |
0 |
0 |
0 |
0 |
|
(f) |
Deposit Scheme for Retired Government Employees |
38 |
35 |
1517 |
2587 |
6373 |
3450 |
-2959 |
6. |
Borrowings |
39060 |
62566 |
19811 |
-20256 |
46415 |
14992 |
-45210 |
|
(a) |
Banking |
623 |
-5323 |
3659 |
2307 |
-2016 |
3777 |
5520 |
|
(b) |
Other Financial Institutions |
8688 |
77243 |
20066 |
-39522 |
-561 |
16705 |
-59417 |
|
(c) |
Rest of the World |
10178 |
-16048 |
-12075 |
13072 |
33491 |
14564 |
12074 |
|
(d) |
Others |
19570 |
6694 |
8161 |
3887 |
15501 |
-20054 |
-3387 |
7. |
Deposits of Non-government Provident & Pension Funds |
7523 |
8736 |
-377 |
-1107 |
384 |
-559 |
0 |
8. |
Deposits by Financial Corporations |
1968 |
1950 |
2569 |
4442 |
3027 |
3918 |
3874 |
Statement 4: Government Sector (Contd.) |
(Rs. crore) |
Sources |
2001-02 |
2002-03 |
2003-04 |
2004-05 |
2005-06 |
2006-07 |
2007-08 |
1 |
2 |
3 |
4 |
5 |
6 |
7 |
8 |
9. |
Deposits |
3700 |
2806 |
3350 |
2017 |
2056 |
-1274 |
2388 |
|
(a) |
Households |
3858 |
2847 |
1719 |
1883 |
1902 |
-2090 |
215 |
|
(b) |
Others |
-158 |
-41 |
1631 |
134 |
154 |
816 |
2173 |
10. |
Small Savings |
35100 |
47986 |
58903 |
85106 |
72778 |
17544 |
-13601 |
|
(a) |
Other Financial Institutions |
0 |
0 |
0 |
0 |
0 |
0 |
0 |
|
(b) |
Households |
35100 |
47986 |
58903 |
85106 |
72778 |
17544 |
-13601 |
11. |
Provident Fund |
19230 |
22749 |
20800 |
25026 |
26896 |
32452 |
27188 |
12. |
Insurance Fund |
2045 |
2158 |
2813 |
2409 |
3521 |
3886 |
4508 |
13. |
Consumers’ Security Deposits |
544 |
973 |
1902 |
1610 |
1790 |
1658 |
1391 |
|
(a) |
Households |
544 |
973 |
1902 |
1610 |
1790 |
1658 |
1391 |
|
(b) |
Others |
0 |
0 |
0 |
0 |
0 |
0 |
0 |
14. |
One Rupee Notes and Coins |
1326 |
1002 |
469 |
557 |
1987 |
185 |
1882 |
|
(a) |
Banking |
1044 |
716 |
42 |
187 |
1456 |
-478 |
1069 |
|
(b) |
Other Financial Institutions |
0 |
0 |
0 |
0 |
0 |
0 |
0 |
|
(c) |
Private Corporate Business |
0 |
0 |
0 |
0 |
0 |
0 |
0 |
|
(d) |
Households |
282 |
286 |
427 |
370 |
531 |
663 |
813 |
15. |
Sundry Creditors |
10718 |
8467 |
11622 |
12766 |
8445 |
15159 |
27577 |
16. |
Other Liabilities |
6448 |
11720 |
2414 |
1018 |
-14600 |
2354 |
3473 |
|
(a) |
Banking |
-3971 |
-696 |
266 |
189 |
887 |
346 |
510 |
|
(b) |
Other Financial Institutions |
494 |
7354 |
2241 |
-1188 |
-10717 |
39 |
41 |
|
(c) |
Others |
9926 |
5062 |
-93 |
2017 |
-4770 |
1969 |
2922 |
TOTAL |
252555 |
358063 |
349987 |
297930 |
268654 |
201949 |
192381 |
Statement 4: Government Sector (Concld.) |
(Rs. crore) |
Uses |
2001-02 |
2002-03 |
2003-04 |
2004-05 |
2005-06 |
2006-07 |
2007-08 |
1 |
2 |
3 |
4 |
5 |
6 |
7 |
8 |
1. |
Cash and Bank Balances |
8855 |
4237 |
28835 |
-25756 |
-3045 |
53414 |
11075 |
|
(a) |
Cash in hand |
6188 |
7368 |
34091 |
45132 |
19562 |
52603 |
43089 |
|
(b) |
Cash with Railways |
3 |
79 |
-118 |
129 |
-97 |
19 |
-247 |
|
(c) |
Balances with |
2664 |
-3210 |
-5138 |
-71017 |
-22510 |
792 |
-31767 |
|
|
i) RBI |
2133 |
-3266 |
-5084 |
-71611 |
-22634 |
-403 |
-33398 |
|
|
ii) Commercial Banks |
531 |
56 |
-54 |
594 |
124 |
1195 |
1631 |
2. |
Loans and Advances |
5045 |
12196 |
17387 |
44237 |
25352 |
23936 |
-49914 |
|
(a) |
Banking |
404 |
640 |
349 |
734 |
1256 |
865 |
150 |
|
(b) |
Other Financial Institutions |
956 |
236 |
-81 |
436 |
678 |
549 |
643 |
|
(c) |
Private Corporate Business |
106 |
387 |
247 |
414 |
722 |
483 |
-10 |
|
(d) |
Rest of the World |
235 |
713 |
494 |
443 |
278 |
42 |
-137 |
|
(e) |
Households |
1110 |
519 |
-269 |
277 |
-277 |
-650 |
-229 |
|
(f) |
Others |
2235 |
9702 |
16647 |
41932 |
22696 |
22647 |
-50331 |
3. |
Investments |
18197 |
8890 |
31373 |
17702 |
22379 |
10180 |
-3743 |
|
(a) |
Banking |
1918 |
279 |
1823 |
3630 |
3907 |
-4683 |
4410 |
|
(b) |
Other Financial Institutions |
87 |
-10 |
-465 |
2252 |
451 |
-637 |
-247 |
|
(c) |
Private Corporate Business |
2 |
2 |
2 |
2 |
2 |
62 |
73 |
|
(d) |
Others |
16190 |
8619 |
30013 |
11819 |
18019 |
15438 |
-7979 |
4. |
Subscriptions to International Financial Organisations |
78 |
63 |
2796 |
132 |
-2895 |
-590 |
1582 |
5. |
Net purchase of Domestic Gold & Silver |
0 |
0 |
0 |
0 |
0 |
0 |
0 |
6. |
Deposits |
300 |
2 |
58 |
114 |
-8 |
19 |
87 |
|
(a) |
RBI |
300 |
2 |
58 |
114 |
-8 |
19 |
87 |
7. |
Sundry Debtors |
21686 |
12889 |
-3226 |
-6677 |
10581 |
1934 |
105757 |
8. |
Other Assets |
-1726 |
12703 |
14553 |
-13256 |
-4750 |
361 |
7854 |
|
(a) |
Banking |
1 |
-3 |
7 |
45 |
86 |
-27 |
-282 |
|
(b) |
Other Financial Institutions |
0 |
0 |
38 |
-20 |
-19 |
0 |
0 |
|
(c) |
Others |
-1727 |
12706 |
14509 |
-13281 |
-4817 |
388 |
8135 |
TOTAL |
52436 |
50980 |
91777 |
16497 |
47614 |
89253 |
72698 |
Statement 4.1: Central Government |
(Rs. crore) |
Sources |
2001-02 |
2002-03 |
2003-04 |
2004-05 |
2005-06 |
2006-07 |
2007-08 |
1 |
2 |
3 |
4 |
5 |
6 |
7 |
8 |
1. |
Government Securities (Other than Treasury Bills) |
82709 |
137937 |
150462 |
105028 |
102767 |
115213 |
110392 |
|
(a) |
Banking |
50425 |
84876 |
54615 |
61311 |
-17563 |
22342 |
46820 |
|
|
(i) RBI |
-805 |
11976 |
-11884 |
19454 |
1979 |
14540 |
-16911 |
|
|
(ii) Commercial Banks |
51230 |
72900 |
66499 |
41857 |
-19542 |
7802 |
63731 |
|
(b) |
Other Financial Institutions |
26738 |
41422 |
42716 |
56581 |
29989 |
148929 |
33428 |
|
|
(i) Insurance |
19953 |
33284 |
36309 |
70433 |
24636 |
6380 |
10956 |
|
|
(ii) Provident Funds |
3132 |
2044 |
-241 |
4282 |
6517 |
53562 |
3544 |
|
|
(iii) Financial Institutions |
3653 |
6094 |
6648 |
-18134 |
-1164 |
88987 |
18928 |
|
(c) |
State Governments |
0 |
0 |
0 |
0 |
0 |
0 |
0 |
|
(d) |
Households |
53 |
59 |
53 |
28 |
83 |
85 |
149 |
|
(e) |
Others |
5493 |
11580 |
53078 |
-12892 |
81128 |
-104040 |
36006 |
|
(f) |
Private corporate Business |
0 |
0 |
0 |
0 |
7649 |
47312 |
-10578 |
|
(g) |
Rest of world |
0 |
0 |
0 |
0 |
1481 |
585 |
4567 |
2. |
Total Treasury Bills (A+B+C) |
12542 |
12188 |
-1217 |
6415 |
41625 |
-618 |
49506 |
|
A. |
Treasury Bills |
11401 |
11814 |
-1217 |
8628 |
42332 |
-618 |
49506 |
|
|
(a) Banking |
5568 |
9624 |
-2137 |
1009 |
15227 |
-8119 |
8960 |
|
|
(b) Other Financial Institutions |
807 |
1395 |
-310 |
146 |
2208 |
7815 |
10837 |
|
|
(c) Government |
4943 |
651 |
1262 |
7458 |
24669 |
234 |
28260 |
|
|
(d) Rest of the World |
83 |
144 |
-32 |
15 |
228 |
-548 |
1449 |
|
B. |
Treasury Bills issued to RBI on behalf of State Governments |
0 |
0 |
0 |
0 |
0 |
0 |
0 |
|
C. |
Special Securities issued to RBI |
1141 |
374 |
0 |
-2213 |
-707 |
0 |
0 |
3. |
Borrowings from Rest of the World |
5601 |
-11934 |
-13488 |
14753 |
33366 |
7892 |
9970 |
4. |
Special Securities |
0 |
0 |
0 |
0 |
0 |
0 |
0 |
5. |
Special Borrowings from RBI against CDS |
0 |
0 |
0 |
0 |
0 |
0 |
0 |
6. |
Government Bonds |
16765 |
8006 |
28354 |
21243 |
14307 |
1569 |
-14863 |
|
(i) |
Relief Bonds |
16727 |
7988 |
26838 |
18657 |
7945 |
-1880 |
-11903 |
|
(ii) |
Special Bearer Bonds |
0 |
0 |
0 |
0 |
-11 |
0 |
0 |
|
(iii) |
Capital Investment Bonds |
0 |
0 |
0 |
0 |
0 |
0 |
0 |
|
(iv) |
National Rural Development Bonds |
0 |
0 |
0 |
0 |
0 |
0 |
0 |
|
(v) |
National Deposit Scheme |
0 |
-17 |
0 |
0 |
0 |
0 |
0 |
|
(vi) |
Deposit Scheme for Retired Govt. Employees |
38 |
35 |
1517 |
2587 |
6373 |
3450 |
-2959 |
Statement 4.1: Central Government (Contd.) |
(Rs. crore) |
Sources |
2001-02 |
2002-03 |
2003-04 |
2004-05 |
2005-06 |
2006-07 |
2007-08 |
1 |
2 |
3 |
4 |
5 |
6 |
7 |
8 |
7. |
Small Savings |
35100 |
47986 |
58903 |
85106 |
72778 |
17544 |
-13601 |
|
(a) |
O.F.I. - Financial Corpn. & Provident Fund |
0 |
0 |
0 |
0 |
0 |
0 |
0 |
|
(b) |
Households |
35100 |
47986 |
58903 |
85106 |
72778 |
17544 |
-13601 |
8. |
Provident Fund |
19230 |
22749 |
20800 |
25026 |
26896 |
32452 |
27188 |
9. |
Postal Insurance & Life Annuity Fund |
778 |
834 |
1098 |
1414 |
1962 |
2200 |
2729 |
10. |
Central Insurance & Family Pension Fund |
247 |
213 |
187 |
159 |
159 |
179 |
179 |
11. |
Deposits of Non-Government Provident and Pension Funds |
7523 |
8736 |
-377 |
-1107 |
384 |
-559 |
0 |
12. |
Deposits by Financial Corporations |
1968 |
1950 |
2569 |
4442 |
3027 |
3918 |
3874 |
13. |
Deposits by Government Commercial Undertakings |
0 |
0 |
0 |
0 |
0 |
0 |
0 |
14. |
One Rupee Notes and Coins |
1326 |
1002 |
469 |
557 |
1987 |
185 |
1882 |
|
(a) |
Banking |
1044 |
716 |
42 |
187 |
1456 |
-478 |
1069 |
|
|
(i) RBI |
1013 |
705 |
225 |
152 |
1306 |
-493 |
1063 |
|
|
(ii) Commercial Banks |
19 |
13 |
-99 |
35 |
145 |
0 |
0 |
|
|
(iii) Co-operatives |
12 |
-2 |
-84 |
0 |
5 |
15 |
6 |
|
(b) |
Other Financial Institutions |
0 |
0 |
0 |
0 |
0 |
0 |
0 |
|
|
(i) Financial Corporations |
0 |
0 |
0 |
0 |
0 |
0 |
0 |
|
|
(ii) Insurance |
0 |
0 |
0 |
0 |
0 |
0 |
0 |
|
(c) |
Private Corporate Business |
0 |
0 |
0 |
0 |
0 |
0 |
0 |
|
|
(i) Companies |
0 |
0 |
0 |
0 |
0 |
0 |
0 |
|
|
(ii) Non-credit Societies |
0 |
0 |
0 |
0 |
0 |
0 |
0 |
|
(d) |
Government |
0 |
0 |
0 |
0 |
0 |
0 |
0 |
|
|
(i) Railways |
0 |
0 |
0 |
0 |
0 |
0 |
0 |
|
|
(ii) Commercial Undertakings |
0 |
0 |
0 |
0 |
0 |
0 |
0 |
|
(e) |
Households |
282 |
286 |
427 |
370 |
531 |
663 |
813 |
TOTAL |
183789 |
229667 |
247760 |
263036 |
299257 |
179975 |
177256 |
Statement 4.1: Central Government (Concld.) |
(Rs. crore) |
Uses |
2001-02 |
2002-03 |
2003-04 |
2004-05 |
2005-06 |
2006-07 |
2007-08 |
1 |
2 |
3 |
4 |
5 |
6 |
7 |
8 |
1. |
Cash and Bank Balances |
1499 |
1870 |
-4038 |
-72133 |
-20904 |
4399 |
-18431 |
|
(a) |
Balances with RBI |
1496 |
1791 |
-3920 |
-72262 |
-20807 |
4380 |
-18184 |
|
(b) |
Cash with Railways |
3 |
79 |
-118 |
129 |
-97 |
19 |
-247 |
|
|
(i) RBI Notes |
3 |
79 |
-118 |
129 |
-97 |
19 |
-247 |
|
|
(ii) One Rupee Notes & Coins |
0 |
0 |
0 |
0 |
0 |
0 |
0 |
2. |
Loans and Advances |
20750 |
2082 |
-34690 |
-29725 |
4700 |
-5166 |
10477 |
|
(a) |
Financial Corporations |
956 |
236 |
-81 |
436 |
678 |
549 |
643 |
|
(b) |
Private non-financial companies |
-164 |
-40 |
14 |
-75 |
-116 |
-94 |
-110 |
|
(c) |
Government |
19409 |
1069 |
-35059 |
-30419 |
3934 |
-5442 |
10215 |
|
|
(i) State Governments |
10881 |
-2072 |
-35730 |
-34932 |
-3145 |
-10368 |
3747 |
|
|
(ii) Local Authorities |
706 |
1215 |
1332 |
945 |
1537 |
434 |
1208 |
|
|
(iii) Commercial Undertakings |
7823 |
1927 |
-661 |
3567 |
5542 |
4492 |
5260 |
|
(d) |
Rest of the World |
235 |
713 |
494 |
443 |
278 |
42 |
-137 |
|
(e) |
Households |
313 |
104 |
-58 |
-111 |
-74 |
-221 |
-134 |
3. |
Investments |
9364 |
2065 |
3953 |
8444 |
5818 |
1150 |
41894 |
|
(a) |
Commercial Banks |
1883 |
-345 |
1027 |
2555 |
2780 |
363 |
1763 |
|
(b) |
Financial Corporations |
381 |
255 |
0 |
539 |
100 |
-50 |
22 |
|
(c) |
Government Commercial Undertakings |
7098 |
2154 |
2924 |
5348 |
2936 |
776 |
40036 |
|
(d) |
Private Non-Financial Companies |
2 |
2 |
2 |
2 |
2 |
62 |
73 |
4. |
Subscriptions to International Financial Organisations |
78 |
63 |
2796 |
132 |
-2895 |
-590 |
1582 |
5. |
Net purchase of domestic Gold & Silver |
0 |
0 |
0 |
0 |
0 |
0 |
0 |
6. |
SDR balances with IMF |
0 |
0 |
0 |
0 |
0 |
0 |
0 |
7. |
Cash with India Supply Mission |
0 |
0 |
0 |
0 |
0 |
0 |
0 |
8. |
Suspense Account with RBI |
47 |
-21 |
13 |
1 |
-1 |
-69 |
-86 |
9. |
Remittances with RBI |
300 |
2 |
58 |
114 |
-8 |
19 |
87 |
TOTAL |
32039 |
6061 |
-31908 |
-93167 |
-13290 |
-257 |
35523 |
Statement 4.2: State Governments |
(Rs. crore) |
Sources |
2001-02 |
2002-03 |
2003-04 |
2004-05 |
2005-06 |
2006-07 |
2007-08 |
1 |
2 |
3 |
4 |
5 |
6 |
7 |
8 |
1. |
Market Loans |
17366 |
29076 |
46455 |
55771 |
-6263 |
43895 |
56341 |
|
(a) |
Banking |
10020 |
15782 |
28748 |
7963 |
-1595 |
3004 |
29716 |
|
|
(i) Commercial Banks |
10020 |
15782 |
28748 |
7963 |
-1595 |
3004 |
29716 |
|
(b) |
Other Financial Institutions |
7597 |
9394 |
11487 |
33634 |
10759 |
27587 |
19320 |
|
|
(i) Insurance Companies |
4305 |
7248 |
11566 |
28263 |
-7053 |
2363 |
8392 |
|
|
(ii) Financial Corporations |
60 |
102 |
162 |
1089 |
1076 |
16657 |
1936 |
|
(c) |
Households |
21 |
37 |
61 |
42 |
21 |
17 |
83 |
|
(d) |
Others |
-272 |
3863 |
6159 |
14132 |
-15448 |
13287 |
7222 |
2. |
Borrowings |
25112 |
12872 |
-6223 |
-37315 |
3887 |
-12195 |
9660 |
|
(a) |
Banking |
-111 |
-6910 |
136 |
-641 |
-1140 |
-418 |
-425 |
|
(b) |
Other Financial Institutions |
8045 |
14663 |
16627 |
1405 |
6102 |
1812 |
7004 |
|
|
(i) Insurance |
4224 |
7896 |
9607 |
3811 |
1933 |
-2172 |
-971 |
|
|
(ii) Financial Corporations |
3821 |
6766 |
7019 |
-2407 |
4168 |
3984 |
7975 |
|
(c) |
Government |
11388 |
-1585 |
-34890 |
-36377 |
-3210 |
-10447 |
4072 |
|
|
(i) Central Government |
10881 |
-2072 |
-35730 |
-34932 |
-3145 |
-10368 |
3747 |
|
|
(ii) Commercial Undertakings |
507 |
487 |
840 |
-1445 |
-65 |
-79 |
325 |
|
(d) |
Others |
5790 |
6705 |
11905 |
-1701 |
2135 |
-3142 |
-991 |
3. |
State Provident Fund |
7198 |
7116 |
4892 |
8034 |
9165 |
8739 |
8646 |
4. |
State Insurance Fund |
1020 |
1111 |
1528 |
836 |
1400 |
1507 |
1600 |
TOTAL |
50696 |
50175 |
46652 |
27326 |
8190 |
41946 |
76247 |
Statement 4.2 : State Governments (Concld.) |
(Rs. crore) |
Uses |
2001-02 |
2002-03 |
2003-04 |
2004-05 |
2005-06 |
2006-07 |
2007-08 |
1 |
2 |
3 |
4 |
5 |
6 |
7 |
8 |
1. |
Cash and Bank Balances |
637 |
-5057 |
-1164 |
651 |
-1827 |
-4783 |
-15214 |
|
(a) |
Cash in hand |
0 |
0 |
0 |
0 |
0 |
0 |
0 |
|
(b) |
Balances with RBI |
637 |
-5057 |
-1164 |
651 |
-1827 |
-4783 |
-15214 |
2. |
Loans and Advances |
3651 |
7709 |
11730 |
13473 |
1075 |
6100 |
10406 |
|
(a) |
Co-operatives |
404 |
640 |
349 |
734 |
1256 |
865 |
150 |
|
(b) |
Financial Corporations |
0 |
0 |
0 |
0 |
0 |
0 |
0 |
|
(c) |
Private Corporate Business |
269 |
427 |
233 |
489 |
838 |
577 |
100 |
|
|
(i) Co-op Non-credit Societies |
269 |
427 |
233 |
489 |
838 |
577 |
100 |
|
(d) |
Government |
3257 |
2611 |
7208 |
8478 |
1436 |
2229 |
6429 |
|
|
(i) Housing Boards |
18 |
264 |
741 |
684 |
602 |
459 |
4789 |
|
|
(ii) Local Authorities |
764 |
934 |
1468 |
1236 |
354 |
787 |
1113 |
|
|
(iii) Electricity Boards |
3240 |
1750 |
4453 |
6023 |
582 |
685 |
1218 |
|
|
(iv) Other Commercial Undertakings |
-764 |
-337 |
546 |
535 |
-102 |
298 |
-691 |
|
(e) |
Households |
539 |
105 |
-188 |
396 |
-195 |
-416 |
-85 |
|
(f) |
Others |
-818 |
3927 |
4127 |
3376 |
-2260 |
2845 |
3812 |
3. |
Investments |
5028 |
738 |
1634 |
7622 |
25041 |
959 |
29329 |
|
(a) |
Banking |
85 |
87 |
372 |
164 |
372 |
725 |
1069 |
|
|
(i) Commercial Banks |
-2 |
3 |
6 |
11 |
6 |
104 |
87 |
|
|
(ii) Co-op Banks & Credit Societies |
87 |
84 |
366 |
153 |
366 |
621 |
982 |
|
(b) |
Financial Corporations |
0 |
0 |
0 |
0 |
0 |
0 |
0 |
|
(c) |
Private Corporate Business |
0 |
0 |
0 |
0 |
0 |
0 |
0 |
|
|
(i) Companies |
0 |
0 |
0 |
0 |
0 |
0 |
0 |
|
|
(ii) Non-credit Societies |
0 |
0 |
0 |
0 |
0 |
0 |
0 |
|
(d) |
Government |
4943 |
651 |
1262 |
7458 |
24669 |
234 |
28260 |
|
|
(i) Central Government & T Bills |
4943 |
651 |
1262 |
7458 |
24669 |
234 |
28260 |
|
|
(ii) Commercial Undertakings |
0 |
0 |
0 |
0 |
0 |
0 |
0 |
|
(e) |
Others |
0 |
0 |
0 |
0 |
0 |
0 |
0 |
TOTAL |
9316 |
3390 |
12200 |
21746 |
24289 |
2276 |
24521 |
Statement 4.3: Local Authorities # |
(Rs. crore) |
Sources |
2001-02 |
2002-03 |
2003-04 |
2004-05 |
2005-06 |
2006-07 |
2007-08 |
1 |
2 |
3 |
4 |
5 |
6 |
7 |
8 |
1. |
Borrowings |
-22 |
422 |
-537 |
-106 |
-132 |
-214 |
465 |
|
(a) |
Central Government |
-58 |
619 |
-465 |
51 |
-653 |
0 |
464 |
|
(b) |
State Governments |
55 |
-8 |
-8 |
-42 |
0 |
16 |
-16 |
|
(c) |
Others |
-19 |
-189 |
-64 |
-115 |
521 |
-230 |
17 |
2. |
Debentures |
0 |
0 |
275 |
-220 |
-55 |
0 |
0 |
|
(a) |
Commercial Banks |
0 |
0 |
275 |
-220 |
-55 |
0 |
0 |
3. |
Other Liabilities |
6741 |
1344 |
-61 |
350 |
1013 |
948 |
578 |
|
(a) |
Sundry Creditors |
-51 |
138 |
54 |
152 |
270 |
131 |
-827 |
|
(b) |
Deposits |
223 |
625 |
-53 |
158 |
218 |
522 |
41 |
|
(c) |
Others |
6569 |
581 |
-62 |
40 |
525 |
295 |
1364 |
TOTAL |
6719 |
1766 |
-323 |
24 |
826 |
734 |
1043 |
# Relate to Port Trusts. |
Statement 4.3: Local Authorities # (Concld.) |
(Rs. crore) |
Uses |
2001-02 |
2002-03 |
2003-04 |
2004-05 |
2005-06 |
2006-07 |
2007-08 |
1 |
2 |
3 |
4 |
5 |
6 |
7 |
8 |
1. |
Investments (other than P.F.) |
-717 |
254 |
-1000 |
1072 |
660 |
-7294 |
91 |
|
(a) |
Government |
-16 |
643 |
24 |
6 |
335 |
-841 |
-841 |
|
|
(i) Central Government |
-381 |
-27 |
2 |
22 |
7 |
-70 |
-70 |
|
|
(ii) State Governments |
366 |
670 |
22 |
-17 |
-79 |
-771 |
-771 |
|
|
(iii) Local Authorities |
-1 |
0 |
0 |
0 |
408 |
0 |
0 |
|
(b) |
Banking |
-154 |
467 |
300 |
666 |
574 |
-5397 |
1055 |
|
(c) |
Financial Corporations |
-294 |
-131 |
-507 |
1449 |
-254 |
-796 |
-288 |
|
(d) |
Others |
-253 |
-725 |
-817 |
-1049 |
5 |
-260 |
165 |
2. |
Cash & Bank Balances (other than P.F.) |
-104 |
233 |
281 |
150 |
859 |
-1449 |
1026 |
|
(a) |
Cash in hand |
-7 |
1 |
-5 |
-2 |
-3 |
-4 |
-2 |
|
(b) |
Bank Balances |
-97 |
232 |
286 |
152 |
862 |
-1445 |
1028 |
3. |
Other Assets |
340 |
56 |
-194 |
748 |
716 |
-3575 |
1685 |
|
(a) |
Sundry Debtors |
158 |
110 |
169 |
186 |
487 |
-1371 |
1581 |
|
(b) |
Payment in advance & debit balances |
72 |
159 |
-279 |
510 |
106 |
-1532 |
142 |
|
(c) |
Accrued Interest |
109 |
-210 |
-90 |
7 |
38 |
-645 |
243 |
|
(d) |
Deposits |
1 |
-3 |
7 |
45 |
86 |
-27 |
-282 |
TOTAL |
-481 |
544 |
-912 |
1970 |
2234 |
-12318 |
2802 |
Statement 4.4: Government Non-Departmental Non-Financial Undertakings |
(Rs. crore) |
Sources |
2001-02 |
2002-03 |
2003-04 |
2004-05 |
2005-06 |
2006-07 |
2007-08 |
1 |
2 |
3 |
4 |
5 |
6 |
7 |
8 |
1. |
Paid-up capital |
14348 |
7502 |
14206 |
10149 |
5095 |
7111 |
9708 |
|
(a) |
Central Government |
13208 |
4603 |
6181 |
8836 |
234 |
4947 |
6093 |
|
(b) |
State Governments |
-1031 |
1960 |
6956 |
-27 |
4446 |
1421 |
2706 |
|
(c) |
Other Financial Institutions |
263 |
114 |
129 |
162 |
50 |
90 |
110 |
|
(d) |
Rest of the World |
64 |
27 |
31 |
39 |
12 |
22 |
27 |
|
(e) |
Others |
1844 |
798 |
909 |
1139 |
353 |
631 |
772 |
2. |
Bonds and Debentures (Electricity Boards) |
-575 |
-171 |
1576 |
11 |
-3748 |
-1036 |
-1125 |
|
(a) |
Commercial Banks |
-256 |
-114 |
472 |
-55 |
-1319 |
-428 |
-961 |
|
(b) |
Other Financial Institutions |
-59 |
-26 |
108 |
-13 |
-302 |
-98 |
-179 |
|
(c) |
Households |
187 |
167 |
173 |
176 |
172 |
237 |
328 |
|
(d) |
Others (Residual) |
-447 |
-198 |
823 |
-97 |
-2299 |
-747 |
-313 |
3. |
Borrowings |
28491 |
65388 |
6903 |
-51786 |
6898 |
13282 |
-58199 |
|
(a) |
Banking |
734 |
1587 |
3523 |
2948 |
-876 |
4195 |
5945 |
|
|
(i) Commercial Banks |
511 |
1697 |
3631 |
2964 |
-2311 |
4780 |
5958 |
|
|
(ii) Co-operatives |
223 |
-110 |
-108 |
-16 |
1435 |
-585 |
-13 |
|
(b) |
Other Financial Institutions |
643 |
62580 |
3439 |
-40927 |
-6663 |
14893 |
-66421 |
|
(c) |
Government |
8738 |
5156 |
2208 |
-17829 |
1467 |
4204 |
2586 |
|
(d) |
Rest of the World |
4577 |
-4114 |
1413 |
-1681 |
125 |
6672 |
2104 |
|
(e) |
Others |
13799 |
179 |
-3680 |
5703 |
12845 |
-16682 |
-2413 |
4. |
Consumers’ Security Deposits |
544 |
973 |
1902 |
1610 |
1790 |
1658 |
1391 |
|
(a) |
Households |
544 |
973 |
1902 |
1610 |
1790 |
1658 |
1391 |
|
(b) |
Others |
0 |
0 |
0 |
0 |
0 |
0 |
0 |
5. |
Deposits |
3700 |
2806 |
3350 |
2017 |
2056 |
-1274 |
2388 |
|
(a) |
Households |
3858 |
2847 |
1719 |
1883 |
1902 |
-2090 |
215 |
|
(b) |
Others |
-158 |
-41 |
1631 |
134 |
154 |
816 |
2173 |
6. |
Sundry Creditors |
10768 |
8329 |
11568 |
12614 |
8175 |
15028 |
28404 |
7. |
Other Liabilities |
526 |
10434 |
4495 |
2022 |
-17999 |
-240 |
567 |
|
(a) |
Banking |
-4194 |
-1321 |
319 |
31 |
669 |
-176 |
469 |
|
(b) |
Other Financial Institutions |
494 |
7354 |
2241 |
-1188 |
-10717 |
39 |
41 |
|
(c) |
Government |
869 |
-80 |
1966 |
1202 |
-2656 |
-1777 |
-1501 |
|
(d) |
Others |
3357 |
4481 |
-31 |
1977 |
-5295 |
1674 |
1558 |
TOTAL |
57802 |
95261 |
44000 |
-23363 |
2267 |
34530 |
-16866 |
Statement 4.4: Government Non-Departmental Non-Financial Undertakings(Concld.) |
(Rs. crore) |
Uses |
2001-02 |
2002-03 |
2003-04 |
2004-05 |
2005-06 |
2006-07 |
2007-08 |
1 |
2 |
3 |
4 |
5 |
6 |
7 |
8 |
1. |
Cash in Hand |
6195 |
7367 |
34096 |
45134 |
19565 |
52607 |
43091 |
|
(a) |
RBI Notes |
6195 |
7367 |
34096 |
45134 |
19565 |
52607 |
43091 |
|
(b) |
One rupee notes and coins |
0 |
0 |
0 |
0 |
0 |
0 |
0 |
2. |
Balances with |
456 |
-174 |
0 |
181 |
-856 |
2646 |
584 |
|
(a) |
Treasuries |
-172 |
2 |
340 |
-261 |
-118 |
6 |
-19 |
|
(b) |
Commercial Banks |
628 |
-176 |
-340 |
442 |
-738 |
2640 |
603 |
3. |
Special Deposits with Government |
16 |
167 |
76 |
24 |
133 |
557 |
318 |
4. |
Investments |
16705 |
9970 |
31516 |
13663 |
19329 |
14624 |
-7780 |
|
(a) |
Banking |
104 |
70 |
124 |
245 |
181 |
-374 |
523 |
|
(b) |
Other Financial Institutions |
0 |
-134 |
42 |
264 |
605 |
209 |
19 |
|
(c) |
Private Corporate Business |
0 |
0 |
0 |
0 |
0 |
0 |
0 |
|
(d) |
Government Securities |
158 |
690 |
520 |
286 |
529 |
-909 |
-178 |
|
(e) |
Others |
16443 |
9344 |
30830 |
12868 |
18014 |
15698 |
-8144 |
5. |
Loans and Advances |
3344 |
6054 |
12467 |
38510 |
24941 |
19793 |
-54136 |
|
(a) |
Government |
33 |
-31 |
-30 |
-38 |
-7 |
4 |
17 |
|
(b) |
Households |
258 |
310 |
-23 |
-8 |
-8 |
-13 |
-10 |
|
(c) |
Others |
3053 |
5775 |
12520 |
38556 |
24956 |
19802 |
-54143 |
6. |
Sundry Debtors |
21528 |
12779 |
-3395 |
-6863 |
10094 |
3305 |
104176 |
7. |
Other Assets |
-1846 |
13428 |
13820 |
-13578 |
-7301 |
-1514 |
7774 |
|
(a) |
Other Financial Institutions |
0 |
0 |
38 |
-20 |
-19 |
0 |
0 |
|
(b) |
Government |
61 |
671 |
-1096 |
240 |
-2322 |
-4079 |
24 |
|
(c) |
Others |
-1907 |
12757 |
14878 |
-13798 |
-4960 |
2565 |
7750 |
TOTAL |
46398 |
49591 |
88580 |
77071 |
65905 |
92018 |
94027 |
Statement 5: Rest of the World Sector |
(Rs. crore) |
Sources |
2001-02 |
2002-03 |
2003-04 |
2004-05 |
2005-06 |
2006-07 |
2007-08 |
1 |
2 |
3 |
4 |
5 |
6 |
7 |
8 |
A. |
Increase in Liabilities |
79705 |
102390 |
166768 |
157441 |
132997 |
338269 |
558911 |
|
1. |
Loans |
410 |
157 |
589 |
1612 |
1495 |
4505 |
6650 |
|
|
(a) Government |
410 |
157 |
589 |
576 |
390 |
144 |
113 |
|
|
(b) Private Corporate Business |
0 |
0 |
0 |
1036 |
1105 |
4361 |
6537 |
|
|
(c) Reserve Bank of India |
0 |
0 |
0 |
0 |
0 |
0 |
0 |
|
2. |
Investments |
64006 |
91366 |
153533 |
126374 |
92888 |
234937 |
455643 |
|
|
(a) Reserve Bank of India |
56593 |
82037 |
143993 |
115907 |
65896 |
163634 |
369689 |
|
|
(b) Private Corporate Business |
7413 |
9329 |
9540 |
10467 |
26992 |
71303 |
85954 |
|
3. |
Deposits |
8046 |
4777 |
733 |
2481 |
17711 |
80726 |
50733 |
|
|
(a) Government |
8046 |
4777 |
733 |
2481 |
17711 |
80726 |
50733 |
|
|
(b) Others |
0 |
0 |
0 |
0 |
0 |
0 |
0 |
|
4. |
Miscellaneous |
7243 |
6090 |
11913 |
26974 |
20903 |
18101 |
45885 |
|
|
(a) Government |
0 |
0 |
0 |
0 |
0 |
0 |
0 |
|
|
(b) Private |
7243 |
6090 |
11913 |
26974 |
20903 |
18101 |
45885 |
|
|
(i) Others |
7243 |
6090 |
11913 |
26974 |
20903 |
18101 |
45885 |
B. |
Decrease in Assets |
142212 |
151518 |
247972 |
274774 |
460880 |
673459 |
1113230 |
|
1. |
Loans |
60892 |
74312 |
109327 |
85478 |
138837 |
131586 |
160427 |
|
|
(a) Reserve Bank of India |
0 |
0 |
0 |
0 |
0 |
0 |
0 |
|
|
(b) Government |
10251 |
28765 |
27754 |
7887 |
8151 |
8861 |
8444 |
|
|
(c) Private |
50641 |
45547 |
81573 |
77591 |
130686 |
122725 |
151983 |
|
|
(i) Corporate Business |
50641 |
45547 |
81573 |
77591 |
130686 |
122725 |
151983 |
|
|
(ii) Other Financial Institutions |
0 |
0 |
0 |
0 |
0 |
0 |
0 |
|
2. |
Investments |
34574 |
38329 |
77083 |
141681 |
247004 |
462857 |
826219 |
|
|
(a) Government |
0 |
0 |
0 |
0 |
0 |
0 |
0 |
|
|
(b) Private Corporate Business |
34574 |
38329 |
77083 |
141681 |
247004 |
462857 |
826219 |
|
3. |
Deposits |
44289 |
36571 |
59806 |
45757 |
72482 |
78291 |
126096 |
|
|
(a) Banking |
44289 |
36571 |
59806 |
45757 |
72482 |
78291 |
126096 |
|
|
(i) Reserve Bank of India |
1337 |
1191 |
3706 |
1706 |
624 |
357 |
1714 |
|
|
(ii) Commercial Banks |
42952 |
35380 |
56100 |
44051 |
71858 |
77934 |
124382 |
|
4. |
Miscellaneous |
2457 |
2306 |
1756 |
1858 |
2557 |
725 |
488 |
|
|
(a) Government |
2457 |
2306 |
1756 |
1858 |
2557 |
725 |
488 |
|
|
(b) Private |
0 |
0 |
0 |
0 |
0 |
0 |
0 |
|
|
(i) Corporate Business |
0 |
0 |
0 |
0 |
0 |
0 |
0 |
|
|
(ii) Others |
0 |
0 |
0 |
0 |
0 |
0 |
0 |
TOTAL ( A+B ) |
221917 |
253908 |
414740 |
432215 |
593877 |
1011728 |
1672141 |
Statement 5: Rest of the World Sector (Concld.) |
(Rs. crore) |
Uses |
2001-02 |
2002-03 |
2003-04 |
2004-05 |
2005-06 |
2006-07 |
2007-08 |
1 |
2 |
3 |
4 |
5 |
6 |
7 |
8 |
A. |
Decrease in Liabilities |
17574 |
38742 |
25008 |
33049 |
30886 |
108508 |
179516 |
|
1. |
Loans |
15 |
43 |
124 |
108 |
106 |
2927 |
6504 |
|
|
(a) Government |
0 |
0 |
110 |
108 |
106 |
90 |
97 |
|
|
(b) Private Corporate Business |
15 |
43 |
14 |
0 |
0 |
2837 |
6407 |
|
2. |
Investments |
472 |
355 |
654 |
158 |
960 |
3812 |
10960 |
|
|
(a) Private Corporate Business |
472 |
355 |
654 |
158 |
960 |
3812 |
10960 |
|
|
(b) Reserve Bank of India |
0 |
0 |
0 |
0 |
0 |
0 |
0 |
|
3. |
Deposits |
6121 |
29443 |
4345 |
2276 |
3369 |
64972 |
78365 |
|
|
(a) Government |
0 |
0 |
0 |
0 |
0 |
0 |
0 |
|
|
(b) Reserve Bank of India |
0 |
0 |
0 |
0 |
0 |
0 |
0 |
|
|
(c) Others |
6121 |
29443 |
4345 |
2276 |
3369 |
64972 |
78365 |
|
4. |
Miscellaneous |
10966 |
8901 |
19885 |
30507 |
26451 |
36797 |
83687 |
|
|
(a) Private |
10966 |
8901 |
19885 |
30507 |
26451 |
36797 |
83687 |
|
|
(i) Corporate Business |
0 |
0 |
0 |
0 |
0 |
0 |
0 |
|
|
(ii) Other Financial Institutions |
0 |
0 |
0 |
0 |
0 |
0 |
0 |
|
|
(iii) Others |
10966 |
8901 |
19885 |
30507 |
26451 |
36797 |
83687 |
B. |
Increase in Assets |
188830 |
185495 |
322966 |
408626 |
609060 |
943259 |
1556709 |
|
1. |
Loans |
55403 |
55856 |
90179 |
135577 |
174623 |
243598 |
329096 |
|
|
(a) Reserve Bank of India |
0 |
0 |
0 |
0 |
0 |
0 |
0 |
|
|
(b) Government |
16070 |
13902 |
15201 |
16880 |
16027 |
16888 |
16925 |
|
|
(c) Private |
39333 |
41954 |
74978 |
118697 |
158596 |
226710 |
312171 |
|
|
(i) Corporate Business |
39333 |
41954 |
74978 |
118697 |
158596 |
226710 |
312171 |
|
|
(ii) Other Financial Institutions |
0 |
0 |
0 |
0 |
0 |
0 |
0 |
|
2. |
Investments |
73435 |
67401 |
148811 |
210047 |
341818 |
597139 |
1082001 |
|
|
(a) Government |
0 |
0 |
0 |
0 |
0 |
0 |
0 |
|
|
(b) Private Corporate Business |
73435 |
67401 |
148811 |
210047 |
341818 |
597139 |
1082001 |
|
3. |
Deposits |
59992 |
62238 |
83976 |
63002 |
92619 |
102522 |
145612 |
|
|
(a) Banking |
59992 |
62238 |
83976 |
63002 |
92619 |
102522 |
145612 |
|
|
(i) Reserve Bank of India |
2283 |
2624 |
1554 |
1240 |
4788 |
1838 |
316 |
|
|
(ii) Commercial Banks |
57709 |
59614 |
82422 |
61762 |
87831 |
100684 |
145296 |
|
4. |
Miscellaneous |
0 |
0 |
0 |
0 |
0 |
0 |
0 |
|
|
(a) Government |
0 |
0 |
0 |
0 |
0 |
0 |
0 |
|
|
(b) Private |
0 |
0 |
0 |
0 |
0 |
0 |
0 |
|
|
(i) Corporate Business |
0 |
0 |
0 |
0 |
0 |
0 |
0 |
|
|
(ii) Unidentified |
0 |
0 |
0 |
0 |
0 |
0 |
0 |
TOTAL ( A + B ) |
206404 |
224237 |
347974 |
441675 |
639946 |
1051767 |
1736225 |
Statement 6: Household Sector |
(Rs. crore) |
Sources |
2001-02 |
2002-03 |
2003-04 |
2004-05 |
2005-06 |
2006-07 |
2007-08 |
1 |
2 |
3 |
4 |
5 |
6 |
7 |
8 |
1. |
Borrowings |
51727 |
60304 |
69982 |
120566 |
183424 |
176787 |
173136 |
|
(a) |
Banking |
43354 |
54116 |
57885 |
111667 |
175010 |
167820 |
164418 |
|
|
(i) Reserve Bank of India |
45 |
28 |
-20 |
-20 |
-12 |
15 |
6 |
|
|
(ii) Commercial Banks |
39337 |
49296 |
53516 |
107303 |
170500 |
163144 |
159721 |
|
|
(iii) Co-operative Banks & Credit Societies |
3972 |
4792 |
4389 |
4384 |
4522 |
4661 |
4691 |
|
(b) |
Other Financial Institutions |
6879 |
5247 |
12261 |
8318 |
8414 |
9388 |
8702 |
|
|
(i) Financial Corporations |
1545 |
-898 |
6008 |
3965 |
4799 |
4499 |
4159 |
|
|
(ii) Insurance |
1240 |
1642 |
2247 |
1710 |
1710 |
1889 |
1770 |
|
|
(iii) Non-banking financial companies |
4094 |
4503 |
4006 |
2643 |
1905 |
3000 |
2773 |
|
(c) |
Private Corporate Business |
384 |
422 |
105 |
304 |
277 |
229 |
245 |
|
|
(i) Non-credit societies |
384 |
422 |
105 |
304 |
277 |
229 |
245 |
|
(d) |
Government |
1110 |
519 |
-269 |
277 |
-277 |
-650 |
-229 |
|
|
(i) Central Government |
313 |
104 |
-58 |
-111 |
-74 |
-221 |
-134 |
|
|
(ii) State Governments |
539 |
105 |
-188 |
396 |
-195 |
-416 |
-85 |
|
|
(iii) Electricity Boards |
258 |
310 |
-23 |
-8 |
-8 |
-13 |
-10 |
TOTAL |
51727 |
60304 |
69982 |
120566 |
183424 |
176787 |
173136 |
Statement 6: Household Sector (Concld.) |
(Rs. crore) |
Uses |
2001-02 |
2002-03 |
2003-04 |
2004-05 |
2005-06 |
2006-07 |
2007-08 |
1 |
2 |
3 |
4 |
5 |
6 |
7 |
8 |
1. |
Cash in Hand |
28156 |
28632 |
42675 |
36977 |
53071 |
66274 |
81278 |
|
(a) |
RBI Notes |
27874 |
28346 |
42248 |
36607 |
52540 |
65611 |
80465 |
|
(b) |
One Rupee Notes and Coins |
282 |
286 |
427 |
370 |
531 |
663 |
813 |
2. |
Deposits |
120848 |
132252 |
145769 |
161629 |
280996 |
312862 |
364744 |
|
(a) |
Banking |
113255 |
123625 |
142112 |
158467 |
274843 |
311325 |
360970 |
|
|
(i) Commercial Banks |
102738 |
123544 |
141973 |
158410 |
274747 |
311215 |
360727 |
|
|
(ii) Co-operative banks and credit societies |
10517 |
81 |
140 |
57 |
96 |
109 |
243 |
|
(b) |
Other Financial Institutions |
3568 |
5340 |
-122 |
-455 |
2103 |
2316 |
2107 |
|
|
(i) Financial Corporations |
3568 |
5340 |
-122 |
-455 |
2103 |
2316 |
2107 |
|
(c) |
Private Corporate Business |
-377 |
-533 |
158 |
124 |
358 |
-347 |
60 |
|
|
(i) Non-credit societies |
-319 |
-162 |
-145 |
-208 |
22 |
22 |
23 |
|
|
(ii) Non-Financial Companies |
-58 |
-371 |
303 |
332 |
336 |
-369 |
38 |
|
(d) |
Government |
4402 |
3820 |
3621 |
3493 |
3692 |
-432 |
1606 |
|
|
(i) Commercial Undertakings |
3858 |
2847 |
1719 |
1883 |
1902 |
-2090 |
215 |
|
|
(ii) Electricity Boards |
544 |
973 |
1902 |
1610 |
1790 |
1658 |
1391 |
3. |
Insurance Funds |
41236 |
52009 |
52240 |
67986 |
83540 |
114851 |
128930 |
|
(a) |
Other Financial Institutions |
39191 |
49851 |
49427 |
65577 |
80020 |
110965 |
124422 |
|
|
(i) Insurance - Life Fund |
39191 |
49234 |
48749 |
63886 |
77509 |
107926 |
120776 |
|
|
(ii) Insurance - Pvt. Life Fund |
|
617 |
678 |
1692 |
2511 |
3038 |
3646 |
|
(b) |
Government |
2045 |
2158 |
2813 |
2409 |
3521 |
3886 |
4508 |
|
|
(i) State Insurance Fund |
1020 |
1111 |
1528 |
836 |
1400 |
1507 |
1600 |
|
|
(ii) Postal Insurance Fund |
778 |
834 |
1098 |
1414 |
1962 |
2200 |
2729 |
|
|
(iii) Central Insurance Fund |
247 |
213 |
187 |
159 |
159 |
179 |
179 |
4. |
Provident & Pension Funds |
46609 |
48441 |
48952 |
56551 |
62581 |
72106 |
70879 |
|
(a) |
Government |
19230 |
22749 |
20800 |
25026 |
26896 |
32452 |
27188 |
|
(b) |
Non-Government |
27379 |
25692 |
28152 |
31525 |
35685 |
39654 |
43691 |
5. |
Investments |
59915 |
61593 |
87863 |
111387 |
117924 |
77813 |
61074 |
|
(a) |
Banking |
202 |
117 |
111 |
263 |
366 |
206 |
766 |
|
|
(i) Commercial Banks |
190 |
89 |
87 |
241 |
342 |
180 |
737 |
|
|
(ii) Co-operative banks and credit societies |
12 |
28 |
24 |
21 |
24 |
27 |
29 |
|
(b) |
Other Financial Institutions |
4744 |
4243 |
-1101 |
423 |
24347 |
40008 |
63125 |
|
|
(i) Financial Companies |
1522 |
1568 |
2967 |
2019 |
2184 |
5609 |
6650 |
|
|
(ii) Units of UTI |
-1857 |
-1618 |
-8586 |
-3146 |
-444 |
-310 |
-324 |
|
|
(iii) Other Mutual Funds |
5079 |
4293 |
4519 |
1550 |
22606 |
34709 |
56799 |
|
(c) |
Private Corporate Business |
2843 |
979 |
1309 |
4106 |
5850 |
18146 |
25088 |
|
|
(i) Non-Financial Companies |
2646 |
833 |
1148 |
3938 |
5692 |
17984 |
24925 |
|
|
(1) Shares |
1512 |
500 |
855 |
3591 |
5634 |
18145 |
24312 |
|
|
(2) Debentures |
1134 |
333 |
294 |
347 |
58 |
-161 |
613 |
|
|
(ii) Non-Credit Societies |
197 |
146 |
160 |
168 |
158 |
162 |
163 |
|
(d) |
Government |
52126 |
56255 |
87544 |
106595 |
87361 |
19452 |
-27905 |
|
|
(i) Central Government Securities |
53 |
59 |
53 |
28 |
83 |
85 |
149 |
|
|
(ii) State Government Securities |
21 |
37 |
61 |
42 |
21 |
17 |
83 |
|
|
(iii) Small Savings |
35100 |
47986 |
58903 |
85106 |
72778 |
17544 |
-13601 |
|
|
(iv) Relief Bonds |
16727 |
7988 |
26838 |
18657 |
7945 |
-1880 |
-11903 |
|
|
(v) Special Bearer Bonds |
0 |
0 |
0 |
0 |
-11 |
0 |
0 |
|
|
(vi) Capital Investment Bonds |
0 |
0 |
0 |
0 |
0 |
0 |
0 |
|
|
(vii) National Rural Development Bonds |
0 |
0 |
0 |
0 |
0 |
0 |
0 |
|
|
(viii) National Deposit Scheme |
0 |
-17 |
0 |
0 |
0 |
0 |
0 |
|
|
(ix) Public Sector Bonds |
187 |
167 |
173 |
176 |
172 |
237 |
328 |
|
|
(x) Deposit Scheme for |
|
|
|
|
|
|
|
|
|
retired Govt. employees |
38 |
35 |
1517 |
2587 |
6373 |
3450 |
-2959 |
6. |
Trade Debt (Net) |
-183 |
-341 |
-114 |
-213 |
-222 |
6523 |
9345 |
|
(a) |
Private Non-Financial Companies |
-1 |
70 |
23 |
31 |
41 |
6418 |
9227 |
|
(b) |
Financial Companies |
-182 |
-411 |
-137 |
-243 |
-264 |
105 |
118 |
TOTAL |
296581 |
322585 |
377385 |
434317 |
597889 |
650429 |
716250 |
Statement 7: Financial Flows - Sector-wise 2001-02 |
(Rs. crore) |
Sector/Financial Transactions with other sectors |
Banking |
Other Financial Institutions |
Private Corporate Business |
Government* |
Sources |
Uses |
Sources |
Uses |
Sources |
Uses |
Sources |
Uses |
1 |
2 |
3 |
4 |
5 |
6 |
7 |
8 |
9 |
1. |
Banking |
0 |
0 |
-7217 |
-11637 |
87252 |
34958 |
63453 |
11478 |
2. |
Other Financial Institutions |
6871 |
-12829 |
0 |
0 |
122836 |
13911 |
54019 |
1043 |
3. |
Private Corporate Business |
88 |
31008 |
-3810 |
-56033 |
0 |
0 |
0 |
108 |
4. |
Government |
30353 |
97036 |
21106 |
147399 |
6314 |
7544 |
0 |
0 |
5. |
Rest of the World |
3828 |
66453 |
-7433 |
-2559 |
4130 |
2311 |
10325 |
313 |
6. |
Households |
141334 |
43354 |
74700 |
6879 |
2465 |
384 |
78085 |
1110 |
7. |
Sector not elsewhere classified |
26569 |
24365 |
16247 |
120491 |
63575 |
47228 |
46673 |
38385 |
TOTAL |
209044 |
249387 |
93592 |
204539 |
286571 |
106336 |
252555 |
52436 |
(Sources - Uses)$ |
|
-40343 |
|
-110947 |
|
180235 |
|
200119 |
$ : Financial Surplus (-); Financial Deficit (+).
* : Excludes Local Authorities except Port Trusts. |
Statement 7: Financial Flows - Sector-wise 2001-02 (Concld.) |
(Rs. crore) |
Sector/Financial Transactions with other sectors |
Rest of the World |
Households |
Total |
Sources |
Uses |
Sources |
Uses |
Sources |
Uses |
1 |
10 |
11 |
12 |
13 |
14 |
15 |
1. |
Banking |
56593 |
15703 |
43354 |
141331 |
243434 |
191833 |
2. |
Other Financial Institutions |
0 |
0 |
6879 |
74700 |
190605 |
76825 |
3. |
Private Corporate Business |
6926 |
27553 |
384 |
2465 |
3588 |
5101 |
4. |
Government |
8456 |
3362 |
1110 |
78085 |
67338 |
333424 |
5. |
Rest of the World |
0 |
0 |
0 |
0 |
10850 |
66518 |
6. |
Households |
0 |
0 |
0 |
0 |
296584 |
51727 |
7. |
Sector not elsewhere classified |
-9844 |
0 |
0 |
0 |
143220 |
230469 |
TOTAL |
62131 |
46618 |
51727 |
296581 |
955620 |
955898 |
(Sources - Uses)$ |
|
15513 |
|
-244854 |
|
-278 |
Statement 7: Financial Flows - Sector-wise 2002-03 |
(Rs. crore) |
Sector/Financial Transactions with other sectors |
Banking |
Other Financial Institutions |
Private Corporate Business |
Government* |
Sources |
Uses |
Sources |
Uses |
Sources |
Uses |
Sources |
Uses |
1 |
2 |
3 |
4 |
5 |
6 |
7 |
8 |
9 |
1. |
Banking |
0 |
0 |
18988 |
24029 |
94113 |
25896 |
104865 |
5156 |
2. |
Other Financial Institutions |
15783 |
-1657 |
0 |
0 |
17771 |
24657 |
147582 |
226 |
3. |
Private Corporate Business |
7031 |
65992 |
32589 |
28111 |
0 |
0 |
0 |
388 |
4. |
Government |
14320 |
88425 |
17217 |
41498 |
16099 |
5274 |
0 |
0 |
5. |
Rest of the World |
44032 |
94538 |
1840 |
-551 |
-10526 |
2366 |
-15877 |
776 |
6. |
Households |
152091 |
54116 |
84715 |
5247 |
515 |
422 |
85268 |
519 |
7. |
Sector not elsewhere classified |
42240 |
321 |
-18552 |
32372 |
-1216 |
16701 |
36225 |
43916 |
TOTAL |
275497 |
301735 |
136798 |
130706 |
116756 |
75316 |
358063 |
50980 |
(Sources - Uses)$ |
|
-26238 |
|
6092 |
|
41440 |
|
307083 |
$ : Financial Surplus (-); Financial Deficit (+).
* : Excludes Local Authorities except Port Trusts. |
Statement 7: Financial Flows - Sector-wise 2002-03 (Concld.) |
(Rs. crore) |
Sector/Financial Transactions with other sectors |
Rest of the World |
Households |
Total |
Sources |
Uses |
Sources |
Uses |
Sources |
Uses |
1 |
10 |
11 |
12 |
13 |
14 |
15 |
1. |
Banking |
82037 |
25667 |
54116 |
152087 |
354119 |
232834 |
2. |
Other Financial Institutions |
0 |
0 |
5247 |
84715 |
186383 |
107940 |
3. |
Private Corporate Business |
8931 |
25479 |
422 |
515 |
48974 |
120485 |
4. |
Government |
4934 |
-17169 |
519 |
85268 |
53089 |
203297 |
5. |
Rest of the World |
0 |
0 |
0 |
0 |
19469 |
97129 |
6. |
Households |
0 |
0 |
0 |
0 |
322589 |
60304 |
7. |
Sector not elsewhere classified |
-32254 |
0 |
0 |
0 |
26443 |
93311 |
TOTAL |
63648 |
33977 |
60304 |
322585 |
1011067 |
915300 |
(Sources - Uses)$ |
|
29671 |
|
-262282 |
|
95767 |
Statement 7: Financial Flows - Sector-wise 2003-04 |
(Rs. crore) |
Sector/Financial Transactions with other sectors |
Banking |
Other Financial Institutions |
Private Corporate Business |
Government* |
Sources |
Uses |
Sources |
Uses |
Sources |
Uses |
Sources |
Uses |
1 |
2 |
3 |
4 |
5 |
6 |
7 |
8 |
9 |
1. |
Banking |
0 |
0 |
32035 |
30422 |
87928 |
40979 |
85940 |
31072 |
2. |
Other Financial Institutions |
18201 |
1279 |
0 |
0 |
-49550 |
47633 |
78629 |
-507 |
3. |
Private Corporate Business |
13987 |
56298 |
-1816 |
60406 |
0 |
0 |
0 |
248 |
4. |
Government |
34336 |
124544 |
21459 |
87327 |
1358 |
19031 |
0 |
0 |
5. |
Rest of the World |
39262 |
117489 |
12804 |
-290 |
2881 |
1576 |
-12076 |
3290 |
6. |
Households |
184475 |
57885 |
76218 |
12261 |
1490 |
105 |
115205 |
-269 |
7. |
Sector not elsewhere classified |
4817 |
29350 |
5936 |
-10753 |
59935 |
19797 |
82289 |
57943 |
TOTAL |
295078 |
386845 |
146635 |
179373 |
104042 |
129121 |
349987 |
91777 |
(Sources - Uses)$ |
|
-91767 |
|
-32738 |
|
-25079 |
|
258210 |
$ : Financial Surplus (-); Financial Deficit (+).
* : Excludes Local Authorities except Port Trusts. |
Statement 7: Financial Flows - Sector-wise 2003-04 (Concld.) |
(Rs. crore) |
Sector/Financial Transactions with other sectors |
Rest of the World |
Households |
Total |
Sources |
Uses |
Sources |
Uses |
Sources |
Uses |
1 |
10 |
11 |
12 |
13 |
14 |
15 |
1. |
Banking |
143993 |
24170 |
57885 |
184471 |
407781 |
311115 |
2. |
Other Financial Institutions |
0 |
0 |
12261 |
76219 |
59540 |
124624 |
3. |
Private Corporate Business |
8872 |
65133 |
105 |
1490 |
21148 |
183575 |
4. |
Government |
1212 |
-14309 |
-269 |
115205 |
58096 |
331798 |
5. |
Rest of the World |
0 |
0 |
0 |
0 |
42871 |
122065 |
6. |
Households |
0 |
0 |
0 |
0 |
377388 |
69982 |
7. |
Sector not elsewhere classified |
-12317 |
0 |
0 |
0 |
140660 |
96336 |
TOTAL |
141760 |
74994 |
69982 |
377385 |
1107484 |
1239495 |
(Sources - Uses)$ |
|
66766 |
|
-307403 |
|
-132011 |
Statement 7: Financial Flows - Sector-wise 2004-05 |
(Rs. crore) |
Sector/Financial Transactions with other sectors |
Banking |
Other Financial Institutions |
Private Corporate Business |
Government* |
Sources |
Uses |
Sources |
Uses |
Sources |
Uses |
Sources |
Uses |
1 |
2 |
3 |
4 |
5 |
6 |
7 |
8 |
9 |
1. |
Banking |
0 |
0 |
28902 |
32754 |
80016 |
57546 |
72691 |
-21233 |
2. |
Other Financial Institutions |
28833 |
-2750 |
0 |
0 |
8556 |
14342 |
53134 |
2669 |
3. |
Private Corporate Business |
8207 |
110750 |
3874 |
52760 |
0 |
0 |
0 |
416 |
4. |
Government |
103715 |
79749 |
17705 |
219247 |
-5110 |
17879 |
0 |
0 |
5. |
Rest of the World |
23485 |
120743 |
7224 |
-822 |
5576 |
-4317 |
13126 |
576 |
6. |
Households |
195335 |
111667 |
96827 |
8318 |
4260 |
304 |
137893 |
277 |
7. |
Sector not elsewhere classified |
14837 |
54807 |
-33057 |
-11703 |
41012 |
36025 |
21086 |
33793 |
TOTAL |
374411 |
474966 |
121474 |
300554 |
134310 |
121779 |
297930 |
16497 |
(Sources - Uses)$ |
|
-100555 |
|
-179080 |
|
12532 |
|
281434 |
$ : Financial Surplus (-); Financial Deficit (+).
* : Excludes Local Authorities except Port Trusts. |
Statement 7: Financial Flows - Sector-wise 2004-05 (Concld.) |
(Rs. crore) |
Sector/Financial Transactions with other sectors |
Rest of the World |
Households |
Total |
Sources |
Uses |
Sources |
Uses |
Sources |
Uses |
1 |
10 |
11 |
12 |
13 |
14 |
15 |
1. |
Banking |
115907 |
17245 |
111667 |
195337 |
409182 |
281648 |
2. |
Other Financial Institutions |
0 |
0 |
8318 |
96827 |
98841 |
111088 |
3. |
Private Corporate Business |
11345 |
109472 |
304 |
4260 |
23729 |
277658 |
4. |
Government |
2949 |
7135 |
277 |
137893 |
119535 |
461904 |
5. |
Rest of the World |
0 |
0 |
0 |
0 |
49411 |
116180 |
6. |
Households |
0 |
0 |
0 |
0 |
434316 |
120566 |
7. |
Sector not elsewhere classified |
-5809 |
0 |
0 |
0 |
38070 |
112921 |
TOTAL |
124392 |
133852 |
120566 |
434317 |
1173084 |
1481965 |
(Sources - Uses)$ |
|
-9460 |
|
-313751 |
|
-308881 |
Statement 7: Financial Flows - Sector-wise 2005-06 |
(Rs. crore) |
Sector/Financial Transactions with other sectors |
Banking |
Other Financial Institutions |
Private Corporate Business |
Government* |
Sources |
Uses |
Sources |
Uses |
Sources |
Uses |
Sources |
Uses |
1 |
2 |
3 |
4 |
5 |
6 |
7 |
8 |
9 |
1. |
Banking |
0 |
0 |
28649 |
16715 |
134778 |
91293 |
-4978 |
2194 |
2. |
Other Financial Institutions |
52865 |
577 |
0 |
0 |
64503 |
2122 |
34837 |
1109 |
3. |
Private Corporate Business |
13063 |
176577 |
30057 |
67464 |
0 |
0 |
0 |
724 |
4. |
Government |
17964 |
46845 |
26963 |
265064 |
-4728 |
-17533 |
0 |
0 |
5. |
Rest of the World |
-11149 |
130204 |
29887 |
2117 |
62953 |
6865 |
33731 |
-2617 |
6. |
Households |
327763 |
175010 |
141893 |
8414 |
6249 |
277 |
122000 |
-277 |
7. |
Sector not elsewhere classified |
59753 |
-14516 |
-39617 |
-25281 |
44418 |
63689 |
83064 |
46479 |
TOTAL |
460259 |
514697 |
217832 |
334493 |
308172 |
146714 |
268654 |
47614 |
(Sources - Uses)$ |
|
-54438 |
|
-116661 |
|
161458 |
|
221040 |
$ : Financial Surplus (-); Financial Deficit (+).
* : Excludes Local Authorities except Port Trusts. |
Statement 7: Financial Flows - Sector-wise 2005-06 (Concld.) |
(Rs. crore) |
Sector/Financial Transactions with other sectors |
Rest of the World |
Households |
Total |
Sources |
Uses |
Sources |
Uses |
Sources |
Uses |
1 |
10 |
11 |
12 |
13 |
14 |
15 |
1. |
Banking |
65896 |
20137 |
175010 |
327749 |
399354 |
458089 |
2. |
Other Financial Institutions |
0 |
0 |
8414 |
141890 |
160619 |
145699 |
3. |
Private Corporate Business |
27137 |
122724 |
277 |
6249 |
70534 |
373738 |
4. |
Government |
17995 |
5319 |
-277 |
122000 |
57917 |
421696 |
5. |
Rest of the World |
0 |
0 |
0 |
0 |
115422 |
136569 |
6. |
Households |
0 |
0 |
0 |
0 |
597905 |
183424 |
7. |
Sector not elsewhere classified |
-8917 |
0 |
0 |
0 |
138700 |
70372 |
TOTAL |
102111 |
148180 |
183424 |
597889 |
1540452 |
1789586 |
(Sources - Uses)$ |
|
-46069 |
|
-414466 |
|
-249134 |
Statement 7: Financial Flows - Sector-wise 2006-07 |
(Rs. crore) |
Sector/Financial Transactions with other sectors |
Banking |
Other Financial Institutions |
Private Corporate Business |
Government* |
Sources |
Uses |
Sources |
Uses |
Sources |
Uses |
Sources |
Uses |
1 |
2 |
3 |
4 |
5 |
6 |
7 |
8 |
9 |
1. |
Banking |
0 |
0 |
29785 |
60212 |
295717 |
124549 |
20444 |
49587 |
2. |
Other Financial Institutions |
12432 |
405 |
0 |
0 |
97674 |
54963 |
204426 |
-87 |
3. |
Private Corporate Business |
29541 |
137768 |
29546 |
81025 |
0 |
0 |
0 |
545 |
4. |
Government |
118547 |
111200 |
32127 |
275587 |
735 |
28983 |
0 |
0 |
5. |
Rest of the World |
33599 |
118755 |
34962 |
2720 |
90042 |
13871 |
14038 |
-548 |
6. |
Households |
377120 |
167820 |
193048 |
9388 |
24217 |
229 |
56021 |
-650 |
7. |
Sector not elsewhere classified |
27028 |
-5418 |
-105435 |
58956 |
169595 |
163580 |
-92980 |
40407 |
TOTAL |
598267 |
530530 |
214032 |
487887 |
677979 |
386174 |
201949 |
89253 |
(Sources - Uses)$ |
|
67737 |
|
-273855 |
|
291805 |
|
112696 |
$ : Financial Surplus (-); Financial Deficit (+).
* : Excludes Local Authorities except Port Trusts. |
Statement 7: Financial Flows - Sector-wise 2006-07 (Concld.) |
(Rs. crore) |
Sector/Financial Transactions with other sectors |
Rest of the World |
Households |
Total |
Sources |
Uses |
Sources |
Uses |
Sources |
Uses |
1 |
10 |
11 |
12 |
13 |
14 |
15 |
1. |
Banking |
163634 |
24231 |
167820 |
377142 |
677400 |
635721 |
2. |
Other Financial Institutions |
0 |
0 |
9388 |
193048 |
323919 |
248329 |
3. |
Private Corporate Business |
69015 |
238267 |
229 |
24217 |
128331 |
481821 |
4. |
Government |
80780 |
7302 |
-650 |
56021 |
231539 |
479092 |
5. |
Rest of the World |
0 |
0 |
0 |
0 |
172641 |
134798 |
6. |
Households |
0 |
0 |
0 |
0 |
650406 |
176787 |
7. |
Sector not elsewhere classified |
-83668 |
0 |
0 |
0 |
-85459 |
257525 |
TOTAL |
229761 |
269800 |
176787 |
650429 |
2098776 |
2414073 |
(Sources - Uses)$ |
|
-40039 |
|
-473641 |
|
-315297 |
Statement 7: Financial Flows - Sector-wise 2007-08 |
(Rs. crore) |
Sector/Financial Transactions with other sectors |
Banking |
Other Financial Institutions |
Private Corporate Business |
Government* |
Sources |
Uses |
Sources |
Uses |
Sources |
Uses |
Sources |
Uses |
1 |
2 |
3 |
4 |
5 |
6 |
7 |
8 |
9 |
1. |
Banking |
0 |
0 |
54433 |
-8736 |
403383 |
31829 |
91634 |
15441 |
2. |
Other Financial Institutions |
46770 |
458 |
0 |
0 |
161542 |
85681 |
8014 |
396 |
3. |
Private Corporate Business |
48989 |
240191 |
83066 |
111367 |
0 |
0 |
0 |
63 |
4. |
Government |
205457 |
227743 |
27997 |
272108 |
1967 |
39565 |
0 |
0 |
5. |
Rest of the World |
34106 |
356350 |
69786 |
3010 |
68649 |
51740 |
13550 |
1445 |
6. |
Households |
442249 |
164418 |
233462 |
8702 |
34375 |
245 |
6210 |
-229 |
7. |
Sector not elsewhere classified |
52906 |
138113 |
-13139 |
43193 |
217078 |
317894 |
72972 |
55582 |
Total |
830477 |
1127272 |
455605 |
429643 |
886994 |
526954 |
192381 |
72698 |
(Sources - Uses)$ |
|
-296795 |
|
25962 |
|
360039 |
|
119683 |
$ : Financial Surplus (-); Financial Deficit (+).
* : Excludes Local Authorities except Port Trusts. |
Statement 7: Financial Flows - Sector-wise 2007-08 (Concld.) |
(Rs. crore) |
Sector/Financial Transactions with other sectors |
Rest of the World |
Households |
Total |
Sources |
Uses |
Sources |
Uses |
Sources |
Uses |
1 |
10 |
11 |
12 |
13 |
14 |
15 |
1. |
Banking |
369689 |
19516 |
164418 |
442202 |
1083556 |
500252 |
2. |
Other Financial Institutions |
0 |
0 |
8702 |
233462 |
225029 |
319998 |
3. |
Private Corporate Business |
75124 |
415970 |
245 |
34375 |
207424 |
801965 |
4. |
Government |
50749 |
7993 |
-229 |
6210 |
285940 |
553619 |
5. |
Rest of the World |
0 |
0 |
0 |
0 |
186091 |
412545 |
6. |
Households |
0 |
0 |
0 |
0 |
716297 |
173136 |
7. |
Sector not elsewhere classified |
-116167 |
0 |
0 |
0 |
213650 |
554782 |
Total |
379395 |
443479 |
173136 |
716250 |
2917987 |
3316297 |
(Sources - Uses)$ |
|
-64084 |
|
-543114 |
|
-398309 |
Statement 8: Financial Flows - Instrument-wise 2001-02 |
(Rs. crore) |
Instrument/Sector |
Banking |
Other Financial Institutions |
Private Corporate Business |
Government* |
Sources |
Uses |
Sources |
Uses |
Sources |
Uses |
Sources |
Uses |
1 |
2 |
3 |
4 |
5 |
6 |
7 |
8 |
9 |
1. |
Currency & Deposits |
177486 |
137 |
2363 |
-4638 |
3385 |
38293 |
15061 |
9155 |
2. |
Investments |
6177 |
143627 |
1515 |
218405 |
82351 |
22203 |
124894 |
18197 |
|
a. |
Central and State Governments’ Securities |
0 |
73969 |
0 |
121715 |
0 |
4114 |
106533 |
0 |
|
b. |
Other government Securities |
0 |
337 |
0 |
40332 |
0 |
0 |
18361 |
0 |
|
c. |
Corporate Securities |
0 |
43 |
0 |
31340 |
82351 |
0 |
0 |
2 |
|
d. |
Bank securities |
6177 |
0 |
0 |
-2876 |
0 |
94 |
0 |
1918 |
|
e. |
Other Financial Institutions Securities |
0 |
951 |
1515 |
0 |
0 |
13911 |
0 |
87 |
|
|
of which: |
|
|
|
|
|
|
|
|
|
|
(i) Mutual Funds
(including Units of UTI) |
0 |
0 |
6544 |
0 |
0 |
0 |
0 |
0 |
|
f. |
Foreign Securities |
0 |
66391 |
0 |
-1111 |
0 |
2311 |
0 |
0 |
|
g. |
Others |
0 |
1936 |
0 |
29004 |
0 |
1772 |
0 |
16190 |
3. |
Loans and Advances |
-8 |
90068 |
3008 |
-10586 |
144526 |
45809 |
39060 |
5045 |
4. |
Small Savings |
0 |
0 |
0 |
0 |
0 |
0 |
35100 |
0 |
5. |
Life Fund |
0 |
0 |
39043 |
0 |
0 |
0 |
2045 |
0 |
6. |
Provident Fund |
0 |
0 |
46609 |
0 |
0 |
0 |
19230 |
0 |
7. |
Compulsory Deposits |
0 |
0 |
0 |
0 |
0 |
0 |
0 |
0 |
8. |
Trade Debt /Credit |
0 |
0 |
-182 |
0 |
-1 |
0 |
10718 |
21686 |
9. |
Foreign claims not elsewhere classified |
62 |
62 |
0 |
0 |
0 |
0 |
0 |
78 |
10 |
Other items not elsewhere classified |
25327 |
15493 |
1236 |
1358 |
56310 |
31 |
6448 |
-1726 |
TOTAL |
209044 |
249387 |
93592 |
204539 |
286571 |
106336 |
252555 |
52436 |
* : Excludes Local Authorities except Port Trusts. |
Statement 8: Financial Flows - Instrument-wise 2001-02(Concld.) |
(Rs. crore) |
Instrument/Sector |
Rest of the World |
Households |
Total |
Discrepancy |
Sources |
Uses |
Sources |
Uses |
Sources |
Uses |
(Sources -Uses) |
1 |
10 |
11 |
12 |
13 |
14 |
15 |
16 |
1. |
Currency & Deposits |
1925 |
15703 |
0 |
149004 |
200220 |
207654 |
-7434 |
2. |
Investments |
63534 |
38861 |
0 |
24815 |
278470 |
466108 |
-187638 |
|
a. |
Central and State Governments’ Securities |
0 |
0 |
0 |
74 |
106533 |
199873 |
-93340 |
|
b. |
Other government Securities |
0 |
0 |
0 |
16952 |
18361 |
57621 |
-39260 |
|
c. |
Corporate Securities |
0 |
38861 |
0 |
2843 |
82351 |
73089 |
9262 |
|
d. |
Bank securities |
0 |
0 |
0 |
202 |
6177 |
-662 |
6839 |
|
e. |
Other Financial Institutions Securities |
0 |
0 |
0 |
4744 |
1515 |
19693 |
-18178 |
|
|
of which: |
|
|
|
|
|
|
|
|
|
(i) Mutual Funds
(including Units of UTI) |
0 |
0 |
0 |
3222 |
6544 |
3222 |
3322 |
|
f. |
Foreign Securities |
63534 |
0 |
0 |
0 |
63534 |
67592 |
-4058 |
|
g. |
Others |
0 |
0 |
0 |
0 |
0 |
48903 |
-48903 |
3. |
Loans and Advances |
395 |
-5489 |
51727 |
0 |
238707 |
124847 |
113860 |
4. |
Small Savings |
0 |
0 |
0 |
35100 |
35100 |
35100 |
0 |
5. |
Life Fund |
0 |
-148 |
0 |
41236 |
41088 |
41088 |
0 |
6. |
Provident Fund |
0 |
0 |
0 |
46609 |
65839 |
46609 |
19230 |
7. |
Compulsory Deposits |
0 |
0 |
0 |
0 |
0 |
0 |
0 |
8. |
Trade Debt /Credit |
0 |
0 |
0 |
-183 |
10535 |
21503 |
-10969 |
9. |
Foreign claims not elsewhere classified |
-3723 |
-2309 |
0 |
0 |
-3661 |
-2169 |
-1492 |
10. |
Other items not elsewhere classified |
0 |
0 |
0 |
0 |
89322 |
15156 |
74165 |
TOTAL |
62131 |
46618 |
51727 |
296581 |
955620 |
955898 |
-278 |
Statement 8: Financial Flows - Instrument-wise 2002-03 |
(Rs. crore) |
Instrument/Sector |
Banking |
Other Financial Institutions |
Private Corporate Business |
Government* |
Sources |
Uses |
Sources |
Uses |
Sources |
Uses |
Sources |
Uses |
1 |
2 |
3 |
4 |
5 |
6 |
7 |
8 |
9 |
1. |
Currency & Deposits |
210061 |
-64 |
6276 |
4509 |
5237 |
24221 |
15467 |
4239 |
2. |
Investments |
2097 |
185932 |
5821 |
81874 |
20399 |
31394 |
186950 |
8890 |
|
a. |
Central and State Governments’ Securities |
0 |
86513 |
0 |
85362 |
0 |
6860 |
178176 |
0 |
|
b. |
Other government Securities |
0 |
857 |
0 |
-38992 |
0 |
0 |
8774 |
0 |
|
c. |
Corporate Securities |
0 |
451 |
0 |
2551 |
20399 |
0 |
0 |
2 |
|
d. |
Bank securities |
2097 |
0 |
0 |
2773 |
0 |
89 |
0 |
279 |
|
e. |
Other Financial Institutions Securities |
0 |
1037 |
5821 |
0 |
0 |
24657 |
0 |
-10 |
|
|
of which: |
|
|
|
|
|
|
|
|
|
|
(i) Mutual Funds
(including Units of UTI) |
0 |
0 |
2818 |
0 |
0 |
0 |
0 |
0 |
|
f. |
Foreign Securities |
0 |
94033 |
0 |
4 |
0 |
2366 |
0 |
0 |
|
g. |
Others |
0 |
3040 |
0 |
30176 |
0 |
-2577 |
0 |
8619 |
3. |
Loans and Advances |
23665 |
120272 |
26457 |
36147 |
95099 |
19535 |
62566 |
12196 |
4. |
Small Savings |
0 |
0 |
0 |
0 |
0 |
0 |
47986 |
0 |
5. |
Life Fund |
0 |
0 |
49190 |
0 |
0 |
0 |
2158 |
0 |
6. |
Provident Fund |
0 |
0 |
48441 |
0 |
0 |
0 |
22749 |
0 |
7. |
Compulsory Deposits |
0 |
0 |
0 |
0 |
0 |
0 |
0 |
0 |
8. |
Trade Debt /Credit |
0 |
0 |
-411 |
0 |
70 |
0 |
8467 |
12889 |
9. |
Foreign claims not elsewhere classified |
505 |
505 |
0 |
0 |
0 |
0 |
0 |
63 |
10 |
Other items not elsewhere classified |
39170 |
-4910 |
1024 |
8176 |
-4049 |
165 |
11720 |
12703 |
TOTAL |
275497 |
301735 |
136798 |
130706 |
116756 |
75316 |
358063 |
50980 |
* : Excludes Local Authorities except Port Trusts. |
Statement 8: Financial Flows - Instrument-wise 2002-03 (Concld.) |
(Rs. crore) |
Instrument/Sector |
Rest of the World |
Households |
Total |
Discrepancy |
Sources |
Uses |
Sources |
Uses |
Sources |
Uses |
(Sources -Uses) |
1 |
10 |
11 |
12 |
13 |
14 |
15 |
16 |
1. |
Currency & Deposits |
-24666 |
25667 |
0 |
160884 |
212376 |
219457 |
-7081 |
2. |
Investments |
91011 |
29072 |
0 |
13607 |
306277 |
350769 |
-44492 |
|
a. |
Central and State Governments’
Securities |
0 |
0 |
0 |
96 |
178176 |
178832 |
-655 |
|
b. |
Other government Securities |
0 |
0 |
0 |
8173 |
8774 |
-29962 |
38736 |
|
c. |
Corporate Securities |
0 |
29072 |
0 |
979 |
20399 |
33054 |
-12656 |
|
d. |
Bank securities |
0 |
0 |
0 |
117 |
2097 |
3258 |
-1161 |
|
e. |
Other Financial Institutions Securities |
0 |
0 |
0 |
4243 |
5821 |
29927 |
-24106 |
|
|
of which: |
|
|
|
|
|
|
|
|
|
(i) Mutual Funds
(including Units of UTI) |
0 |
0 |
0 |
2675 |
2818 |
2675 |
143 |
|
f. |
Foreign Securities |
91011 |
0 |
0 |
0 |
91011 |
96403 |
-5392 |
|
g. |
Others |
0 |
0 |
0 |
0 |
0 |
39257 |
-39257 |
3. |
Loans and Advances |
114 |
-18456 |
60304 |
0 |
268204 |
169694 |
98511 |
4. |
Small Savings |
0 |
0 |
0 |
47986 |
47986 |
47986 |
0 |
5. |
Life Fund |
0 |
-44 |
0 |
52009 |
51348 |
51964 |
-617 |
6. |
Provident Fund |
0 |
0 |
0 |
48441 |
71190 |
48441 |
22749 |
7. |
Compulsory Deposits |
0 |
0 |
0 |
0 |
0 |
0 |
0 |
8. |
Trade Debt /Credit |
0 |
0 |
0 |
-341 |
8126 |
12548 |
-4422 |
9. |
Foreign claims not elsewhere classified |
-2811 |
-2262 |
0 |
0 |
-2306 |
-1694 |
-612 |
10. |
Other items not elsewhere classified |
0 |
0 |
0 |
0 |
47866 |
16135 |
31731 |
TOTAL |
63648 |
33977 |
60304 |
322585 |
1011067 |
915300 |
95767 |
Statement 8: Financial Flows - Instrument-wise 2003-04 |
(Rs. crore) |
Instrument/Sector |
Banking |
Other Financial Institutions |
Private Corporate Business |
Government* |
|
Sources |
Uses |
Sources |
Uses |
Sources |
Uses |
Sources |
Uses |
1 |
2 |
3 |
4 |
5 |
6 |
7 |
8 |
9 |
1. |
Currency & Deposits |
269884 |
-707 |
-4090 |
14216 |
-3708 |
58279 |
7913 |
28893 |
2. |
Investments |
2579 |
253668 |
30707 |
125606 |
-15730 |
54011 |
225713 |
31373 |
|
a. |
Central and State Governments’ Securities |
0 |
122213 |
0 |
78301 |
0 |
1648 |
194438 |
0 |
|
b. |
Other government Securities |
0 |
3545 |
0 |
-151 |
0 |
0 |
31275 |
0 |
|
c. |
Corporate Securities |
0 |
997 |
0 |
4686 |
-15730 |
0 |
0 |
2 |
|
d. |
Bank securities |
2579 |
0 |
0 |
19092 |
0 |
83 |
0 |
1823 |
|
e. |
Other Financial Institutions Securities |
0 |
2210 |
30707 |
0 |
0 |
47633 |
0 |
-465 |
|
|
of which: |
|
|
|
|
|
|
|
|
|
|
(i) Mutual Funds
(including Units of UTI) |
0 |
0 |
10830 |
0 |
0 |
0 |
0 |
0 |
|
f. |
Foreign Securities |
0 |
117472 |
0 |
73 |
0 |
1576 |
0 |
0 |
|
g. |
Others |
0 |
7231 |
0 |
23606 |
0 |
3071 |
0 |
30013 |
3. |
Loans and Advances |
19806 |
113206 |
20214 |
41529 |
82214 |
16890 |
19811 |
17387 |
4. |
Small Savings |
0 |
0 |
0 |
0 |
0 |
0 |
58903 |
0 |
5. |
Life Fund |
0 |
0 |
49118 |
0 |
0 |
0 |
2813 |
0 |
6. |
Provident Fund |
0 |
0 |
48952 |
0 |
0 |
0 |
20800 |
0 |
7. |
Compulsory Deposits |
0 |
0 |
0 |
0 |
0 |
0 |
0 |
0 |
8. |
Trade Debt /Credit |
0 |
0 |
-137 |
0 |
23 |
0 |
11622 |
-3226 |
9. |
Foreign claims not elsewhere classified |
17 |
17 |
0 |
0 |
0 |
0 |
0 |
2797 |
10. |
. Other items not elsewhere classified |
2793 |
20661 |
1871 |
-1978 |
41243 |
-59 |
2414 |
14553 |
TOTAL |
295078 |
386845 |
146635 |
179373 |
104042 |
129121 |
349987 |
91777 |
* Excludes Local Authorities except Port Trusts. |
Statement 8: Financial Flows - Instrument-wise 2003-04 (Concld.) |
(Rs. crore) |
Instrument/Sector |
Rest of the World |
Households |
Total |
Discrepancy |
Sources |
Uses |
Sources |
Uses |
Sources |
Uses |
(Sources -Uses) |
1 |
10 |
11 |
12 |
13 |
14 |
15 |
16 |
1. |
Currency & Deposits |
-3612 |
24170 |
0 |
188444 |
266387 |
313296 |
-46909 |
2. |
Investments |
152879 |
71728 |
0 |
28960 |
396147 |
565346 |
-169199 |
|
a. |
Central and State Governments’ Securities |
0 |
0 |
0 |
114 |
194438 |
202275 |
-7837 |
|
b. |
Other government Securities |
0 |
0 |
0 |
28528 |
31275 |
31921 |
-647 |
|
c. |
Corporate Securities |
0 |
71728 |
0 |
1309 |
-15730 |
78721 |
-94452 |
|
d. |
Bank securities |
0 |
0 |
0 |
111 |
2579 |
21108 |
-18529 |
|
e. |
Other Financial Institutions Securities |
0 |
0 |
0 |
-1101 |
30707 |
48277 |
-17571 |
|
of which: |
|
|
|
|
|
|
|
|
|
(i) Mutual Funds
(including Units of UTI) |
0 |
0 |
0 |
-4068 |
10830 |
-4068 |
14898 |
|
f. |
Foreign Securities |
152879 |
0 |
0 |
0 |
152879 |
119121 |
33758 |
|
g. |
Others |
0 |
0 |
0 |
0 |
0 |
63921 |
-63921 |
3. |
Loans and Advances |
465 |
-19148 |
69982 |
0 |
212491 |
169864 |
42627 |
4. |
Small Savings |
0 |
0 |
0 |
58903 |
58903 |
58903 |
0 |
5. |
Life Fund |
0 |
369 |
0 |
52240 |
51931 |
52609 |
-678 |
6. |
Provident Fund |
0 |
0 |
0 |
48952 |
69752 |
48952 |
20800 |
7. |
Compulsory Deposits |
0 |
0 |
0 |
0 |
0 |
0 |
0 |
8. |
Trade Debt /Credit |
0 |
0 |
0 |
-114 |
11508 |
-3340 |
14848 |
9. |
Foreign claims not elsewhere classified |
-7972 |
-2125 |
0 |
0 |
-7955 |
688 |
-8643 |
10. |
Other items not elsewhere classified |
0 |
0 |
0 |
0 |
48320 |
33177 |
15143 |
TOTAL |
141760 |
74994 |
69982 |
377385 |
1107484 |
1239495 |
-132011 |
Statement 8: Financial Flows - Instrument-wise 2004-05 |
(Rs. crore) |
Instrument/Sector |
Banking |
Other Financial Institutions |
Private Corporate Business |
Government* |
Sources |
Uses |
Sources |
Uses |
Sources |
Uses |
Sources |
Uses |
1 |
2 |
3 |
4 |
5 |
6 |
7 |
8 |
9 |
1. |
Currency & Deposits |
302501 |
589 |
-3013 |
12856 |
-2228 |
60850 |
7519 |
-25642 |
2. |
Investments |
6887 |
159899 |
-27661 |
208459 |
32312 |
30926 |
184342 |
17702 |
|
a. |
Central and State Governments’ Securities |
0 |
51269 |
0 |
243483 |
0 |
14499 |
161969 |
0 |
|
b. |
Other government Securities |
0 |
-2446 |
0 |
2151 |
0 |
0 |
22374 |
0 |
|
c. |
Corporate Securities |
0 |
-3908 |
0 |
-24503 |
32312 |
0 |
0 |
2 |
|
d. |
Bank securities |
6887 |
0 |
0 |
1615 |
0 |
76 |
0 |
3630 |
|
e. |
Other Financial Institutions Securities |
0 |
-2916 |
-27661 |
0 |
0 |
14342 |
0 |
2252 |
|
|
of which: |
|
|
|
|
|
|
|
|
|
|
(i) Mutual Funds
(including Units of UTI) |
0 |
0 |
-31554 |
0 |
0 |
0 |
0 |
0 |
|
f. |
Foreign Securities |
0 |
119959 |
0 |
0 |
0 |
-4317 |
0 |
0 |
|
g. |
Others |
0 |
-2059 |
0 |
-14287 |
0 |
6327 |
0 |
11819 |
3. |
Loans and Advances |
52257 |
258707 |
30273 |
69913 |
80319 |
29736 |
-20256 |
44237 |
4. |
Small Savings |
0 |
0 |
0 |
0 |
0 |
0 |
85106 |
0 |
5. |
Life Fund |
0 |
0 |
63887 |
0 |
0 |
0 |
2409 |
0 |
6. |
Provident Fund |
0 |
0 |
56551 |
0 |
0 |
0 |
25026 |
0 |
7. |
Compulsory Deposits |
0 |
0 |
0 |
0 |
0 |
0 |
0 |
0 |
8. |
Trade Debt /Credit |
0 |
0 |
-243 |
0 |
31 |
0 |
12766 |
-6677 |
9. |
Foreign claims not elsewhere classified |
784 |
784 |
0 |
0 |
0 |
0 |
0 |
132 |
10. |
. Other items not elsewhere classified |
11983 |
54987 |
1680 |
9325 |
23876 |
266 |
1018 |
-13256 |
TOTAL |
374411 |
474966 |
121474 |
300554 |
134310 |
121779 |
297930 |
16497 |
* : Excludes Local Authorities except Port Trusts. |
Statement 8: Financial Flows - Instrument-wise 2004-05 (Concld.) |
(Rs. crore) |
Instrument/Sector |
Rest of the World |
Households |
Total |
Discrepancy |
Sources |
Uses |
Sources |
Uses |
Sources |
Uses |
(Sources -Uses) |
1 |
10 |
11 |
12 |
13 |
14 |
15 |
16 |
1. |
Currency & Deposits |
205 |
17245 |
0 |
198606 |
304983 |
264504 |
40479 |
2. |
Investments |
126216 |
68366 |
0 |
26280 |
322096 |
511633 |
-189537 |
|
a. |
Central and State Governments’ Securities |
0 |
0 |
0 |
70 |
161969 |
309321 |
-147353 |
|
b. |
Other government Securities |
0 |
0 |
0 |
21419 |
22374 |
21124 |
1250 |
|
c. |
Corporate Securities |
0 |
68366 |
0 |
4106 |
32312 |
44062 |
-11750 |
|
d. |
Bank securities |
0 |
0 |
0 |
263 |
6887 |
5583 |
1303 |
|
e. |
Other Financial Institutions Securities |
0 |
0 |
0 |
423 |
-27661 |
14102 |
-41762 |
|
|
of which: |
|
|
|
|
|
|
|
|
|
(i) Mutual Funds
(including Units of UTI) |
0 |
0 |
0 |
-1596 |
-31554 |
-1596 |
-29959 |
|
f. |
Foreign Securities |
126216 |
0 |
0 |
0 |
126216 |
115641 |
10575 |
|
g. |
Others |
0 |
0 |
0 |
0 |
0 |
1799 |
-1799 |
3. |
Loans and Advances |
1504 |
50099 |
120566 |
0 |
264663 |
452692 |
-188029 |
4. |
Small Savings |
0 |
0 |
0 |
85106 |
85106 |
85106 |
0 |
5. |
Life Fund |
0 |
2 |
0 |
67986 |
66296 |
67988 |
-1692 |
6. |
Provident Fund |
0 |
0 |
0 |
56551 |
81578 |
56551 |
25026 |
7. |
Compulsory Deposits |
0 |
0 |
0 |
0 |
0 |
0 |
0 |
8. |
Trade Debt /Credit |
0 |
0 |
0 |
-213 |
12554 |
-6890 |
19443 |
9. |
Foreign claims not elsewhere classified |
-3533 |
-1860 |
0 |
0 |
-2749 |
-943 |
-1806 |
10. |
Other items not elsewhere classified |
0 |
0 |
0 |
0 |
38557 |
51323 |
-12766 |
TOTAL |
124392 |
133852 |
120566 |
434317 |
1173084 |
1481965 |
-308881 |
Statement 8: Financial Flows - Instrument-wise 2005-06 |
(Rs. crore) |
Instrument/Sector |
Banking |
Other Financial Institutions |
Private Corporate Business |
Government* |
Sources |
Uses |
Sources |
Uses |
Sources |
Uses |
Sources |
Uses |
1 |
2 |
3 |
4 |
5 |
6 |
7 |
8 |
9 |
1. |
Currency & Deposits |
367565 |
-433 |
-2733 |
22314 |
-7641 |
99470 |
9244 |
-3054 |
2. |
Investments |
9121 |
138473 |
50208 |
272913 |
122878 |
-16466 |
115956 |
22379 |
|
a. |
Central and State Governments’ Securities |
0 |
4838 |
0 |
226764 |
0 |
-25791 |
105037 |
0 |
|
b. |
Other government Securities |
0 |
155 |
0 |
13448 |
0 |
0 |
10919 |
0 |
|
c. |
Corporate Securities |
0 |
-1034 |
0 |
10197 |
122878 |
0 |
0 |
2 |
|
d. |
Bank securities |
9121 |
0 |
0 |
1244 |
0 |
81 |
0 |
3907 |
|
e. |
Other Financial Institutions Securities |
0 |
52 |
50208 |
0 |
0 |
2122 |
0 |
451 |
|
|
of which: |
|
|
|
|
|
|
|
|
|
|
(i) Mutual Funds
(including Units of UTI) |
0 |
0 |
20940 |
0 |
0 |
0 |
0 |
0 |
|
f. |
Foreign Securities |
0 |
129434 |
0 |
-13 |
0 |
6865 |
0 |
0 |
|
g. |
Others |
0 |
5028 |
0 |
21273 |
0 |
257 |
0 |
18019 |
3. |
Loans and Advances |
26412 |
396154 |
27308 |
57758 |
139202 |
63959 |
46415 |
25352 |
4. |
Small Savings |
0 |
0 |
0 |
0 |
0 |
0 |
72778 |
0 |
5. |
Life Fund |
0 |
0 |
77722 |
0 |
0 |
0 |
3521 |
0 |
6. |
Provident Fund |
0 |
0 |
62581 |
0 |
0 |
0 |
26896 |
0 |
7. |
Compulsory Deposits |
0 |
0 |
0 |
0 |
0 |
0 |
0 |
0 |
8. |
Trade Debt /Credit |
0 |
0 |
-264 |
0 |
41 |
0 |
8445 |
10581 |
9. |
Foreign claims not elsewhere classified |
770 |
770 |
0 |
0 |
0 |
0 |
0 |
-2894 |
10. |
Other items not elsewhere classified |
56392 |
-20266 |
3009 |
-18492 |
53692 |
-250 |
-14600 |
-4750 |
TOTAL |
460259 |
514697 |
217832 |
334493 |
308172 |
146714 |
268654 |
47614 |
* : Excludes Local Authorities except Port Trusts. |
Statement 8: Financial Flows - Instrument-wise 2005-06 (Concld.) |
(Rs. crore) |
Instrument/Sector |
Rest of the World |
Households |
Total |
Discrepancy |
Sources |
Uses |
Sources |
Uses |
Sources |
Uses |
(Sources -Uses) |
1 |
10 |
11 |
12 |
13 |
14 |
15 |
16 |
1. |
Currency & Deposits |
14342 |
20137 |
0 |
334067 |
380777 |
472501 |
-91724 |
2. |
Investments |
91928 |
94814 |
0 |
45146 |
390091 |
557258 |
-167167 |
|
a. |
Central and State Governments’ Securities |
0 |
0 |
0 |
104 |
105037 |
205915 |
-100878 |
|
b. |
Other government Securities |
0 |
0 |
0 |
14479 |
10919 |
28081 |
-17162 |
|
c. |
Corporate Securities |
0 |
94814 |
0 |
5850 |
122878 |
109829 |
13049 |
|
d. |
Bank securities |
0 |
0 |
0 |
366 |
9121 |
5598 |
3523 |
|
e. |
Other Financial Institutions Securities |
0 |
0 |
0 |
24347 |
50208 |
26971 |
23237 |
|
|
of which : |
|
|
|
|
|
|
|
|
|
(i) Mutual Funds
(including Units of UTI) |
0 |
0 |
0 |
22162 |
20940 |
22162 |
-1222 |
|
f. |
Foreign Securities |
91928 |
0 |
0 |
0 |
91928 |
136286 |
-44358 |
|
g. |
Others |
0 |
0 |
0 |
0 |
0 |
44577 |
-44577 |
3. |
Loans and Advances |
1389 |
35786 |
183424 |
0 |
424149 |
579009 |
-154860 |
4. |
Small Savings |
0 |
0 |
0 |
72778 |
72778 |
72778 |
0 |
5. |
Life Fund |
0 |
213 |
0 |
83540 |
81243 |
83754 |
-2511 |
6. |
Provident Fund |
0 |
0 |
0 |
62581 |
89477 |
62581 |
26896 |
7. |
Compulsory Deposits |
0 |
0 |
0 |
0 |
0 |
0 |
0 |
8. |
Trade Debt /Credit |
0 |
0 |
0 |
-222 |
8223 |
10359 |
-2136 |
9. |
Foreign claims not elsewhere classified |
-5548 |
-2770 |
0 |
0 |
-4778 |
-4895 |
117 |
10. |
Other items not elsewhere classified |
0 |
0 |
0 |
0 |
98493 |
-43758 |
142250 |
TOTAL |
102111 |
148180 |
183424 |
597889 |
1540452 |
1789586 |
-249134 |
Statement 8: Financial Flows - Instrument-wise 2006-07 |
(Rs. crore) |
Instrument/Sector |
Banking |
Other Financial Institutions |
Private Corporate Business |
Government* |
Sources |
Uses |
Sources |
Uses |
Sources |
Uses |
Sources |
Uses |
1 |
2 |
3 |
4 |
5 |
6 |
7 |
8 |
9 |
1. |
Currency & Deposits |
556738 |
1371 |
23197 |
20132 |
-2066 |
154475 |
3928 |
53433 |
2. |
Investments |
9850 |
172461 |
-15747 |
323414 |
108479 |
74158 |
111635 |
10180 |
|
a. |
Central and State Governments’ Securities |
0 |
62943 |
0 |
215625 |
0 |
-1056 |
110359 |
0 |
|
b. |
Other government Securities |
0 |
-2580 |
0 |
22261 |
0 |
0 |
1277 |
0 |
|
c. |
Corporate Securities |
0 |
-2357 |
0 |
28299 |
108479 |
0 |
0 |
62 |
|
d. |
Bank securities |
9850 |
0 |
0 |
22066 |
0 |
113 |
0 |
-4683 |
|
e. |
Other Financial Institutions Securities |
0 |
-1638 |
-15747 |
0 |
0 |
54963 |
0 |
-637 |
|
|
of which: |
|
|
|
|
|
|
|
|
|
|
(i) Mutual Funds
(including Units of UTI) |
0 |
0 |
-16242 |
0 |
0 |
0 |
0 |
0 |
|
f. |
Foreign Securities |
0 |
119323 |
0 |
-46 |
0 |
13871 |
0 |
0 |
|
g. |
Others |
0 |
-3230 |
0 |
35209 |
0 |
6268 |
0 |
15438 |
3. |
Loans and Advances |
12668 |
364288 |
23725 |
124918 |
419437 |
157345 |
14992 |
23936 |
4. |
Small Savings |
0 |
0 |
0 |
0 |
0 |
0 |
17544 |
0 |
5. |
Life Fund |
0 |
0 |
108188 |
0 |
0 |
0 |
3886 |
0 |
6. |
Provident Fund |
0 |
0 |
72106 |
0 |
0 |
0 |
32452 |
0 |
7. |
Compulsory Deposits |
0 |
0 |
0 |
0 |
0 |
0 |
0 |
0 |
8. |
Trade Debt /Credit |
0 |
0 |
105 |
0 |
6418 |
0 |
15159 |
1934 |
9. |
Foreign claims not elsewhere classified |
-568 |
-568 |
0 |
0 |
0 |
0 |
0 |
-590 |
10. |
Other items not elsewhere classified |
19579 |
-7021 |
2458 |
19424 |
145712 |
196 |
2354 |
361 |
TOTAL |
598267 |
530530 |
214032 |
487887 |
677979 |
386174 |
201949 |
89253 |
* : Excludes Local Authorities except Port Trusts. |
Statement 8: Financial Flows - Instrument-wise 2006-07 (Concld.) |
(Rs. crore) |
Instrument/Sector |
Rest of the World |
Households |
Total |
Discrepancy |
Sources |
Uses |
Sources |
Uses |
Sources |
Uses |
(Sources -Uses) |
1 |
10 |
11 |
12 |
13 |
14 |
15 |
16 |
1. |
Currency & Deposits |
15754 |
24231 |
0 |
379136 |
597551 |
632777 |
-35226 |
2. |
Investments |
231125 |
134282 |
0 |
60269 |
445342 |
774763 |
-329421 |
|
a. |
Central and State Governments’ Securities |
0 |
0 |
0 |
102 |
110359 |
277613 |
-167255 |
|
b. |
Other government Securities |
0 |
0 |
0 |
1807 |
1277 |
21488 |
-20211 |
|
c. |
Corporate Securities |
0 |
134282 |
0 |
18146 |
108479 |
178432 |
-69953 |
|
d. |
Bank securities |
0 |
0 |
0 |
206 |
9850 |
17702 |
-7852 |
|
e. |
Other Financial Institutions Securities |
0 |
0 |
0 |
40008 |
-15747 |
92696 |
-108443 |
|
|
of which: |
|
|
|
|
|
|
|
|
|
(i) Mutual Funds
(including Units of UTI) |
0 |
0 |
0 |
34399 |
-16242 |
34399 |
-50641 |
|
f. |
Foreign Securities |
231125 |
0 |
0 |
0 |
231125 |
133148 |
97977 |
|
g. |
Others |
0 |
0 |
0 |
0 |
0 |
53685 |
-53685 |
3. |
Loans and Advances |
1578 |
112012 |
176787 |
0 |
649187 |
782498 |
-133311 |
4. |
Small Savings |
0 |
0 |
0 |
17544 |
17544 |
17544 |
0 |
5. |
Life Fund |
0 |
262 |
0 |
114851 |
112075 |
115113 |
-3038 |
6. |
Provident Fund |
0 |
0 |
0 |
72106 |
104558 |
72106 |
32452 |
7. |
Compulsory Deposits |
0 |
0 |
0 |
0 |
0 |
0 |
0 |
8. |
Trade Debt /Credit |
0 |
0 |
0 |
6523 |
21682 |
8457 |
13225 |
9. |
Foreign claims not elsewhere classified |
-18696 |
-987 |
0 |
0 |
-19264 |
-2145 |
-17118 |
10. |
Other items not elsewhere classified |
0 |
0 |
0 |
0 |
170102 |
12960 |
157142 |
TOTAL |
229761 |
269800 |
176787 |
650429 |
2098776 |
2414073 |
-315297 |
Statement 8: Financial Flows - Instrument-wise 2007-08 |
(Rs. crore) |
Instrument/Sector |
Banking |
Other Financial Institutions |
Private Corporate Business |
Government* |
Sources |
Uses |
Sources |
Uses |
Sources |
Uses |
Sources |
Uses |
1 |
2 |
3 |
4 |
5 |
6 |
7 |
8 |
9 |
1. |
Currency & Deposits |
731686 |
1077 |
15262 |
31719 |
86 |
68740 |
9535 |
11162 |
2. |
Investments |
18673 |
541174 |
202467 |
290274 |
169745 |
157912 |
178911 |
-3743 |
|
a. |
Central and State Governments’ Securities |
0 |
181835 |
0 |
264759 |
0 |
2549 |
193990 |
0 |
|
b. |
Other government Securities |
0 |
1525 |
0 |
-22041 |
0 |
0 |
-15079 |
0 |
|
c. |
Corporate Securities |
0 |
1685 |
0 |
28725 |
169745 |
0 |
0 |
73 |
|
d. |
Bank securities |
18673 |
0 |
0 |
-36562 |
0 |
106 |
0 |
4410 |
|
e. |
Other Financial Institutions Securities |
0 |
988 |
202467 |
0 |
0 |
85681 |
0 |
-247 |
|
|
of which: |
|
|
|
|
|
|
|
|
|
|
(i) Mutual Funds
(including Units of UTI) |
0 |
0 |
199653 |
0 |
0 |
0 |
0 |
0 |
|
f. |
Foreign Securities |
0 |
355024 |
0 |
-36 |
0 |
51740 |
0 |
0 |
|
g. |
Others |
0 |
118 |
0 |
55428 |
0 |
17835 |
0 |
-7979 |
3. |
Loans and Advances |
36935 |
449058 |
41464 |
117894 |
530834 |
299854 |
-45210 |
-49914 |
4. |
Small Savings |
0 |
0 |
0 |
0 |
0 |
0 |
-13601 |
0 |
5. |
Life Fund |
0 |
0 |
121053 |
0 |
0 |
0 |
4508 |
0 |
6. |
Provident Fund |
0 |
0 |
70879 |
0 |
0 |
0 |
27188 |
0 |
7. |
Compulsory Deposits |
0 |
0 |
0 |
0 |
0 |
0 |
0 |
0 |
8. |
Trade Debt /Credit |
0 |
0 |
118 |
0 |
9227 |
0 |
27577 |
105757 |
9. |
Foreign claims not elsewhere classified |
1326 |
1326 |
0 |
0 |
0 |
0 |
0 |
1582 |
10. |
Other items not elsewhere classified |
41856 |
134636 |
4364 |
-10243 |
177102 |
449 |
3473 |
7854 |
TOTAL |
830477 |
1127272 |
455605 |
429643 |
886994 |
526954 |
192381 |
72698 |
* : Excludes Local Authorities except Port Trusts. |
Statement 8: Financial Flows - Instrument-wise 2007-08 (Concld.) |
(Rs. crore) |
Instrument/Sector |
Rest of the World |
Households |
Total |
Discrepancy |
Sources |
Uses |
Sources |
Uses |
Sources |
Uses |
(Sources -Uses) |
1 |
10 |
11 |
12 |
13 |
14 |
15 |
16 |
1. |
Currency & Deposits |
-27632 |
19516 |
0 |
446022 |
728936 |
578235 |
150701 |
2. |
Investments |
444683 |
255782 |
0 |
74675 |
1014479 |
1316074 |
-301595 |
|
a. |
Central and State Governments’ Securities |
0 |
0 |
0 |
232 |
193990 |
449374 |
-255385 |
|
b. |
Other government Securities |
0 |
0 |
0 |
-14535 |
-15079 |
-35051 |
19972 |
|
c. |
Corporate Securities |
0 |
255782 |
0 |
25088 |
169745 |
311352 |
-141607 |
|
d. |
Bank securities |
0 |
0 |
0 |
766 |
18673 |
-31279 |
49953 |
|
e. |
Other Financial Institutions Securities |
0 |
0 |
0 |
63125 |
202467 |
149548 |
52919 |
|
|
of which: |
|
|
|
|
|
|
|
|
|
(i) Mutual Funds
(including Units of UTI) |
0 |
0 |
0 |
56475 |
199653 |
56475 |
143179 |
|
f. |
Foreign Securities |
444683 |
0 |
0 |
0 |
444683 |
406727 |
37956 |
|
g. |
Others |
0 |
0 |
0 |
0 |
0 |
65402 |
-65402 |
3. |
Loans and Advances |
146 |
168669 |
173136 |
0 |
737305 |
985561 |
-248256 |
4. |
Small Savings |
0 |
0 |
0 |
-13601 |
-13601 |
-13601 |
0 |
5. |
Life Fund |
0 |
277 |
0 |
128930 |
125561 |
129207 |
-3646 |
6. |
Provident Fund |
0 |
0 |
0 |
70879 |
98067 |
70879 |
27188 |
7. |
Compulsory Deposits |
0 |
0 |
0 |
0 |
0 |
0 |
0 |
8. |
Trade Debt /Credit |
0 |
0 |
0 |
9345 |
36922 |
115102 |
-78180 |
9. |
Foreign claims not elsewhere classified |
-37802 |
-765 |
0 |
0 |
-36476 |
2144 |
-38619 |
10. |
Other items not elsewhere classified |
0 |
0 |
0 |
0 |
226794 |
132697 |
94098 |
TOTAL |
379395 |
443479 |
173136 |
716250 |
2917987 |
3316297 |
-398309 |
Annex I
A Brief on Coverage and Data Sources Sectoral Classification
1. Banking Sector
The Banking sector comprises (i) RBI (ii) commercial banks (iii) cooperative banks and credit societies. The accounts of sub-sectors under this sector are prepared independently on the basis of their balance sheets. The balance sheet data pertain to March 31 for RBI and cooperative banks as also co-operative credit societies and last reporting Friday of March for commercial banks. The data for RBI is used from RBI Bulletin. The data for Commercial Banks is drawn from special returns obtained under Section (42) of the RBI Act, 1934. In order to get some more detailed information, data provided in Form X are also used. Co-operative banks and societies comprise nine types of banks and credit societies. The data for these cooperative banks and credit societies up to 2002-03 are compiled from the Statistical Statements Relating to Cooperative Movement in India. Subsequent data up to 2006-07 for State and Central Co-operative Banks and Primary Agricultural Credit Societies have been separately collected from NABARD. Select data on Central and State Co-operative Banks for 2007-08 was collected from RBI. Remaining segments of the Co-operative Sector for the period 2003-04 onwards have been estimated.
2. Other Financial Institutions (OFI)
This sector covers non-banking financial institutions of public and private sectors, which are grouped in (i) financial corporations and companies (financial institutions);(ii) insurance companies; (iii) mutual funds; (iv) State Finance Corporations and State Industrial Development Corporations. The data pertaining to this sector are collected from assets and liabilities as available from their Annual Reports. In the instrument-wise classification, this sector provides the information about investment and borrowing from this sector. This sector provides the information of bond and debentures and reflects claims of other sectors on OFIs. Important items of this sector are the life funds and the provident funds. Items covered under the former head are life insurance fund of Life Insurance Corporation of India (LIC), postal insurance fund of central government and state governments’ insurance fund.
3. Government Sector
The Sector comprises (i) central government and its departmental commercial undertakings; (ii) State Governments; (iii) local authorities (Port trust); and (iv) Government non-department non-financial undertakings including State Electricity Boards. The sources of data for the Government sector are Annual Financial Accounts, economic and functional classification and annual reports of state electricity boards and port trusts.
4. Private Corporate Business Sector
The private corporate business sector comprises private non-financial companies and cooperative non-credit societies. The data for the private non-financial companies are used from the studies conducted by RBI. These studies provide detailed information about assets and liabilities of the select companies. The data for the cooperative non-credit societies are collected from the Statistical Statements Relating to Cooperative Movement in India (NABARD) till 2002-03. This source provides detailed information about non-credit cooperative societies such as Sugar factory societies, marketing societies, etc. Data for subsequent years have been culled out from the information available from other sectors.
5. Rest of the World
The domestic sectors (banking, OFI, PCB, government and household sectors) have transactions with non-resident entities including foreign governments and various international agencies and institutions like IMF, IBRD, ADB, etc. The accounts of ROW are compiled on the basis of balance of payments estimates (BOP). The RBI publishes statistics of BOP classified into capital account and current account. The capital account records the transactions of domestic sector with foreign entities, through transfer of money and other capital items leading to change in the country’s foreign assets and liabilities as a result of transaction recorded in the current account. In order to compile the accounts of ROW sector, the capital account transactions are broadly grouped into three sectors (i) private capital (ii) banking capital (iii) others.
6. Household Sector
The Household sector is the residual sector which comprises all individuals, nongovernment non-corporate enterprises of farm business and non-farm business like, sole proprietorships and partnerships Instruments Financial assets and liabilities are classified under ten major categories of investments: currency, deposits, investments, loans and advances, small savings, life funds, provident funds, trade debts, foreign claims not elsewhere classified (NEC) and other claims NEC.
Annex II
Estimation Methodology for Abridging Data Gaps |
Sector |
Data Gap and Estimations |
Banking Sector |
Out of 9 sub segments of cooperative sector, data for State and Central Co-operative Banks and Primary Agricultural Credit Societies was collected upto 2006-07 from NABARD and for remaining categories, data for the period 2003-04 onwards have been estimated by using the trend in state cooperative banks. For the year 2007-08, average growth rates for past three years have been used. |
Other Financial Institutions |
In order to capture all the public and private companies, the data has been blown up from the total liabilities of insurance sector as available from the Handbook of Statistics of Insurance Regulatory and Development Authority (IRDA).
Similarly for Mutual Fund sector, the total Assets under Management have been used to blow up the estimates of mutual fund sector. |
Private Corporate Business Sector |
Since private corporate sector studies conducted by DSIM are based on sample, data are blown up by the global Paid up capital to get the population estimates. In case of cooperative non-credit societies, the data beyond 2002-03 have been collected from the worksheet of other sectors providing information on cooperative non-credit societies. |
Government Sector |
The data gap in the Government sector appears from the port trust and state electricity board data. The Paradip port trust data have been estimated for all the years using past trends. |
Annex III
Recommendations of High Level Committee on Savings and Investment (HLC)
Pertaining to Flow Fund Accounts |
Major Recommendations |
Nodal Agency |
Status |
The HLC recommends that the flow-of-funds accounts of the Indian economy need to be compiled regularly and in a more up-to-date manner. There is a need to closely examine the current data gaps and constraints coming in the way of compiling the flow-of-funds accounts regularly |
RBI |
Publication of
the current article would reduce the lag |
Cooperative sector data: All efforts should be undertaken to improve the time gap in the publication ‘Statistical Statements Relating to the Co-operative Movement in India (Credit and Non-credit societies)’, a process that is said to be underway at the NABARD. |
NABARD |
Pending |
Treatment of non-banking companies: Since there exists large data gap in the estimation of non-banking companies, because of non-inclusion of a wide array of unregistered companies, the HLC recommends that a census should collect data on assets, liabilities, income and expenditure of NBFCs including the unregistered/exempted category of NBFCs. The census should be conducted by DSIM, RBI in collaboration with the Department of Company Affairs (DCA), Government of India. |
DCA and RBI |
Pending |
| The HLC recommends that the data emerging from the census on the assets/liabilities position of the NBFCs should be appropriately incorporated in the flow-of-funds accounts also. |
RBI
|
Pending
|
Consolidated data on the insurance sector: The RBI may approach the IRDA to provide combined balance sheet for all insurance institutions – public and private - as per the flow-of-funds format. This will go a long way in the IRDA providing an alternative database not only for ‘life fund’ but also for flow-of-funds compilation at the RBI from time to time. |
IRDA |
Pending |
Consolidated data for capital market institutions: The SEBI may collect the consolidated balance sheet position for all registrars and broker houses and provide the data to the RBI as per the flow-of-funds format to be forwarded by the RBI, so that the same can be incorporated in the FoF accounts |
SEBI |
Pending |
Annex III
Recommendations of High Level Committee on Savings and Investment (HLC)
Pertaining to Flow Fund Accounts (Concld.) |
Major Recommendations |
Nodal Agency |
Status |
Ownership of Government securities: The HLC recommends that an appropriate format as prescribed in this Report on the ownership pattern of Government securities (consolidated for all levels of Government), comprising six categories, viz., 1) Government, 2) Banks, 3) Financial Sector other than Banks, 4) Non-Service Sector (Corporates, Firms and Societies), 5) External Sector and 6) Household Sector, may be prepared by the RBI to provide the data based on the revised format as at end-March every year, so that the residual status can be accorded to household (as defined in national accounts and FoF framework) in this instrument. The concerned Department within the RBI should ensure the providing of such information for estimation of household financial savings estimates. |
RBI |
Pending |
In respect of the accounts of local authorities, only the data for port trusts are available. In this regard, the data for the local self Government may also be provided to enhance the coverage of flow-of- funds accounts. |
CSO |
Pending |
* The ‘flow of funds accounts’ of the Indian economy for the period 1951-52 to 1995-96 was published as a monograph titled ‘Flow of Funds Accounts of the Indian Economy: 1951-52 to 1995-96’ in August 2000, which can be downloaded from RBI website (http://rbi.org.in). The detailed flow of funds appeared for the period 1990-91 to 1993-94 in Reserve Bank of India (RBI) Bulletin, January 1998. The last ‘flow of funds accounts’ was published for the period of 1994-95 to 2000-01 in September 2007 issue of the RBI Bulletin. The present article extends the flow of fund time series further covering the period 2001-02 to 2007-08. 1 Other liabilities of corporate sector include: acceptances, liabilities to companies, advance deposits from customers, agents, etc., interest accrued on loans and others. |