 IST,
IST,


Household Inflation Expectations in India: Emerging Trends, Determinants and Impact of Monetary Policy
|
by Ankit Ruhi^, Kanupriya Sharma and Subhadhra Sankaran^^ Inflation expectations of households experienced a considerable uptick following the COVID-19 pandemic, geopolitical tensions and consequential economic uncertainty amidst supply chain disruptions and inflationary pressures. Against this backdrop, this article examines emerging trends in household inflation expectations, their underlying determinants and the impact of monetary policy interventions. Findings reveal that improved domestic economic conditions, coupled with policy actions, have helped household inflation expectations ebb from the highs witnessed around the pandemic. Past inflation perceptions generally tend to keep the household expectations sticky. However, influence of realised inflation dynamics increases when adjusted for extreme values. Headline inflation is more influential than food inflation, but high and broad-based food inflation may keep overall expectations elevated, underscoring the importance of policy emphasis on headline inflation. Introduction Inflation expectations significantly influence economic behaviour and macroeconomic outcomes. They shape individual decisions about consumption, saving, and investment, directly impacting aggregate demand. Businesses use these expectations to set prices and negotiate wages. Therefore, central banks prioritise managing inflation expectations to maintain price stability, especially in the inflation targeting (IT) framework. Household inflation expectations are particularly important because households represent the largest and most diverse economic group, directly driving consumption. Unlike professional forecasters, households’ expectations are often shaped by personal experiences and are susceptible to fluctuations. Although household inflation expectations have generally moderated in countries with the adoption of IT, the COVID-19 pandemic introduced substantial uncertainty with supply chain disruptions and labour market shocks, thereby widening the gap between households and professional inflation expectations. Given these recent developments, re-examining emerging trends in household expectations and their determinants is crucial for effective policy intervention. This study uses unit level data on 1-year ahead median inflation expectations from the Reserve Bank’s Inflation Expectations Survey of Households (IESH), to understand their dynamics post pandemic, key determinants and effectiveness of monetary policy in anchoring these expectations, particularly under the flexible inflation targeting (FIT) regime. Findings reveal a decline in inflation expectations from the highs of 2014, aided by the transition to the FIT regime, easing of global inflationary pressures, and timely domestic policy interventions. This is corroborated by a leftward shift in the distribution of median household inflation expectation (denoting a fall in median expectations over the years), and reduced disagreement among households (as seen from lower standard deviations). However, the pandemic reversed this trend, heightening overall inflationary concerns, and widening the disagreement across groups. Adjusting for extreme values, we observe that realised inflation dynamics generally exerts a stronger influence, with broad-based food price inflation playing larger role during high inflation episodes. This suggests that our approach in handling extreme-value adjustments furthers the understanding and responsiveness of expectations to current economic conditions. The rest of the paper is structured as follows: Section II reviews the related literature. Section III outlines the IESH data and adjustments for extreme value observations. Section IV presents stylised facts from unit-level observations in the IESH. Section V discusses the empirical methodology and results. Section VI concludes. Various theories have explored the role of inflation expectations in shaping actual inflation dynamics and the overall macroeconomy ranging from adaptive (Friedman, 1968) to rational1 (Muth, 1961; Lucas, 1973). Variants of rational expectations theory consider potential information frictions and bounded rationality in expectations.2 More recently, behavioural models emphasise the role of personal experiences and noticeable price changes. Survey-based measures of household and business inflation expectations offer valuable insights into diverse expectations, addressing the limitations of full-information rational expectations (FIRE) that fail to account for the heterogeneity in agents’ expectation formation and revisions (Sheffrin, 1996; Mankiw et al., 2004; Coibion et al., 2018; D’Acunto et al., 2024). Recent literature outlines the following key determinants of inflation expectations. A. Behavioural factors: Household inflation expectations are influenced by perceived economic environment (Jonung, 1981; Cavallo et al., 2017; Coibion et al., 2020), with individuals relying on lifetime experiences that may introduce biases due to rational inattention and cognitive biases (Lucas 1972, 1973; D’Acunto et al., 2021, 2023). Simple decision-making rules stemming from habit formation may distort expectations causing households to overreact or underreact to new information (Schafer, 2022). B. Observed price changes: Households use changes in the prices of frequently purchased goods, particularly essentials like food and energy items, to gauge overall inflation (Kumar et al., 2015; D’Acunto et al., 2021, 2024; Weber et al., 2022; Patzelt and Reis, 2024). Households perceive price increases as more lasting than declines (Eichenbaum et al., 2011). C. Social influences: Herd behaviour, media exposure and professional forecasts can influence expectations. While the impact of media is limited, households often trust personal family and social networks more than traditional news sources (Caroll, 2003; Binder, 2017; Coibion et al., 2020, 2022; Weber et al., 2022, Bailey et al., 2018). D. Individual characteristics: Older individuals with longer lifetime experiences of inflation and those with higher economic literacy and income levels tend to have more informed inflation expectations (Aguiar and Hurst, 2005; Malmendier and Nagel, 2016; Coibion et al., 2018, 2020; D’Acunto et al., 2021, 2023, 2024). E. Monetary policy: Monetary policy actions and central bank communication can shape inflation expectations by reducing the persistence of inflation shocks (Mishkin, 2007; Bernanke, 2007; D’Acunto et al., 2024). Effective communication, like forward guidance, can help in managing public expectations (Mehra and Reilly, 2008; D’Acunto et al., 2021).3 F. Domestic and global influences: Domestic geographic location can shape inflation expectations, with individuals in the same area often experiencing similar price changes and economic conditions (Stroebel and Vavra, 2019). Domestic factors like growth in gross domestic product (GDP), unemployment rates, supply shocks, and monetary policy credibility; as well as global factors like commodity price inflation, volatility in exchange rates financial markets also affect expectations. These factors have a greater impact in emerging markets compared to advanced economies (Kose et al., 2019; Moessner, 2021). Nevertheless, while short-term inflation expectations do vary with business cycles and macroeconomic shocks, long-term expectations remain anchored as long as they are not significantly influenced by fluctuations in short-term expectations (Posen, 2011). Inflation expectations in India are influenced by both domestic factors like GDP growth, actual inflation (headline and core), food and oil prices, monetary policy and fiscal policy; and global factors like international oil prices, exchange rate fluctuations, policy uncertainty and financial market volatility.4 Food price shocks, aggregate demand conditions, monetary policy actions, and global shocks significantly shape household expectations, while the impact of oil price shocks is mixed (Pattanaik et al., 2020). The Reserve Bank’s communication and adoption of the FIT regime have helped manage inflation expectations (Goyal and Parab, 2019; Asnani et al., 2019; Pattanaik et al., 2023; Eichengreen and Gupta, 2024). However, only a few studies have explored issues related to bias adjustment in survey-based expectations (Das et al., 2019; Pattanaik et al., 2023).5 Studies on household inflation expectations in India have mostly focussed on (i) aggregate-level pre-pandemic data; (ii) other inflation measures, such as the Wholesale Price Index (WPI) or Consumer Price Index for Industrial Workers (CPI-IW); and (iii) households’ current perceptions of inflation. These limit insights into the near-term household expectations and influence of monetary policy. To address these gaps, this article analyses 1-year ahead median inflation expectations during September 2009 to March 2025 using unit level data from the IESH. The study also proposes alternate ways to adjust for extreme values in the survey-data, rather than the present practice of bunching all high values over 16 per cent to prevent distorting the true distribution of responses. Factors influencing household inflation expectations are also analysed, using both the aggregate series (“reported”) and the adjusted aggregate series (“exclusion”; “trimmed”) calculated from unit-level inflation expectations. III. Inflation Expectations Survey of Households (IESH): Details The IESH survey covers about 6,000 households across 19 cities, and is being conducted bi-monthly since 2016 (quarterly prior to that).6 Respondents aged 21+ answer both qualitative and quantitative questions regarding expected inflation in various categories for the current month, next three months, and next 12 months.7 They choose from expected inflation rates ranging from “0-1 per cent” to “15-16 per cent” – in increments of 100 basis points; “greater than (or equal to) 16 per cent” or “No Idea”. Adjustment for Extreme Values The IESH reported series considers all values exceeding 16 per cent as 16.5 per cent leading to the median inflation expectation distribution to be bounded between 0.5 per cent and 16.5 per cent, potentially limiting information from higher values.8 We propose two alternative methods: exclusion and trimming. 1. The “Exclusion” series removes respondents reporting inflation expectations below 1 per cent, above 16 per cent, or “No idea”. 2. The “Trimmed” series excludes responses below 1 per cent and “No idea”; and removes only the top 20 per cent of high expectation values, thereby retaining more of the true values reported by agents (even those above 16 per cent). Both methods result in median expectations higher than actual inflation but lower than the aggregate reported series (Chart 1; Annex A). We focus on 1-year ahead inflation expectations in the reminder of the article.9 The IESH unit-level data analysis inter alia establishes the following ten facts. 1. Persistent systematic upward bias in household expectations Indian household inflation expectations have consistently exceeded professional forecasters for nearly two decades, notwithstanding stable inflation periods between 2014-15 and 2019-20 (Chart 2a).10 However, expectations shifted downwards in line with global inflation and benefitting from the transition to the FIT regime11, and proactive fiscal measures to address supply side constraints. More recently, in 2024-25:H2, as headline inflation eased, forecasts of both professionals and households show moderation. However, household expectations adjusted at a slower pace.   2. Inflation expectations rise with the forecast horizon, align with high inflation Inflation expectations increase with the forecast horizons (Chart 2b). Nonetheless, expectations across the horizon have seen a downward shift since 2014-15 with the announcement of the glide-path and easing inflation levels. The wedge between 3-month and 1-year expectations has also considerably narrowed, notwithstanding the increase since 2023-24. 3. Higher expectations in headline, food and housing Since 2022, more broad-based inflation concerns were expressed by households, particularly in headline, food, and housing (Chart 3).  4. Headline matters more than food inflation; but broad-based food inflation keeps expectations elevated Inflation expectations move more closely with headline rather than food inflation (Chart 4a). During high inflation periods, when food inflation is not a major contributor (between June 2017 to June 2018 in Chart 4b), it can help limit the spike in overall inflation expectations. Conversely, during periods of low headline inflation, higher food inflation can hinder easing of expectations (during 2022-23: Q4 and 2023-24: Q2 in Chart 4b). Conforming to their global counterparts, during periods of high inflation, Indian households focus on volatility rather than merely increase in food prices (Charts 4c and 4d) [Coibion and Gorodnichenko, 2015; Coibion et al., 2018]. In recent times, as inflationary concerns have moderated since the pandemic, expectations are gradually moderating, albeit, remaining above the pre-pandemic levels. 5. Multimodal distribution with expectations rounded to multiples of five The distribution of median inflation expectations consistently exhibits multiple modes, with many respondents rounding off their expectations between 5 and 10 per cent, in line with global behaviour (Binder, 2015; Reiche and Meyler, 2022; Haidari and Nolan, 2022) [Chart 5]. Since the introduction of the FIT regime, expectations have generally shifted down. Pandemic and the Russia-Ukraine War induced disturbances, and resultant uptick in the expectations, have been gradually moderating as observed from lower peaks in the distributions (right tail) after 2022.  6. Leftward shift in distribution post-FIT Since the transition to the FIT regime, more households report values below 16 per cent, which has led to a corresponding leftward shift of the distribution (Chart 5 and Chart 6). However, shocks since the pandemic and escalated geopolitical tensions shifted the distributions more to the right. Nevertheless, the distributions are gradually moving back to left since 2023-24. 7. Reduced uncertainty in FIT regime The share of responses in ‘>=16 per cent’ and ‘No Idea’ categories are lower during the FIT regime, indicating lower uncertainty among households (Chart 6). However, the pandemic and ensuing higher inflationary pressures led to an increase in the share of higher value response. Since 2021-22, with largely easing inflation, this share has moderated.  8. Improved anchoring of city-wise expectations in FIT regime City-wise household expectations show a marked decline under the FIT regime, suggesting a broader anchoring of expectations (Chart 7a). Since the onset of the COVID-19 pandemic, expectations have increased compared to the pre-pandemic levels (Chart 7b). Nevertheless, the consistently lower expectations during the FIT regime suggest a perceived credibility in the framework. 9. Indian women do not show consistent upward bias; higher expectations from older, and variable income households Generally, women consistently exhibit higher inflation expectations influenced by frequent shopping exposure (Jonung, 1981; Bryan and Venkatu, 2001; Coibion et al., 2020; D’Acunto et al., 2024). Indian household inflation expectations, however, do not reflect this sustained upward bias for women (Chart 8a). Older individuals (45 and above) report higher expectations largely reflecting their lifetime experiences (Chart 8b).   Daily wage earners express relatively greater inflation concerns in the pre-pandemic period than salaried employees, likely influenced by fixed budget and variable income constraints (Chart 8c). While post pandemic inflationary pressures led to higher overall expectations, younger individuals, homemakers and salaried professionals seem to have better anchored expectations.  10. Disagreement in inflation expectations widens post pandemic Disagreement in inflation expectations reflects the uncertainty and volatility in responses, particularly during inflationary shocks (Coibion and Gorodnichenko, 2012).12 The falling disagreement since the transition to the FIT regime was reversed with the rising inflation since 2018-19, followed by the pandemic pressures (Chart 9). At the aggregate level, exclusion and trimmed inflation expectations show lower disagreement levels than the reported expectations. Across cohorts, generally, male respondents, older individuals (45+; retirees) and households with variable incomes (daily workers, self-employed) exhibit higher disagreement.  V. Factors influencing household inflation expectations in India: Empirical Results An important question for policy makers is: what are the main factors influencing household inflation expectations in India? To explore this, we look at 1-year ahead inflation expectations from the IESH along with its possible explanatory variables. As discussed in Sections II to IV, not only key macroeconomic variables, but also the persistence and volatility of food prices are likely to influence households’ short-term inflation expectations (up to 1 year). Our sample combines the median short-term inflation expectations from the IESH with quarterly macroeconomic variables and variants of their moments. The data is quarterly, spanning from 2009-10:Q2 to 2024-25:Q4. To ensure robustness and capture a broader range of respondents’ perspectives, we use inflation expectations from (i) the reported IESH series, (ii) a series that excludes extreme values (particularly those exceeding 16 percent) [Exclusion series], and (iii) a series with the top 20th percentile trimmed (Trimmed series).13 V.1. Specification The benchmark model, estimated using Generalised Method of Moments (GMM)14, is of the following form. For a given time t, 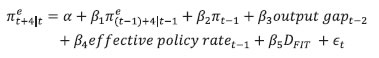 where, 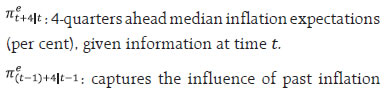 expectations; πt-1: headline CPI-C inflation [year-on-year (y-o-y) per cent] to assess the influence of recent inflation dynamics; output gapt-2: captures aggregate economic conditions;15 effective policy ratet-1 : weighted average call rate (WACR)16 net of headline CPI-C inflation; DFIT: dummy variable takes a value 1 for the FIT regime since 2014-15: Q1, and 0 otherwise17; and εt: is the error term. 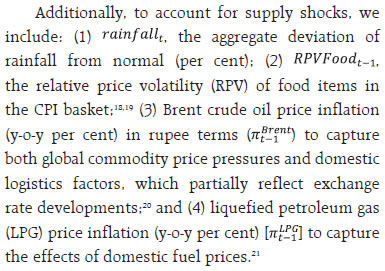 For demand-side influences, we use growth in personal loans22 (loant) and alternatively, spread between the weighted average lending rate (WALR) on fresh rupee loans and the WACR (spreadt), indicating credit availability and cost of borrowed funds, respectively. These variables are combined to complement our benchmark models and facilitate robustness checks.23 Data sources include RBI; MoSPI; CEIC; Indian Oil Corporation Ltd. (IOCL); and U.S. Energy Information Administration (EIA).24 V.2. Results The following section discusses the results based on a combination of models on Reported, Exclusion and Trimmed series of expectations (Tables 1-2, Annex C). Exclusion and Trimmed series are also referred to as adjusted series. 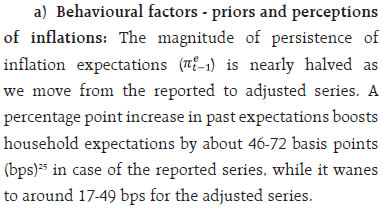 b) Past inflation dynamics: rational inattention? A percentage point increase in past inflation drives adjusted inflation expectations by up to 11-39 bps. By adjusting for extreme values, we find that influence of realised inflation dynamics increases, while that of past inflation expectations generally decreases. c) Domestic economic conditions: The output gap has a positive impact on adjusted inflation expectations, suggesting that households revise their inflation expectations upward as the economy’s aggregate demand conditions improve. The reported series caps all higher expectations at 16.5 per cent, likely limiting the ability of macroeconomic determinants to influence inflation expectations. 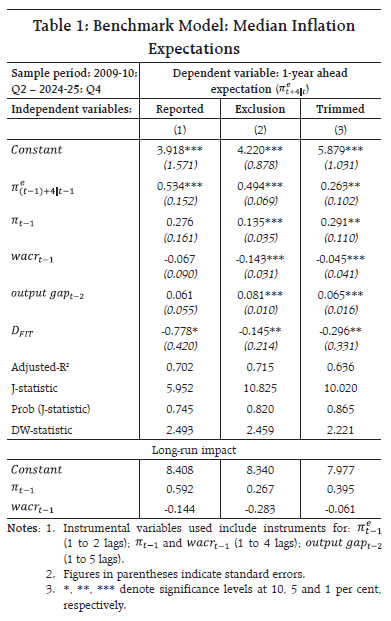 d) Monetary policy actions, communications and framework: The effective policy rate has a significant negative impact on adjusted inflation expectations. Further, transition to the FIT regime has generally led to lower inflation expectations, ranging from 0.15 to 2.5 percentage points decline, suggestive of better anchoring of expectations by monetary policy. However, this period also witnessed timely fiscal measures like export bans by the government, and largely lower global inflationary pressures during 2014-20, even though households may have limited awareness of specific policy measures.26 e) Supply shocks: Both abnormal rainfall and higher volatility of food prices tend to independently elevate household inflation expectations in some of the models. But their combined occurrence affects these expectations significantly in all cases, albeit with a small positive magnitude (Table 2). This suggests that while food volatility itself may not be a major concern, it can significantly impact inflation expectations during excess rainfall periods or vice versa.27, 28 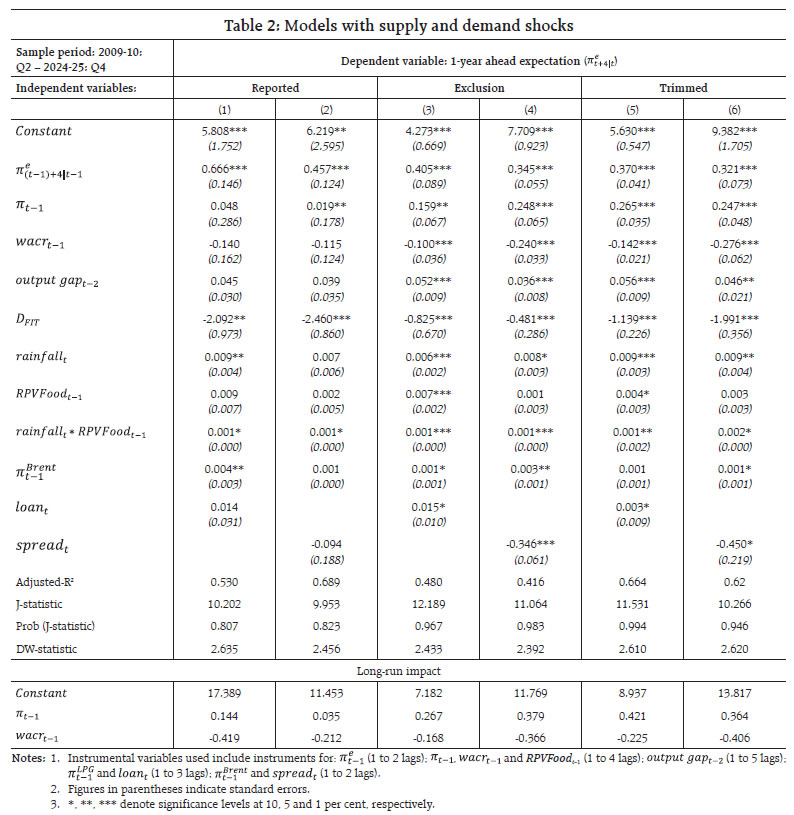 In line with the stylised facts 3 and 4, and given the significant weight of food in the CPI basket (45.86 per cent), the RBI should continue to consider food price dynamics in its monetary policy to balance social welfare and economic objectives.29 Oil prices generally have small significant positive effect, suggesting sensitivity of expectations to oil price changes (Table 2; Annex C). f) Demand shocks: Do easier access to credit or lower loan interest rates influence expectations? We find that personal loan growth generally has a positive and significant effect on adjusted inflation expectations (Table 2). The spread between WALR and WACR has a negative effect on adjusted expectations, indicating households associate higher credit costs with weaker demand and lower future inflation. g) Long-run impact: Both past realised inflation and policy rate exert stronger long-term influence on household inflation expectations. While households may rely on personal perceptions and economic conditions in the short term, they give greater weight to inflation history (life experiences) and monetary policy in the long-term, highlighting the critical role of monetary policy in anchoring inflation expectations. This study analyses Indian household inflation expectations, revealing that they remain elevated compared to those of professionals, even during periods of price stability. Demographic factors such as gender, age, and professional background play significant roles. Notably, men, older individuals (45 and above), self-employed and daily workers, who often operate on variable incomes, exhibit higher inflation expectations. In contrast, younger and salaried individuals show less disagreement and are more attuned to realised inflation dynamics, likely reflecting their exposure to financial and social network. Transition to the FIT regime, along with timely fiscal interventions such as export bans and lower import duties, and moderating inflation levels have contributed to decline in both the levels of expectations and disagreement across responses. However, supply shocks and global inflation shocks induced by the pandemic and geopolitical tensions have elevated the inflation expectations, particularly across headline, food and housing categories. High food inflation during periods of high inflation may keep the expectations elevated, even as headline matters more for inflation expectations. Nonetheless, most recently, as inflation has been showing signs of easing, expectations of households have also come down. Empirically, macroeconomic shocks, especially volatility of food price, play a prominent role in influencing short-term (up to 1-year ahead) household expectations, especially during adverse weather conditons. Consistent with global findings, these results emphasise the importance of targeting headline inflation to effectively manage expectations and improve social welfare.30 Nevertheless, the impact of monetary policy is significant even when we include higher values of expectations in trimmed series. The transition to the FIT regime has aided in anchoring inflation expectations. Given the evidence of non-rationality and heterogeneity across different groups of households – each reflecting their systematic biases – the role of monetary policy becomes critical in managing inflation expectations. This, in turn, underscores the challenges of effective policy communication, making it essential to understand how these expectations are shaped and managed. The study also emphasises the need for further refinement in inflation surveys and adjustment techniques to capture the dynamics of household inflation expectations more accurately. References Aguiar, M. and Hurst, E. (2005). Consumption versus Expenditure. Journal of Political Economy 113(5), 919–948. Andrade, P., Gautier, E. and Mengus, E. (2020). What Matters in Households’ Inflation Expectations?. Banque de France Working Paper No. 770. Armantier, O., Nelson, S., Topa, G., van der Klaauw, W. and Zafar, B. (2016). The Price is Right: Updating Inflation Expectations in a Randomized Price Information Experiment. The Review of Economics and Statistics, MIT Press Vol. 98(3). 503-523. Asnani, S., Kumar, P. and Tomar, S. (2019). Does Inflation Targeting Anchor Inflation Expectations? Evidence From India. The Indian Statistical Institute Working Paper. Bailey, M., Cao, R., Kuchler, T. and Stroebel, J. (2018). The Economic Effects of Social Networks: Evidence from the Housing Market. Journal of Political Economy 126(6), 2224–2276. Baum, C. F., Schaffer, M. E., and Stillman, S. (2003). Instrumental Variables and GMM: Estimation and Testing. The Stata Journal, 3(1), 1-31. Bernanke, B. S. (2007). Inflation Expectations and Inflation Forecasting. In Speech at the Monetary Economics Workshop of the National Bureau of Economic Research Summer Institute, Cambridge, Massachusetts (Vol. 10, p. 11). Bhattacharya, R. (2023). Does Monetary Policy in India Anchor Inflation Expectation?. NIPFP Working Paper Series, No. 395. Binder, C. C. (2017). Measuring Uncertainty Based on Rounding: New Method and Application to Inflation Expectations. Journal of Monetary Economics, 90(C): 1–12. Bryan, M.F. and Venkatu, G. (2001). The Demographics of Inflation Opinion Surveys. Economic Commentary. Calvo, G. A. (1983). Staggered Prices in a Utility-Maximizing Framework. Journal of Monetary Economics, Elsevier. Vol. 12(3), 383-398. Carroll, C. D. (2003). Macroeconomic Expectations of Households and Professional Forecasters. Quarterly Journal of Economics, 118(1), 269-298. Casas, I., and Fernández-Casal, R. (2022). tvReg: Time-varying Coefficients in Multi-Equation Regression in R. R Journal, 14(1). Cavallo, A., Cruces, G. and Perez-Truglia, R. (2017). Inflation Expectations, Learning, and Supermarket Prices: Evidence from Survey Experiments. American Economic Journal: Macroeconomics, 9(3): 1–35. Coibion, O., and Gorodnichenko, Y. (2012). What Can Survey Forecasts Tell Us about Information Rigidities?. Journal of Political Economy, 120(1), 116–159. ----- (2015). Information Rigidity and the Expectations Formation Process: A Simple Framework and New Facts. American Economic Review, 105(8), 2644-2678. Coibion, O., Gorodnichenko, Y. and Kamdar, R. (2018). The Formation of Expectations, Inflation, and the Phillips Curve. Journal of Economic Literature, 56(4), 1447-1491. Coibion, O., Gorodnichenko, Y., Kumar, S. and Pedemonte, M. (2020). Inflation Expectations as a Policy Tool?. Journal of International Economics, Elsevier, vol. 124. Coibion, O., Gorodnichenko, Y. and Weber, M. (2022). Monetary Policy Communications and Their Effects on Household Inflation Expectations. Journal of Political Economy, 130(6), 1537-1584. Coibion, O., Gorodnichenko, Y., Knotek, E.S. and Schoenle, R. (2023). Average Inflation Targeting and Household Expectations. Journal of Political Economy Macroeconomics, University of Chicago Press. vol. 1(2), 403-446. Crump, R. K., Eusepi, S., Tambalotti, A. and Topa, G. (2022). Subjective Intertemporal Substitution. Journal of Monetary Economics, 126, 118-133. D’Acunto, F., Malmendier, U., Ospina, J. and Weber, M. (2021). Exposure to Grocery Prices and Inflation Expectations. Journal of Political Economy 129(5), 1615–1639. D’Acunto, F., Malmendier, U. and Weber, M. (2023). What Do the Data Tell Us About Inflation Expectations?. Handbook of Economic Expectations, 133-161. D’Acunto, F., Charalambakis, E., Georgarakos, D., Kenny, G., Meyer, J., and Weber, M. (2024). Household Inflation Expectations: An Overview of Recent Insights for Monetary Policy. Becker Friedman Institute for Economics Working Paper No. 2024-66. Das, A., Lahiri, K. and Zhao, Y. (2019). Inflation Expectations in India: Learning from household tendency surveys. International Journal of Forecasting, 35(3), 980-993. De Pooter, M., P. Robitaille, I. Walker, and M. Zdinak (2014). Are Long-Term Inflation Expectations Well Anchored in Brazil, Chile, and Mexico?. International Journal of Central Banking, 10(2), 337-400. Eichenbaum, M., Jaimovich, N. and Rebelo, S. (2011). Reference Prices, Costs, and Nominal Rigidities. American Economic Review, 101(1), 234–62. Eichengreen, B., and Gupta, P. (2024). Inflation Targeting in India: A Further Assessment. NCAER Working Paper No. 174. Friedman, M. (1968). The Role of Monetary Policy. American Economic Review, 58, 1-17. Ghosh, T., Sahu, S., and Chattopadhyay, S. (2021). Inflation Expectations of Households in India: Role of Oil Prices, Economic Policy Uncertainty, and Spillover of Global Financial Uncertainty. Bulletin of Economic Research, 73(2), 230-251. Goyal, A., and Parab, P. M. (2019). Modeling Consumers’ Confidence and Inflation Expectations. Economics Bulletin, 39(3), 1817-1832. ----- (2021). What Influences Aggregate Inflation Expectations of Households in India?. Journal of Asian Economics, 72, 101260. Haidari, Y., and Nolan, G. (2022). Sentiment, Uncertainty and Households’ Inflation Expectations. Reserve Bank of Australia Bulletin, September. Jonung, L. (1981). Perceived and Expected Rates of Inflation in Sweden. The American Economic Review, 71(5), 961-968. Kapur, M., and Behera, H. K. (2012). Monetary Transmission Mechanism in India: A quarterly model. Reserve Bank of India Working Paper 09. Khundrakpam, J. (2011). Credit Channel of Monetary Transmission in India - How Effective and Long is the Lag?. MPRA Paper 50899. Kose, M. A., Matsuoka, H., Panizza, U., and Vorisek, D. (2019). Inflation Expectations: Review and Evidence. World Bank Group Policy Research Working Paper No. WPS 8785. Kumar, S., Afrouzi, H., Coibion, O. and Gorodnichenko, Y. (2015). Inflation Targeting Does Not Anchor Inflation Expectations: Evidence from Firms in New Zealand. NBER Working Paper No. 21814. Lucas, R. E. (1972). Expectations and the Neutrality of Money. Journal of Economic Theory, 4(2), 103-124. ----- (1973). Some International Evidence on Output-Inflation Tradeoffs. The American Economic Review, 63(3), 326–334. ----- (1976). Econometric Policy Evaluation: A Critique. Carnegie-Rochester Conference Series on Public Policy, 1(1), 19-46. Malmendier, U. and Nagel, S. (2016). Learning from Inflation Experiences. Quarterly Journal of Economics, 131(1), 53-87. Mankiw, N. G., and Reis, R. (2002). Sticky Information versus Sticky Prices: A Proposal to Replace the New Keynesian Phillips Curve. The Quarterly Journal of Economics. 117(4), 1295-1328. Mankiw, N. G., Reis, R. and Wolfers, J. (2004). Disagreement about Inflation Expectations. NBER Macroeconomics Annual, Vol. 18, 209-270. Manski, C. F. (2004). Measuring expectations. Econometrica, 72(5), 1329-1376. Mehra, Y. P., and Reilly, D. (2008). Inflation Expectations: Their Sources and Effects. Richmond Fed Economic Brief. October, No. 08-01. Mishkin, F. S. (2007). Inflation Dynamics, International Finance, 10(3), 317-334. Moessner, R. (2021). Determinants of Inflation Expectations. CESifo Working Paper Series 9485. Muth, J. F. (1961). Rational Expectations and the Theory of Price Movements. Econometrica, 29(3), 315–335. Patra, M. D., and Ray, P. (2010). Inflation Expectations and Monetary Policy in India: An empirical exploration. International Monetary Fund WP/10/84. Pattanaik, S., Muduli, S., and Ray, S. (2020). Inflation Expectations of Households: Do They Influence Wage-Price Dynamics in India?. Macroeconomics and Finance in Emerging Market Economies, 13(3), 244-263. Pattanaik, S., Nadhanael, G. V., and Muduli, S. (2023). Taming Inflation by Anchoring Inflation Expectations. Economic and Political Weekly, 58(22), 33-41. Patzelt, P and Reis, R. (2024). Estimating the Rise in Expected Inflation from Higher Energy Prices. CEPR Discussion Paper No. 18907. Posen, A. (2011). The Soft Tyranny of Inflation Expectations. International Finance, 14(3), 541-566. Reiche, L. and Meyler, A. (2022). Making sense of consumer inflation expectations: the role of uncertainty. European Central Bank Working Paper Series No. 2642. Rudemo, M. (1982). Empirical Choice of Histograms and Kernel Density Estimators. Scandinavian Journal of Statistics, 65-78. Schafer, J. (2022). Inflation Expectations and Their Formation. Congressional Budget Office Working Paper 2022-03. Sharma, N. K., and Bicchal, M. (2018). The Properties of Inflation Expectations: Evidence for India. Economia, 19(1), 74-89. Shaw, P. (2023). Reading Consumers’ Minds: An Analysis of Inflation Expectations. Reserve Bank of India Working Paper. 05. Shaw, P., Jayaraman, A. R. and Das, T. B. (2019). Households’ Inflation Expectations: A Reflection. RBI Bulletin, December, 59-69. Sheffrin, S. M. (1996). Rational Expectations. Cambridge University Press. https://doi.org/10.1017/CBO9781139174367. Sims, C. A. (2003). Implications of Rational Inattention. Journal of Monetary Economics, 50(3), 665-690. Stroebel, J. and Vavra, J. (2019). House Prices, Local Demand, and Retail Prices. Journal of Political Economy, 127(3), 1391–1436. Taylor, J. B. (1979). Estimation and Control of a Macroeconomic Model with Rational Expectations. Econometrica, 47(5), 1267–1286. Weber, M., D’Acunto, F., Gorodnichenko, Y. and Coibion, O. (2022). The Subjective Inflation Expectations of Households and Firms: Measurement, Determinants, and Implications. Journal of Economic Perspectives, 36 (3), 157–84. Woodford, M. (2003). Inflation Targeting and Optimal Monetary Policy. Annual Economic Policy Conference, Princeton University. October 16-17. Annexure A: Adjustment Details The number of respondents in the unit-level IESH data after adjusting for extreme values is presented in Chart A1. ") Annexure B: Summary Statistics Unit level observations can have a maximum value of 16.5 per cent in reported series. On the other hand, the maximum of unit-level observations in trimmed series can take values higher than 16.5 as well. However, at the aggregate level, the median of the unit-level values of adjusted series (exclusion and trimmed) is found to be lower than that of reported series (Table B1). Annexure C: Robustness Results Results with supply shocks: To the benchmark models, when we add supply shocks, primarily rainfall, food volatility and oil price inflation, the results continue to hold (Table C1). The effect of past realised inflation and monetary policy actions is stronger and significant once we adjust for extreme values. The adoption of FIT regime has successfully brought down the inflation expectations. Food price volatility, combined with rainfall puts an upward pressure on these expectations, albeit with a small magnitude. Oil price inflation, both in terms of LPG 19 kg cylinder and Brent crude oil, has a positive significant impact on adjusted inflation expectations. 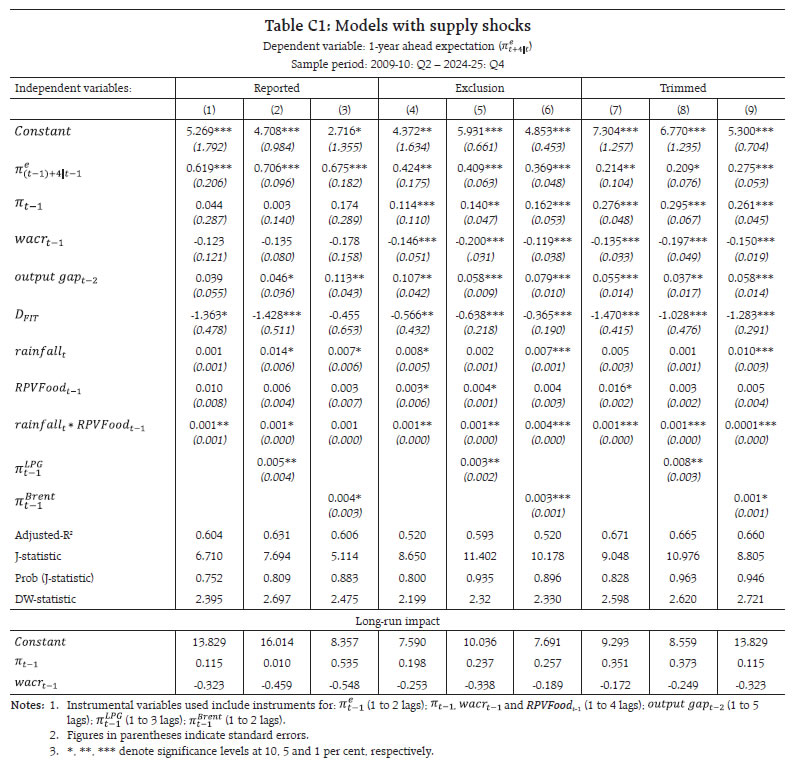 Results with REER: Comparing the effect of REER on various agents’ expectations, we see that REER is significant in case of professional (SPF) and businesses’ (BIES) forecasts (Table C2). 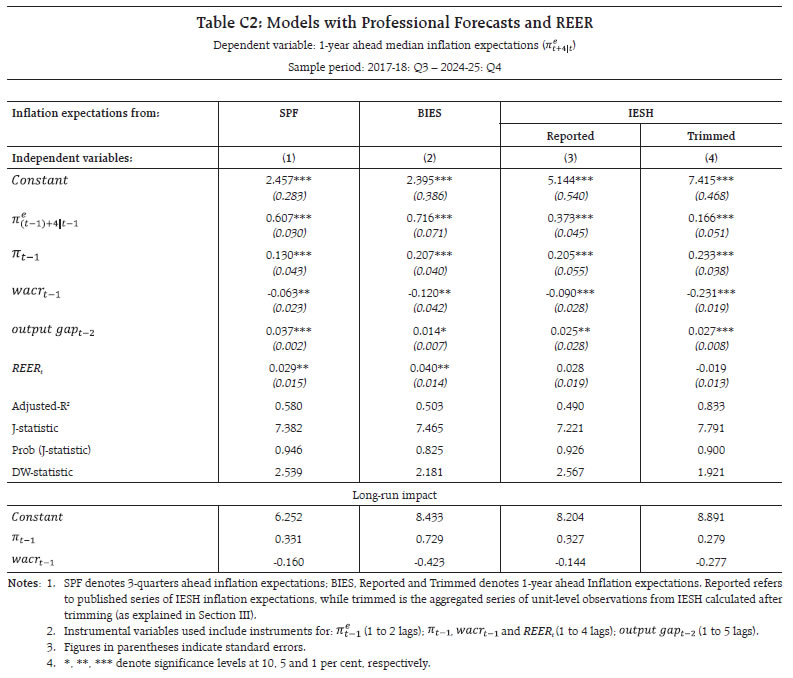 ^ Ankit Ruhi was consultant in the Department of Economic and Policy Research (DEPR). ^^ The authors are from DEPR. The views expressed are those of the authors and do not necessarily reflect those of the RBI. We thank Dr. Sarat Chandra Dhal for his valuable comments and feedback; Arti Sinha, G V Nadhanael, Somnath Sharma, Soumasree Tewari, Shashi Kant and Manu Swarnakar for insightful discussions; Gairika Bannerjee and Ranajoy Guha Neogi for data assistance. 1 Also known as full-information rational expectations (FIRE) model (Lucas, 1972, 1976; Taylor, 1979; Calvo, 1983). 2 Commonly known as sticky information or noisy information models (Mankiw and Reis, 2002; Caroll, 2003; Woodford, 2003; Sims, 2003; Coibion and Gorodnichenko, 2015; Coibion et al., 2018). 3 Evidence on impact of central bank communication regarding interest rate decisions on expectations is mixed. The effect of reading official statements is similar to being informed about inflation target (D’Acunto et al., 2020). 4 For further details, please refer to Patra and Ray (2010); Goyal and Parab (2019); Goyal and Parab (2021); Eichengreen and Gupta (2024); Ghosh et al. (2021); Bhattacharya (2023); Pattanaik et al. (2020); Pattanaik et al. (2023). 5 Sharma and Bicchal (2018), Shaw et al., (2019) and Shaw (2023) discuss properties of households’ inflation expectations. 6 The IESH survey uses a two-stage random sampling method since 2018. Prior to that, it used a quota sampling method with a focus on major cities in different regions of India. For further details on the IESH, please refer to Shaw et al., (2019); RBI Bulletin (May 2010); questionnaire, press releases, metadata, and unit level data. 7 Categories include general prices, food, non-food, housing, durables, and services. 8 For other methods of outlier-adjustment, please refer to Das et al., (2019). 9 For analyses using the 3-month ahead inflation expectations, and more exhaustive results on both 3 months ahead and 1 year ahead expectations for reported, exclusion and trimmed series, please refer to Ruhi et al., 2026 (mimeo). 10 Globally, households tend to report higher expectations than the professionals (Weber et al., 2023; D’Acunto et al., 2024). 11 The glide-path towards the FIT regime was announced in 2013-14: Q4. 12 Disagreement in inflation expectations is measured as standard deviation of expectations across agents. 13 Descriptions on the calculations of Exclusion and Trimmed series are provided in Section III. 14 We employ GMM regression framework to address the endogeneity issue and account for the potential information set of agents, using four consecutive lags of variables as instruments (to restrict the information set of agents to past one year). The GMM estimators can produce efficient and unbiased estimates even in the presence of heteroscedasticity of unknown form. Moreover, GMM maintains its efficiency in over-identified models, where the number of instruments exceeds the number of explanatory variables, provided that the over-identifying restrictions (or instruments) are valid. The Sargan-Hansen J test confirms the validity of these instruments by verifying that they are uncorrelated with the error term (Baum et al., 2003). 15 Output gap is calculated as the log difference of actual and potential GDP as per cent of log potential GDP in real terms. Potential GDP is calculated using Hodrick–Prescott filter. Since the GDP data becomes available with a lag of almost two quarters, is considered at time t–2. 16 In India, the effective policy rate has fluctuated between the repo and reverse repo rates, reflecting prevailing liquidity conditions and policy stance. Hence, WACR is used as a proxy (Khundrakpam, 2011; Kapur and Behera, 2012). 17 The Reserve Bank adopted a glide path towards the FIT regime in January, 2014, following the recommendations of an expert committee. The FIT framework was formally implemented in February 2015. To account for a potential adjustment period, we assume that the FIT regime began in 2014-15: Q1. 18 RPVFoodt-1 is calculated as weighted standard deviation of food and beverages group items’ inflation over headline inflation (Pattanaik et al., 2023). 19 Estimates using WPI food inflation were found insignificant. 20 Estimates using Real Effective Exchange Rate (36-currency trade-weighted) [REER] instead of Brent crude oil suggest that exchange rate movements are likely to matter more for informed professionals and businesses rather than households (Annex C Table C2). 21 LPG prices are calculated as the average of prices for the 19kg cylinder (pre-subsidy) in the four major cities of Delhi, Mumbai, Kolkata, and Chennai. Data for the 14.2kg cylinder is available only from 2014 onwards and is largely incorporated in the CPI already. Results with LPG 19kg cylinder price inflation are provided in Annex C Table C1. 22 Deflated using headline CPI-C index. 23 For detailed results for both 3-months and 1-year ahead expectations, please refer to Ruhi et al., 2026 (mimeo). 24 Summary statistics of the variables are presented in Annex B Table B1. 25 A basis point is one-hundredth of a percentage point. 26 The IESH does not capture information on households’ awareness about the Reserve Bank, its monetary policy functioning, cognitive abilities, or exposure to media and social interactions related to policy or inflation dynamics. While the questionnaire includes questions about education, this data is not publicly available. 27 Goyal and Parab (2021), De Pooter et al. (2014), Armantier et al. (2016). 28 This result holds even for the pre-Covid pandemic period till 2019-20 [Ruhi et al., 2026 (mimeo)]. 29 Patra and Ray (2010); Pattanaik et al. (2019); Eichengreen and Gupta (2024). 30 D’Acunto et al. (2024) argue that central banks should focus more on overall inflation rather than just core inflation since consumers tend to base their inflation expectations relatively more on prices of frequently purchased items. |

Share this page:


Install the RBI mobile application and get quick access to the latest news!
Scan the QR code to install our app


Page Last Updated on:


