The global financial crisis interrupted the growth momentum of India, despite the strong dominance of domestic sources of growth. There was clear moderation in growth by the third quarter of 2008-09. In relation to the agricultural sector, industry and services sectors have been affected more by the adverse external shocks, with some contribution to their growth deceleration arising from cyclical slowdown in certain sectors after a prolonged phase of high growth. In the context of the severity of the impact of the crisis on the real economy of countries around the world, the growth outcome reflects the resilience of the Indian economy. I.1 The Indian economy, which witnessed robust growth up to the second quarter of 2008-09, recorded sharp deceleration thereafter in the wake of persistent global economic slowdown, particularly in the advanced economies. According to the estimates released by the Central Statistical Organisation (CSO) in February 2009, real GDP growth during the third quarter of 2008-09 was lower at 5.3 per cent as compared with 8.9 per cent in the corresponding period of 2007-08, reflecting deceleration of growth in all its constituent sectors (Table 1). While the slowdown in industrial growth was largely an outcome of some cyclical downturn and adverse global factors, the services sector also recorded moderation from its double-digit growth, notwithstanding a countercyclical rise in the growth of community social and personal services following the implementation of the Sixth Pay Commission recommendations. The cumulative position reveals that the real GDP growth was 6.9 per cent during 2008-09 (April-December) as compared with 9.0 per cent during the corresponding period of 2007-08. Although India’s growth trajectory has been impacted both by the financial crisis and the global economic downturn, the structural drivers of the Indian economy continue to remain intact, sustaining the overall growth at a level much higher than most of the economies in rest of the world. It is expected that domestic demand in the Indian economy would be well supported by strong rural consumption demand as well as the coordinated monetary-fiscal stimulus measures undertaken recently. Agricultural Situation I.2 The performance of the South West monsoon during 2008 (June 1 to September 30) was satisfactory. Cumulative rainfall was two per cent below normal with 32 of 36 meteorological sub-divisions registering excess/normal rains. The performance of North-East monsoon (October 1 to December 31, 2008) was, however, subdued with cumulative rainfall being 31.0 per cent below the normal level. Moreover, the spatial distribution of rainfall was highly uneven (Chart 1). As on March 26, 2009, the total live water storage was 26.0 per cent (33.0 per cent last year) of the Full Reservoir Level (FRL). The long range monsoon forecast released by the India Meteorological Department on April 17, 2009 reveals that rainfall during the SouthWest monsoon season 2009, for the country as a whole is likely to be near normal, viz., 96 per cent of the Long Period Average with a model error of + 5 per cent.
Table 1: Growth Rates of Real GDP@ |
(Per cent) |
Sector |
2007-08* |
2008-09# |
2007-08 |
2008-09 |
2007-08 |
2008-09 |
Q1 |
Q2 |
Q3 |
Q1 |
Q2 |
Q3 |
April-December |
1 |
2 |
3 |
4 |
5 |
6 |
7 |
8 |
9 |
10 |
11 |
1. |
Agriculture and Allied Activities |
4.9 |
2.6 |
4.4 |
4.4 |
6.9 |
3.0 |
2.7 |
-2.2 |
5.5 |
0.6 |
| |
|
(17.8) |
(17.1) |
|
|
|
|
|
|
|
|
2. |
Industry |
7.4 |
4.2 |
8.5 |
7.5 |
7.6 |
5.2 |
4.7 |
0.8 |
7.9 |
3.5 |
| |
|
(19.2) |
(18.7) |
|
|
|
|
|
|
|
|
| |
2.1 |
Mining and Quarrying |
3.3 |
4.7 |
0.2 |
3.9 |
4.3 |
4.8 |
3.9 |
5.3 |
2.8 |
4.7 |
| |
2.2 |
Manufacturing |
8.2 |
4.1 |
10.0 |
8.2 |
8.6 |
5.6 |
5.0 |
-0.2 |
8.9 |
3.4 |
| |
2.3 |
Electricity, Gas & Water Supply |
5.3 |
4.3 |
6.9 |
5.9 |
3.8 |
2.6 |
3.6 |
3.3 |
5.5 |
3.2 |
3. |
Services |
10.8 |
9.2 |
10.7 |
10.7 |
10.1 |
10.2 |
9.6 |
9.5 |
10.5 |
9.7 |
| |
|
(63.0) |
(64.2) |
|
|
|
|
|
|
|
|
| |
3.1 |
Trade, Hotels, Restaurants, Transport, Storage and Communication |
12.4 |
10.3 |
13.2 |
11.0 |
11.6 |
11.2 |
10.7 |
6.8 |
11.9 |
9.4 |
| |
3.2 |
Financing, Insurance, Real Estate and Business Services |
11.7 |
8.6 |
12.4 |
12.2 |
11.9 |
9.3 |
9.2 |
9.5 |
12.2 |
9.3 |
| |
3.3 |
Community, Social and Personal Services |
6.8 |
9.3 |
4.5 |
7.1 |
5.5 |
8.5 |
7.7 |
17.3 |
5.7 |
11.2 |
| |
3.4 |
Construction |
10.1 |
6.5 |
9.7 |
13.7 |
9.0 |
11.4 |
9.7 |
6.7 |
10.8 |
9.2 |
4. |
Real GDP at Factor Cost |
9.0 |
7.1 |
9.1 |
9.1 |
8.9 |
7.9 |
7.6 |
5.3 |
9.0 |
6.9 |
| |
|
(100) |
(100) |
|
|
|
|
|
|
|
|
Memo: |
(Amount in Rupees crore) |
a) |
Real GDP at Factor Cost at 1999-2000 prices |
31,29,717 |
33,51,653 |
|
|
|
|
|
|
|
|
b) |
GDP at current market prices |
47,23,400 |
54,26,277 |
|
|
|
|
|
|
|
|
@ : At 1999-2000 Prices. * : Quick Estimates. # : Advance Estimates.
Note : Figures in parentheses indicate shares in real GDP.
Source : Central Statistical Organisation. |
I.3 The progress of acreage sown mirrors the prospects for agricultural production. The area covered under sowing of various crops declined marginally during the kharif season 2008-09 on account of moderate shortfall in rainfall. Nonetheless, the prospects for rabi production improved with area sown under rabi crops being higher than a year ago (Table 2). I.4 The Ministry of Agriculture has set the target for foodgrains production for 2008-09 at 233.0 million tonnes. According to the Second Advance Estimates, the total foodgrains production during 2008-09 is placed at 227.9 million tonnes as compared with 230.8 million tonnes in 2007-08 (Table 3). The reduction in foodgrains production during 2008-09 is on account of decline in kharif foodgrains production attributable to the crop losses due to floods in States like Bihar, Eastern UP, Orissa and Assam during the kharif season 2008-09. There has been a decline in the production of coarse cereals, pulses, oilseeds, cotton and sugarcane. The marginally lower estimates of wheat production for 2008-09 mainly reflected the unusually warm weather in January and early February 2009. However, growth in allied sectors like horticulture, livestock and fisheries is expected to remain favourable.
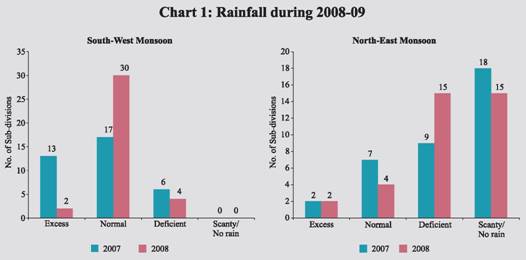
Table 2: Progress of Area Sown under Crops - 2008-09 |
(Million hectares) |
Crop |
Normal Area |
Area Coverage (as on October 17, 2008) |
Crop |
Normal Area |
Area Coverage (as on March 27, 2009) |
2007 |
2008 |
Absolute Variation |
2008 |
2009 |
Absolute Variation |
1 |
2 |
3 |
4 |
5 |
6 |
7 |
8 |
9 |
10 |
| |
Kharif Crops |
|
Rabi Crops |
Rice |
39.1 |
37.3 |
38.5 |
1.1 |
Rice |
3.7 |
4.4 |
4.6 |
0.3 |
Coarse cereals |
22.7 |
21.1 |
20.0 |
-1.2 |
Wheat |
26.5 |
28.1 |
27.8 |
-0.3 |
of which: |
|
|
|
|
Coarse cereals |
6.4 |
6.2 |
6.9 |
0.7 |
Bajra |
9.2 |
8.3 |
7.7 |
-0.6 |
of which: |
|
|
|
|
Jowar |
4.2 |
3.5 |
3.0 |
-0.5 |
Jowar |
4.9 |
4.5 |
4.9 |
0.4 |
Maize |
6.4 |
7.4 |
7.1 |
-0.3 |
Maize |
0.8 |
1.1 |
1.2 |
0.2 |
Total Pulses |
10.9 |
12.3 |
10.4 |
-1.9 |
Total Pulses |
11.6 |
13.6 |
14.5 |
0.9 |
Total Oilseeds |
15.9 |
17.5 |
18.3 |
0.8 |
Total Oilseeds |
9.2 |
9.7 |
10.0 |
0.3 |
of which: |
|
|
|
|
of which: |
|
|
|
|
Groundnut |
5.4 |
5.4 |
5.3 |
-0.1 |
Groundnut |
0.8 |
1.2 |
1.1 |
-0.2 |
Soyabean |
7.3 |
8.7 |
9.6 |
0.9 |
Rapeseed/ |
|
|
|
|
Sugarcane |
4.1 |
5.3 |
4.4 |
-0.9 |
Mustard |
6.3 |
6.0 |
6.6 |
0.7 |
Cotton |
8.4 |
9.2 |
9.1 |
-0.1 |
Sunflower |
1.3 |
1.1 |
1.2 |
0.1 |
All Crops |
101.9 |
103.9 |
101.5 |
-2.4 |
All Crops |
57.4 |
62.0 |
63.8 |
1.9 |
Source : Ministry of Agriculture, Government of India. |
Table 3: Agricultural Production |
(Million tonnes) |
Crop |
2007-08 |
2008-09 |
Target Achievement@ |
1 |
2 |
3 |
4 |
Rice |
96.7 |
97.0 |
98.9 |
Kharif |
82.7 |
83.0 |
85.5 |
Rabi |
14.0 |
14.0 |
13.4 |
Wheat |
78.6 |
78.5 |
77.8 |
Coarse Cereals |
40.8 |
42.0 |
37.0 |
Kharif |
31.9 |
32.6 |
27.7 |
Rabi |
8.9 |
9.4 |
9.3 |
Pulses |
14.8 |
15.5 |
14.3 |
Kharif |
6.4 |
5.9 |
4.8 |
Rabi |
8.4 |
9.6 |
9.4 |
Total Foodgrains |
230.8 |
233.0 |
227.9 |
Kharif |
121.0 |
121.5 |
118.0 |
Rabi |
109.8 |
111.5 |
109.9 |
Total Oilseeds |
29.8 |
31.8 |
26.0 |
Kharif |
20.7 |
20.0 |
16.3 |
Rabi |
9.0 |
11.8 |
9.6 |
Sugarcane |
348.2 |
340.0 |
290.4 |
Cotton # |
25.9 |
26.0 |
22.2 |
Jute and Mesta ## |
11.2 |
11.0 |
11.0 |
@ : Second Advance Estimates.
# : Million bales of 170 kgs. each.
## : Million bales of 180 kgs. each.
Source : Ministry of Agriculture, Government of India. |
Food Management
I.5 The foodgrains procurement (rice and wheat) during 2008-09 was higher led by more than two-fold increase in wheat procurement (Table 4). The offtake of foodgrains (rice and wheat) during 2008-09 so far (up to January 31, 2009) was also higher than the level during corresponding period last year. The stocks of foodgrains with the Food Corporation of India (FCI) and other Government agencies nearly doubled to about 37.4 million tonnes as on February 1, 2009. The stocks of both rice and wheat are now higher than their norms.
Industrial Performance
I.6 The loss of growth momentum in the industrial sector was evident during 2008-09 (April-February) with the year-on- year expansion being 2.8 per cent as against 8.8 per cent in the corresponding period of the previous year (Table 5). The intra-year movement of growth in industrial production reveals that the Index of Industrial Production (IIP), which witnessed an average growth of around 5.6 per cent during the first four months of 2008-09 (April to July), slipped to a low of 1.7 per cent during August, before recovering to 6.0 per cent in September. The IIP growth, however, decelerated in October-November 2008 and January 2009 and recorded a negative growth during December 2008 and February 2009 (Chart 2). Before this, IIP had registered negative growth in April 1994.
I.7 The manufacturing sector witnessed a slowdown as 15 industry groups accounting for 74.4 per cent of the total weight in the IIP recorded decelerated/ negative growth during April-February 2008-09 (Table 6). Jute, most of the textiles, rubber, plastic, petroleum and coal products, food products, leather and fur products, wood and wood products, furnitures, fixtures, metal products and parts recorded a decline in production, while chemical and chemical products, machinery and equipment, basic metal and alloy industries, paper and paper products, transport equipment and parts, non-metallic mineral products, wool, silk and man-made fibre textiles and other manufacturing industries recorded decelerated growth. On the contrary, only two industry groups, viz., beverages, tobacco and related products and textile products recorded accelerated growth during the period.
Table 4: Management of Food Stocks |
(Million tonnes) |
Year/Month |
Opening Stock of Foodgrains |
Procurement of Foodgrains |
Foodgrains Offtake |
Closing Norms Stock |
Rice |
Wheat |
Total |
Rice |
Wheat |
Total |
PDS |
OWS |
OMS -Domestic |
Exports |
Total |
1 |
2 |
3 |
4 |
5 |
6 |
7 |
8 |
9 |
10 |
11 |
12 |
13 |
14 |
2007-08 |
13.2 |
4.7 |
17.9 |
26.4 |
11.1 |
37.5 |
33.5 |
3.9 |
0.0 |
0.0 |
37.4 |
19.8 |
|
2008-09@ |
13.8 |
5.8 |
19.8 |
32.8 |
22.7 |
55.4 |
28.9 |
2.6 |
0.5 |
0.0 |
32.0 |
|
|
| |
|
|
|
|
|
|
(27.6) |
(3.0) |
(0.0) |
(0.0) |
(30.5) |
|
|
2007 |
|
|
|
|
|
|
|
|
|
|
|
|
|
April |
13.2 |
4.7 |
17.9 |
0.9 |
7.9 |
8.7 |
2.6 |
0.2 |
0.0 |
0.0 |
2.8 |
25.1 |
16.2 |
July |
11.0 |
12.9 |
23.9 |
0.8 |
0.0 |
0.8 |
2.9 |
0.4 |
0.0 |
0.0 |
3.2 |
21.2 |
26.9 |
October |
5.5 |
10.1 |
15.6 |
7.4 |
0.0 |
7.4 |
2.7 |
0.3 |
0.0 |
0.0 |
2.9 |
19.7 |
16.2 |
December |
10.1 |
8.4 |
18.5 |
3.5 |
0.0 |
3.5 |
2.7 |
0.3 |
0.0 |
0.0 |
3.0 |
19.2 |
|
2008 |
|
|
|
|
|
|
|
|
|
|
|
|
|
January |
11.5 |
7.7 |
19.2 |
4.5 |
0.0 |
4.5 |
2.9 |
0.3 |
0.0 |
0.0 |
3.2 |
21.4 |
20.0 |
April |
13.8 |
5.8 |
19.8 |
1.1 |
12.6 |
13.7 |
2.7 |
0.0 |
0.0 |
0.0 |
2.8 |
30.7 |
16.2 |
July |
11.3 |
24.9 |
36.3 |
0.1 |
0.2 |
0.3 |
2.8 |
0.3 |
0.0 |
0.0 |
3.1 |
34.3 |
26.9 |
September |
8.5 |
23.3 |
31.8 |
1.4 |
0.0 |
1.4 |
2.8 |
0.4 |
0.0 |
0.0 |
3.2 |
30.0 |
|
October |
7.9 |
22.0 |
30.0 |
8.1 |
0.0 |
8.1 |
2.6 |
0.1 |
0.0 |
0.0 |
2.8 |
35.3 |
16.2 |
November |
14.1 |
21.0 |
35.3 |
3.1 |
0.0 |
3.1 |
2.6 |
0.1 |
0.0 |
0.0 |
2.8 |
35.5 |
|
December |
15.6 |
19.6 |
35.5 |
4.2 |
0.0 |
4.2 |
3.0 |
0.5 |
0.2 |
0.0 |
3.6 |
36.2 |
|
2009 |
|
|
|
|
|
|
|
|
|
|
|
|
|
January |
17.6 |
18.2 |
36.2 |
4.8 |
0.0 |
4.8 |
2.9 |
0.2 |
0.3 |
0.0 |
3.4 |
37.4 |
20.0 |
February |
20.2 |
16.8 |
37.4 |
3.7 |
0.1 |
3.8 |
.. |
.. |
.. |
.. |
.. |
.. |
|
March |
.. |
.. |
.. |
2.4 |
0.0 |
2.4 |
.. |
.. |
.. |
.. |
.. |
.. |
|
PDS : Public Distribution System. OWS : Other Welfare Schemes. OMS : Open Market Sales.
.. : Not Available.
@ : Offtake up to January 31, 2009.
Note : 1. Closing stock figures may differ from those arrived at by adding the opening stocks and procurement and deducting offtake, as stocks include coarse grains also.
2. Figures in parentheses indicate offtake of foodgrains during the corresponding period of 2007-08.
3. Total minimum stocks are to be maintained, as on April 1, July 1, October 1, and January 1, by public agencies under the ‘new buffer stocking policy’ with effect from March 29, 2005.
Source : Ministry of Consumer Affairs, Food and Public Distribution, Government of India. |
I.8 Electricity sector witnessed its lowest growth since the introduction of current IIP series (1993-94=100), on account of deceleration in power generation in all spheres, viz., thermal, nuclear and hydro-power plants. The mining sector growth also decelerated.
Table 5: Index of Industrial Production - Sectoral and Use-Based Classification |
(Per cent) |
Industry Group |
Weight in the IIP |
Growth Rate |
Weighted Contribution # |
April-March 2007-08 |
April-February |
April-March 2007-08 |
April-February |
2007-08 |
2008-09 P |
2007-08 |
2008-09 P |
1 |
2 |
3 |
4 |
5 |
6 |
7 |
8 |
Sectoral |
|
|
|
|
|
|
|
Mining |
10.5 |
5.1 |
5.2 |
2.4 |
4.2 |
4.0 |
5.9 |
Manufacturing |
79.4 |
9.0 |
9.3 |
2.8 |
89.5 |
89.6 |
86.7 |
Electricity |
10.2 |
6.3 |
6.6 |
2.4 |
6.3 |
6.4 |
7.3 |
Use-Based |
|
|
|
|
|
|
|
Basic Goods |
35.6 |
7.0 |
7.3 |
2.7 |
24.7 |
25.2 |
28.6 |
Capital Goods |
9.3 |
18.0 |
17.7 |
8.8 |
25.0 |
23.1 |
39.9 |
Intermediate Goods |
26.5 |
8.9 |
9.3 |
-2.7 |
27.4 |
27.7 |
-25.9 |
Consumer Goods (a+b) |
28.7 |
6.1 |
6.6 |
4.9 |
22.9 |
24.1 |
55.6 |
a) Consumer Durables |
5.4 |
-1.0 |
-1.0 |
4.1 |
-1.0 |
-0.9 |
11.2 |
b) Consumer Non-durables |
23.3 |
8.5 |
9.3 |
5.1 |
24.0 |
25.0 |
44.4 |
General |
100.0 |
8.5 |
8.8 |
2.8 |
100.0 |
100.0 |
100.0 |
P : Provisional.
# : Figures may not add up to 100 due to rounding off.
Source : Central Statistical Organisation. |
I.9 In terms of use-based classification, the growth in basic, capital and consumer goods sectors recorded a deceleration, while intermediate goods production registered a decline during 2008-09 (April-February). The contraction in the intermediate goods sector is due to a decline in the production of a number of textile items, PVC pipes and tubes, railway/concrete sleeper, spun pipes, yarns, hessian, sacking, particle board and filament yarn. The basic goods sector decelerated sharply mainly on account of subdued growth in electricity sector, a fall in production of basic chemicals and rubber, petroleum and coal products and some steel and aluminium products. The capital goods sector moderated on account of decline in production of transport equipment and other machinery and equipments. Within the transport equipment, there was decline in production of broad gauge covered wagons, passenger carriage, commercial vehicles, H.T. insulators among non-metallic mineral products and agricultural implements. The consumer goods sector witnessed a moderate deceleration, of which the growth of non durables segment decelerated, while that of consumer durables accelerated. The subdued growth in consumer non-durables was on account of the decline in production of cotton textiles, textile products, leather goods, basic chemicals, metal products such as razor blades, machinery and equipment other than transport equipment and other manufacturing industries.

Table 6: Growth of Manufacturing Groups |
(Per cent) |
Industry Group |
Weight in the IIP |
Growth Rate |
Weighted Contribution # |
April-March 2007-08 |
April-February |
April-March 2007-08 |
April-February |
2007-08 |
2008-09 P |
2007-08 |
2008-09 P |
1 |
2 |
3 |
4 |
5 |
6 |
7 |
8 |
1. |
Food products |
9.08 |
7.0 |
7.9 |
-6.2 |
6.3 |
6.6 |
-17.0 |
2. |
Beverages, tobacco and related products |
2.38 |
12.0 |
11.9 |
14.7 |
6.8 |
6.6 |
27.5 |
3. |
Cotton textiles |
5.52 |
4.3 |
4.7 |
-2.6 |
2.0 |
2.1 |
-3.7 |
4. |
Wool, silk and man-made fibre textiles |
2.26 |
4.8 |
3.9 |
1.1 |
1.5 |
1.2 |
1.1 |
5. |
Jute and other vegetable fibre textiles (except cotton) |
0.59 |
33.0 |
30.8 |
-10.9 |
0.9 |
0.9 |
-1.2 |
6. |
Textile products (including wearing apparel) |
2.54 |
3.7 |
4.2 |
4.5 |
1.4 |
1.6 |
5.4 |
7. |
Wood and wood products, furniture & fixtures |
2.70 |
40.5 |
46.5 |
-8.9 |
5.3 |
5.6 |
-4.8 |
8. |
Paper and paper products and printing, publishing and allied industries |
2.65 |
2.7 |
2.7 |
1.8 |
0.9 |
0.9 |
1.9 |
9. |
Leather and leather & fur products |
1.14 |
11.7 |
11.6 |
-6.1 |
1.1 |
1.0 |
-1.8 |
10. |
Chemicals and chemical products (except products of petroleum & coal) |
14.00 |
10.6 |
11.4 |
2.4 |
22.4 |
23.4 |
16.8 |
11. |
Rubber, plastic, petroleum and coal products |
5.73 |
8.9 |
9.3 |
-2.3 |
6.1 |
6.2 |
-5.2 |
12. |
Non-metallic mineral products |
4.40 |
5.7 |
6.3 |
0.8 |
4.1 |
4.4 |
1.9 |
13. |
Basic metal and alloy industries |
7.45 |
12.1 |
12.8 |
4.9 |
13.4 |
13.6 |
17.8 |
14. |
Metal products and parts (except machinery and equipment) |
2.81 |
-5.6 |
-2.8 |
-2.8 |
-1.5 |
-0.7 |
-2.2 |
15. |
Machinery and equipment other than transport equipment |
9.57 |
10.5 |
9.8 |
9.7 |
19.0 |
16.9 |
56.0 |
16. |
Transport equipment and parts |
3.98 |
2.9 |
3.1 |
1.4 |
2.3 |
2.3 |
3.4 |
17. |
Other manufacturing industries |
2.56 |
19.8 |
18.6 |
2.9 |
8.0 |
7.3 |
4.1 |
| |
Manufacturing – Total |
79.36 |
9.0 |
9.3 |
2.8 |
100.0 |
100.0 |
100.0 |
P : Provisional. # : Figures may not add up to 100 due to rounding off.
Source : Central Statistical Organisation. |
Infrastructure
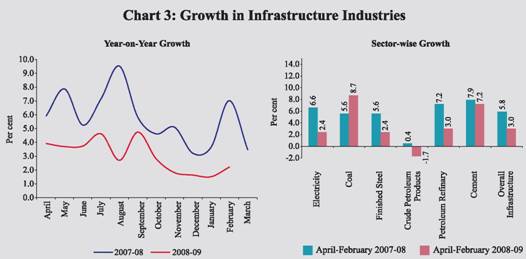
I.10 The core sector recorded lower growth of 3.0 per cent during April-February 2008-09, down from 5.8 per cent during the corresponding period of the previous year (Chart 3). The sharp deceleration in the growth of electricity, finished steel and petroleum refinery products sector and decline in crude oil production impacted the growth of infrastructure. Both cement and steel sectors recorded decelerated growth reflecting slowdown in construction. Services Sector I.11 The services sector recorded some moderation in growth during 2008-09. The moderation was visible particularly from the second quarter of the year, reflecting subdued performance of all the segments, except community, social and personal services. Cumulatively, the sector recorded a lower growth of 9.7 per cent during April-December 2008-09, as compared with 10.5 per cent during the corresponding period of 2007-08. However, the share of the services sector in real GDP has gone up during 2008-09 (see Table 1).
I.12 In terms of relative contribution to real GDP growth, while the slowdown was particularly evident in construction, trade, hotel, transport and communication, the contribution of community social and personal services increased, reflecting the Sixth Pay Commission payout (Table 7).
I.13 The indicators of services sector activity for 2008-09 suggest sharp negative growth in respect of foreign tourist arrivals, passengers handled at domestic terminals, commercial vehicles production, railway revenue earning freight traffic and import cargo handled by civil aviation.Furthermore, growth in new cell-phone connections, export cargo handled by civil aviation, production of cement and steel decelerated (Table 8).
Table 7: Growth in Services Sector |
(Contribution to real GDP growth; percentage points) |
Year/Quarter |
Construction |
Trade, Hotels, Transport and Communication |
Financing, Insurance, Real Estate and Business Services |
Community, Social and Personal Services |
Total Services |
1 |
2 |
3 |
4 |
5 |
6 |
2005-06 |
|
1.1 |
3.0 |
1.5 |
1.0 |
6.7 |
2006-07 |
|
0.8 |
3.5 |
1.9 |
0.8 |
6.9 |
2007-08 |
QE |
0.7 |
3.4 |
1.7 |
0.9 |
6.7 |
2008-09 |
AE |
0.5 |
2.9 |
1.3 |
1.2 |
5.8 |
2007-08 |
: Q1 |
0.7 |
3.5 |
1.8 |
0.6 |
6.6 |
| |
: Q2 |
1.0 |
3.1 |
1.8 |
1.0 |
6.9 |
| |
: Q3 |
0.6 |
3.1 |
1.6 |
0.7 |
6.0 |
| |
: Q4 |
0.9 |
3.4 |
1.5 |
1.3 |
7.1 |
2008-09 |
: Q1 |
0.8 |
3.0 |
1.4 |
1.1 |
6.4 |
| |
: Q2 |
0.7 |
3.0 |
1.4 |
1.1 |
6.3 |
| |
: Q3 |
0.5 |
1.8 |
1.3 |
2.1 |
5.7 |
QE : Quick Estimates. AE : Advance Estimates. Source: Central Statistical Organisation. |
Table 8: Indicators of Services Sector Activity |
(Growth rates in per cent) |
Sub-sector |
2006-07 |
2007-08 |
April-January |
2007-08 |
2008-09 |
1 |
2 |
3 |
4 |
5 |
Tourist arrivals |
13.0 |
12.2 |
12.7 |
-0.1 |
Commercial vehicles production# |
33.0 |
4.8 |
4.5 @ |
-23.4 @ |
Railway revenue earning freight traffic |
9.2 |
9.0 |
9.0 @ |
-0.9 @ |
New cell phone connections |
85.4 |
38.3 |
42.7 |
31.1 |
Cargo handled at major ports |
9.5 |
11.9 |
11.9 |
3.0 |
Civil aviation |
|
|
|
|
Export cargo handled |
3.6 |
7.5 |
6.7 * |
5.5 * |
Import cargo handled |
19.4 |
19.7 |
21.5 * |
-0.8 * |
Passengers handled at international terminals |
12.1 |
11.9 |
12.7 * |
6.2 * |
Passengers handled at domestic terminals |
34.0 |
20.6 |
24.1 * |
-11.6 * |
Cement ** |
9.1 |
8.1 |
7.9 @ |
7.2 @ |
Steel ** |
13.1 |
5.1 |
5.6 @ |
2.4 @ |
* : April-December. # : Leading Indicator for transportation.
@: April-February. ** : Leading indicators for construction. SCBs : Scheduled Commercial Banks.
Source : Ministry of Tourism; Ministry of Commerce and Industry; Ministry of Statistics and Programme Implementation; Reserve Bank of India; and Centre for Monitoring Indian Economy. |
|


