The Indian economy continued to exhibit robust growth during the second quarter (July-September) of 2007-08, albeit with some moderation. According to the Central Statistical Organisation (CSO), real GDP growth moderated to 8.9 per cent during the second quarter of 2007-08 from 10.2 per cent in the corresponding period of 2006-07. Real GDP growth during the first half of 2007-08 was estimated at 9.1 per cent as compared with 9.9 per cent in the corresponding period of 2006-07 (Table 1 and Chart 1). While agriculture and allied activities recorded higher growth during the first half of 2007-08 over the corresponding period of the previous year, the growth in industrial and services sectors was somewhat lower than in the previous year.
Table 1: Growth Rates of Real GDP (At 1999-2000 prices) |
(Per cent) |
Sector |
2000-01
to 2006-07
(Average) |
2005-06* |
2006-07# |
2006-07 |
2007-08 |
2006-07 |
2007-08 |
|
|
|
|
Q1 |
Q2 |
Q3 |
Q4 |
Q1 |
Q2 |
April-September |
1 |
2 |
3 |
4 |
5 |
6 |
7 |
8 |
9 |
10 |
11 |
12 |
1. |
Agriculture and |
|
|
|
|
|
|
|
|
|
|
|
|
Allied Activities |
2.5 |
6.0 |
2.7 |
2.8 |
2.9 |
1.6 |
3.8 |
3.8 |
3.6 |
2.8 |
3.7 |
|
|
(21.4) |
(19.7) |
(18.5) |
|
|
|
|
|
|
|
|
2. |
Industry |
7.0 |
8.0 |
11.0 |
10.6 |
11.3 |
10.8 |
11.2 |
10.6 |
8.3 |
11.0 |
9.5 |
|
|
(19.6) |
(19.4) |
(19.6) |
|
|
|
|
|
|
|
|
2.1 |
Mining and Quarrying |
4.6 |
3.6 |
5.1 |
3.7 |
3.9 |
5.5 |
7.1 |
3.2 |
7.7 |
3.8 |
5.4 |
|
|
|
|
|
|
|
|
|
|
|
|
|
2.2 |
Manufacturing |
7.7 |
9.1 |
12.3 |
12.3 |
12.7 |
11.8 |
12.4 |
11.9 |
8.6 |
12.5 |
10.2 |
2.3 |
Electricity, Gas and |
|
|
|
|
|
|
|
|
|
|
|
|
Water Supply |
4.8 |
5.3 |
7.4 |
5.8 |
8.1 |
9.1 |
6.9 |
8.3 |
7.3 |
6.9 |
7.8 |
3. |
Services |
8.6 |
10.3 |
11.0 |
11.6 |
11.7 |
10.9 |
10.0 |
10.6 |
10.3 |
11.6 |
10.5 |
|
|
(59.0) |
(60.9) |
(61.8) |
|
|
|
|
|
|
|
|
3.1 |
Trade, Hotels, |
|
|
|
|
|
|
|
|
|
|
|
|
Restaurants, Transport, |
|
|
|
|
|
|
|
|
|
|
|
|
Storage and |
|
|
|
|
|
|
|
|
|
|
|
|
Communication |
10.3 |
10.4 |
13.0 |
12.4 |
14.2 |
13.1 |
12.4 |
12.0 |
11.4 |
13.3 |
11.7 |
3.2 |
Financing, Insurance, |
|
|
|
|
|
|
|
|
|
|
|
|
Real Estate and |
|
|
|
|
|
|
|
|
|
|
|
|
Business Services |
7.9 |
10.9 |
10.6 |
10.8 |
11.1 |
11.2 |
9.3 |
11.0 |
10.6 |
10.9 |
10.8 |
3.3 |
Community, Social and |
|
|
|
|
|
|
|
|
|
|
|
|
Personal Services |
6.0 |
7.7 |
7.8 |
11.3 |
8.3 |
6.7 |
5.7 |
7.6 |
7.8 |
9.7 |
7.7 |
|
|
|
|
|
|
|
|
|
|
|
|
|
3.4 |
Construction |
9.9 |
14.2 |
10.7 |
10.5 |
11.1 |
10 |
11.2 |
10.7 |
11.1 |
10.8 |
10.9 |
4. |
Real GDP at Factor Cost |
6.9 |
9.0 |
9.4 |
9.6 |
10.2 |
8.7 |
9.1 |
9.3 |
8.9 |
9.9 |
9.1 |
|
|
(100.0) |
(100.0) |
(100.0) |
|
|
|
|
|
|
|
|
Memo: |
(Amount in Rupees crore) |
a)Real GDP at factor cost |
26,04,532 |
28,48,157 |
|
|
|
|
|
|
|
|
b)GDP at current market prices |
35,67,177 |
41,25,725 |
|
|
|
|
|
|
|
|
*: Quick Estimates. #: Revised Estimates
Note : Figures in parentheses denote shares in real GDP.
Source : Central Statistical Organisation (CSO). |

Agricultural Situation
Cumulative rainfall during the 2007 South-West monsoon season (June 1 to September 30) turned out to be 5 per cent above normal. The seasonal rainfall was well-distributed over time, barring the short spells of rainfall deficiency during the first week of June, third and fourth weeks of July and third week of August. At the end of the season (as on September 27, 2007), water stock in 81 major reservoirs was 79 per cent of the full reservoir level (FRL), lower than 87 per cent during the corresponding period of the previous year, but higher than the average of 67 per cent over the last 10 years. Cumulative rainfall during the North-East monsoon (October 1, 2007 to December 31, 2007) was, however, 32 per cent below normal as compared with 21 per cent below normal during the corresponding period of the previous year. Of the 36 meteorological sub-divisions, cumulative rainfall was deficient/scanty/no rain in 27 sub-divisions (same as last year) (Table 2). As on January 17, 2008, the total live water storage was 55 per cent of the FRL (59 per cent last year).
The sowing of kharif crops improved during 2007-08 on account of satisfactory rainfall during the South-West monsoon and remunerative market prices. The reported sown area as on October 26, 2007 was about 2.7 per cent higher than the previous year (Table 3). In contrast, area sown under rabi crops so far (up to January 18, 2008) has been about 3.7 per cent lower than a year ago. Rabi sowing was lower in case of rice, wheat, pulses and oilseeds, but higher in case of coarse cereals than in the previous year.
Table 2: Rainfall during South-West and North-East Monsoon |
(Number of Meteorological Divisions) |
Year |
South-West Monsoon |
North-East Monsoon |
|
Cumulative |
Excess |
Normal |
Deficient |
Scanty/ |
Cumulative |
Excess |
Normal |
Deficient |
Scanty/ |
|
Rainfall: |
Rainfall |
Rainfall |
Rainfall |
No Rain |
Rainfall: |
Rainfall |
Rainfall |
Rainfall |
No Rain |
|
Above(+)/ Below (-) Normal
(per cent) |
|
|
|
|
Above(+)/
Below (-) Normal
(per cent) |
|
|
|
|
1 |
2 |
3 |
4 |
5 |
6 |
7 |
8 |
9 |
10 |
11 |
1998 |
6 |
12 |
21 |
3 |
0 |
- |
28 |
6 |
1 |
1 |
1999 |
-4 |
3 |
26 |
7 |
0 |
- |
20 |
7 |
6 |
3 |
2000 |
-8 |
5 |
23 |
8 |
0 |
- |
0 |
4 |
13 |
19 |
2001 |
-8 |
1 |
30 |
5 |
0 |
- |
14 |
10 |
9 |
3 |
2002 |
-19 |
1 |
14 |
19 |
2 |
-33 |
3 |
7 |
12 |
14 |
2003 |
2 |
7 |
26 |
3 |
0 |
9 |
9 |
9 |
6 |
12 |
2004 |
-13 |
0 |
23 |
13 |
0 |
-11 |
8 |
10 |
17 |
1 |
2005 |
-1 |
9 |
23 |
4 |
0 |
10 |
11 |
6 |
5 |
14 |
2006 |
-1 |
6 |
20 |
10 |
0 |
-21 |
3 |
6 |
14 |
13 |
2007 |
5 |
13 |
17 |
6 |
0 |
-32 |
2 |
7 |
9 |
18 |
Excess:+20 per cent or more. Normal : +19 per cent to - 19 per cent.
Deficient :- 20 per cent to -59 per cent.
Scanty : - 60 per cent to -99 per cent. No Rain: -100 per cent.
Source : India Meteorological Department. |
The First Advance Estimates for 2007-08 have placed the total kharif foodgrains production at 112.2 million tonnes, which though lower than the target, was about 1.6 per cent higher than that of the previous year (110.5 million
Table 3: Progress of Area under Crops - 2007-08 |
(Million hectares) |
Crop |
Normal Area |
Area Coverage |
Crop |
Normal Area |
Area Coverage |
|
|
2006 |
2007 |
Variation |
|
|
(As reported on
January 18, 2008) |
|
|
|
|
|
|
|
2006 |
2007 |
Variation |
1 |
2 |
3 |
4 |
5 |
1 |
2 |
3 |
4 |
5 |
Kharif Crops |
Rabi Crops |
Rice |
38.2 |
37.1 |
37.3 |
0.2 |
Rice |
3.7 |
0.9 |
0.8 |
-0.1 |
Coarse Cereals |
22.9 |
22.1 |
22.0 |
-0.1 |
Wheat |
26.2 |
28.0 |
27.4 |
-0.6 |
of which: |
|
|
|
|
Coarse Cereals |
6.4 |
6.4 |
6.5 |
0.1 |
Bajra |
9.4 |
9.3 |
8.7 |
-0.6 |
of which: |
|
|
|
|
Jowar |
4.4 |
3.8 |
3.6 |
-0.2 |
|
|
|
|
|
|
|
|
|
|
Jowar |
5.0 |
4.7 |
4.6 |
-0.1 |
Maize |
6.2 |
6.8 |
7.5 |
0.6 |
|
|
|
|
|
|
|
|
|
|
Maize |
0.7 |
0.8 |
0.9 |
0.1 |
Total Pulses |
10.9 |
11.4 |
12.6 |
1.2 |
|
|
|
|
|
|
|
|
|
|
Total Pulses |
11.4 |
13.7 |
12.9 |
-0.8 |
Total Kharif |
Oilseeds15.4 |
16.8 |
17.7 |
0.9 |
|
|
|
|
|
|
|
|
|
|
Total Rabi Oilseeds |
8.8 |
9.5 |
8.5 |
-1.0 |
of which: |
|
|
|
|
|
|
|
|
|
|
|
|
|
|
of which: |
|
|
|
|
Groundnut |
5.5 |
4.8 |
5.4 |
0.6 |
|
|
|
|
|
|
|
|
|
|
Groundnut |
0.8 |
0.7 |
0.6 |
-0.1 |
Soyabean |
6.6 |
8.1 |
8.8 |
0.6 |
|
|
|
|
|
|
|
|
|
|
Rapeseed/Mustard |
5.9 |
6.6 |
5.9 |
-0.7 |
Sugarcane |
4.2 |
4.8 |
5.1 |
0.3 |
|
|
|
|
|
Cotton |
8.3 |
9.0 |
9.3 |
0.4 |
Sunflower |
1.2 |
1.1 |
0.9 |
-0.2 |
All Crops |
100.8 |
102.1 |
104.9 |
2.7 |
All Crops |
56.5 |
58.5 |
56.3 |
-2.2 |
Source : Ministry of Agriculture, Government of India. |
tonnes) (Table 4). The enhanced kharif foodgrains production is expected to be largely on account of the recovery in the production of pulses and maize. Amongst the non-foodgrains, while the production of sugarcane, jute and mesta, and cotton are expected to witness modest growth over the previous year, that of oilseeds is likely to show a significant increase.
Food Management
Total procurement of rice and wheat during 2007-08 (up to January 9, 2008) aggregated 30.1 million tonnes, which was higher by 1.5 per cent than that procured during the corresponding period of the previous year mainly on account of a 20.6 per cent increase in wheat procurement at 11.1 million tonnes. Total offtake of rice and wheat during 2007-08 (up to October 31, 2007) at 21.4 million tonnes was marginally lower, by 0.5 per cent, than the 21.5 million tonnes offtake during the corresponding period of the previous year. As on November 1, 2007, total stocks of foodgrains with the Food Corporation of India (FCI) and other Government agencies were at around
Table 4: Agricultural Production |
(Million tonnes) |
Crop |
2003-04 |
2004-05 |
2005-06 |
2006-07* |
2007-08 |
|
|
|
|
|
T |
A@ |
1 |
2 |
3 |
4 |
5 |
6 |
7 |
Rice |
88.5 |
83.1 |
91.8 |
92.8 |
93.0 |
|
|
Kharif |
78.6 |
72.2 |
78.3 |
80.1 |
80.0 |
80.2 |
|
Rabi |
9.9 |
10.9 |
13.5 |
12.7 |
13.0 |
|
Wheat |
72.2 |
68.6 |
69.4 |
74.9 |
75.5 |
|
Coarse Cereals |
37.6 |
33.5 |
34.1 |
34.3 |
37.5 |
|
|
Kharif |
32.2 |
26.4 |
26.7 |
25.7 |
28.7 |
26.6 |
|
Rabi |
5.4 |
7.1 |
7.3 |
8.6 |
8.8 |
|
Pulses |
14.9 |
13.1 |
13.4 |
14.2 |
15.5 |
|
|
Kharif |
6.2 |
4.7 |
4.9 |
4.7 |
5.5 |
5.5 |
|
Rabi |
8.7 |
8.4 |
8.5 |
9.5 |
10.0 |
|
Total Foodgrains |
213.2 |
198.4 |
208.6 |
216.1 |
221.5 |
|
|
Kharif |
117.0 |
103.3 |
109.9 |
110.5 |
114.2 |
112.2 |
|
Rabi |
96.2 |
95.1 |
98.7 |
105.6 |
107.3 |
|
Total Oilseeds |
25.2 |
24.4 |
28.0 |
23.9 |
30.0 |
|
|
Kharif |
16.7 |
14.1 |
16.8 |
13.9 |
18.5 |
16.1 |
|
Rabi |
8.5 |
10.2 |
11.2 |
9.9 |
11.5 |
|
Sugarcane |
233.9 |
237.1 |
281.2 |
345.3 |
310.0 |
345.6 |
Cotton # |
13.7 |
16.4 |
18.5 |
22.7 |
22.0 |
22.9 |
Jute and Mesta ## |
11.2 |
10.3 |
10.8 |
11.3 |
11.0 |
11.3 |
T : Target. A : Achievement.
@ : First Advance Estimate for Kharif
Production (September 19, 2007). * : Fourth Advance Estimates.
# : Million bales of 170 kgs each. ## : Million bales of 180 kgs each.
Source : Ministry of Agriculture, Government of India. |
19.7 million tonnes, which were higher by 5.7 per cent than a year ago (18.7 million tonnes). Commodity-wise, the stock of rice (10.7 million tonnes) was lower by 14.9 per cent than that of the previous year (12.5 million tonnes), while the stock of wheat (9.0 million tonnes) was 50.6 per cent higher than that of the previous year (6.0 million tonnes) (Table 2).
Industrial Performance
Growth in the index of industrial production (IIP) moderated to 9.2 per cent during April-November 2007 from 10.9 per cent during April-November 2006 (Chart 2).
Table 5: Management of Food Stocks |
(Million tonnes) |
|
Opening Stock of Foodgrains |
Procurement of Foodgrains |
Foodgrains Off-take |
Closing |
Norms |
Month |
Rice |
Wheat |
Total |
Rice |
Wheat |
Total |
PDS |
OWS |
OMS |
Exports- Domestic |
Total |
Stock |
|
1 |
2 |
3 |
4 |
5 |
6 |
7 |
8 |
9 |
10 |
11 |
12 |
13 |
14 |
2004-05 |
13.1 |
6.9 |
20.7 |
24.0 |
16.8 |
40.8 |
29.7 |
10.6 |
0.2 |
1.0 |
41.5 |
18.0 |
|
2005-06 |
13.3 |
4.1 |
18.0 |
26.9 |
14.8 |
41.7 |
31.4 |
9.8 |
1.1 |
0.0 |
42.2 |
16.6 |
|
2006-07 |
13.7 |
2.0 |
16.6 |
26.7 |
9.2 |
35.9 |
31.6 |
5.1 |
0.0 |
0.0 |
36.8 |
17.8 |
|
2006-07# |
13.7 |
2.0 |
16.6 |
20.4 |
9.2 |
29.6 |
18.4 |
3.1 |
0.0 |
0.0 |
21.5 |
|
|
2007-08# |
13.2 |
4.6 |
17.8 |
18.9 |
11.1 |
30.1 |
19.3 |
2.1 |
0.0 |
0.0 |
21.4 |
|
|
2006 |
April |
13.7 |
2.0 |
16.6 |
1.7 |
8.7 |
10.3 |
2.5 |
0.3 |
0.0 |
0.0 |
2.8 |
22.8 |
16.2 |
May |
12.8 |
9.0 |
22.8 |
1.6 |
0.6 |
2.2 |
2.5 |
0.4 |
0.0 |
0.0 |
3.0 |
22.3 |
|
June |
12.0 |
9.3 |
22.3 |
1.5 |
0.0 |
1.5 |
2.5 |
0.6 |
0.0 |
0.0 |
3.1 |
20.5 |
|
July |
11.1 |
8.2 |
20.5 |
0.8 |
0.0 |
0.8 |
2.7 |
0.4 |
0.0 |
0.0 |
3.1 |
17.1 |
26.9 |
August |
9.5 |
7.3 |
17.1 |
0.5 |
0.0 |
0.5 |
2.7 |
0.4 |
0.0 |
0.0 |
3.1 |
15.5 |
|
September |
7.8 |
6.7 |
15.5 |
0.2 |
0.0 |
0.2 |
2.3 |
0.5 |
0.0 |
0.0 |
2.8 |
12.6 |
|
October |
6.0 |
6.4 |
12.6 |
8.0 |
0.0 |
8.0 |
2.4 |
0.3 |
0.0 |
0.0 |
2.7 |
18.7 |
16.2 |
November |
12.5 |
6.0 |
18.7 |
2.0 |
0.0 |
2.0 |
2.5 |
0.4 |
0.0 |
0.0 |
2.9 |
17.8 |
|
December |
12.1 |
5.6 |
17.8 |
2.6 |
0.0 |
2.6 |
2.6 |
0.3 |
0.0 |
0.0 |
3.0 |
17.5 |
|
2007 |
January |
12.0 |
5.4 |
17.5 |
4.3 |
0.0 |
4.3 |
2.7 |
0.4 |
0.0 |
0.0 |
3.1 |
18.1 |
20.0 |
February |
12.6 |
5.4 |
18.1 |
2.4 |
0.0 |
2.4 |
2.7 |
0.5 |
0.0 |
0.0 |
3.1 |
19.1 |
|
March |
14.0 |
5.1 |
19.1 |
1.2 |
0.0 |
1.2 |
2.7 |
0.5 |
0.0 |
0.0 |
3.2 |
17.8 |
|
April |
13.2 |
4.6 |
17.8 |
0.9 |
7.9 |
8.7 |
2.5 |
0.2 |
0.0 |
0.0 |
2.8 |
25.1 |
16.2 |
May |
13.5 |
11.6 |
25.1 |
1.5 |
2.6 |
4.0 |
2.8 |
0.2 |
0.0 |
0.0 |
3.0 |
25.9 |
|
June |
12.6 |
13.3 |
25.9 |
1.3 |
0.7 |
2.0 |
2.7 |
0.4 |
0.0 |
0.0 |
3.1 |
23.9 |
|
July |
11.0 |
12.9 |
23.9 |
0.8 |
0.0 |
0.8 |
2.9 |
0.4 |
0.0 |
0.0 |
3.3 |
21.2 |
26.9 |
August |
9.2 |
12.0 |
21.2 |
0.1 |
0.0 |
0.1 |
2.8 |
0.3 |
0.0 |
0.0 |
3.1 |
18.0 |
|
September |
6.9 |
11.0 |
18.0 |
0.0 |
0.1 |
0.1 |
2.7 |
0.3 |
0.0 |
0.0 |
3.0 |
15.6 |
|
October |
5.5 |
10.1 |
15.6 |
7.4 |
0.0 |
7.4 |
2.7 |
0.3 |
0.0 |
0.0 |
3.0 |
19.7 |
16.2 |
November |
10.7 |
9.0 |
19.7 |
1.8 |
0.0 |
1.8 |
|
|
|
|
|
|
|
|
_ |
_ |
_ |
|
|
|
_ |
_ |
_ |
_ |
_ |
_ |
|
December |
|
|
|
3.5 |
0.0 |
3.5 |
|
|
|
|
|
|
|
|
_ |
_ |
_ |
|
|
|
_ |
_ |
_ |
_ |
_ |
_ |
|
January * |
|
|
|
1.6 |
0.0 |
1.6 |
|
|
|
|
|
|
|
PDS: Public Distribution System. OWS: Other Welfare Schemes. OMS : Open Market Sales.
_ : Not Available.
# : Procurement up to January 9, and offtake up to October 31.
*: Procurement up to January 9, 2008.
Note : Closing stock figures may differ from those arrived at by adding the opening stocks and procurement and deducting offtake, as stocks include coarse grains also.
Source : Ministry of Consumer Affairs, Food and Public Distribution, Government of India. |
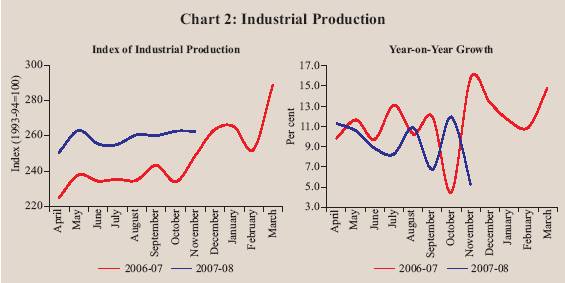
The manufacturing sector recorded a lower growth of 9.8 per cent during April-November 2007 as compared with 11.8 per cent during April-November 2006. Mining sector recorded a growth of 4.9 per cent as compared with 4.2 per cent, while the electricity sector moderated to 7.0 per cent as compared with 7.3 per cent during April-November 2006 (Table 6).
Table 6: Index of Industrial Production: Sectoral and Use-Based Classification of Industries |
(Per cent) |
Industry Group |
Weight in IIP |
Growth Rate |
Weighted Contribution# |
|
|
April-March |
April-November |
April-March |
April-November |
|
|
2006-07 |
2006-07 |
2007-08 P |
2006-07 |
2006-07 |
2007-08 P |
1 |
2 |
3 |
4 |
5 |
6 |
7 |
8 |
Sectoral |
|
|
|
|
|
|
|
Mining |
10.5 |
5.3 |
4.2 |
4.9 |
3.4 |
2.8 |
3.6 |
Manufacturing |
79.4 |
12.5 |
11.8 |
9.8 |
91.1 |
91.2 |
89.9 |
Electricity |
10.2 |
7.3 |
7.3 |
7.0 |
5.5 |
6.0 |
6.6 |
Use-Based |
|
|
|
|
|
|
|
Basic Goods |
35.6 |
10.3 |
9.4 |
8.4 |
27.2 |
26.8 |
27.6 |
Capital Goods |
9.3 |
18.2 |
17.4 |
20.8 |
17.6 |
17.1 |
25.4 |
Intermediate Goods |
26.5 |
12.0 |
11.1 |
10.1 |
27.0 |
27.2 |
29.3 |
Consumer Goods (a+b) |
28.7 |
10.1 |
9.9 |
5.2 |
28.5 |
29.2 |
18.0 |
a) Consumer Durables |
5.4 |
9.2 |
12.4 |
-1.7 |
6.7 |
9.7 |
-1.6 |
b) Consumer Non-durables |
23.3 |
10.4 |
8.9 |
7.8 |
21.8 |
19.4 |
19.7 |
General |
100.0 |
11.5 |
10.9 |
9.2 |
100.0 |
100.0 |
100.0 |
P : Provisional.
# : Figures may not add up to 100 due to rounding off.
Source: Central Statistical Organisation. |
The moderation in manufacturing sector growth was due to decelerated/ negative growth of eleven out of the seventeen manufacturing industry groups accounting for 49.3 per cent weight in the IIP (Table 7). These, among others, included 'machinery and equipment', 'basic metal and alloy industries', 'rubber, plastic, petroleum and coal products','cotton textiles', 'non-metallic mineral products', and 'transport equipment and parts'. 'Metal products and parts' group recorded a decline due to the perfomance of tin metal containers, welded link chains and razor blades. The 'leather and leather and fur products' group, however, made a turnaround to register positive growth during the period.
In terms of use-based classification, the capital and intermediate goods sectors recorded double digit growth during April-November 2007 (see Table 6).
Table 7: Growth of Manufacturing Groups |
(Per cent) |
Industry Group |
Weight in IIP |
Growth Rate |
Weighted
Contribution# |
|
|
|
April-March |
April-November |
April-March |
April-November |
|
|
|
2006-07 |
2006-07 |
2007-08P |
2006-07 |
2006-07 |
2007-08
P |
1 |
|
2 |
3 |
4 |
5 |
6 |
7 |
8 |
1. |
Food products |
9.1 |
8.7 |
2.5 |
6.8 |
5.7 |
1.5 |
4.4 |
2. |
Machinery and equipment |
|
|
|
|
|
|
|
|
other than transport equipment |
9.6 |
14.2 |
15.0 |
12.2 |
18.2 |
20.0 |
20.3 |
3. |
Chemicals and chemical products |
|
|
|
|
|
|
|
|
except products of petroleum and coal |
14.0 |
9.4 |
9.2 |
9.4 |
15.0 |
16.0 |
19.3 |
4. |
Basic metal and alloy Industries |
7.5 |
22.9 |
20.5 |
15.6 |
16.6 |
15.8 |
15.7 |
5. |
Wood and wood products, |
|
|
|
|
|
|
|
|
furniture and fixtures |
2.7 |
29.1 |
2.4 |
72.6 |
2.4 |
0.2 |
7.4 |
6. |
Rubber, plastic, petroleum |
|
|
|
|
|
|
|
|
and coal products |
5.7 |
12.9 |
12.0 |
10.8 |
6.4 |
6.4 |
6.9 |
7. |
Non-metallic mineral products |
4.4 |
12.9 |
13.6 |
8.4 |
6.6 |
7.4 |
5.6 |
8. |
Beverages, tobacco and related |
|
|
|
|
|
|
|
|
products |
2.4 |
11.1 |
13.1 |
9.5 |
4.5 |
5.7 |
5.1 |
9. |
Cotton textiles |
5.5 |
14.8 |
13.1 |
5.5 |
4.8 |
4.7 |
2.4 |
10. |
Transport equipment and parts |
4.0 |
15.0 |
16.3 |
2.7 |
8.2 |
9.5 |
2.0 |
11. |
Textile products |
|
|
|
|
|
|
|
|
(including wearing apparel) |
2.5 |
11.5 |
12.2 |
4.9 |
3.2 |
3.7 |
1.8 |
12. |
Leather and leather and fur products |
1.1 |
0.4 |
-3.4 |
12.2 |
0.0 |
-0.3 |
1.1 |
13. |
Metal products and parts |
|
|
|
|
|
|
|
|
(except machinery and equipment) |
2.8 |
11.4 |
7.0 |
-4.4 |
2.3 |
1.5 |
-1.1 |
14. |
Jute and other vegetable |
|
|
|
|
|
|
|
|
fibre textiles (except cotton) |
0.6 |
-15.8 |
2.3 |
13.3 |
-0.4 |
0.1 |
0.4 |
15. |
Wool, silk and man-made |
|
|
|
|
|
|
|
|
fibre textiles |
2.3 |
8.1 |
7.6 |
4.5 |
1.9 |
2.0 |
1.4 |
16. |
Paper and paper products |
|
|
|
|
|
|
|
|
and printing, publishing and |
|
|
|
|
|
|
|
|
allied activities |
2.7 |
8.4 |
8.9 |
1.6 |
2.3 |
2.5 |
0.5 |
17. |
Other manufacturing industries |
2.6 |
7.7 |
10.8 |
19.1 |
2.4 |
3.4 |
7.2 |
|
Manufacturing - Total |
79.4 |
12.5 |
11.8 |
9.8 |
100.0 |
100.0 |
100.0 |
P : Provisional. # : Figures may not add up to 100 due to rounding off.
Source: Central Statistical Organisation. |
The sustained high growth in the capital goods sector was driven by increased capital expenditure undertaken by manufacturing firms to augment their production capacities. Growth in the intermediate goods sector was driven by increased production of particle board, plywood commercial, PVC pipes and tubes and metalise bopp films. Growth of the consumer goods sector decelerated to 5.2 per cent during April-November 2007 from 9.9 per cent during April-November 2006 _ largely reflecting the sharp decline in the consumer durables segment. The negative growth in the consumer durables was on account of decline in production of telephone instruments, T.V. receiver, motorcycles, etc. The growth of the basic goods sector moderated to 8.4 per cent during April-November 2007 from 9.4 per cent during April-November 2006 due to decelerated growth in the cement sector and some aluminium and steel products.
Infrastructure
During April-November 2007, the infrastructure sector recorded a lower growth of 6.0 per cent than a year ago (8.9 per cent) reflecting slow down in all the sectors (Chart 3). High base, decline in refinery output in some public sector refineries and lower capacity utilisation led to the moderation in growth of petroleum refinery products. A sharp deceleration in crude oil production was attributable to decline in production in some of the Oil and Natural Gas Corporation (ONGC) and Oil India Limited wells. Lower growth in the coal sector was mainly on account of decline in production in some of the subsidiaries of Coal India Limited. Capacity constraints faced by major steel producers combined with high base slowed down the growth of the steel sector. High base coupled with capacity constraints have led to moderation in cement sector. 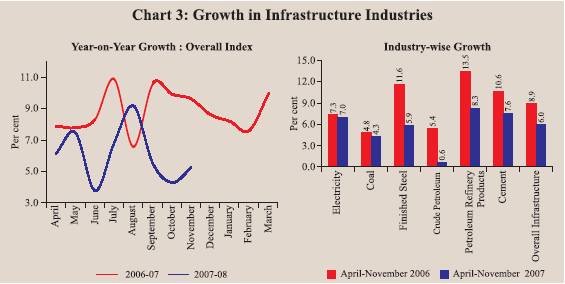
Table 8 : Growth in Services Sectors |
(Contribution to real GDP growth; percentage points) |
Year/Quarter |
Construction |
Trade, Hotels, |
Financing, Insurance, |
Community, Social |
Total |
|
|
Transport and Communication |
Real Estate and Business Services |
and Personal Services |
Services |
1 |
2 |
3 |
4 |
5 |
6 |
2000-01 |
0.4 |
1.6 |
0.5 |
0.7 |
3.2 |
2001-02 |
0.2 |
2.0 |
0.9 |
0.6 |
3.8 |
2002-03 |
0.5 |
2.1 |
1.1 |
0.6 |
4.2 |
2003-04 |
0.7 |
2.9 |
0.8 |
0.8 |
5.2 |
2004-05 |
0.9 |
2.7 |
1.2 |
1.1 |
5.9 |
2005-06 |
0.9 |
2.7 |
1.5 |
1.1 |
6.2 |
2006-07 |
0.7 |
3.4 |
1.5 |
1.1 |
6.7 |
2006-07: Q1 |
0.7 |
3.2 |
1.5 |
1.6 |
7.0 |
2006-07: Q2 |
0.8 |
3.7 |
1.6 |
1.3 |
7.4 |
2006-07: Q3 |
0.7 |
3.3 |
1.4 |
0.9 |
6.3 |
2006-07: Q4 |
0.8 |
3.4 |
1.3 |
0.8 |
6.2 |
2007-08: Q1 |
0.7 |
3.1 |
1.6 |
1.1 |
6.5 |
2007-08: Q2 |
0.8 |
3.1 |
1.6 |
1.2 |
6.6 |
Services Sector
During the first half of 2007-08, the services sector continued to record double digit growth of 10.5 per cent, though lower than that of 11.6 per cent growth during the corresponding period of the previous year. The services sector continued to be the main driver of growth of the economy, contributing 72.1 per cent to real GDP growth. Services sector activity was led by the sub-sector 'trade, hotel, transport and communication' which contributed nearly 47.5 per cent to growth in services sector during the first half of 2007-08 (Table 8). The 'construction' sub-sector grew by 11.1 per cent during the second quarter of 2007-08, thereby recording double digit growth for eighteen consecutive quarters.
Leading indicators of service sector activity for April-October 2007 show that growth rates in revenue earning freight traffic of the railways, commercial vehicles production, new cell phone connections, passengers handled by civil aviation at domestic terminals, cement and steel moderated albeit over a high base (Table 9).
Aggregate Demand
Growth of the Indian economy continued to be driven by domestic demand, particularly gross fixed capital formation (GFCF). While private final consumption demand contributed 36.3 per cent to the incremental growth in real GDP during July-September 2007 (34.9 per cent during July-September 2006), the contribution of real GFCF was 49.4 per cent (34.6 per cent a year ago). The growth rate of private final consumption expenditure (PFCE) was estimated at 5.6 per cent in the second quarter of 2007-08 as compared with 6.3 per cent in the
Table 9: Indicators of Service Sector Activity |
(Growth rates in per cent) |
Sub-sector |
2005-06 |
2006-07 |
April-November |
|
|
|
2006 |
2007 |
1 |
2 |
3 |
4 |
5 |
Tourist arrivals |
12.4 |
13.6 |
12.2 |
11.9 |
Commercial vehicles production # |
10.6 |
33.0 |
29.5 * |
5.3 * |
Railway revenue earning freight traffic |
10.7 |
9.2 |
10.1 |
8.0 |
New cell phone connections |
89.4 |
85.4 |
121.0 |
44.6 |
Cargo handled at major ports |
10.4 |
9.5 |
8.0 |
13.1 |
Civil aviation |
|
|
|
|
a) Export cargo handled |
7.3 |
3.6 |
4.6 |
0.2 |
b) Import cargo handled |
15.8 |
19.4 |
19.8 |
22.3 |
c) Passengers handled at international terminals |
12.8 |
12.1 |
11.7 |
13.4 |
d) Passengers handled at domestic terminals |
27.1 |
34.0 |
37.4 |
25.9 |
Cement * * |
10.7 |
9.1 |
10.6 |
7.6 |
Steel * * |
10.8 |
8.0 |
11.6 |
5.9 |
Aggregate deposits |
18.1 |
23.7 |
13.2 @ |
14.6 @ |
Non-food credit |
31.8 |
28.4 |
17.5 @ |
11.8 @ |
* : April-October. @: Up to January 4, 2008.
# : Leading indicator for transportation.
* * : Leading indicators for construction.
Source: Ministry of Tourism, Ministry of Commerce and Industry, Ministry of Statistics and Programme Implementation, Reserve Bank of India and Centre for Monitoring Indian Economy. |
corresponding quarter of 2006-07. The growth rate of real GFCF accelerated to 15.2 per cent from 13.3 per cent in the corresponding period of 2006-07 (Table 10). The expenditure composition of real GDP indicates a decline in the share of real PFCE to 55.2 per cent in the second quarter of 2007-08 from 56.9 per cent in the corresponding period of 2006-07. On the other hand, share of real GFCF, as per cent to GDP, increased to 30.3 per cent from 28.6 per cent.
Table 10: Disposition of National Income (At 1999-2000 prices) |
(Growth rates in per cent) |
Item |
2005-06 |
2006-07 |
2006-07 |
2007-08 |
2006-07 |
2007-08 |
|
QE |
RE |
Q1 |
Q2 |
Q3 |
Q4 |
Q1 |
Q2 |
April-September |
1 |
2 |
3 |
4 |
5 |
6 |
7 |
8 |
9 |
10 |
11 |
1. Total Final Consumption Expenditure |
7.2 |
6.6 |
11.8 |
3.7 |
5.1 |
6.1 |
6.5 |
6.5 |
7.8 |
6.5 |
|
a)Private Final Consumption |
|
|
|
|
|
|
|
|
|
|
|
Expenditure (PFCE) |
6.7 |
6.2 |
6.5 |
6.3 |
6.0 |
6.0 |
5.6 |
5.6 |
6.4 |
5.6 |
|
b)Government Final Consumption |
|
|
|
|
|
|
|
|
|
|
|
Expenditure |
9.8 |
9.0 |
47.6 |
-9.7 |
0.4 |
6.6 |
10.5 |
12.0 |
15.8 |
11.1 |
2. Gross Fixed Capital Formation (GFCF) |
15.3 |
14.6 |
15.8 |
13.3 |
15.5 |
14.1 |
15.9 |
15.2 |
14.5 |
15.5 |
3. Change in Stocks |
69.0 |
10.2 |
10.2 |
10.6 |
9.7 |
10.3 |
8.4 |
8.6 |
10.4 |
8.5 |
4. Valuables |
0.4 |
38.0 |
38.4 |
47.1 |
29.8 |
37.8 |
10.5 |
19.6 |
42.5 |
15.0 |
5. Exports |
5.9 |
8.6 |
10.3 |
18.9 |
-1.9 |
8.7 |
5.5 |
4.4 |
14.4 |
5.0 |
6. Imports |
10.3 |
11.4 |
11.7 |
18.7 |
4.8 |
11.3 |
16.1 |
-0.5 |
15.1 |
7.9 |
Memo: |
|
|
|
|
|
|
|
|
|
|
Real GDP at market prices |
9.2 |
9.4 |
8.1 |
10.7 |
9.0 |
9.6 |
9.2 |
8.8 |
9.4 |
9.0 |
QE: Quick Estimates. RE: Revised Estimates.
Source : Central Statistical Organisation. |
Corporate Performance
The performance of non-government non-financial companies slowed somewhat in the two quarters of 2007-08 (Table 11). Sales during the second quarter of 2007-08 grew by 16.0 per cent as compared with 29.2 per cent in second quarter of 2006-07. The growth in net profits moderated sharply to 22.7 per cent from 49.4 per cent a year ago. The growth in gross profits at 22.1 per cent during the second quarter of 2007-08 was the lowest in the last six quarters.
Business Expectation Survey
Despite continued strength in domestic fundamentals, business confidence indices compiled by various agencies indicate some softening of sentiment against the backdrop of elevated international crude oil prices and global uncertainties (Table 12).
According to the latest business confidence survey conducted by the Federation of Indian Chambers of Commerce and Industry (FICCI) in December 2007, the overall business confidence index during October 2007-March 2008 declined both over the previous quarter and over a year ago, reflecting mainly concerns
Table 11: Corporate Financial Performance |
(Growth rates in per cent) |
Item |
2005-06 |
2006-07 |
2006-07 |
2007-08 |
2006-07 |
2007-08 |
|
|
|
April-September |
Q1 |
Q2 |
Q3 |
Q4 |
Q1 |
Q2 |
1 |
2 |
3 |
4 |
5 |
6 |
7 |
8 |
9 |
10 |
11 |
Sales |
16.3 |
26.2 |
27.4 |
17.4 |
25.6 |
29.2 |
30.3 |
22.5 |
19.2 |
16.0 |
Total Expenditure |
16.7 |
23.5 |
25.6 |
16.9 |
24.6 |
26.6 |
26.9 |
19.5 |
19.3 |
15.5 |
Depreciation |
8.1 |
15.4 |
16.1 |
15.1 |
14.9 |
16.4 |
16.8 |
18.1 |
18.1 |
15.8 |
Gross Profits |
24.6 |
41.5 |
39.8 |
28.1 |
33.9 |
45.9 |
51.8 |
39.2 |
28.6 |
22.1 |
Interest Payments |
-2.0 |
17.4 |
20.8 |
10.1 |
19.9 |
18.0 |
11.9 |
32.3 |
4.4 |
18.4 |
Profits After Tax |
32.8 |
45.2 |
41.6 |
31.1 |
34.7 |
49.4 |
59.5 |
39.6 |
33.9 |
22.7 |
Select Ratios |
(Per cent) |
Gross Profits to Sales |
12.2 |
15.6 |
15.6 |
16.9 |
15.6 |
15.9 |
15.8 |
15.3 |
16.7 |
16.6 |
Profits After Tax to Sales |
8.2 |
10.7 |
10.6 |
11.7 |
10.6 |
11.0 |
11.0 |
10.6 |
11.6 |
11.5 |
Interest to Sales |
2.2 |
2.1 |
2.2 |
2.0 |
2.2 |
2.0 |
2.0 |
2.0 |
2.0 |
2.1 |
Interest to Gross Profits |
18.1 |
13.3 |
14.1 |
11.9 |
13.9 |
12.8 |
12.5 |
13.0 |
11.7 |
12.6 |
Interest Coverage(Times) |
5.5 |
7.5 |
7.1 |
8.4 |
7.2 |
7.8 |
8.0 |
7.7 |
8.5 |
7.9 |
Memo: |
(Amount in Rs. crore) |
No. of Companies |
2,730 |
2,388 |
2,053 |
2,082 |
2,228 |
2,263 |
2,258 |
2,356 |
2,342 |
2,228 |
Sales |
7,35,216 |
10,41,894 |
4,24,565 |
5,36,358 |
2,34,610 |
2,51,125 |
2,60,064 |
2,94,223 |
2,80,814 |
2,97,110 |
Expenditure |
6,43,826 |
8,72,168 |
3,53,505 |
4,45,086 |
1,95,556 |
2,09,437 |
2,16,053 |
2,48,740 |
2,34,596 |
2,47,425 |
Depreciation Provision |
28,961 |
37,095 |
15,710 |
19,347 |
8,449 |
8,892 |
9,172 |
10,338 |
10,173 |
10,576 |
Gross Profits |
90,179 |
1,62,017 |
66,265 |
90,472 |
36,567 |
40,041 |
41,169 |
45,108 |
46,925 |
49,228 |
Interest Payments |
16,302 |
21,500 |
9,358 |
10,760 |
5,083 |
5,121 |
5,162 |
5,862 |
5,504 |
6,194 |
Profits After Tax |
60,236 |
1,11,107 |
44,927 |
62,846 |
24,845 |
27,710 |
28,698 |
31,251 |
32,699 |
34,266 |
Notes:
1. Data for 2005-06 are based on audited balance sheet, while those for 2006-07 and 2007-08 are based on abridged financial results of the select non-Government non-financial public limited companies.
2. Growth rates are per cent changes in the level for the period under reference over the corresponding period of the previous year for common set of companies.
3. The quarterly data may not add up to annual data due to differences in the number and composition of companies covered in each period. |
Table 12: Business Expectations Surveys |
(Per cent) |
Agency |
Business Expectations |
Growth over a year ago |
Growth over |
|
Period |
Index |
|
previous round |
1 |
2 |
3 |
4 |
5 |
NCAER |
October 2007-March 2008 |
Business Confidence Index |
-4.3 |
5.8 |
FICCI |
October 2007-March 2008 |
Business Confidence Index |
-15.1 |
-10.5 |
RBI |
January-March 2008 |
Business Expectation Index |
-6.2 |
-4.7 |
Dun & Bradstreet |
January-March 2008 |
Business Optimism Index |
-13.2 |
-12.6 |
over rupee appreciation, hardening of interest rates, rising cost of raw materials, particularly oil, and global uncertainties. Fifty-three per cent of the respondents who participated in the survey indicated the current overall economic conditions to be 'moderately to substantially better' than in the preceding six months as against 70 per cent reported in the last survey.
According to the survey by the National Council of Applied Economic Research (NCAER) conducted in October 2007, the overall business confidence index (BCI) for the next six months declined on a year-on-year basis, but improved over the previous round of the survey. A component-wise analysis shows that while expectation about present capacity utilisation (being close to or above optimal level) registered a marginal decline, the other three major components, viz., overall economic conditions, investment climate, financial position of the firms recorded an improvement over the previous round. Amongst the various industry sectors, the maximum gain in business confidence was noticed in the capital goods and services sectors, while the minimum gain was expected in the consumer non-durable sector.
According to the Reserve Bank's latest Industrial Outlook Survey, the business expectations indices based on assessment for October-December 2007 and on expectations for January-March 2008 declined by 2.5 per cent and 4.7 per cent, respectively, over the previous quarters.
The decline in expectations index for January-March 2008 emanated from lower net responses for major parameters of the survey such as the overall business situation, availability of finance, production, order books, capacity utilisation, employment, exports and profit margins over the previous quarter (Table 13 and Chart 4).
Purchasing Managers’ Index
The ABN-AMRO Purchasing Managers' Index (PMI), which provides the indicators related to the performance of the manufacturing sector, however, rose by 1.6 per cent in December 2007 over the preceding month, signalling a marked improvement in the health of the Indian manufacturing sector. The rise in the PMI was underpinned by sharp increases in new business volumes and a marked expansion of production. Employment levels and stocks of purchases also continued to rise. The seasonally adjusted Output Index increased by 0.6 per cent in
Table 13: Reserve Bank's Survey - Net Response on 'A Quarter Ahead' |
Expectations About the Industrial Performance |
(Per cent) |
Parameter |
Response |
Oct- |
Jan- |
Apr- |
July- |
Oct- |
Jan- |
|
|
|
Dec. |
March |
June |
Sept |
Dec. |
Mar |
|
|
|
2006 |
2007 |
2007 |
2007 |
2007 |
2008 |
1 |
|
2 |
3 |
4 |
5 |
6 |
7 |
8 |
1. |
Overall business situation |
Better |
51.8 |
53.7 |
51.7 |
49.5 |
50.2 |
47.7 |
|
|
|
(41.2) |
(40.7) |
(43.3) |
(41.2) |
(42.1) |
(42.9) |
2. |
Financial situation |
Better |
41.9 |
44.5 |
43.8 |
41.3 |
40.1 |
40.3 |
|
|
|
(50.6) |
( 49.9) |
(49.8) |
(49.8) |
(51.3) |
(50.3) |
3. |
Working capital finance requirement |
Increase |
35.4 |
36.2 |
35.3 |
34.5 |
32.2 |
34.7 |
|
|
|
(58.3) |
(59.2) |
(59.2) |
(59.2) |
(62.6) |
(60.3) |
4. |
Availability of finance |
Improve |
33.4 |
36.2 |
35.2 |
32.1 |
33.8 |
31.1 |
|
|
|
(57.8) |
(56.6) |
(57.2) |
(58.6) |
(58.8) |
(59.5) |
5. |
Production |
Increase |
49.7 |
50.7 |
47.8 |
46.6 |
49.0 |
43.9 |
|
|
|
(39.6) |
(40.1) |
(41.6) |
(41.1) |
(40.9) |
(42.3) |
6. |
Order books |
Increase |
46.3 |
47.3 |
45.7 |
43.6 |
44.1 |
37.1 |
|
|
|
(42.6) |
(43.1) |
(45.4) |
(46.1) |
(46.0) |
(48.6) |
7. |
Pending orders, if applicable |
Below normal |
-2.1 |
-2.7 |
-2.2 |
2.2 |
-3.5 |
0.4 |
|
|
|
(81.7) |
(82.9) |
(82.8) |
(82.6) |
(82.4) |
(80.2) |
8. |
Cost of raw material |
Decrease |
-49.2 |
-41.7 |
-42.1 |
46.0 |
-42.4 |
-44.1 |
|
|
|
(46.4) |
(51.0) |
(52.0) |
(49.7) |
(51.0) |
(49.2) |
9. |
Inventory of raw material |
Below average |
-6.1 |
-7.1 |
-7.3 |
5.4 |
-6.3 |
-7.3 |
|
|
|
(83.5) |
(83.8) |
(85.0) |
(85.0) |
(85.0) |
(84.8) |
10. |
Inventory of finished goods |
Below average |
-4.9 |
-5.2 |
-4.4 |
2.7 |
-3.5 |
-4.5 |
|
|
|
(83.5) |
(84.5) |
(85.2) |
(87.1) |
(86.4) |
(86.1) |
11. |
Capacity utilisation (Main product) |
Increase |
33.2 |
33.3 |
29.4 |
27.0 |
28.4 |
24.2 |
|
|
|
(56.6) |
(57.7) |
(60.4) |
(61.4) |
(61.5) |
(62.3) |
12. |
Level of capacity utilisation |
Above normal |
10.9 |
12.8 |
11.5 |
9.4 |
10.7 |
6.4 |
|
(Compared to the average in |
|
(76.6) |
(76.4) |
(77.1) |
(76.5) |
(77.2) |
(78.3) |
|
the preceding four quarters) |
|
|
|
|
|
|
|
13. |
Assessment of the production capacity |
More than |
5.1 |
4.8 |
4.0 |
3.0 |
4.2 |
4.7 |
|
(With regard to expected demand |
adequate |
(79.7) |
(81.8) |
(82.2) |
(82.2) |
(83.0) |
(83.8) |
|
in the next six months) |
|
|
|
|
|
|
|
14. |
Employment in the company |
Increase |
17.9 |
18.1 |
18.3 |
17.4 |
16.7 |
14.6 |
|
|
|
(73.3) |
(73.7) |
(73.3) |
(73.5) |
(74.1) |
(75.6) |
15. |
Exports, if applicable |
Increase |
34.2 |
32.6 |
33.4 |
32.6 |
31.4 |
24.3 |
|
|
|
(57.2) |
(57.3) |
(56.8) |
(55.6) |
(55.9) |
(58.3) |
16. |
Imports, if any |
Increase |
23.4 |
20.8 |
21.6 |
23.7 |
20.8 |
20.1 |
|
|
|
(68.1) |
(68) |
(68.4) |
(68.2) |
(68.6) |
(70.5) |
17. |
Selling prices are expected to |
Increase |
16.8 |
14.2 |
15.5 |
19.0 |
13.0 |
14.9 |
|
|
|
(68.0) |
(69.2) |
(68.9) |
(67.1) |
(68.5) |
(67.1) |
18. |
If increase expected in selling prices |
Increase at |
14.5 |
10.5 |
12.1 |
10.4 |
3.7 |
13.3 |
|
|
lower rate |
(67.0) |
(68.1) |
(66.7) |
(65.0) |
(58.9) |
(66.7) |
19. |
Profit margin |
Increase |
9.2 |
11.6 |
9.9 |
7.5 |
9.6 |
5.4 |
|
|
|
(60.6) |
(61.7) |
(62.5) |
(62.6) |
(59.6) |
(60.0) |
Notes:
1. 'Net response' is measured as the percentage share differential between the companies reporting 'optimistic' (positive) and 'pessimistic' (negative) responses; responses indicating status quo (no change) are not reckoned. Higher 'net response' indicates higher level of confidence and vice versa.
2. Figures in parentheses are the percentages of respondents with 'no change over the preceding quarter' as responses. |
December 2007 over the preceding month. Reports from the survey panel suggested favourable market conditions, leading to a sharp rise in volumes of incoming new business, and inventory build up. 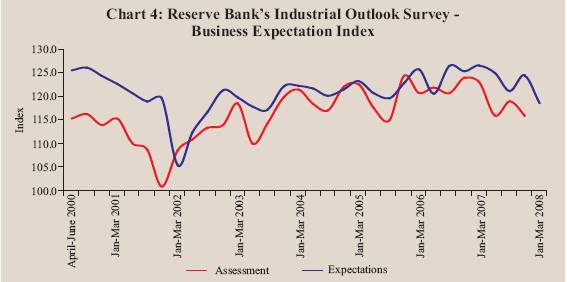
Forecasts by various agencies for real GDP growth in 2007-08 are set out in Table 14.
Table : 14 : Projections of Real GDP for India by various Agencies - 2007-08 |
(per cent) |
Agency |
Latest Projection |
Earlier Projection |
|
Overall
Growth |
Agriculture |
Industry |
Services |
Month of
Projection |
Overall
Growth |
Month |
1 |
2 |
3 |
4 |
5 |
6 |
7 |
8 |
ASSOCHAM |
9.0 |
3.5 |
10.0 |
10.5 |
December 2007 |
8.5-8.7 |
August 2007 |
JP Morgan |
8.6 |
2.6 |
9.8 |
10.0 |
September 2007 |
8.0 |
March 2007 |
Merrill Lynch |
8.8 |
4.0 |
9.5 |
10.0 |
September 2007 |
8.5 |
March 2007 |
ICRA |
9.0 |
- |
- |
- |
September 2007 |
8.5 |
April 2007 |
Citigroup |
9.3 |
3.0 |
10.0 |
11.0 |
September 2007 |
9.3 |
April 2007 |
CRISIL |
8.6 |
3.4 |
9.2 |
10.0 |
December 2007 |
7.9-8.4 |
March/ June 2007 |
Indicus Analytics |
8.4 |
2.7 |
8.5 |
10.1 |
October 2007 |
8.4 |
March 2007 |
CMIE |
9.1 |
3.9 |
9.4 |
10.7 |
January 2008 |
9.1 |
December 2007 |
NCAER |
8.9 |
3.8 |
9.0 |
10.6 |
October 2007 |
8.5 |
August 2007 |
Economic Advisory |
|
|
|
|
|
|
|
Council |
8.9 |
3.6 |
9.7 |
10.3 |
January 2008 |
9.0 |
July 2007 |
UNCTAD |
8.5 |
- |
- |
- |
September 2007 |
- |
- |
IMF |
8.9* |
- |
- |
- |
October 2007 |
9.0 * |
July 2007 |
ADB |
8.5 |
- |
- |
- |
September 2007 |
8.0 |
March 2007 |
RBI |
Around 8.5 |
- |
- |
- |
October 2007 |
Around 8.5 |
July 2007 |
- : Not Available.
* : Calendar year. |
|


