The role of aggregate demand in a phase of weakening growth impulses came to the forefront of public policy in 2008-09. The sharp contraction in external demand – as evident in falling global output, employment and global trade – clearly affected India’s export performance. India’s net exports (goods and services) showed a widening of deficit in 2008-09 (April-December) as compared with the previous year. Domestic demand, in the form of both private consumption and investment expenditure moderated, particularly in the third quarter of 2008-09. To offset the impact of the contraction in demand in other sectors of the economy, expanding the government demand became essential. Despite the pressures on the revenue side arising from the growth slowdown, the fiscal stimulus measures in the form of tax cuts and additional expenditure amounted to about 2.9 percent of GDP. Consequently, the targets set for deficits at the beginning of the year could not be attained, thereby necessitating deferment of the mandated deficit targets under the Fiscal Responsibility and Budget Management (FRBM) Act, 2003 by two years. Corporate performance, after being robust for a number of consecutive years, showed signs of moderation in the third quarter of 2008-09. II.1 The economic slowdown during 2008-09 has been associated with a considerable deceleration in investment demand, which had been a major driver of growth in recent years. There was also a marked deceleration in private consumption expenditure. Government final consumption, however, rose on account of the discretionary fiscal stimulus measures undertaken during the third quarter. As a result, key deficit indicators of the Central Government, viz., the revenue deficit and the gross fiscal deficit (GFD) in the revised estimates for 2008-09 were significantly higher than the budgeted level as well as those of the preceding year. Corporate performance remained subdued, with the impact on profitability being particularly adverse during the third quarter. As regards external demand, merchandise trade deficit widened sharply during 2008-09 (April- February) as exports have contracted since October 2008. Imports also contracted since November 2008. However, during 2008-09 (April-February) thedeceleration in export growth was much sharper than that of import growth. After peaking in 2007-08, saving and investment rates are likely to be lower in 2008-09 reflecting the slowdown in economic growth.
Domestic Demand
II.2 The moderation in overall growth during 2008-09 was driven by deceleration in both private consumption expenditure and investment, particularly during the third quarter of the year. The growth of real gross fixed investment decelerated to 5.3 per cent during the third quarter after registering double digit growth in earlier quarters. On the other hand, the growth in Government final consumption expenditure (GFCE) picked up sharply during the third quarter of 2008-09 reflecting the Sixth Pay Commission payout, expenditure on agricultural debt waiver, oil and fertiliser subsidies, and counter-cyclical fiscal measures (Table 9).
Table 9: Disposition of GDP at Market Prices (Base: 1999-2000) - Growth Rates |
(Per cent) |
Item |
2007-08* |
2008-09# |
2007-08 |
2008-09 |
2007-08 |
2008-09 |
Q1 |
Q2 |
Q3 |
Q1 |
Q2 |
Q3 |
April-December |
1 |
2 |
3 |
4 |
5 |
6 |
7 |
8 |
9 |
10 |
11 |
1. |
Total Final Consumption Expenditure |
8.3 |
8.2 |
6.6 |
7.8 |
8.0 |
7.6 |
7.0 |
7.8 |
7.5 |
7.5 |
| |
(i) Private Final Consumption Expenditure |
8.5 |
6.8 |
8.4 |
7.5 |
8.9 |
7.7 |
6.9 |
5.4 |
8.3 |
6.6 |
| |
(ii) Government Final Consumption Expenditure |
7.4 |
16.8 |
-2.4 |
10.0 |
2.0 |
7.1 |
7.9 |
24.6 |
2.7 |
13.3 |
2. |
Gross Fixed Capital Formation |
12.9 |
8.9 |
12.9 |
16.2 |
13.7 |
10.1 |
15.1 |
5.3 |
14.3 |
10.1 |
3. |
Change in Stocks |
51.7 |
36.9 |
54.1 |
51.7 |
52.2 |
-32.0 |
-32.0 |
31.2 |
52.7 |
-10.2 |
4. |
Valuables |
2.7 |
-10.4 |
-8.0 |
1.4 |
16.5 |
29.2 |
22.9 |
-8.9 |
3.5 |
12.5 |
5. |
Exports |
2.1 |
20.8 |
-4.0 |
-4.8 |
6.1 |
23.2 |
10.6 |
11.4 |
-0.9 |
15.5 |
6. |
Less Imports |
6.9 |
27.9 |
-0.7 |
-3.6 |
6.7 |
30.3 |
26.0 |
20.6 |
0.9 |
25.3 |
GDP at 1999-2000 prices |
9.1 |
7.1 |
9.1 |
8.9 |
9.1 |
8.1 |
7.7 |
4.5 |
9.0 |
6.6 |
* : Quick Estimates # : Advance Estimates.
Source: Central Statistical Organisation. |
II.3 The Indian economy continues to be driven by domestic consumption and domestic investment. A noteworthy feature in recent years has been the contribution of gross fixed investment, which has made the growth process more sustainable. During 2008-09 (April-December), the share of private final consumption expenditure (PFCE) in real GDP declined while that of the Government final consumption expenditure (GFCE) increased. The share of gross fixed investment in real GDP, which peaked during the second quarter of 2008-09, declined during the third quarter of the year (Table 10).
Table 10: Disposition of GDP at Market Prices (Base: 1999-2000) - Shares |
(Per cent ) |
Item |
2007-08* |
2008-09# |
2007-08 |
2008-09 |
2007-08 2008-09 |
Q1 |
Q2 |
Q3 |
Q1 |
Q2 |
Q3 |
April-December |
1 |
2 |
3 |
4 |
5 |
6 |
7 |
8 |
9 |
10 |
11 |
1. |
Total Final Consumption Expenditure |
66.9 |
67.6 |
70.4 |
67.2 |
67.4 |
70.1 |
66.8 |
69.5 |
68.3 |
68.8 |
| |
(i) Private Final Consumption Expenditure |
57.2 |
57.0 |
60.1 |
58.5 |
59.0 |
59.8 |
58.0 |
59.5 |
59.2 |
59.1 |
| |
(ii) Government Final Consumption Expenditure |
9.8 |
10.6 |
10.4 |
8.7 |
8.4 |
10.3 |
8.7 |
10.0 |
9.1 |
9.7 |
2. |
Gross Fixed Capital Formation |
31.6 |
32.1 |
31.7 |
33.0 |
30.8 |
32.3 |
35.3 |
31.0 |
31.8 |
32.8 |
3. |
Change in Stocks |
3.1 |
4.0 |
3.3 |
3.2 |
3.0 |
2.1 |
2.1 |
3.7 |
3.1 |
2.7 |
4. |
Valuables |
1.1 |
1.0 |
1.1 |
1.2 |
1.3 |
1.3 |
1.4 |
1.1 |
1.2 |
1.3 |
5. |
Exports |
20.2 |
22.8 |
22.8 |
17.2 |
18.9 |
26.0 |
17.6 |
20.1 |
19.6 |
21.2 |
6. |
Less Imports |
24.6 |
29.4 |
23.6 |
24.2 |
24.0 |
28.4 |
28.3 |
27.7 |
23.9 |
28.1 |
7. |
Discrepancies |
1.5 |
1.8 |
-5.7 |
2.3 |
2.7 |
-3.3 |
5.1 |
2.1 |
-0.1 |
1.4 |
Memo: |
|
|
|
|
|
|
|
|
(Rupees crore) |
Real GDP at market prices |
34,02,716 |
36,44,011 |
7,69,806 |
7,88,864 |
8,99,235 |
8,32,350 |
8,49,407 |
9,39,458 |
24,57,905 |
26,21,215 |
* : Quick Estimates. # : Advance Estimates.
Source : Central Statistical Organisation. |
Combined Budgeted Government Finances: 2008-09
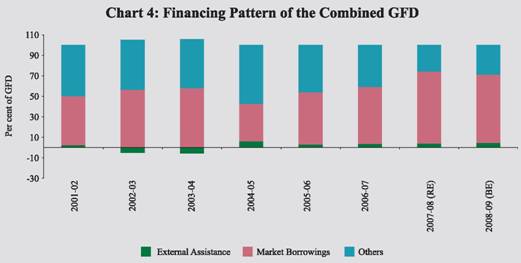
II.4 During 2008-09, the combined finances of the Central and State Governments were adversely impacted by the economic slowdown. This affected the revenue growth and necessitated additional expenditure on fiscal stimulus measures. In respect of the Central Government, the financial position as reflected in the revised estimates for 2008-09 shows sharp increases in major deficit indicators (Table 11). In respect of State Finances, the budgeted revenue surplus is expected to be wiped out due to lower revenue growth. The financing pattern of combined gross fiscal deficit indicates the continued dominance of market borrowing (Chart 4).
Central Government Finances: 2008-09
II.5 The Central Government finances came under pressure during the fiscal year 2008-09. During the first half of 2008-09, fiscal measures such as tax reductions and increased subsidies undertaken to reduce the impact of inflationary pressures caused by increase in global commodity prices (including petroleum products) expanded the revenue deficit and GFD. Fiscal stress continued during the second half of 2008-09 as spillover effect of the global financial crisis on the Indian economy necessitated the introduction of fiscal stimulus measures in the form of tax cuts and additional expenditure with a view to arrest the moderation in growth (Annex 1). The impact of these measures during 2008-09 is estimated to be around 2.9 per cent of GDP. II.6 On account of the disproportionate growth in expenditure coupled with deceleration in revenue receipts, the revenue deficit and GFD in the revised estimates for the year 2008-09 were placed significantly higher than budget estimates, both in absolute terms as well as ratio of GDP (see Table 11). Revenue deficit at 4.4 per cent of GDP in 2008-09 (RE) was 3.4 percentage points higher than that of the budget estimates. Consequently, GFD relative to GDP rose to 6.0 per cent in 2008-09 (RE) from the budget estimates of 2.5 per cent.
Table 11: Key Fiscal Indicators |
(Per cent to GDP) |
Year |
Primary Deficit |
Revenue Deficit |
Gross Fiscal Deficit |
Outstanding Liabilities* |
1 |
2 |
3 |
4 |
5 |
| |
Centre |
2007-08 |
-0.9 |
1.1 |
2.7 |
60.1 |
2008-09 BE |
-1.1 |
1.0 |
2.5 |
56.4 |
2008-09 RE |
2.5 |
4.4 |
6.0 |
57.8 |
2009-10 BE |
1.8 |
4.0 |
5.5 |
56.6 |
| |
States |
2007-08 RE |
0.1 |
-0.5 |
2.3 |
28.3 |
2008-09 BE |
0.1 |
-0.5 |
2.1 |
27.4 |
| |
Combined |
2007-08 RE |
-0.3 |
0.9 |
5.2 |
76.7 |
2008-09 BE |
-0.8 |
0.5 |
4.5 |
71.7 |
RE : Revised Estimates. BE : Budget Estimates.
* : Includes external liabilities at historical exchange rates.
Note : 1. Negative sign indicates surplus.
2. Issuances of oil/fertiliser bonds in 2008-09 amounted to 1.8 per cent of GDP. |
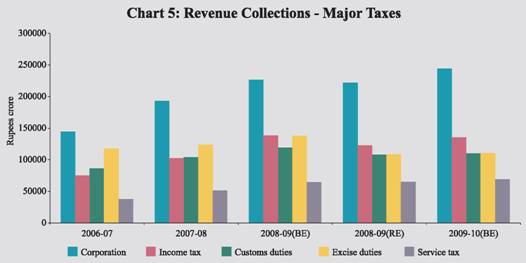
II.7 During 2008-09, the economic slowdown and reduction in tax rates impacted the gross tax revenue, affecting both the net tax revenue of the Centre and the tax revenue transferred to the States. The gross tax revenue in the revised estimates for 2008-09 at Rs.6,27,949 crore was lower by 8.7 per cent than the budget estimates; collections under all major taxes were significantly lower than their budgeted levels (Chart 5). Non-tax revenue was marginally higher than the budget estimates due to a 10.0 per cent increase in ‘other non-tax revenue’ such as economic services, other general services and grants-in-aid and contribution. Major components of non-tax revenue, viz., dividends and profits, and interest receipts, however, declined. Reflecting this, the revenue receipts of the Centre are estimated to be lower than the budget estimates (Table 12).
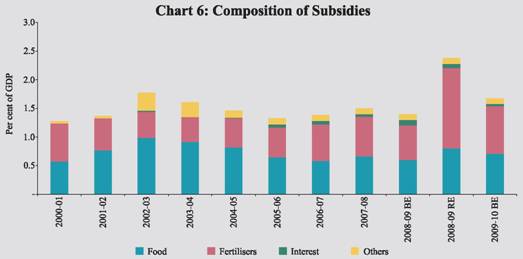
II.8 The aggregate expenditure in the revised estimates for 2008-09 was significantly higher than the budget estimates mainly on account of fiscal stimulus measures aimed at supporting aggregate demand in the economy (Table 13 and Annex 1). Revenue expenditure, which accounted for 96.8 per cent of the increase in aggregate expenditure, was primarily on account of subsidies and defence under the non-plan component and rural development under the plan component. Expenditure on subsidies at Rs.1,29,243 crore (2.4 per cent of GDP) in the revised estimates for 2008-09 was 80.9 per cent higher than the budgeted amount, mainly due to food and fertiliser subsidies exceeding the budget estimates by Rs.10,960 crore (33.6 per cent) and Rs.44,863 crore (144.8 per cent), respectively (Chart 6). Rise in defence revenue expenditure was on account of implementation of the Sixth Pay Commission award for defence personnel. With regard to capital expenditure, while the defence capital outlay declined by Rs.7,007 crore, non-defence capital outlay increased by Rs.5,790 crore.
Table 12: Receipts of the Centre
|
|
(Amount in Rupees crore)
|
Item |
2007-08 (Accounts) |
2008-09 (BE) |
2008-09 (RE) |
Variation (4 over 3) |
Amount |
Per cent |
1 |
2 |
3 |
4 |
5 |
6 |
1. |
Total Receipts (2+3) |
7,12,732 * |
7,50,884 |
9,00,953 |
1,50,069 |
20.0 |
| |
|
(15.1) |
(13.8) |
(16.6) |
|
|
2. |
Revenue Receipts (i+ii) |
5,41,925 |
6,02,935 |
5,62,173 |
-40,762 |
-6.8 |
| |
|
(11.5) |
(11.1) |
(10.4) |
|
|
| |
i) Tax Revenue (Net) |
4,39,547 |
5,07,150 |
4,65,970 |
-41,180 |
-8.1 |
| |
|
(9.3) |
(9.3) |
(8.6) |
|
|
| |
ii) Non-Tax Revenue |
1,02,378 |
95,785 |
96,203 |
418 |
0.4 |
| |
|
(2.2) |
(1.8) |
(1.8) |
|
|
3. |
Capital Receipts |
1,70,807 |
1,47,949 |
3,38,780 |
1,90,831 |
129.0 |
| |
|
(3.6) |
(2.7) |
(6.2) |
|
|
| |
of which: |
|
|
|
|
|
| |
Market Borrowings |
1,30,600 |
99,000 |
2,66,539 |
1,67,539 |
169.2 |
| |
Recoveries of Loans |
5,100 |
4,497 |
9,698 |
5,201 |
115.7 |
| |
Disinvestment proceeds |
38,795 * |
10,165 |
2,567 |
-7,598 |
-74.7 |
RE : Revised Estimates. BE : Budget Estimates.
* : Includes an amount of Rs.34,309 crore on account of transfer of Reserve Bank’s stake in State Bank of India
(SBI) to the Central Government.
Note : Figures in parentheses are percentages to GDP. |
Table 13: Aggregate Expenditure of the Centre
|
|
(Amount in Rupees crore)
|
Item |
2007-08 (Accounts) |
2008-09 (BE) |
2008-09 (RE) |
Variation (4 over 3) |
Amount |
Per cent |
1 |
2 |
3 |
4 |
5 |
6 |
1. |
Total Expenditure (2+3=4+5) |
7,12,732 * |
7,50,884 |
9,00,953 |
1,50,069 |
20.0 |
| |
|
(15.1) |
(13.8) |
(16.6) |
|
|
2. |
Non-Plan Expenditure |
5,07,650 * |
5,07,498 |
6,17,996 |
1,10,498 |
21.8 |
| |
|
(10.7) |
(9.4) |
(11.4) |
|
|
| |
of which: |
|
|
|
|
|
| |
Interest Payments |
1,71,030 |
1,90,807 |
1,92,694 |
1,887 |
1.0 |
| |
|
(3.6) |
(3.5) |
(3.6) |
|
|
| |
Defence Expenditure |
91,681 |
1,05,600 |
1,14,600 |
9,000 |
8.5 |
| |
|
(1.9) |
(1.9) |
(2.1) |
|
|
| |
Subsidies |
70,926 |
71,431 |
1,29,243 |
57,812 |
80.9 |
| |
|
(1.5) |
(1.3) |
(2.4) |
|
|
3. |
Plan Expenditure |
2,05,082 |
2,43,386 |
2,82,957 |
39,571 |
16.3 |
| |
|
(4.3) |
(4.5) |
(5.2) |
|
|
4. |
Revenue Expenditure |
5,94,494 |
6,58,119 |
8,03,446 |
1,45,327 |
22.1 |
| |
|
(12.6) |
(12.1) |
(14.8) |
|
|
5. |
Capital Expenditure |
1,18,238 * |
92,765 |
97,507 |
4,742 |
5.1 |
| |
|
(2.5) |
(1.7) |
(1.8) |
|
|
RE : Revised Estimates. BE : Budget Estimates.
* : Includes acquisition cost of Reserve Bank’s stake in SBI at Rs.35,531 crore. |
Financing of the Central Government
II.9 Gross and net market borrowings (dated securities and 364-day Treasury Bills excluding allocations under the Market Stabilisation Scheme) of the Centre for 2008-09 were budgeted at Rs.1,78,575 crore and Rs.99,000 crore, respectively. In view of the increase in GFD by 2.4 times in the revised estimates over the budgeted level, the net market borrowings (dated securities and 364-day Treasury Bills) were hiked by 2.7 times of the budgeted level to Rs.2,66,539 crore, financing 81.6 per cent of GFD. Apart from market borrowings, short term borrowings (14-day, 91-day and 182-day Treasury Bills) would finance 16.2 per cent of GFD in the revised estimates as compared with 10.5 per cent of GFD in the budget estimates. In the public account, deposits and advances and State provident funds would finance 3.9 per cent and 1.5 per cent, respectively, of GFD in the revised estimates. Reserve funds would negatively contribute 5.1 per cent mainly on account of outflow with respect to railway funds exceeding that of inflow.
Extra-Budgetary Items
II.10 The Central Government has been supporting Food Corporation of India (FCI), fertiliser companies and oil marketing companies through issuance of special bonds in addition to providing explicit subsidies on food, fertiliser and petroleum through the budget. These bonds are considered to be fiscal deficit neutral since they do not involve immediate cash flow and are, therefore, not treated as part of budgetary expenditure/ receipts. However, these bonds have fiscal implications as they carry an obligation to repay at a later date and, hence, add to the fiscal liabilities of the Government. Furthermore, as interest payments on such bonds are treated as part of the revenue expenditure, they affect the revenue deficit and, thereby, the fiscal deficit. II.11 During 2008-09, special bonds amounting to Rs.75,942 crore and Rs.20,000 crore were issued to oil marketing companies and fertiliser companies, respectively, together accounting for 1.8 per cent of the GDP. Repayment of special securities amounted to Rs.13,371 crore (including Rs.13,349 crore for oil bonds) during 2008-09. Taking into account this repayment, the outstanding special securities as at end-March 2009 amounted to Rs.1,99,011 crore (3.7 per cent of GDP).
State Government Finances: 2008-09 II.12 The consolidated fiscal position of the State Governments during 2008-09 was budgeted to register a revenue surplus of 0.54 per cent of GDP. Reflecting the budgeted increase in revenue surplus as well as non-debt capital receipts, the GFD- GDP ratio at the consolidated level was budgeted to decline by 0.2 percentage points to 2.1 per cent (see Table 11). The States, while presenting their budgets for 2008-09, announced a number of policy initiatives aimed at augmenting revenues and directing expenditure towards priority areas. Allocations for agriculture and water conservation were proposed to be raised in 2008-09 by most of the States. All the States proposed higher expenditure on health and education sectors. State Governments also placed emphasis on development of infrastructure with higher allocations for development of roads and urban transport. A few States proposed higher allocations for urban development and housing sectors. They were also undertaking construction of houses for low and middle income group families, slum dwellers and below poverty line families under various schemes, including Indira Awas Yojana and Jawaharlal Nehru National Urban Renewal Mission (JNNURM). A number of State Governments extended their support for providing health as well as life insurance benefits to the poor. Several States also proposed computerisation of treasuries and tax departments.
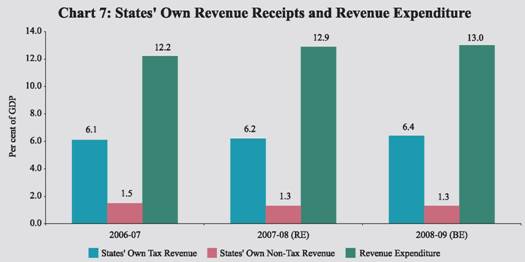
II.13 During 2008-09, the consolidated revenue surplus of the State Government was budgeted to increase primarily through higher growth of the revenue receipts. The increase in revenue receipts in 2008-09 (BE) was indicated to be mainly contributed by States’ own tax revenue and higher devolution and transfers from the Centre. As a ratio to GDP, the States’ own non-tax revenue was to be maintained at previous year’s level of 1.3 per cent (Chart 7). During 2008-09, the growth in revenue expenditure was budgeted to decelerate to 14.1 per cent from 19.9 per cent in the previous year.
II.14 The decomposition of consolidated GFD of all State Governments reveals that capital outlay was budgeted to exceed GFD for the third consecutive year in 2008-09 (BE), which was to be mainly financed by surpluses in the revenue account. The financing pattern of GFD of the State Governments underwent a compositional shift, with the market borrowings emerging as the major source of financing of GFD. In the past few years, special securities issued to the National Small Savings Fund (NSSF) used to be the major source of financing of GFD. Owing to the sharp decline in the collections under small savings, the special securities issued to NSSF financed less than one tenth of GFD in 2007-08 (RE) as compared with nearly three fourths in 2006-07. In 2008-09, the special securities issued to NSSF were budgeted to finance nearly one fifth of GFD, whereas market borrowings were budgeted to finance more than half of the GFD (Table 14). However, the progress during 2008-09 showed that due to a continued shortfall in collection under NSSF, State Governments were allowed to raise additional market borrowings as was done in 2007-08. Details of actual market borrowings of the Central and State Governments for the year 2008-09 are covered in Chapter V.
Central Government Finances: Budget Estimates for 2009-10
II.15 The Union Interim Budget for 2009-10 was presented against the backdrop of global economic slowdown adversely impacting the Indian economy and the consequent need to provide fiscal stimulus to contain the economic slowdown. The buoyancy in revenue collection significantly declined not only due to the economic slowdown but also due to tax rate reduction measures undertaken by the Government to provide stimulus. At the same time, expenditure was stepped up substantially to boost the aggregate demand in the economy.
II.16 Although the adverse impact of economic slowdown on the revenue receipts observed during 2008-09 is expected to persist during 2009-10, there is likely to be some improvement. Accordingly, revenue receipts during 2009-10 are budgeted to increase by 8.4 per cent from 3.7 per cent in 2008-09 (RE). Growth of gross tax revenue at 6.9 per cent would be higher than that of 5.9 per cent in 2008-09. The gross tax revenue relative to GDP would, however, decline further during the year (Table 15). After the announcement of the Interim Budget, the Central Government announced further reductions in indirect tax rates as part of the fiscal stimulus package (see Annex 1), which could impact on the revenue collections.
Table 14: Decomposition and Financing Pattern of GFD of States |
(Per ent) |
Item |
2006-07 (Accounts) |
2007-08 (RE) |
2008-09 (BE) |
1 |
2 |
3 |
4 |
Decomposition (1+2+3-4) |
100.0 |
100.0 |
100.0 |
1. |
Revenue Deficit |
-32.1 |
-20.9 |
-25.2 |
2. |
Capital Outlay |
126.5 |
118.9 |
128.9 |
3. |
Net Lending |
8.0 |
9.8 |
9.7 |
4. |
Non-debt Capital Receipts |
2.5 |
7.8 |
13.3 |
Financing (1 to 11) |
|
|
|
1. |
Market Borrowings |
16.9 |
58.9 |
56.7 |
2. |
Loans from Centre |
-11.5 |
3.2 |
6.2 |
3. |
Special Securities issued to NSSF/Small Savings |
72.3 |
8.8 |
19.6 |
4. |
Loans from LIC, NABARD, NCDC, SBI & Other Banks |
5.1 |
6.8 |
6.5 |
5. |
Small Savings, P.F., etc. |
13.4 |
11.3 |
11.5 |
6. |
Reserve Funds |
9.8 |
-8.9 |
1.1 |
7. |
Deposits & Advances |
16.5 |
4.7 |
4.3 |
8. |
Suspense & Miscellaneous |
6.0 |
-4.5 |
-1.6 |
9. |
Remittances |
-0.4 |
-0.3 |
0.1 |
10. |
Others |
-7.1 |
-2.2 |
-2.2 |
11. |
Overall Surplus (-) / Deficit (+) |
-21.1 |
22.3 |
-2.1 |
RE : Revised Estimates. BE : Budget Estimates. NSSF : National Small Savings Fund.
Note : 1. ‘Others’ include Compensation and Other Bonds, Loans from other institutions, Appropriation to Contingency Fund, Inter-state Settlement and Contingency Fund.
2. Figures for 2006-07 (Accounts) in respect of Jammu and Kashmir and Jharkhand relate to revised estimates.
3. All financing items are on a net basis.
Source : Budget Documents of the State Governments. |
II.17 Aggregate expenditure is budgeted to decelerate in 2009-10 after the substantial increase during the preceding year (Table 16). The lower growth in aggregate expenditure would mainly emanate from revenue expenditure, which is budgeted to decelerate to 5.6 per cent from 35.1 per cent growth in 2008-09. Containment of subsidies, in particular fertiliser subsidy, would be an important contributing factor to the slower growth in revenue expenditure during 2009-10. Growth in grants to States and Union Territories is budgeted to be lower at 10.4 per cent than 14.7 per cent a year ago. Capital expenditure, comprising capital outlay and loans and advances, is also budgeted to decelerate in 2009-10 over 2008-09 (adjusting for acquisition cost of Reserve Bank’s stake in SBI in 2007-08). Capital outlay is budgeted to increase by 15.3 per cent as compared with an increase of 16.7 per cent (adjusting for acquisition cost of Reserve Bank’s stake in SBI in 2007-08). While the defence capital outlay is estimated to increase by Rs.13,824 crore, the non-defence capital outlay would decline by Rs.1,100 crore.
Table 15: Gross Tax Revenues of the Centre
|
|
(Per cent to GDP)
|
Year |
Direct |
Indirect |
Total |
1 |
2 |
3 |
4 |
2004-05 |
4.2 |
5.5 |
9.7 |
2005-06 |
4.4 |
5.8 |
10.2 |
2006-07 |
5.3 |
6.1 |
11.5 |
2007-08 |
6.3 |
6.3 |
12.6 |
2008-09RE |
6.4 |
5.2 |
11.6 |
2009-10BE |
6.3 |
4.8 |
11.1 |
Table 16: Union Interim Budget 2009-10 at a Glance
|
|
(Amount in Rupees crore)
|
Item |
2008-09 (RE) |
2009-10 (BE) |
Growth rate ( per cent) |
2008-09 |
2009-10 |
1 |
2 |
3 |
4 |
5 |
1. |
Revenue Receipts (i+ii) |
5,62,173 |
6,09,551 |
3.7 |
8.4 |
| |
|
(10.4) |
(10.1) |
|
|
| |
i) Tax Revenue (Net) |
4,65,970 |
4,97,596 |
6.0 |
6.8 |
| |
|
(8.6) |
(8.3) |
|
|
| |
ii) Non-Tax Revenue |
96,203 |
1,11,955 |
-6.0 |
16.4 |
| |
|
(1.8) |
(1.9) |
|
|
2. |
Non-Plan Expenditure |
6,17,996 |
6,68,082 |
30.9* |
8.1 |
| |
|
(11.4) |
(11.1) |
|
|
| |
of which: |
|
|
|
|
| |
i) Interest Payments |
1,92,694 |
2,25,511 |
12.7 |
17.0 |
| |
|
(3.6) |
(3.7) |
|
|
| |
ii) Defence Expenditure |
1,14,600 |
1,41,703 |
25.0 |
23.7 |
| |
|
(2.1) |
(2.4) |
|
|
| |
iii) Subsidies |
1,29,243 |
1,00,932 |
82.2 |
-21.9 |
| |
|
(2.4) |
(1.7) |
|
|
3. |
Plan Expenditure |
2,82,957 |
2,85,149 |
38.0 |
0.8 |
| |
|
(5.2) |
(4.7) |
|
|
4. |
Revenue Expenditure |
8,03,446 |
8,48,085 |
35.1 |
5.6 |
| |
|
(14.8) |
(14.1) |
|
|
5. |
Capital Expenditure |
97,507 |
1,05,146 |
17.9* |
7.8 |
| |
|
(1.8) |
(1.7) |
|
|
6. |
Total Expenditure |
9,00,953 |
9,53,231 |
33.0* |
5.8 |
| |
|
(16.6) |
(15.8) |
|
|
7. |
Revenue Deficit |
2,41,273 |
2,38,534 |
359.0 |
-1.1 |
| |
|
(4.4) |
(4.0) |
|
|
8. |
Gross Fiscal Deficit |
3,26,515 |
3,32,835 |
157.3 |
1.9 |
| |
|
(6.0) |
(5.5) |
|
|
9. |
Gross Primary Deficit |
1,33,821 |
1,07,324 |
-403.3 |
-19.8 |
| |
|
(2.5) |
(1.8) |
|
|
* : Adjusting for acquisition cost of RBI’s stake in SBI at Rs.35,531 crore in 2007-08.
Note : Figures in parentheses are percentages to GDP. |
II.18 The Union Interim Budget for 2009-10 has indicated the relaxation of the FRBM targets for 2008-09 and 2009-10 in order to mobilised resources to boost aggregate demand. However, as a medium term objective, it has recognised the need to revert to fiscal consolidation process at the earliest. The key deficit indicators, viz., revenue deficit, GFD and primary deficit as per cent of GDP, are budgeted at 4.0 per cent, 5.5 per cent and 1.8 per cent in 2009-10, respectively, lower than 4.4 per cent, 6.0 per cent and 2.5 per cent, respectively, in the preceding year (see Table 11).
II.19 During 2009-10, net market borrowings (net of MSS) are budgeted to increase from Rs.2,66,539 crore in 2008-09 to Rs.3,08,647 crore. Inclusive of repayment of Rs.93,087 crore, gross market borrowings (net of MSS) are placed at Rs.4,01,734 crore in 2009-10. In terms of financing GFD, the share of net market borrowings (excluding allocations under MSS), investments by the NSSF in the special Central Government securities and external assistance are budgeted to increase in 2009-10 over 2008-09 (RE). Outflow from reserve funds is budgeted to be lower in 2009-10 than in 2008-09 (RE). During 2009-10, the budget expects no drawdown of cash balances to finance GFD as against 9.2 per cent of GFD in 2008-09 (RE) (Table 17).
Table 17: Financing Pattern of Gross Fiscal Deficit
|
|
(Amount in Rupees crore)
|
Item |
2008-09 (RE) |
2009-10 (BE) |
1 |
2 |
3 |
Gross Fiscal Deficit |
3,26,515 |
3,32,835 |
Financed by: |
|
|
Market Borrowings |
2,66,539 |
3,08,647 |
| |
(81.6) |
(92.7) |
Securities issued against |
1,324 |
13,255 |
Small Savings |
(0.4) |
(4.0) |
External Assistance |
9,603 |
16,047 |
| |
(2.9) |
(4.8) |
State Provident Fund |
4,800 |
5,000 |
| |
(1.5) |
(1.5) |
NSSF |
11,206 |
1,022 |
| |
(3.4) |
(0.3) |
Reserve Funds |
-16,808 |
-3,358 |
| |
(-5.1) |
(-1.0) |
Deposit and Advances |
12,788 |
9,026 |
| |
(3.9) |
(2.7) |
Postal Insurance and |
2,594 |
2,672 |
Life Annuity Funds |
(0.8) |
(0.8) |
Drawdown of Cash Balances |
29,984 |
0 |
| |
(9.2) |
(0.0) |
Others |
4,486 |
-19,477 |
| |
(1.4) |
(-5.9) |
Note: Figures in parentheses are percentages to GFD. |
Corporate Performance
II.20 An analysis of the performance of select non-financial non-government companies during the first half of the year 2008-09 showed that sales recorded a strong growth in relation to the first half of 2007-08. This was mainly on account of high selling prices and continued consumer demand. However, expenditure growth remained higher than sales growth primarily on account of rising input costs, including power and fuel, rise in interest outgo and large provisioning towards marked-to-market (MTM) losses on foreign exchange related transactions. Burden of piled-up inventories and decline in other income also affected profit performance which remained subdued during the first half of 2008-09.
II.21 During the third quarter of 2008-09, however, sales growth slowed down considerably as demand weakened. As against accumulation of stocks in trade during the first half of 2008-09, sales were partly made through depletion of inventories in the third quarter. Although the expenditure growth also decelerated during this period, the deceleration in sales growth was sharper than that in expenditure growth. Consequently, profitability of these companies measured in terms of the ratios of gross profits to sales and profits after tax to sales deteriorated, indicating pressure on margins. The high growth in interest payments was one of the key factors in the decline in net profits in the third quarter of 2008-09 over the corresponding period of the previous year. More importantly, other income continued to decline over the third quarter as compared to substantial increases witnessed during the preceding year (Table 18).
II.22 The non-financial government (oil and non-oil) companies posted a growth of 11.1 per cent in revenue and a fall of 27.0 per cent in net profits during the third quarter of 2008-09 over the corresponding period of the previous year. While net profits of non-oil companies declined by 10.3 per cent, that of oil companies declined sharply by 45.4 per cent during the third quarter of 2008-09. The sharp reduction in crude and petroleum prices during the third quarter led to inventory valuation losses and lower realisation of exports which adversely affected the profits of oil companies. The profits of these companies were also affected by higher outgo on interest payments and increase in staff costs due to larger provisioning for anticipated wage revision. The three oil marketing companies, however, posted combined net profits of Rs.3,336 crore during the quarter. The issuance of oil bonds by Government to partially compensate the under- realisation suffered by them (as a result of non-revision of retail prices of petrol, diesel, LPG and kerosene in line with the international prices) had averted net losses in these companies.
External Demand II.23 Net external demand, as reflected by net exports (goods and services) as a percentage of GDP, deteriorated to (-) 7.8 per cent during the first three quarters of 2008-09 as compared with (-) 4.7 per cent in the corresponding period of the previous year. Exports and imports (goods and services) grew by 17.1 per cent and 27.3 per cent, respectively, in April-December 2008 as compared with 23.3 per cent and 25.1 per cent, respectively, in April-December 2007. Merchandise trade deficit recorded a sharp increase during 2008-09 (April-February) on account of higher crude oil prices in the early part of the year coupled with loss of momentum in exports since September 2008. Export growth decelerated in September and thereafter turned negative in October 2008 and the negative trend continued till February 2009. Accordingly, merchandise trade deficit during 2008-09 (April-February) widened to US $ 113.8 billion from US $ 82.2 billion a year ago. A detailed discussion on the external demand conditions is set out in Chapter III.
Table 18: Corporate Sector - Financial Performance
|
|
(Growth rates/Ratios in per cent)
|
Item |
2007-08 |
2007-08 |
2008-09 |
2007-08 |
2008-09 |
April-December |
Q1 |
Q2 |
Q3 |
Q4 |
Q1 |
Q2 |
Q3 |
1 |
2 |
3 |
4 |
5 |
6 |
7 |
8 |
9 |
10 |
11 |
Sales |
18.3 |
17.9 |
23.9 |
19.2 |
16.0 |
18.0 |
20.6 |
29.3 |
31.8 |
9.5 |
Other income |
46.2 |
68.0 |
-2.4 |
106.7 |
45.2 |
70.2 |
28.5 |
-8.4 |
-0.6 |
-4.8 |
Expenditure |
18.4 |
17.7 |
28.3 |
18.0 |
15.3 |
18.9 |
23.3 |
33.5 |
37.5 |
12.6 |
Depreciation provision |
14.8 |
17.4 |
14.9 |
18.1 |
15.8 |
17.9 |
15.4 |
15.3 |
16.5 |
16.8 |
Gross profits |
22.8 |
23.7 |
-1.7 |
31.9 |
22.5 |
20.4 |
16.8 |
11.9 |
8.7 |
-26.7 |
Interest payments |
28.8 |
25.1 |
65.4 |
4.4 |
18.4 |
45.7 |
35.8 |
58.1 |
85.3 |
62.9 |
Profits after tax |
26.2 |
28.6 |
-16.7 |
33.9 |
22.7 |
29.4 |
14.1 |
6.9 |
-2.6 |
-53.4 |
| |
Select Ratios |
Gross profits to Sales |
16.3 |
16.0 |
13.1 |
16.7 |
16.3 |
16.2 |
15.0 |
14.5 |
13.5 |
11.0 |
Profits after tax to Sales |
11.8 |
11.6 |
8.1 |
11.6 |
11.5 |
12.2 |
10.3 |
9.7 |
8.6 |
5.3 |
Interest to Sales |
2.2 |
2.2 |
3.0 |
2.0 |
2.1 |
2.5 |
2.2 |
2.4 |
2.9 |
3.8 |
Interest to Gross profits |
13.8 |
13.5 |
22.6 |
11.8 |
12.8 |
15.3 |
14.6 |
16.8 |
21.5 |
34.6 |
Interest Coverage (Times) |
7.3 |
7.4 |
4.4 |
8.5 |
7.8 |
6.5 |
6.8 |
6.0 |
4.6 |
2.9 |
Memo: |
|
|
|
|
|
|
|
(Amount in Rupees crore) |
No. of Companies |
2,359 |
2,476 |
2,059 |
2,342 |
2,228 |
2,329 |
2,357 |
2,500 |
2,386 |
2,486 |
Sales |
11,41,711 |
9,08,339 |
10,35,713 |
2,80,814 |
2,97,110 |
3,06,238 |
3,50,917 |
3,65,303 |
3,93,626 |
3,74,686 |
Other income* |
30,958 |
23,916 |
22,077 |
9,151 |
8,057 |
9,221 |
10,082 |
7,666 |
7,943 |
8,471 |
Expenditure |
9,56,930 |
7,63,735 |
8,97,759 |
2,37,698 |
2,49,194 |
2,57,472 |
3,02,105 |
3,17,605 |
3,43,921 |
3,22,077 |
Depreciation provision |
40,664 |
32,075 |
34,191 |
10,173 |
10,576 |
10,961 |
11,805 |
11,590 |
12,075 |
14,563 |
Gross profits |
1,86,665 |
1,45,492 |
1,35,541 |
46,780 |
48,296 |
49,717 |
52,583 |
52,930 |
52,968 |
41,299 |
Interest payments |
25,677 |
19,659 |
30,674 |
5,504 |
6,194 |
7,609 |
7,703 |
8,891 |
11,403 |
14,277 |
Profits after tax |
1,34,291 |
1,05,686 |
83,664 |
32,699 |
34,266 |
37,470 |
36,109 |
35,295 |
33,844 |
19,962 |
*: Other income excludes extraordinary income/expenditure if reported explicitly.
Notes: 1. Data are based on abridged financial results of the select non-government non-financial listed public limited companies.
2. Growth rates are percentage changes in the level for the period under reference over the corresponding period of the previous year for common set of companies.
3. The quarterly data may not add up to annual data due to differences in the number and composition of companies covered in each period. |
Saving and Investment II.24 The rate of Gross Domestic Saving (GDS) had steadily risen since 2002-03 to a peak of 37.7 per cent of GDP in 2007-08, mainly due to improved saving performance of the private corporate and public sectors. Improved profitability of joint stock companies contributed to the increase in private corporate savings. In respect of the public sector, a significant decline in the dissavings of government administration as enabled by the fiscal consolidation coupled with improved profitability of departmental enterprises and non-departmental undertakings contributed to higher savings. Household saving rate exhibited marginal improvement in 2007-08 over the previous year, owing to a rise in the physical saving rate (Table 19). The rate of Gross Domestic Capital Formation (GDCF) also peaked at 39.1 per cent of GDP in 2007-08. The saving-investment balance widened during 2007-08 reflecting continuous surge in investment activity ahead of the saving rate. It may, however, be noted that the steady trend of rise in saving and investment may not be sustained during 2008-09 on account of slowing down of economic activity.
Table 19: Rates of Gross Domestic Saving and Investment
|
|
(Per cent of GDP at current market prices)
|
Item |
2001-02 |
2002-03 |
2003-04 |
2004-05 |
2005-06 |
2006-07 PE |
2007-08 QE |
1 |
2 |
3 |
4 |
5 |
6 |
7 |
8 |
1. |
Household Saving |
22.1 |
22.9 |
24.1 |
22.8 |
24.1 |
24.1 |
24.3 |
| |
of which : |
|
|
|
|
|
|
|
| |
a) |
Financial assets |
10.9 |
10.3 |
11.4 |
10.1 |
11.7 |
11.7 |
11.7 |
| |
b) |
Physical assets |
11.3 |
12.6 |
12.7 |
12.7 |
12.4 |
12.4 |
12.6 |
2. |
Private Corporate Saving |
3.4 |
4.0 |
4.6 |
6.7 |
7.7 |
8.3 |
8.8 |
3. |
Public Sector Saving |
-2.0 |
-0.6 |
1.1 |
2.2 |
2.4 |
3.3 |
4.5 |
4. |
Gross Domestic Saving |
23.5 |
26.3 |
29.8 |
31.7 |
34.2 |
35.7 |
37.7 |
5. |
Net capital inflow |
-0.6 |
-1.2 |
-2.2 |
0.4 |
1.2 |
1.1 |
1.4 |
6. |
Gross Domestic Capital Formation # |
22.8 |
25.2 |
27.6 |
32.1 |
35.5 |
36.9 |
39.1 |
7. |
Gross Capital Formation |
24.2 |
25.2 |
26.8 |
31.6 |
34.8 |
36.4 |
38.7 |
| |
of which : |
|
|
|
|
|
|
|
| |
a) |
Public sector |
6.9 |
6.1 |
6.3 |
6.9 |
7.6 |
8.0 |
9.1 |
| |
b) |
Private corporate sector |
5.4 |
5.9 |
6.8 |
10.8 |
13.7 |
14.8 |
15.9 |
| |
c) |
Household sector |
11.3 |
12.6 |
12.7 |
12.7 |
12.4 |
12.4 |
12.6 |
| |
d) |
Valuables |
0.6 |
0.6 |
0.9 |
1.3 |
1.2 |
1.2 |
1.1 |
8. |
Total Consumption Expenditure (a+b) |
76.9 |
75.2 |
73.1 |
69.4 |
68.1 |
66.4 |
65.3 |
| |
a) |
Private Final Consumption Expenditure |
64.5 |
63.3 |
61.8 |
58.7 |
57.6 |
56.2 |
55.2 |
| |
b) |
Government Final Consumption Expenditure |
12.4 |
11.9 |
11.3 |
10.7 |
10.5 |
10.2 |
10.1 |
Memo |
|
|
|
|
|
|
|
Saving-Investment Balance (4-6) |
0.6 |
1.2 |
2.2 |
-0.4 |
-1.2 |
-1.1 |
-1.4 |
Public Sector Balance |
-8.9 |
-6.7 |
-5.3 |
-4.7 |
-5.2 |
-4.6 |
-4.6 |
Private Sector Balance |
8.8 |
8.4 |
9.2 |
6.1 |
5.7 |
5.2 |
4.7 |
a) |
Private Corporate Sector |
-2.1 |
-1.9 |
-2.2 |
-4.0 |
-6.0 |
-6.5 |
-7.0 |
b) |
Household Sector |
10.9 |
10.3 |
11.4 |
10.1 |
11.7 |
11.7 |
11.7 |
PE : Provisional Estimates. QE : Quick Estimates. # : Adjusted for errors and omissions.
Note : Figures may not add up to the totals due to rounding off.
Source : Central Statistical Organisation. |
Annex 1: Major Fiscal Stimulus Measures October 20, 2008
-
The supplementary demand for grants provided for a gross expenditure amounting to Rs.2,37,286 crore with net cash outgo of Rs.1,05,613 crore mainly to finance schemes/plans announced in the Union Budget for 2008-09 but for which no provisions were made.
December 7, 2008
-
The three major ad valorem rates of Central Excise duty, viz., 14 per cent, 12 per cent and 8 per cent applicable to non-petroleum products were reduced by 4 percentage points each.
-
For promoting exports, pre-shipment and post-shipment export credit for labour intensive exports, i.e., textiles (including handlooms, carpets and handicrafts), leather, gems & jewellery, marine products and SME sector is being made more attractive by providing an interest subvention of 2 per cent up to March 31, 2009 subject to minimum rate of interest of 7 per cent per annum. An additional fund of Rs.1,100 crore to ensure full refund of Terminal Excise duty/CST was announced. Furthermore, an additional allocation for export incentive schemes of Rs.350 crore was announced.
-
In order to provide a counter-cyclical stimulus via plan expenditure, an additional Plan expenditure of up to Rs 20,000 crore in the current fiscal year was allocated.
-
In the textile sector, an additional allocation of Rs.1,400 crore will be made to clear the entire backlog of Technology Up-gradation Fund (TUF) Scheme.
-
In order to support the infrastructure schemes under Public Private Partnership mode, India Infrastructure Finance Company Limited (IIFCL) was authorised to raise Rs.10,000 crore through tax-free bonds by March 31, 2009.
December 19, 2008
January 29, 2009
-
The Debt Consolidation and Relief Facility (DCRF) guidelines for the year 2008-09 were relaxed by modifying the fiscal deficit target as 3.5 per cent so as to enable the States to borrow up to 3.5 per cent of their respective Gross State Domestic Product (GSDP) during 2009-10 as one-time relaxation for undertaking capital expenditure. In addition, the DCRF requirement of elimination of revenue deficit was also relaxed for 2008-09. On February 26, 2009, this relaxation was extended for the year 2009-10 also. The States will not lose benefits of DCRF, provided they achieve the fiscal deficit target of 3.5 per cent of GDP in 2009-10. The States will have to suitably amend their respective FRBM Act.
February 24, 2009 (Post-Interim Budget)
-
General reduction in excise duty rates by 4 percentage points, which was made with effect from December 7, 2008, was extended beyond March 31, 2009. In addition, central excise duty was reduced from 10 per cent to 8 per cent. Service tax on taxable services was also reduced from 12 per cent to 10 per cent.
|


