
II. Aggregate Demand - RBI - Reserve Bank of India


II. Aggregate Demand
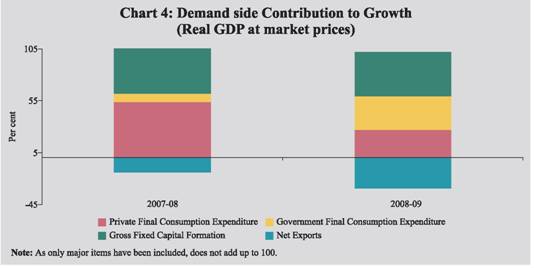
Weakening aggregate demand emerged as a major constraint to growth in 2008-09.The significant deceleration in private consu- mption expenditure as well as the moderation in investment demand required expansionary fiscal policy to arrest the slowdown in growth. Government consumption expenditure, therefore, increased sharply in the third and fourth quarters and contributed 32.5 per cent of real GDP growth (at market prices) in 2008-09, as against an average contribution of 5.9 per cent in the previous five years.The Union Budget for 2009-10 underlined the continued relevance of higher government expenditure to prevent deceleration in growth, which is reflected in the higher budgeted fiscal deficit as percentage of GDP.Corporate sector data indicate sharper deceleration in sales growth during the last two quarters of the year; growth in profits after tax was negative in the last three quarters.Early information on corporate performance for the first quarter of 2009-10 indicate positive growth in both sales and profits over the corresponding period of the previous year.Net exports declined during the last quarter of 2008-09 due to sharper contraction in import growth relative to export growth. II.1 The hallmark of India’s growth acceleration during the period 2003-08 was robust domestic demand.The high growth trajectory was, however, dented in 2008-09 by the knock-on impact of the global financial crisis. In real terms, during 2008-09, the growth in private consumption demand decelerated sharply to 2.9 per cent from 8.5 per cent in 2007-08; the significance of this contraction has to be seen in the context of the high share of private consumption demand in the GDP (55.5 per cent in 2008-09). Investment demand, as could be inferred from the behavior of gross fixed capital formation, also experienced some deceleration.Offsetting expansion in Government consumption expenditure was,therefore,necessary,to contain a sharp slowdown in economic growth in response to deceleration in private consumption demand.The government consumption expenditure expanded by 20.2 per cent in 2008-09, with the sharpest growth taking place in the third quarter of the year. As a result, the contribution of government consumption expenditure to the real GDP growth (at market prices) in 2008-09 was 32.5 per cent as against 8.0 per cent in 2007-08.Reflecting the fiscal response to the growth slowdown, key deficit indicators of the Central Government, viz., the revenue deficit and the gross fiscal deficit in the revised estimates for 2008-09 were significantly higher than the budgeted level as well as those of the preceding years. As the economic growth continued to remain subdued during the current year, the Union Budget for 2009-10 has provided for larger deficits for the year. As a per cent of GDP, revenue deficit would be at an all time high and gross fiscal deficit would be the highest since 1993-94.Corporate performance remained subdued, and the impact of moderation in demand was visible in the substantial deceleration in sales growth in the last quarter of 2008-09.The impact on profitability was also adverse, particularly during the third quarter as growth in sales decelerated. As regards external demand, exports growth turned negative since October 2008 but import growth has fallen more sharply. As a result, net exports (of goods and services) improved in the last quarter of 2008-09. The same pattern seems to have continued in the first two months of 2009-10, as is evident from the behaviour of merchandise trade balance. Domestic Demand II.2 In the backdrop of global financial crisis and economic recession, the erosion in investor and consumer confidence was reflected in the contraction in major demand aggregates in the economy.Consumption demand, which had overtaken investment demand as the most important contributor to demand growth in 2007-08, continued to be the dominant contributor to GDP growth in 2008-09.With the sharp deceleration in the growth of private final consumption expenditure (PFCE) in 2008-09, however, there was a compositional shift in the contribution to growth from private consumption expenditure to government consumption expenditure. In real terms, the contribution of private consumption expenditure to GDP growth, which was 53.8 per cent in 2007-08, declined by nearly half, to 27.0 per cent in 2008-09, while that of government consumption expenditure was as high as 32.5 per cent in 2008-09, as against 8 per cent in 2007-08 (Chart 4).Thus, the impact of the slowdown in private consumption and investment demand was cushioned by government final consumption expenditure (GFCE) which received a thrust from additional expenditure on account of Sixth Pay Commission award and countercyclical fiscal policy measures. II.3 According to the latest release of the Central Statistical Organisation (CSO), the PFCE and gross fixed capital formation (GFCF) continued to register subdued growth in the fourth quarter of 2008-09 as compared with the corresponding period of 2007-08.Growth of GFCE continued to partly compensate for the sluggishness in private consumption demand.As a result, the share of GFCE rose during the fourth quarter over the corresponding period of the previous year while that of PFCE declined (Table 9). Combined Budgeted Finances: 2009-10 II.4 The combined budgetary position of the Central and State Governments for 2009-10 indicates that the key deficit indicators as per cent of GDP are budgeted to remain at elevated levels (Table 10). Although the combined revenue receipts are budgeted to grow mainly on account of increase in tax revenue, the combined tax-GDP ratio is budgeted to marginally decrease in 2009-10 over 2008-09.On the expenditure side, while non-developmental expenditure is budgeted to grow substantially and show a rise in terms of GDP, development expenditure is budgeted to decline in absolute terms and consequently its share in total expenditure and as a ratio to GDP would decrease in 2009-10 (BE) over 2008-09 (RE).
Central Government Finances II.5 The Union Budget for 2009-10, presented against the backdrop of persistent global economic slowdown and the associated dampened domestic demand, has proposed to sustain the fiscal stimulus that was introduced in the previous year to provide the necessary boost to demand and thereby revive growth prospects. Given the stated goal of reverting to the 9 per cent growth path over the next three years, the pronouncements in the Budget were aimed at enhancing consumption demand, investment demand as also domestic savings through appropriate combination of allocations of expenditure and tax concessions.As a result, key deficit indicators, viz., revenue deficit, gross fiscal deficit (GFD) and gross primary deficit (PD) as per cent of GDP, are budgeted higher than those in 2008-09 (RE). While revenue deficit would be at its highest level ever, PD would be the highest in India’s post reform period. The increase in revenue deficit is mainly on account of higher growth in revenue expenditure which more than offset the increase in revenue receipts. With capital outlay also increasing substantially, GFD is budgeted to increase over both the revised estimates and provisional accounts for 2008-09 (Tables 10 and 11). II.6 The continued economic slowdown and the proposed reductions in direct and indirect taxes may affect gross tax revenue which is budgeted to decline to 10.9 per cent of GDP during 2009-10 from 11.8 per cent during 2008-09.Net of assignment to States, the tax revenue to the Central Government during 2009-10 is budgeted at 8.1 per cent of GDP. Non-tax revenue to GDP ratio, however, is budgeted to be higher at 2.4 per cent (as against a decline to 1.8 per cent of GDP in 2008-09),mainly on account of anticipated receipts of Rs.35,000 crore from the auction of third-generation (3G) spectrum and Rs.28,600 crore(58 per cent higher than the previous year)in dividend/surplus transfer from the Reserve Bank,nationalised banks and financial institutions.
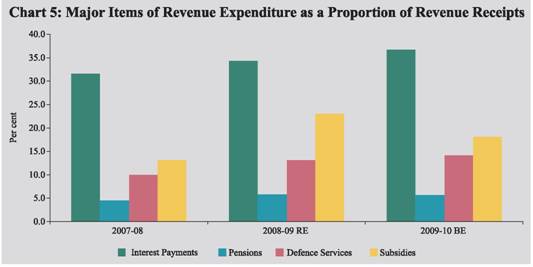
II.7 The budgeted growth in aggregate expenditure for 2009-10 is lower than the previous year, but on a high base, the planned expansion implies significant additional stimulus to aggregate demand over the previous year.The lower growth in aggregate expenditure in 2009-10 would mainly emanate from moderation of growth in revenue expenditure, particularly through containment of fertiliser subsidies.The major items contributing to the growth of revenue expenditure in 2009-10 are interest payments, defence and non-plan grants to States, which together would account for over 60 per cent of the increase in revenue expenditure.While increase in interest payments would reflect substantial hike in government borrowings and special securities issued to oil marketing companies and fertiliser companies during 2008-09, increase in defence expenditure would arise on account of enhanced provisions for pay and allowances and maintenance expenditure.The ratios of interest payments and defence expenditure to revenue receipts are budgeted to increase, while that of subsidies would decline during 2009-10 (Chart 5).The growth in capital expenditure is budgeted to be higher in 2009-10 than in 2008-09, mainly on account of a higher growth in capital outlay (capital expenditure less loans and advances), which is budgeted to increase by 33.6 per cent as against a decline of 22.1 per cent in 2008-09.Defence capital outlay would account for nearly half of the increase in capital outlay.Non-defence capital outlay would increase mainly under economic services.The share of capital expenditure in total expenditure is budgeted to increase to 12.1 per cent in 2009-10 from 10.8 per cent in 2008-09 (RE). Financing of Central Government II.8 The financing pattern of GFD as proposed in the Budget reveals that the Government envisages financing almost the entire amount of the deficit during 2009-10 through market borrowings. The Budget has made no provision for drawdown of cash balances, which had financed 9.2 per cent of GFD in 2008-09. During 2009-10, the share of external borrowings and securities against small savings in GFD financing would be higher than during 2008-09 (Table 12). Centre’s Fiscal Position during April-May 2009. II.9 According to the latest available information on Central Government finances for 2009-10 (April-May 2009), revenue deficit and GFD, as percent of the budget estimates were placed substantially lower than the corresponding period of the preceding year, although they were higher in absolute terms (Table 13). Tax revenue as a percent of budget estimate was lower than the previous year, reflecting the impact of economic slowdown and tax cuts. While growth in revenue under corporation tax and personal income tax decelerated during April-May 2009 over April-May 2008, collections under excise and customs duties registered a decline over the same period. As a result, revenue receipts declined by 10.7 per cent during the first two months of 2009 as against an increase of 39.1 per cent during the corresponding period of the preceding year, despite an increase of 48.0 per cent in non-tax revenue. During April-May 2009, growth in aggregate expenditure (at 12.5 per cent) was lower than during April-May 2008 (20.6 per cent), with the relative decline in growth evident both in the revenue and capital expenditures. While non-plan expenditure during April-May 2009, increased by 20.6 per cent (5.7 per cent in the previous year), mainly on account of revenue component of the expenditure, plan expenditure declined by 2.8 per cent (64.2 per cent in the previous year).
State Finances: 2009-101 II.10 The finances of State governments are also expected to be affected by the economic slowdown, which is evident from the budgeted increase in key deficit indicators. The consolidated revenue account of the State Governments for 2009-10 is budgeted to turn into deficit of 0.4 per cent of GDP after remaining in surplus over the previous three years, on account of higher budgeted increase in revenue expenditure in relation to revenue receipts.The deterioration in revenue account of State Governments during 2009-10 (BE) reflects the combined impact of sluggishness in tax revenue along with higher expenditure on administrative services,on account of implementation of Sixth Pay Commission award by many State Governments,pension and interest payments.During 2009-10 (BE), the GFD at the consolidated level is budgeted to increase to 2.7 per cent of GDP as compared with 2.5 per cent of GDP in 2008-09 (RE),mainly on account of worsening of the revenue account and higher net lending.
Corporate Performance II.11 An analysis of the performance of select non-financial non-government companies showed that their sales growth moderately decelerated in 2008-09 over the previous year. The impressive sales growth during the first half of 2008-09, enabled partly by price hikes, was adversely affected during the latter half of the year, particularly in the last quarter, due to weak consumer demand and its impact on the pricing power. Profit margins measured in terms of ratios of gross profits to sales and profits after tax to sales came under pressure largely due to high input costs in the first half, provision relating to mark-to-market (MTM) losses on transactions involving foreign exchange; rise in interest outgo and declining other income. However, softening of pressure on interest payments (that grew by 37 per cent in the quarter ended March 2009 as compared with over 50 per cent in each of the first three quarters of the year), increase in other income, decline in input costs (reflecting fall in commodity prices) and deferment of the implementation of Accounting Standard (AS 11) dealing with changes in foreign exchange rates by two years could be the key factors that helped corporates to limit the year-on-year fall in aggregate profits in the fourth quarter to 19.9 percent as compared with the sharp deterioration of over 50 per cent in the third quarter (Table 14). II.12 Select non-financial government (oil and non-oil) companies posted a growth of 20.7 per cent in revenue and a decline of 11.4 per cent in net profits during 2008-09 over the previous year. Net profits of non-oil companies recorded a marginal growth of 0.4 per cent. Net profits of oil companies came down by 26.4 percent during 2008-09. The profits of these companies were affected by higher outgo on interest payments and increase in staff costs due to larger provisioning for anticipated wage revision. During 2008-09, issuance of oil bonds to the three oil marketing companies by the Government of India to partially compensate them for the under-recoveries, enabled them to post combined net profits of Rs.4,260 crore in 2008-09 (as against Rs.9,678 crore in 2007-08).
External Demand II.13 External demand as reflected in net exports (of goods and services) as a percentage of GDP, deteriorated to (-) 6.0 per cent during 2008-09 as compared with (-) 4.6 per cent in the previous year. The contraction in world demand affected the exports of India, like other countries. The global economic crisis, however, also led to lower international oil and fertiliser prices.The fall in import growth in the last quarter of 2008-09 was sharper than the fall in export growth, with lower oil prices reducing oil imports and domestic slowdown driving the fall in non-oil imports.Thus, the share of net exports in real GDP improved from -10.5 per cent in the second quarter to -2.9 per cent in the last quarter of 2008-09 (see Table 9).Merchandise trade deficit during April-May 2009 stood at US $ 10.2 billion, which was lower by 48.7 per cent than US $ 19.9 billion in April-May 2008, due to relatively larger decline in imports than exports during the period.A detailed discussion on the external demand conditions is set out in Chapter III. II.14 To sum up, the impact of the slowdown on aggregate demand in the economy during 2008-09 on account of sharp deceleration in private consumption demand and dampened investment demand was partly offset by the increase in government consumption expenditure in the latter half of the year. Union Budget for 2009-10 provided for large Government expenditure and, hence, wider deficits, to continue supporting aggregate demand in the economy. Corporate sector remained subdued in 2008-09, with decelerated sales growth and decline in profits after tax. 1 Based on the budget documents of twenty-two State Governments, of which 14 are vote on account. |
|||||||||||||||||||||||||||||||||||||||||||||||||||||||||||||||||||||||||||||||||||||||||||||||||||||||||||||||||||||||||||||||||||||||||||||||||||||||||||||||||||||||||||||||||||||||||||||||||||||||||||||||||||||||||||||||||||||||||||||||||||||||||||||||||||||||||||||||||||||||||||||||||||||||||||||||||||||||||||||||||||||||||||||||||||||||||||||||||||||||||||||||||||||||||||||||||||||||||||||||||||||||||||||||||||||||||||||||||||||||||||||||||||||||||||||||||||||||||||||||||||||||||||||||||||||||||||||||||||||||||||||||||||||||||||||||||||||||||||||||||||||||||||||||||||||||||||||||||||||||||||||||||||||||||||||||||||||||||||||||||||||||||||||||||||||||||||||||||||||||||||||||||||||||||||||||||||||||||||||||||||||||||||||||||||||||||||||||||||||||||||||||||||||||||||||||||||||||||||||||||||

Share this page:


Install the RBI mobile application and get quick access to the latest news!


