
III. The External Economy - RBI - Reserve Bank of India


III. The External Economy
In the face of deteriorating external environment, the adverse effects of the contagion transmitting through different components of India’s balance of payments (BoP) could largely be contained through policy actions. Reflecting higher trade and current account deficits in the face of lower net capital inflows, the foreign exchange reserves of India (excluding valuation effects) fell by US$ 20.4 billion during April-December 2008, even though the foreign exchange reserves level (including valuation effects) fell more sharply by US$ 53.8 billion during the same period, reflecting the impact of large volatility in major international currencies. The effect of the external shocks transmitting to India through the BoP could thus be contained with loss of reserves mainly in the third quarter of 2008-09, when the global crisis deepened and spread significantly with more visible real effects. Even though significant moderation in international oil prices in the second half of 2008-09 relieved the pressures on BoP through deceleration in import growth, slowdown in exports on account of contracting global demand, large reversal in portfolio flows, and reduced inflows of debt capital on account of the adverse global credit market conditions exerted sustained pressures on the BoP. Notwithstanding these adverse developments, sustained interest in India as a long-term investment destination and a comfortable reserve position suggest that the external sector could continue to support stability and growth. III.1 The slowdown in global demand and credit market shocks adversely impacted India’s balance of payments (BoP) in 2008-09 (April-December). The BoP position was marked by a widened trade deficit, a record level of current account deficit (CAD) and lower net capital inflows. During the third quarter of 2008-09, export growth turned negative for the first time since 2001-02, while import growth touched a single digit. At the same time, large net outflows under portfolio investment and large repayments under short-term trade credit led to a lower capital account surplus during April-December 2008. Except FDI and NRI deposits, all other components of capital flows declined in net terms. Reflecting these developments, India’s foreign exchange reserves on BoP basis declined by US $ 20.4 billion during April-December 2008 (US $ 53.8 billion including valuation losses). As on April 10, 2009, the foreign exchange reserves stood at US $ 253.0 billion. International Developments III.2 The world economy experienced a synchronized downturn extending to the emerging markets with steeper fall in output and trade than earlier anticipated. Global economic activity continued to contract with the advanced economies experiencing their sharpest declines in the post-World War II period, notwithstanding policy efforts. The financial sector deleveraging in conjuction with weak credit markets, falling production and rapidly shrinking global trade, have led to a situation of a more prolonged recession. The impact is visible not only in the financial markets but also in the real economy across the globe. Significant fall in various asset prices, the end of a housing construction boom in a number of countries and fall in consumer and business sentiments are weighing on economic activity. While all major advanced economies including the US, Euro Area, Japan and the UK witnessed recessionary conditions in the fourth quarter of 2008, the growth in EMEs also showed significant moderation (Table 20). III.3 Uncertainty surrounding the global economic outlook remains high mainly stemming from a scenario of ongoing financial market turmoil affecting the real economy more adversely than previously anticipated. Since the official recognition of recession in the US, the UK, the Euro Area and Japan, the downside risks to the global economy have increased. According to the forecast released by the International Monetary Fund (IMF) on March 19, 2009, world output is projected to contract by 0.5-1.0 per cent in 2009 as compared with a growth of 3.2 per cent in 2008, before recovering gradually in 2010 (Table 21).
III.4 According to the IMF, the US economy is projected to contract by 2.6 per cent in 2009 (as against an increase of 1.1 per cent in 2008) as households respond to depreciating real and financial assets and tightening financial conditions. Similarly, real GDP in the Euro Area is also projected to decline by 3.2 per cent in 2009 (as against an increase of 0.9 per cent in 2008) due to sharp decline in external demand, the impact of housing market corrections in some member states, intensification of financing constraints and falling confidence. The Japanese GDP has already shown contraction by 4.6 per cent in the fourth quarter of 2008 reflecting sluggish domestic demand and sharp decline in exports and business investment. Real GDP in Japan is projected to record a decline of 5.8 per cent in 2009 as the support to growth from net exports is expected to decline further. Financial conditions continue to present significant downside risks. Considerable uncertainty still remains about the extent and duration of the economic downturn in affected economies stemming from the crisis. III.5 The growth rates in the emerging and developing economies, which were earlier considered to be resilient to the global financial disruptions, are also projected to slow appreciably to 1.5-2.5 per cent in 2009. Growth fell sharply across a broad spectrum of emerging economies, reflecting the confluence of weakening external demand, tightening financing constraints and falling commodity prices. The IMF projects that Developing Asia will grow by 5.5 per cent in 2009 (7.8 per cent in 2008). While China’s growth is projected to moderate from 9.0 per cent in 2008 to 6.7 per cent in 2009, growth for India is placed at 5.3 per cent for 2009-10 (6.3 per cent in 2008-09) by the IMF. Nevertheless, the economic outlook for the EMEs still remains relatively positive when compared to advanced economies, but uncertainties about their resilience to the global shocks have considerably increased. The impact of the financial crisis is already in evidence in the currency and equity markets and in the capital outflows from the EMEs. However, the macroeconomic impact on the EMEs, including India, has so far been contained somewhat by the strength of domestic demand. III.6 According to the IMF projections, world trade volume is expected to decline by 2.8 per cent in 2009, however, export volume of emerging and developing economies is projected to decline marginally by 0.8 per cent (see Table 21). The World Trade Organisation (WTO) has also projected that the collapse in global demand will drive exports volume down by 9 per cent in 2009, the biggest contraction since the World War II. III.7 According to the IMFs International Financial Statistics, world merchandise exports, in dollar terms, grew by 22.6 per cent during January-September 2008, but subsequently declined during October-December 2008 by 10.1 per cent. The contraction in exports could be attributed to declining demand, falling production and a sharp shrinkage in credit to finance trade (WTO, 2009). The overall world exports during 2008 remained marginally higher than a year ago, mainly because of the higher export growth recorded in the first half of 2008 (Table 22). Exports from advanced economies showed a sharp deceleration, reflecting the impact of well entrenched recession. Exports from emerging and developing economies during 2008 grew sharply up to September 2008. However, a sharp shrinkage occurred since October, which subsequently got worsened with a rapid fall in export growth emanating from deteriorating external demand, sharp fall in commodity prices and severe constraints in accessing trade credit in the international markets.
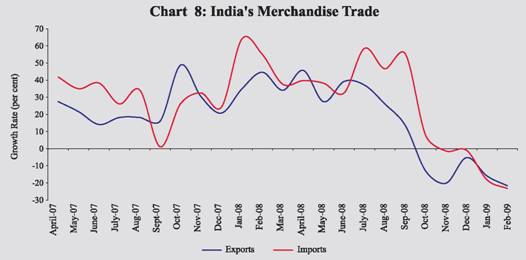
III.8 In response to the global economic slowdown, various national level as well as coordinated global monetary and fiscal policy measures have been put in place. The G-20 member countries on April 2, 2009 resolved to restore confidence, growth and jobs; repair the financial system to restore lending; strengthen financial regulation to rebuild trust; fund and reform the international financial institutions; promote global trade and investment and reject protectionism; and build an inclusive and sustainable recovery. This would be pursued through undertaking a concerted fiscal expansion (US $5 trillion), providing additional resources through international financial institutions and trade finance, trebling of resources to the IMF, supporting a new SDR allocation and additional lending by the Multilateral Development Banks, and using additional resources from IMF gold sales for concessional finance for the poorest countries. At the same time, attention has also been drawn to the need for credible exit strategies to ensure long-term fiscal sustainability and price stability (Box 1). Merchandise Trade III.9 The impact of global slowdown was felt more severely on India’s external demand, evident in the negative growth of merchandise exports that set in the third quarter of 2008-09. Imports growth also witnessed sharp slowdown in tandem as domestic activity slowed down rapidly. India’s merchandise exports, which remained buoyant till August 2008 decelerated in September 2008 and thereafter recorded continuous negative growth till February 2009, under the impact of the global economic slowdown (Chart 8). With the result, exports during 2008-09 (April-February) recorded a lower growth of 6.4 per cent than 28.4 per cent a year ago. Imports during 2008-09 (April-February) also recorded a lower growth due to deceleration in growth of both petroleum, oil and lubricants (POL) and non-POL imports. During 2008-09 (April-February), POL imports showed a growth of 24.4 per cent lower than 35.3 per cent a year ago. Non-POL imports also exhibited moderation in growth during this period to 15.0 per cent from 42.6 per cent a year ago. Thus, merchandise trade deficit during 2008-09 (April-February) widened to US$ 113.8 billion from US $ 82.2 billion a year ago (Table 23). According to the Press Communique of the meeting of the G-20 member countries held on April 2, 2009 in London, the members have planned to undertake a concerted fiscal expansion amounting to US $5 trillion to resolve the global crises. They further agreed for over US $1 trillion of additional resources for the world economy through international financial institutions and trade finance. It was agreed to treble resources available to the IMF (US $750 billion), to support a new SDR allocation (US $250 billion), to support additional lending by the Multilateral Development Banks (at least US $100 billion), to ensure support for trade finance (US $250 billion), and to use the additional resources from agreed IMF gold sales for concessional finance for the poorest countries. The G-20 countries have additionally pledged to put in place credible exit strategies to ensure long-term fiscal sustainability and price stability. The following major initiatives were agreed:
III.10 The commodity-wise exports data available for the period April-November 2008 revealed that manufactured goods continued to maintain the largest share at 64.7 per cent, followed by petroleum products (18.3 per cent) and primary products (14.9 per cent). During April-November 2008, engineering goods and chemicals and related products showed higher growth in exports, while agriculture and allied products, ores and minerals, leather and manufactures, textiles and textile products, gems and jewellery and petroleum products showed deceleration. The handicrafts exports declined during the same period (Table 24).
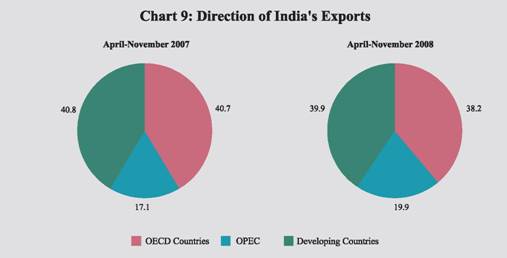
III.11 Destination-wise, during April-November 2008, developing countries continued to remain the major markets for India’s exports with a share of 39.9 per cent, followed by OECD countries and the OPEC (Chart 9). The US with a share of 11.9 per cent continued to be the single largest export destination of India, though its share declined over the previous year. The US was followed by the UAE, Singapore, China and Hong Kong. Region-wise details available for April-November 2008 indicated that the growth rate of India’s exports to major regions except the OPEC declined (Table 25). III.12 The commodity-wise imports data for the period April-November 2008 indicated that POL imports showed sharp rise of 58.8 per cent as compared with 20.8 per cent a year ago on account of high international crude oil prices that prevailed during April-September 2008.
III.13 Source-wise, during April-November 2008, the OPEC had the highest share in India’s imports, followed by developing countries and the OECD countries. China was the single largest source of imports, with a share of 10.0 per cent in total imports, followed by Saudi Arabia, the UAE, the US, Iran and Switzerland.
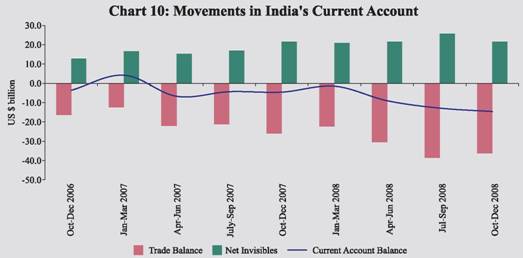
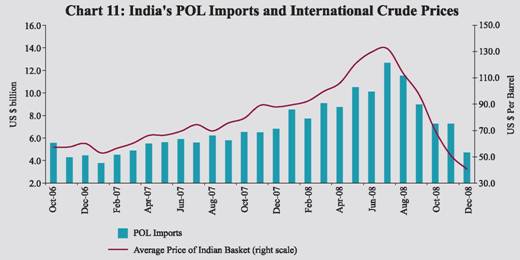
Balance of Payments III.14 The impact of the rapid shrinkage in global demand and trade was particularly felt on India’s current account in Q3 of 2008-09 with widening trade deficit, some moderation in services exports and remittances and the consequent expansion in current account deficit. India’s current account deficit increased to US$ 36.5 billion in April-December 2008 from US$ 15.5 billion in April-December 2007 mainly led by larger trade deficit on account of higher growth in imports coupled with a slowdown in export growth (Table 27 and Chart 10). On BoP basis, while merchandise exports increased by 17.5 per cent during April-December 2008 (21.9 per cent in April-December 2007), import payments recorded a growth of 30.6 per cent during the same period (28.3 per cent in April-December 2007). The lower growth of exports mainly reflected negative growth of 10.4 per cent during the third quarter, due to global economic slowdown. After remaining buoyant for almost six years, the growth in imports decelerated to single digit during the third quarter mainly led by lower crude oil prices. Overall, the trade deficit was higher at US$ 105.3 billion during April-December 2008 as compared with US$ 69.3 billion in April-December 2007. III.15 The widening of trade deficit during April-December 2008 could be attributed to higher import payments reflecting high international commodity prices, particularly crude oil prices during the first half of 2008-09 (Chart 11).
Invisibles
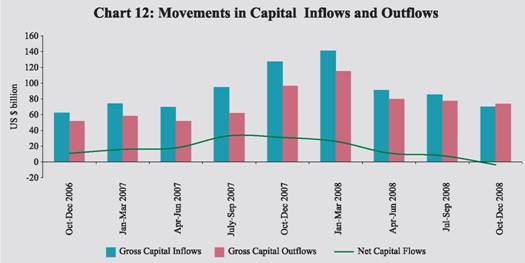
Capital Account III.17 The adverse impact of the global financial market turmoil and liquidity problems on India’s BoP was felt in terms of reversal of FIIs inflows and decline in long-term and short-term debt flows. A positive development was, however, turnaround in NRI flows and resilience of FDI inflows in the face of reversal of capital flows, reflecting the attractiveness of India as a long term investment destination. The capital account balance moderated during April-December 2008 mainly due to higher gross capital outflows coupled with lower gross capital inflows (Chart 12). While the gross capital inflows declined to US $ 246.4 billion during April-December 2008 from US $ 291.8 billion in April-December 2007, the gross capital outflows increased to US $ 231.1 billion from US $ 209.8 billion during the same period. The higher gross capital outflows were mainly an outcome of the developments during the third quarter of 2008-09, which was characterised by large portfolio outflows and higher repayments under short-term trade credits to India resulting in a negative quarterly capital account balance, a position last observed in the first quarter of 1998-1999.
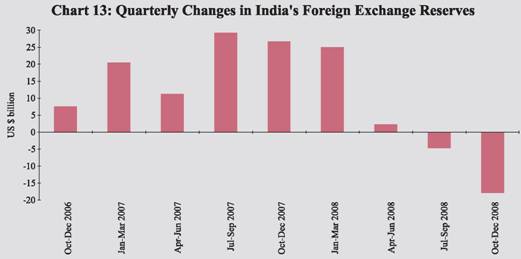
III.19 Portfolio investment, primarily comprising foreign institutional investors’ (FIIs) investments and American Depository Receipts (ADRs)/Global Depository Receipts (GDRs), witnessed net outflows in April-December 2008 as against net inflows in the corresponding period of the previous year. Outflows under portfolio investment were led by large sales of equities by FIIs in the Indian stock market and slowdown in net inflows under ADRs/ GDRs due to drying-up of liquidity in the overseas market. During 2008-09, FIIs recorded a net outflow of US $ 15.0 billion as against net inflows of US$ 20.3 billion a year ago. In the current financial year, upto April 10, 2009, there was net inflows under FIIs to the tune of US $ 0.9 billion as against net outflows of US $ 1.5 billion during the same period last year. During 2008-09 so far (April-February), approvals under ECBs remained low at US$ 17.2 billion as compared with US$ 26.5 billion a year ago. III.22 Despite tightness in overseas credit markets, gross disbursements of short-term trade credit at US$ 31.4 billion during April-December 2008 were comparable with US$ 32.2 billion in April-December 2007. However, repayments of short-term trade credit increased to US$ 30.8 billion during April-December 2008 from US$ 21.5 billion during April-December 2007 mainly due to some problems in rollover observed during the third quarter of 2008-09. Net short-term trade credit stood at US$ 0.5 billion (inclusive of suppliers’ credit up to 180 days) during April-December 2008 as compared with US$ 10.7 billion during the same period of the previous year. Foreign Exchange Reserves III.23 A sharp expansion in CAD in Q3 of 2008-09 alongwith net capital outflows resulted in the outgo of foreign exchange reserves to the extent of US $ 17.9 billion (excluding valuation). This magnitude of decline in reserves in a single quarter, although led to some stress on the exchange rate, was managed without creating disruptions in the financial markets. This level of decline in reserves was the highest during any one quarter in earlier years; a decline of US$ 4.7 billion in reserves was last observed in the third quarter of 2005-06. As a result of this, foreign exchange reserves on BoP basis (i.e., excluding valuation) declined by US$ 20.4 billion in April-December 2008 as against accretion to reserves of US$ 67.2 billion in April-December 2007 (Chart 13). Taking into account the valuation effect, foreign exchange reserves recorded a decline of US$ 53.8 billion during April-December 2008 as against an accretion of US$ 76.1 billion in April-December 2007. Valuation losses, reflecting the depreciation of major currencies against the US dollar accounted for US$ 33.4 billion or 62.1 per cent of the total decline in foreign exchange reserves during April-December 2008. III.24 India’s foreign exchange reserves were US$ 252.0 billion as at end-March 2009, showing a decrease of US$ 57.7 billion over end-March 2008 (including valuation losses) (Table 31). The foreign exchange reserves, however, increased to US $ 253.0 billion as on April 10, 2009. III.25 The overall approach to the management of India’s foreign exchange reserves in recent years reflects the changing composition of the balance of payments and the ‘liquidity risks’ associated with different types of flows and other requirements. Taking these factors into account, India’s foreign exchange reserves continued to be at a level consistent with the rate of growth, the size of the external sector in the economy and the size of risk-adjusted capital flows. External Debt III.26 India’s external debt did not show a significant increase in Q3 of 2008-09 due to a decline in short-term debt. The ratio of short-term debt to total debt and the debt-service ratio remained at a reasonably low level. Recording an increase of around US$ 6.2 billion (2.8 per cent) over end-September 2008, India’s total external debt stood at US $ 230.8 billion at end-December 2008 (Table 32). The increase in external debt stock was essentially due to increase in long-term debt outstanding by US$ 9.4 billion, especially commercial borrowings and bilateral debt, during the third quarter of 2008-09. Short-term debt, however, declined by US$ 3.2 billion on account of all the components, except FII investment in government Treasury Bills and corporate debt instruments, which increased by US$ 543 million. NRI deposits declined by US$ 0.33 billion over end-September 2008 and stood at US$ 40.3 billion at end-December 2008 mainly reflecting valuation changes. The US dollar continued to be the leading currency in which India’s external debt was denominated, accounting for about 53.1 per cent of total debt at end-December 2008.
III.27 Debt sustainability indicators remained at a comfortable level at end-December 2008. The debt service ratio was placed at 5.3 per cent during the third quarter of 2008-09. The ratio of short-term to total debt decreased to 20.6 per cent while the ratio of short-term debt to reserves increased to 18.5 per cent at end-December 2008 from 22.6 per cent and 17.7 per cent, respectively, at end-September 2008. India’s foreign exchange reserves exceeded the external debt by US$ 25.1 billion, providing a cover of 110.9 per cent to the external debt stock at the end of December 2008. III.28 Based on residual maturity (an important indicator for assessing the debt service liability in the short-run), the total short-term residual maturity obligations stood at US$ 90.0 billion, which accounted for 39.0 per cent of the total external debt outstanding at end-December 2008. The total short-term debt in terms of residual maturity (US$ 90.0 billion) at end-December 2008 consists of short-term debt based on original maturity at US$ 47.5 billion and long term external debt due for payments within one year of US$ 42.5 billion. Out of these US$ 42.5 billion, the NRI deposits constitute the major portion (US$ 31.8 billion) and are expected to get rolled over.
International Investment Position III.29 India’s net international liabilities increased by US $ 10.2 billion between end-June 2008 and end-September 2008, as the decline in international assets (US $ 19.7 billion) exceeded that in international liabilities (US $ 9.5 billion) (Table 33). The decline in international assets was mainly on account of decrease in reserve assets amounting to US $ 25.8 billion. However, the direct investment and other investment position increased between end-June 2008 and end-September 2008. On the other hand, the decline in international liabilities is mainly attributed to outflow by FIIs from portfolio equity investment during July-September 2008 and also due to the effect of valuation changes.
|
|||||||||||||||||||||||||||||||||||||||||||||||||||||||||||||||||||||||||||||||||||||||||||||||||||||||||||||||||||||||||||||||||||||||||||||||||||||||||||||||||||||||||||||||||||||||||||||||||||||||||||||||||||||||||||||||||||||||||||||||||||||||||||||||||||||||||||||||||||||||||||||||||||||||||||||||||||||||||||||||||||||||||||||||||||||||||||||||||||||||||||||||||||||||||||||||||||||||||||||||||||||||||||||||||||||||||||||||||||||||||||||||||||||||||||||||||||||||||||||||||||||||||||||||||||||||||||||||||||||||||||||||||||||||||||||||||||||||||||||||||||||||||||||||||||||||||||||||||||||||||||||||||||||||||||||||||||||||||||||||||||||||||||||||||||||||||||||||||||||||||||||||||||||||||||||||||||||||||||||||||||||||||||||||||||||||||||||||||||||||||||||||||||||||||||||||||||||||||||||||||||||||||||||||||||||||||||||||||||||||||||||||||||||||||||||||||||||||||||||||||||||||||||||||||||||||||||||||||||||||||||||||||||||||||||||||||||||||||||||||||||||||||||||||||||||||||||||||||||||||

Share this page:


Install the RBI mobile application and get quick access to the latest news!


