India’s Balance of Payments Developments during the First Quarter (April-June 2009) of
2009-10* The data on India’s balance of payments (BoP) are compiled and published by the Reserve Bank on a quarterly basis with a lag of one quarter. Accordingly the preliminary data on India’s BoP for the first quarter (Q1) i.e., April-June 2009 of the financial year 2009-10 were released by the Reserve Bank on September 30, 2009. The developments in India’s BoP for April-June 2009 quarter are presented here. Major Highlights of BoP (i) The decline in exports which started since October 2008 continued during the first quarter of 2009-10. Import payments, on a BoP basis, also continued its declining trend mainly due to lower oil import bill.
(ii) Private transfer receipts remained buoyant and increased by 9.4 per cent to US$ 13.3 billion during Q1 of 2009-10. Exports of software services, however, declined during Q1 of 2009-10.
(iii) Despite net invisibles surplus at US$ 20.2 billion, the large trade deficit (US$ 26.0 billion) mainly on account of sharp decline in exports led to a current account deficit of US$ 5.8 billion in Q1 of 2009-10 (US$ 9.0 billion during Q1 of 2008-09).
(iv) With the revival in capital inflows to India, particularly foreign investments, the capital account showed a turnaround from a negative balance in last two quarters of 2008-09 to a positive balance of US$ 6.7 billion during Q1 of 2009-10.
(v) Portfolio investment witnessed a sharp turnaround from net outflows of US$ 2.7 billion in Q4 of 2008-09 to net inflows of US$ 8.3 billion during Q1 of 2009-10.
(vi) NRI deposits also witnessed higher inflows reflecting the positive impact of the revisions in the ceiling interest rate on NRI deposits.
(vii) There was a marginal increase in reserves on BoP basis (i.e., excluding valuation) during Q1 of 2009-10. However, the foreign exchange reserves including valuation increased by US$ 13.2 billion during Q1 of 2009-10 implying that the increase in reserves during this period was mainly due to valuation gains as the US dollar has depreciated against major currencies. 1. Balance of Payments for April-June (Q1) of 2009-10
The major items of the BoP for the first quarter (Q1) of 2009-10 are set out below in Table 1.
Table 1: Major Items of India’s Balance of Payments |
(US$ million) |
Item |
April-March |
April-June |
2007-08 (PR) |
2008-09 (P) |
2008-09 (PR) |
2009-10 (P) |
1 |
2 |
3 |
4 |
5 |
1. |
Exports |
166,163 |
175,184 |
49,120 |
38,789 |
2. |
Imports |
257,789 |
294,587 |
80,545 |
64,775 |
3. |
Trade Balance (1-2) |
-91,626 |
-119,403 |
-31,425 |
-25,986 |
4. |
Invisibles, net |
74,592 |
89,587 |
22,406 |
20,179 |
5. |
Current Account Balance (3+4) |
-17,034 |
-29,817 |
-9,019 |
-5,808 |
6. |
Capital Account Balance* |
109,198 |
9,737 |
11,254 |
5,923 |
7. |
Change in Reserves#
(-Indicates increase;+indicates decrease) |
-92,164 |
20,080 |
-2,235 |
-115 |
*: Including errors and omissions. #: On BoP basis (i.e. excluding valuation).
P: Preliminary. PR: Partially Revised. |
Merchandise Trade
Exports
(i) The decline in exports which started since October 2008 continued during the first quarter of 2009-10. On a BoP basis, India’s merchandise exports recorded a decline of 21.0 per cent in Q1 of 2009-10 as against an increase of 43.0 per cent in Q1 of 2008-09.
(ii) As per the data released by the Directorate General of Commercial Intelligence and Statistics (DGCI&S), merchandise exports declined by 26.4 per cent in Q1 of 2009-10 as against a higher growth of 37.4 per cent in Q1 of 2008-09, reflecting fall in demand worldwide due to the global economic crisis.
Imports
(i) Import payments, on a BoP basis, also continued its declining trend. Imports declined by 19.6 per cent in Q1 of 2009-10 as against a positive growth of 42.9 per cent in Q1 of 2008-09.
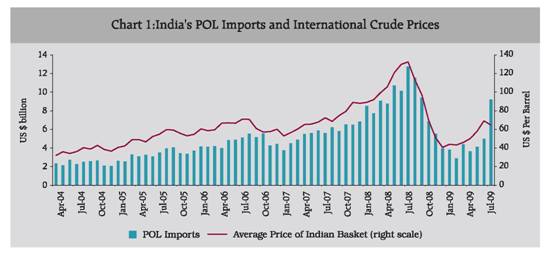
(ii) According to the data released by the DGCI&S, the decline in imports is mainly attributed to the sharp fall in oil import payments due to lower crude oil prices during Q1 of 2009-10 (US$ 63.9 per barrel in Q1 of 2009-10 as against US$ 119 per barrel in Q1 of 2008-09). POL imports recorded a sharp decline of 56.9 per cent during Q1 of 2009-10 as against a sharp increase of 74.2 per cent during Q1 of 2008-09. As per the data released by the Ministry of Petroleum & Natural Gas, Government of India, POL imports showed a decline of 45.1 per cent during Q1 of 2009-10 despite a quantity growth of 10 per cent mainly due to lower crude oil prices (Chart 1).
(iii) According to the DGCI&S data, out of the total decline in imports of US$ 26.7 billion in Q1 of 2009-10 over the corresponding previous quarter, oil imports declined by US$ 16.8 billion (share of 63.1 per cent in the decline in total imports during Q1 of 2009-10 as against 59.8 per cent share in total increase in imports during Q1 of 2008-09), while non-oil imports decreased by US$ 9.8 billion (share of 36.9 per cent in the decline in total imports during Q1 of 2009-10 as against 40.2 per cent share in total increase in imports during Q1 of 2008-09).
Trade Balance
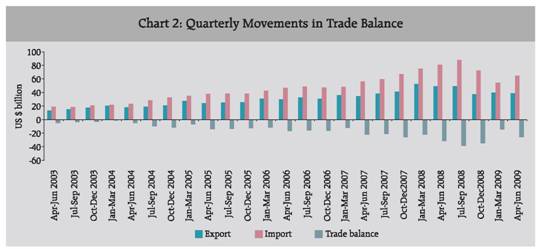
(i) On a BoP basis, the decline in the pace of exports was higher than that of imports during Q1 of 2009-10 which led to a large trade deficit (Chart 2). The trade deficit on a BoP basis in Q1 of 2009-10 (US$ 26.0 billion) was, however, less than that in Q1 of 2008-09 (US$ 31.4 billion).
Invisibles
(i) During Q1 of 2009-10, invisibles receipts declined marginally, while invisibles payments recorded a positive growth (Table 2). In net terms, the invisibles balance at US$ 20.2 billion was lower than that in the corresponding period of the previous year (US$ 22.4 billion), though higher than that in Q4 of 2008-09 (US$ 19.3 billion) (Table 3).
Invisibles Receipts
(i) Invisibles receipts registered a marginal decline of 0.7 per cent in Q1 of 2009-10 (as against a higher growth of 30.3 per cent in Q1 of 2008-09) on account of a decline in almost all categories of services, except insurance and financial services and a decline of 20.3 per cent in investment income receipts.
Table 2: Invisibles Gross Receipts and Payments |
(US$ million) |
Item |
Invisibles Receipts |
Invisibles Payments |
2008-09
(P) |
2008-09
(Q1) (PR) |
2009-10
(Q1)(P) |
2008-09
(P) |
2008-09
(Q1) (PR) |
2009-10
(Q1) (P) |
1 |
2 |
3 |
4 |
5 |
6 |
7 |
A. |
Services (1 to 5) |
101,224 |
23,059 |
22,389 |
51,406 |
11,441 |
13,351 |
|
1. |
Travel |
10,894 |
2,504 |
2,286 |
9,432 |
2,164 |
2,004 |
|
2. |
Transportation |
11,066 |
2,611 |
2,490 |
12,777 |
3,328 |
2,777 |
|
3. |
Insurance |
1,409 |
350 |
387 |
1,131 |
228 |
314 |
|
4. |
G.N.I.E. |
389 |
130 |
100 |
791 |
110 |
103 |
|
5. |
Miscellaneous |
77,466 |
17,464 |
17,127 |
27,275 |
5,611 |
8,153 |
|
|
of which: |
|
|
|
|
|
|
|
|
Software |
47,000 |
12,156 |
10,764 |
2,814 |
857 |
391 |
|
|
Non-Software |
30,466 |
5,308 |
6,362 |
24,461 |
4,754 |
7,762 |
B. |
Transfers |
47,025 |
12,307 |
13,344 |
2,746 |
654 |
466 |
|
|
Private |
46,380 |
12,159 |
13,298 |
2,333 |
547 |
360 |
|
|
Official |
645 |
148 |
46 |
413 |
107 |
107 |
C. |
Income |
14,307 |
3,573 |
2,951 |
18,818 |
4,438 |
4,688 |
|
|
Investment Income |
13,482 |
3,418 |
2,723 |
17,499 |
4,108 |
4,350 |
|
|
Compensation of Employees |
825 |
155 |
227 |
1,319 |
330 |
338 |
Invisibles (A+B+C) |
162,556 |
38,939 |
38,684 |
72,970 |
16,533 |
18,505 |
G.N.I.E: Government not included elsewhere. P: Preliminary. PR: Partially Revised. |
Table 3: Net Invisibles |
(US$ million) |
Item |
April-March |
April-June |
|
2007-08 (PR) |
2008-09 (P) |
2008-09 (PR) |
2009-10 (P) |
1 |
2 |
3 |
4 |
5 |
A. |
Services (1 to 5) |
37,565 |
49,818 |
11,618 |
9,038 |
|
1. |
Travel |
2,095 |
1,462 |
340 |
282 |
|
2. |
Transportation |
-1,500 |
-1,711 |
-717 |
-287 |
|
3. |
Insurance |
595 |
278 |
122 |
73 |
|
4. |
Govt. not included elsewhere |
-46 |
-402 |
20 |
-3 |
|
5. |
Miscellaneous |
36,421 |
50,191 |
11,853 |
8,973 |
|
|
of which: |
|
|
|
|
|
|
Software |
37,242 |
44,186 |
11,299 |
10,373 |
|
|
Non-Software |
-821 |
6,005 |
554 |
-1,400 |
B. |
Transfers |
41,944 |
44,279 |
11,653 |
12,878 |
|
|
Private |
41,705 |
44,047 |
11,612 |
12,939 |
|
|
Official |
239 |
232 |
41 |
-61 |
C. |
Income |
-4,917 |
-4,511 |
-865 |
-1,737 |
|
|
Investment Income |
-4,281 |
-4,017 |
-690 |
-1,627 |
|
|
Compensation of Employees |
-636 |
-494 |
-175 |
-110 |
Invisibles (A+B+C) |
74,592 |
89,586 |
22,406 |
20,179 |
G.N.I.E: Government not included elsewhere. P: Preliminary. PR: Partially Revised. |
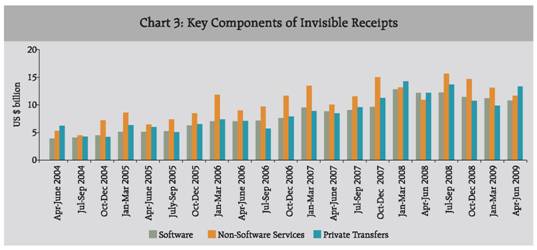
(ii) Exports of software services declined by 11.5 per cent during Q1 of 2009-10 as against an increase of 37.6 per cent in Q1 of 2008-09 (Chart 3). According to the NASSCOM, software services exports are projected to grow by 4 to 7 per cent to US$ 48 to 50 billion during the financial year 2009-10.
(iii) Travel receipts at US$ 2.3 billion during Q1 of 2009-10 declined by 8.7 per cent as against an increase of 19.9 per cent in Q1 of 2008-09 reflecting a slowdown in tourist arrivals in the country since November 2008. According to the data released by the Ministry of Tourism, foreign tourist arrivals declined by 1.8 per cent in Q1 of 2009-10.
(iv) Private transfers are in the form of (i) Inward remittances from Indian workers abroad for family maintenance, (ii) Local withdrawals from NRI Rupee deposits, (iii) Gold and silver brought through passenger baggage, and (iv) Personal gifts/ donations to charitable/religious institutions.
(v) Private transfer receipts, comprising mainly remittances from Indians working overseas and local withdrawals from NRI Rupee deposits, remained buoyant and increased by 9.4 per cent to US$ 13.3 billion during Q1 of 2009-10 from US$ 12.2 billion in Q1 of 2008-09. Private transfer receipts constituted 17.2 per cent of current receipts in Q1 of 2009-10 (13.8 per cent in Q1 of 2008-09).
(vi) NRI deposits when withdrawn domestically, form part of private transfers because once withdrawn for local use these become unilateral transfers and do not have any quid pro quo. Such local withdrawals/ redemptions from NRI deposits cease to exist as liability in the capital account of the balance of payments and assume the form of private transfers, which is included in the current account of balance of payments.
(vii) Under the NRI deposits, both inflows as well as outflows remained large in the recent past. A major part of outflows from NRI deposits is in the form of local withdrawals. These withdrawals, however, are not actually repatriated but are utilized domestically. During Q1 of 2009-10, the share of local withdrawals in total outflows from NRI deposits declined marginally to 59.5 per cent from 62.5 per cent in Q1 of 2008-09 (Table 4).
(viii) Under Private transfers, the inward remittances for family maintenance accounted for about 54 per cent of the total private transfer receipts, while local withdrawals accounted for about 42 per cent in Q1 of 2009-10 (Table 5).
Table 4: Inflows and Outflows from NRI Deposits and Local Withdrawals |
(US$ million) |
Year |
Inflows |
Outflows |
Local Withdrawals |
1 |
2 |
3 |
4 |
2006-07 |
19,914 |
15,593 |
13,208 |
2007-08(PR) |
29,401 |
29,222 |
18,919 |
2008-09 (P) |
37,089 |
32,799 |
20,617 |
2008-09 (Q1) (PR) |
9,063 |
8,249 |
5,157 |
2009-10 (Q1) (P) |
11,172 |
9,354 |
5,568 |
P: Preliminary. PR: Partially Revised. |
Table 5: Details of Private Transfers to India |
(US $ million) |
Year |
Total
Private
Transfers |
Of which: |
Inward remittances for family maintenance |
Local withdrawals/ redemptions from NRI Deposits |
Amount |
Percentage Share in Total |
Amount |
Percentage Share in Total |
1 |
2 |
3 |
4 |
5 |
6 |
2006-07 |
30,835 |
14,740 |
47.8 |
13,208 |
42.8 |
2007-08(PR) |
43,506 |
21,920 |
50.4 |
18,919 |
43.5 |
2008-09 (P) |
46,380 |
23,148 |
49.9 |
20,617 |
44.5 |
2008-09 (Q1) (PR) |
12,159 |
6,383 |
52.5 |
5,157 |
42.4 |
2009-10 (Q1) (P) |
13,298 |
7,184 |
54.0 |
5,568 |
41.9 |
P: Preliminary. PR: Partially Revised. |
(ix) Miscellaneous receipts, excluding software exports, stood at US$ 6.4 billion in Q1 of 2009-10 (US$ 5.3 billion in Q1 of 2008-09). The breakup of these data is presented in Table 6.
(x) The detailed receipts and payments under various components of business services, viz. trade related services, business and management consultancy services, architectural, engineering and other technical services, and services relating to maintenance of offices abroad are set out in Table 7.
(xi) Investment income receipts amounted to US$ 2.7 billion in Q1 of 2009-10 as compared with US$ 3.4 billion in Q1 of 2008-09 (Table 8). The decline in receipts under investment income was due to lower interest rate abroad.
Table 6: Break-up of Non-Software Receipts and Payments under Miscellaneous Services |
(US$ million) |
Item |
Receipts |
Payments |
2008-09
(P) |
2008-09
(Q1) (PR) |
2009-10
(Q1) (P) |
2008-09
(P) |
2008-09
(Q1) (PR) |
2009-10
(Q1) (P) |
1 |
2 |
3 |
4 |
5 |
6 |
7 |
1. |
Communication Services |
2,170 |
510 |
418 |
996 |
226 |
312 |
2. |
Construction |
866 |
119 |
208 |
889 |
134 |
382 |
3. |
Financial Services |
3,939 |
609 |
1,116 |
2,961 |
628 |
928 |
4. |
News Agency |
799 |
182 |
127 |
385 |
64 |
91 |
5. |
Royalties, Copyrights & License Fees |
132 |
30 |
69 |
1,755 |
495 |
414 |
6. |
Business Services |
16,251 |
3,550 |
2,586 |
15,269 |
3,133 |
3,645 |
7. |
Personal, Cultural, and Recreational |
729 |
107 |
158 |
306 |
64 |
58 |
8. |
Others |
5,580 |
201 |
1,678 |
1,900 |
10 |
1,932 |
Total (1 to 8) |
30,466 |
5,308 |
6,362 |
24,461 |
4,755 |
7,762 |
P: Preliminary. PR: Partially Revised.
Note: Details of Business Services (item 6) are given in Table 7. |
Table 7: Details of Business Services |
(US$ million) |
Item |
Receipts |
Payments |
2008-09
(P) |
2008-09
(Q1) (PR) |
2009-10
(Q1) (P) |
2008-09
(P) |
2008-09
(Q1) (PR) |
2009-10
(Q1) (P) |
1 |
2 |
3 |
4 |
5 |
6 |
7 |
1. |
Trade Related |
2,008 |
496 |
360 |
1,642 |
450 |
549 |
2. |
Business & Management Consultancy |
4,847 |
1,147 |
954 |
3,512 |
498 |
794 |
3. |
Architectural, Engineering, and other Technical Services |
1,759 |
430 |
367 |
3,106 |
553 |
698 |
4. |
Maintenance of Offices abroad |
2,980 |
476 |
358 |
3,283 |
565 |
898 |
5. |
Others |
4,657 |
1,001 |
547 |
3,726 |
1,067 |
706 |
Total (1 to 5) |
16,251 |
3,550 |
2,586 |
15,269 |
3,133 |
3,645 |
P: Preliminary. PR: Partially Revised. |
Invisibles Payments
(i) Invisibles payments recorded a positive growth of 11.9 per cent in Q1 of 2009-10 (13.5 per cent in Q1 of 2008-09) mainly due to growth in payments under services and income account. In the services account, however, payments under travel, transportation, G.N.I.E. and software services recorded a negative growth in Q1 of 2009-10.
(ii) Investment income payments (include mainly the interest payments on commercial borrowings, external assistance and non-resident deposits, and reinvested earnings of the foreign direct investment (FDI) enterprises operating in India) increased marginally to US$ 4.4 billion during Q1 of 2009-10 (US$ 4.1 billion in Q1 of 2008-09) mainly due to increased reinvested earnings of FDI companies in India (Table 8).
Invisibles Balance
(i) A combined effect of decline in invisibles receipts and increase ininvisibles payments led to marginally lower net invisibles (invisibles receipts minus invisibles payments) at US$ 20.2 billion in Q1 of 2009-10 than that in the corresponding period of the previous year (US$ 22.4 billion) (Table 3). At this level, however, the invisibles surplus financed about 77.7 per cent of trade deficit during Q1 of 2009-10 (71.3 per cent during Q1 of 2008-09).
Current Account Balance
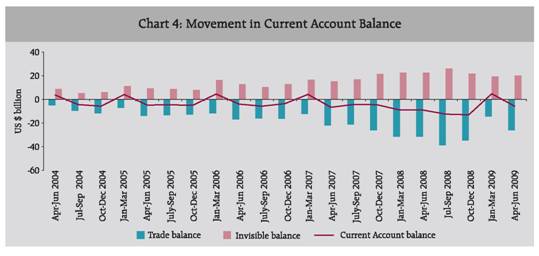
(i) Despite net invisibles surplus, the large trade deficit mainly on account of sharp decline in exports led to a current account deficit of US$ 5.8 billion in Q1 of 2009-10 (US$ 9.0 billion during Q1 of 2008-09) (Chart 4).
Capital Account
(i) The gross capital inflows to India revived during Q1 of 2009-10 as compared to the last two quarters of 2008-09 manifesting confidence in India’s long-term growth prospects. The gross inflows were, however, at US$ 78.5 billion as compared to US$ 90.9 billion in Q1 of 2008-09 mainly led by inflows under FIIs, FDI and NRI deposits (Table 9). Gross capital outflows during Q1 of 2009-10 stood lower at US$ 71.8 billion as against US$ 79.7 billion in Q1 of 2008-09.
Table 8: Details of Receipts and Payments of Investment Income |
(US $ million) |
|
2007-08
(PR) |
2008-09
(P) |
2008-09
(Q1)(PR) |
2009-10
(Q1) (P) |
1 |
2 |
3 |
4 |
5 |
A. |
Receipts |
13,808 |
13,482 |
3,418 |
2,723 |
|
Of which: |
|
|
|
|
|
1. |
Reinvested Earnings on Indian Investment Abroad |
1,084 |
1,084 |
271 |
271 |
|
2. |
Interest/Discount Earnings on Foreign Exchange Reserves |
10,124 |
10,480 |
2,672 |
1,915 |
B. |
Payments |
18,089 |
17,499 |
4,108 |
4,350 |
|
Of which: |
|
|
|
|
|
1. |
Interest Payment on NRI deposits |
1,813 |
1,547 |
349 |
393 |
|
2. |
Interest Payment on ECBs |
2,655 |
2,702 |
690 |
653 |
|
3. |
Interest Payments on External Assistance |
1,143 |
1,010 |
266 |
242 |
|
4. |
Dividends and Profits |
3,576 |
3,168 |
898 |
871 |
|
5. |
Reinvested Earnings of FDI companies in India |
7,168 |
6,426 |
1,492 |
1,696 |
C. |
Net Investment Income (A-B) |
-4,281 |
-4,017 |
-690 |
-1,627 |
P: Preliminary. PR: Partially Revised. |
(ii) With the revival in capital inflows to India, particularly foreign investments, the capital account showed a turnaround from a negative balance in the last two quarters of 2008-09 to a positive balance of US$ 6.7 billion during Q1 of 2009-10 (US$ 11.1 billion in Q1 of 2008-09) (Table 10).
(iii) Net capital inflows, however, was lower in Q1 of 2009-10 as compared to that in the corresponding period of last year mainly because of large net outflows under short-term trade credits and banking capital.
Table 9: Gross Capital Inflows and Outflows |
(US$ million) |
Item |
Gross Inflows |
Gross Outflows |
2008-09
(P) |
2008-09
(Q1)(PR) |
2009-10
(Q1) (P) |
2008-09
(P) |
2008-09
(Q1)(PR) |
2009-10
(Q1) (P) |
1 |
2 |
3 |
4 |
5 |
6 |
7 |
1. |
Foreign Direct Investment |
36,258 |
12,137 |
9,612 |
18,762 |
3,170 |
2,779 |
2. |
Portfolio Investment |
128,651 |
40,764 |
38,625 |
142,685 |
44,975 |
30,357 |
|
Of which |
|
|
|
|
|
|
|
FIIs |
127,349 |
39,746 |
38,559 |
142,366 |
44,923 |
30,332 |
|
ADRs/GDRs |
1,163 |
999 |
43 |
- |
- |
- |
3. |
External Assistance |
5,042 |
909 |
821 |
2,404 |
558 |
737 |
4. |
ECBs |
15,382 |
2,760 |
2,092 |
7,224 |
1,293 |
2,448 |
5. |
NRI Deposits |
37,089 |
9,063 |
11,172 |
32,799 |
8,249 |
9,354 |
6. |
Banking Capital excluding NRI Deposits |
27,909 |
12,889 |
4,405 |
35,596 |
11,007 |
9,588 |
7. |
Short-term Trade Credits |
39,734 |
10,176 |
10,126 |
45,529 |
7,779 |
13,211 |
8. |
Rupee Debt Service |
0 |
0 |
0 |
101 |
30 |
23 |
9. |
Other Capital |
12,391 |
2,176 |
1,636 |
8,210 |
2,678 |
3,256 |
Total (1 to 9) |
302,456 |
90,874 |
78,489 |
293,310 |
79,739 |
71,753 |
P: Preliminary. PR: Partially Revised. |
(iv) Net FDI inflows (net inward FDI minus net outward FDI) amounted to US$ 6.8 billion in Q1 of 2009-10 (US$ 9.0 billion in Q1 of 2008-09). Net inward FDI stood at US$ 9.5 billion during Q1 of 2009-10 (US$ 11.9 billion in Q1 of 2008-09). Net outward FDI stood at US$ 2.6 billion in Q1 of 2009-10 as compared with US$ 2.9 billion in Q1 of 2008-09.
Table 10: Net Capital Flows |
(US $ million) |
|
April-March |
April-June |
2007-08 (PR) |
2008-09 (P) |
2008-09 (PR) |
2009-10 (P) |
1 |
2 |
3 |
4 |
5 |
1. |
Foreign Direct Investment |
15,401 |
17,496 |
8,967 |
6,833 |
|
Inward FDI |
34,236 |
34,982 |
11,876 |
9,459 |
|
Outward FDI |
18,835 |
17,486 |
2,909 |
2,626 |
2. |
Portfolio Investment |
29,556 |
-14,034 |
-4,211 |
8,268 |
|
Of which |
|
|
|
|
|
FIIs |
20,327 |
-15,017 |
-5,177 |
8,227 |
|
ADRs/GDRs |
8,769 |
1,162 |
999 |
43 |
3. |
External Assistance |
2,114 |
2,638 |
351 |
84 |
4. |
External Commercial Borrowings |
22,633 |
8,158 |
1,468 |
-356 |
5. |
NRI Deposits |
179 |
4,290 |
814 |
1,817 |
6. |
Banking Capital excluding NRI Deposits |
11,578 |
-7,687 |
1,882 |
-5,183 |
7. |
Short-term Trade Credits |
17,183 |
-5,795 |
2,397 |
-3,085 |
8. |
Rupee Debt Service |
-121 |
-101 |
-30 |
-23 |
9. |
Other Capital |
9,470 |
4,181 |
-502 |
-1,620 |
Total (1 to 9) |
107,993 |
9,146 |
11,135 |
6,736 |
P: Preliminary. PR: Partially Revised. |
(v) During Q1 of 2009-10, FDI to India was channeled mainly into manufacturing sector (19.2 per cent), real estate activities (15.6 per cent), financial services (15.4 per cent), construction (12.2 per cent) and business services (11.7 per cent). Mauritius continued to be the major source of FDI during Q1 of 2009-10 with a share of 48.9 per cent followed by USA at 12.8 per cent. (vi) Portfolio investment primarily comprising foreign institutional investors’ (FIIs) investments and American Depository Receipts (ADRs)/ Global Depository Receipts (GDRs) witnessed a sharp turnaround from net outflows of US$ 2.7 billion in Q4 of 2008-09 to net inflows of US$ 8.3 billion during Q1 of 2009-10. During 2009-10, the sharp increase in FII inflows could be attributed to the recovery of domestic stock market in line with international stock markets, better corporate performance, political stability and comparativel better growth prospects. (vii) The tightness in liquidity in the overseas markets continued during Q1 of 2009-10. The approvals of external commercial borrowings (ECBs) were very low in the first two months of 2009-10; however, it recovered during June 2009. In addition, repayments of ECBs were higher at US$ 2.1 billion during Q1 of 2009-10 (US$ 1.1 billion during Q1 of 2008-09) resulting in net outflows of US$ 0.4 billion under ECBs (inflows of US$ 1.5 billion in Q1 of 2008-09). (viii) The gross disbursements of short-term trade credit was US$ 10.1 billion during Q1 of 2009-10 almost same in Q1 of 2008-09. The repayments of short-term trade credits, however, were very high at US$ 13.2 billion in Q1 of 2009-10 (US$ 7.8 billion in Q1 of 2008-09). As a result, there were net outflows of US$ 3.1 billion under short-term trade credit during Q1 of 2009-10 (inflows of US$ 2.4 billion in Q1 of 2008-09).
(ix) Banking capital mainly consists of foreign assets and liabilities of commercial banks. NRI deposits constitute major part of the foreign liabilities. Banking capital (net), including NRI deposits, were negative at US$ 3.4 billion during Q1 of 2009-10 as against a positive net inflow of US$ 2.7 billion during Q1 of 2008-09. Among the components of banking capital, NRI deposits witnessed higher inflows of US$ 1.8 billion in Q1 of 2009-10 (net inflows of US$ 0.8 billion in Q1 of 2008-09) reflecting the positive impact of the revisions in the ceiling interest rate on NRI deposits.
(x) Other capital includes leads and lags in exports, funds held abroad, advances received pending for issue of shares under FDI and other capital not included elsewhere (n.i.e.). Other capital recorded net outflows of US$ 1.6 billion in Q1 of 2009-10. The details of other capital are set out in Table 11.
Table 11: Details of ‘Other Capital’ (Net) |
(US $ million) |
Item |
April-March |
April-June |
2007-08 (PR) |
2008-09 (P) |
2008-09 (PR) |
2009-10 (P) |
1 |
2 |
3 |
4 |
5 |
1. |
Lead and Lags in Exports |
983 |
5,424 |
-247 |
1,459 |
2. |
Net Funds Held Abroad |
-5,487 |
-2,056 |
-1,358 |
-1,592 |
3. |
Advances Received Pending for Issue of Shares under FDI |
8,700 |
1,003 |
850 |
-1,547 |
4. |
Other capital not included elsewhere (n.i.e) * |
5,274 |
-190 |
254 |
60 |
Total (1 to 4) |
9,470 |
4,181 |
-502 |
-1,620 |
P: Preliminary. PR: Partially Revised.
*: Includes transactions related to derivatives and hedging, migrant transfers and other capital transfers. |
Variation in Reserves
(i) The increase in foreign exchange reserves on a BoP basis (i.e., excluding valuation) was US$ 115 million in Q1 of 2009-10 (as against an accretion to reserves of US$ 2,235 million in Q1 of 2008-09) (Table 12 & Chart 5). However, the foreign exchange reserves including valuation increased by US$ 13.2 billion during Q1 of 2009-10 implying that the increase in reserves during this period was mainly due to valuation gains as the US dollar has depreciated against major currencies. Details on sources of variation in foreign exchange reserves is at Annex A.
Table 12: Sources of Variation in Reserves (BoP Basis) |
(US $ million) |
Item |
2007-08
(PR) |
2008-09
(P) |
2008-09
(Q1)(PR) |
2009-10
(Q1) (P) |
1 |
2 |
3 |
4 |
5 |
A. |
Current Account Balance |
(-)17,034 |
(-)29,817 |
(-)9,019 |
(-) 5,808 |
B. |
Capital Account* |
109,198 |
9,737 |
11,253 |
5,923 |
|
Of Which |
|
|
|
|
|
(i) |
Foreign Direct Investment |
15,401 |
17,496 |
8,968 |
6,833 |
|
(ii) |
Portfolio Investment |
29,556 |
(-)14,034 |
(-)4,211 |
8,268 |
|
(iii) |
External Commercial Borrowings |
22,633 |
8,158 |
1,468 |
(-)356 |
|
(iv) |
Banking Capital |
11,757 |
(-)3,397 |
2,696 |
(-) 3,365 |
|
(v) |
Short-term Trade Credits |
17,183 |
(-)5,795 |
2,397 |
(-) 3,085 |
| C. |
Change in Reserves: |
|
|
|
|
|
(-) indicates increase; (+) indicates decrease# |
(-)92,164 |
20,080 |
(-) 2,235 |
(-) 115 |
*: Including errors and omissions. #: On BoP basis (i.e., excluding valuation).
P: Preliminary. PR: Partially Revised. |
(ii) At the end of June 2009, outstanding foreign exchange reserves stood at US$ 265.1 billion.
(iii) To sum up, the key features of India’s BoP that emerged during Q1 of 2009-10 were:(i) large trade deficit led by a sharp decline in exports, (ii) net invisibles surplus led by remittances from overseas Indians and software ser vices exports, (iii) current account deficit of US$ 5.8 billion due to large trade deficit, (iv) improvement in net capital inflows mainly supported by large FII and FDI inflows, and (v) a marginal increase in reserves.
2. Reconciliation of Import Data
(i) During Q1 of 2009-10, based on the records of Customs imports data released by the DGCI&S and the BoP merchandise imports (based on payments basis through Authorised Dealers), the difference between the two data sets works out to about US$ 13.8 billion which, as per past experience, will narrow down subsequently (Table 13).
Table 13 : Imports based on Customs (DGCI&S) and BoP basis (RBI) |
(US $ million) |
Item |
April-March |
April-June |
2007-08 (PR) |
2008-09 (P) |
2008-09 (PR) |
2009-10 (P) |
1 |
2 |
3 |
4 |
5 |
1. |
BoP Imports |
257,789 |
294,587 |
80,545 |
64,775 |
2. |
DGCI&S Imports |
251,439 |
287,759 |
77,609 |
50,936 |
3. |
Difference (1-2) |
6,350 |
6,828 |
2,936 |
13,839 |
3. External Sector Indicators (i) The details of key external sector indicators are set out in Table 14.
Table 14: Key External Sector Indicators |
Item |
2007-08
(PR) |
2008-09
(P) |
2008-09
(Q1)(PR) |
2009-10
(Q1) (P) |
1 |
2 |
3 |
4 |
5 |
Merchandise Trade |
1. |
Exports (US $ on BoP basis) Growth Rate ( %) |
28.9 |
5.4 |
43.0 |
-21.0 |
2. |
Imports (US $ on BoP basis) Growth Rate ( %) |
35.2 |
14.3 |
42.9 |
-19.6 |
3. |
Crude Oil Prices US $ Per Barrel (Indian Basket) |
79.2 |
82.4 |
118.8 |
63.9 |
4. |
Trade Balance (US $ billion) |
-91.6 |
-119.4 |
-31.4 |
-26.0 |
Invisibles |
5. |
Net Invisibles (US $ billion) |
74.6 |
89.6 |
22.4 |
20.2 |
6. |
Net Invisible Surplus / Trade Deficit ( % ) |
81.4 |
75.0 |
71.3 |
77.7 |
7. |
Invisibles Receipts / Current Receipts ( %) |
47.2 |
48.1 |
44.2 |
49.9 |
8. |
Services Receipts / Current Receipts ( % ) |
28.6 |
30.0 |
26.2 |
28.9 |
9. |
Private Transfers Receipts / Current Receipts ( % ) |
13.8 |
13.7 |
13.8 |
17.2 |
Current Account |
10 |
Current Receipts ( US $ billion) |
314.8 |
337.7 |
88.1 |
77.5 |
11 |
Current Payments ( US $ billion) |
331.8 |
367.6 |
97.1 |
83.3 |
12 |
Current Account Balance (US $ billion) |
-17.0 |
-29.8 |
-9.0 |
-5.8 |
Capital Account |
13 |
Gross Capital Inflows ( US $ billion) |
433.0 |
302.5 |
90.9 |
78.5 |
14 |
Gross Capital Outflows ( US $ billion) |
325.0 |
293.3 |
79.7 |
71.8 |
15 |
Net Capital Flows ( US $ billion) |
108.0 |
9.1 |
11.1 |
6.7 |
16 |
Net FDI / Net Capital Flows ( % ) |
14.3 |
191.3 |
80.5 |
101.4 |
17 |
Net Portfolio Investment / Net Capital Flows ( % ) |
27.4 |
-153.4 |
-37.8 |
122.7 |
18 |
Net ECBs / Net Capital Flows ( % ) |
21.0 |
89.2 |
13.2 |
-5.3 |
Reserves |
19 |
Import Cover of Reserves (in months) |
14.4 |
10.3 |
13.3 |
11.4 |
20 |
Outstanding Reserves as at end period
(US$ billion) |
309.7 |
252.0 |
312.1 |
265.1 |
Annex A: Sources of Variation in Foreign Exchange Reserves in India: April-June 2009-10 During April-June 2009, there was an accretion to foreign exchange reserves largely reflecting valuation changes. The sources of variation in the foreign exchange reserves are set out in Table A1.
The foreign exchange reserves (including the valuation effects) increased by US$ 13,157 million during April-June 2009 as compared with an increase of US$ 2,364 million during April-June 2008 (Table A2). On balance of payments basis (i.e., excluding valuation effects), the foreign exchange reserves increased by US$ 115 million during April-June 2009 as compared with an increase of US$ 2,235 million during April-June 2008. The valuation gain, reflecting the depreciation of the US dollar against the major currencies, accounted for US$ 13,042 million during April-June 2009 as compared with a valuation gain of US$ 129 million during April-June 2008. Accordingly, valuation gain during April-June 2009 accounts for 99.1 per cent of the total increase in foreign exchange reserves. Inflows under FDI, portfolio investments and NRI deposits were the major sources contributing to the increase in foreign exchange reserves, which was mostly offset by current account deficit and outflows under other items of the capital account during April-June 2009.
Table A1: Sources of Variation in Foreign Exchange Reserves |
(US $ million) |
Items |
April-June |
April-June |
2008 |
2009 |
I. |
Current Account Balance |
(-)9,019 |
(-) 5,808 |
II. |
Capital Account (net) (a to f) |
11,253 |
5,923 |
|
a. |
Foreign Investment (i+ii) |
4,757 |
15,101 |
|
|
(i) Foreign Direct Investment |
8,968 |
6,833 |
|
|
(ii) Portfolio Investment |
|
|
|
|
Of which: |
(-) 4,211 |
8,268 |
|
|
FIIs |
(-) 5,177 |
8,227 |
|
|
ADRs/GDRs |
999 |
43 |
|
b. |
External Commercial Borrowings |
1,468 |
(-)356 |
|
c. |
Banking Capital |
2,696 |
(-) 3,365 |
|
|
of which: NRI Deposits |
814 |
1,817 |
|
d. |
Short-Term Trade Credit |
2,397 |
(-) 3,085 |
|
e. |
External Assistance |
351 |
84 |
|
f. |
Other items in capital account* |
(-) 531 |
(-) 1,643 |
III. |
Valuation Change |
129 |
13,042 |
|
Total (I+II+III) |
2,364 |
13,157 |
Note: (i) *: ‘Other items in capital account’ apart from ‘Errors and Omissions’ also include leads and lags in exports, funds held abroad, advances received pending issue of shares under FDI and transactions of capital receipts not included elsewhere.
(ii) Increase in reserves(+) / Decrease in reserves (-). |
Table A2: Comparative Position |
(US$ million) |
|
April-June 2008 |
April-June 2009 |
1. |
Change in Foreign Exchange Reserves
(Including Valuation Effects) |
2,364 |
13,157 |
2. |
Valuation Effects [Gain (+)/Loss (-)] |
129 |
13,042 |
3. |
Change in Foreign Exchange Reserves on BoP basis (Excluding Valuation Effects) |
2,235 |
115 |
4. |
Percentage of increase/decline in Reserves explained by Valuation Gain/Loss |
54.6 |
99.1 |
Note: Increase in reserves (+)/Decrease in reserves (-). |
Statement I : India’s Overall Balance of Payments |
(US$ million) |
Item |
2005-06 |
2006-07 |
Credit |
Debit |
Net |
Credit |
Debit |
Net |
1 |
2 |
3 |
4 |
5 |
6 |
7 |
A. |
Current Account |
|
|
|
|
|
|
|
I. |
Merchandise |
105,152 |
157,056 |
-51,904 |
128,888 |
190,670 |
-61,782 |
|
II. |
Invisibles (a+b+c) |
89,687 |
47,685 |
42,002 |
114,558 |
62,341 |
52,217 |
|
|
a) |
Services |
57,659 |
34,489 |
23,170 |
73,780 |
44,311 |
29,469 |
|
|
|
i) Travel |
7,853 |
6,638 |
1,215 |
9,123 |
6,684 |
2,439 |
|
|
|
ii) Transportation |
6,325 |
8,337 |
-2,012 |
7,974 |
8,068 |
-94 |
|
|
|
iii) Insurance |
1,062 |
1,116 |
-54 |
1,195 |
642 |
553 |
|
|
|
iv) G.n.i.e. |
314 |
529 |
-215 |
253 |
403 |
-150 |
|
|
|
v) Miscellaneous |
42,105 |
17,869 |
24,236 |
55,235 |
28,514 |
26,721 |
|
|
|
of which |
|
|
|
|
|
|
|
|
|
Software Services |
23,600 |
1,338 |
22,262 |
31,300 |
2,267 |
29,033 |
|
|
|
Business Services |
9,307 |
7,748 |
1,559 |
14,544 |
15,866 |
-1,322 |
|
|
|
Financial Services |
1,209 |
965 |
244 |
3,106 |
2,991 |
115 |
|
|
|
Communication Services |
1,575 |
289 |
1,286 |
2,262 |
796 |
1,466 |
|
|
b) |
Transfers |
25,620 |
933 |
24,687 |
31,470 |
1,391 |
30,079 |
|
|
|
i) Official |
669 |
475 |
194 |
635 |
381 |
254 |
|
|
|
ii) Private |
24,951 |
458 |
24,493 |
30,835 |
1,010 |
29,825 |
|
|
c) |
Income |
6,408 |
12,263 |
-5,855 |
9,308 |
16,639 |
-7,331 |
|
|
|
i) Investment Income |
6,229 |
11,491 |
-5,262 |
8,926 |
15,688 |
-6,762 |
|
|
|
ii) Compensation of employees |
179 |
772 |
-593 |
382 |
951 |
-569 |
|
|
Total Current Account (I+II) |
194,839 |
204,741 |
-9,902 |
243,446 |
253,011 |
-9,565 |
B. |
Capital Account |
|
|
|
|
|
|
|
1. |
Foreign Investment (a+b) |
77,298 |
61,770 |
15,528 |
133,210 |
118,457 |
14,753 |
|
|
a) |
Foreign Direct Investment (i+ii) |
9,178 |
6,144 |
3,034 |
23,590 |
15,897 |
7,693 |
|
|
|
i. In India |
8,962 |
61 |
8,901 |
22,826 |
87 |
22,739 |
|
|
|
Equity |
5,976 |
61 |
5,915 |
16,481 |
87 |
16,394 |
|
|
|
Reinvested Earnings |
2,760 |
- |
2,760 |
5,828 |
- |
5,828 |
|
|
|
Other Capital |
226 |
- |
226 |
517 |
- |
517 |
|
|
|
ii. Abroad |
216 |
6,083 |
-5,867 |
764 |
15,810 |
-15,046 |
|
|
|
Equity |
216 |
3,982 |
-3,766 |
764 |
13,368 |
-12,604 |
|
|
|
Reinvested Earnings |
- |
1,092 |
-1,092 |
- |
1,076 |
-1,076 |
|
|
|
Other Capital |
- |
1,009 |
-1,009 |
- |
1,366 |
-1,366 |
|
|
b) |
Portfolio Investment |
68,120 |
55,626 |
12,494 |
109,620 |
102,560 |
7,060 |
|
|
|
i) In India |
68,120 |
55,626 |
12,494 |
109,534 |
102,530 |
7,004 |
|
|
|
of which |
|
|
|
|
|
|
|
|
|
FIIs |
65,554 |
55,628 |
9,926 |
105,756 |
102,530 |
3,226 |
|
|
|
GDRs/ADRs |
2,552 |
- |
2,552 |
3,776 |
- |
3,776 |
|
|
|
ii) Abroad |
- |
- |
- |
86 |
30 |
56 |
|
2. |
Loans (a+b+c) |
39,479 |
31,570 |
7,909 |
54,642 |
30,152 |
24,490 |
|
|
a) |
External Assistance |
3,631 |
1,929 |
1,702 |
3,767 |
1,992 |
1,775 |
|
|
|
i) By India |
24 |
88 |
-64 |
20 |
32 |
-12 |
|
|
|
ii) To India |
3,607 |
1,841 |
1,766 |
3,747 |
1,960 |
1,787 |
|
|
b) |
Commercial Borrowings |
14,343 |
11,835 |
2,508 |
20,883 |
4,780 |
16,103 |
|
|
|
i) By India |
- |
251 |
-251 |
626 |
966 |
-340 |
|
|
|
ii) To India |
14,343 |
11,584 |
2,759 |
20,257 |
3,814 |
16,443 |
|
|
c) |
Short Term to India |
21,505 |
17,806 |
3,699 |
29,992 |
23,380 |
6,612 |
|
|
|
i) Suppliers’ Credit > 180 days & Buyers’ Credit |
19,372 |
17,647 |
1,725 |
25,482 |
22,175 |
3,307 |
|
|
|
ii) Suppliers’ Credit up to 180 days |
2,133 |
159 |
1,974 |
4,510 |
1,205 |
3,305 |
|
3. |
Banking Capital (a+b) |
21,658 |
20,285 |
1,373 |
37,209 |
35,296 |
1,913 |
|
|
a) |
Commercial Banks |
20,586 |
20,144 |
442 |
36,799 |
35,218 |
1,581 |
|
|
|
i) Assets |
772 |
3,947 |
-3,175 |
14,466 |
17,960 |
-3,494 |
|
|
|
ii) Liabilities |
19,814 |
16,197 |
3,617 |
22,333 |
17,258 |
5,075 |
|
|
|
of which :Non-Resident Deposits |
17,835 |
15,046 |
2,789 |
19,914 |
15,593 |
4,321 |
|
|
b) |
Others |
1,072 |
141 |
931 |
410 |
78 |
332 |
|
4. |
Rupee Debt Service |
- |
572 |
-572 |
- |
162 |
-162 |
|
5. |
Other Capital |
5,941 |
4,709 |
1,232 |
8,230 |
4,021 |
4,209 |
|
|
Total Capital Account (1to5) |
144,376 |
118,906 |
25,470 |
233,291 |
188,088 |
45,203 |
C. |
Errors & Omissions |
- |
516 |
-516 |
968 |
- |
968 |
D. |
Overall Balance
(Total Current Account, Capital Account and Errors & Omissions (A+B+C)) |
339,215 |
324,163 |
15,052 |
477,705 |
441,099 |
36,606 |
E. |
Monetary Movements (i+ii) |
- |
15,052 |
-15,052 |
- |
36,606 |
-36,606 |
|
i) I.M.F. |
- |
- |
- |
- |
- |
- |
|
ii) Foreign Exchange Reserves
( Increase - / Decrease +) |
- |
15,052 |
-15,052 |
- |
36,606 |
-36,606 |
P: Preliminary. PR: Partially Revised. |
Statement I : India’s Overall Balance of Payments (Contd.) |
(US$ million) |
Item |
2007-08 PR |
2008-09 P |
Credit |
Debit |
Net |
Credit |
Debit |
Net |
1 |
8 |
9 |
10 |
11 |
12 |
13 |
A. |
Current Account |
|
|
|
|
|
|
|
I. |
Merchandise |
166,163 |
257,789 |
-91,626 |
175,184 |
294,587 |
-119,403 |
|
II. |
Invisibles (a+b+c) |
148,604 |
74,012 |
74,592 |
162,556 |
72,970 |
89,586 |
|
|
a) |
Services |
90,077 |
52,512 |
37,565 |
101,224 |
51,406 |
49,818 |
|
|
|
i) Travel |
11,349 |
9,254 |
2,095 |
10,894 |
9,432 |
1,462 |
|
|
|
ii) Transportation |
10,014 |
11,514 |
-1,500 |
11,066 |
12,777 |
-1,711 |
|
|
|
iii) Insurance |
1,639 |
1,044 |
595 |
1,409 |
1,131 |
278 |
|
|
|
iv) G.n.i.e. |
330 |
376 |
-46 |
389 |
791 |
-402 |
|
|
|
v) Miscellaneous |
66,745 |
30,324 |
36,421 |
77,466 |
27,275 |
50,191 |
|
|
|
of which |
|
|
|
|
|
|
|
|
|
Software Services |
40,300 |
3,058 |
37,242 |
47,000 |
2,814 |
44,186 |
|
|
|
Business Services |
16,771 |
16,715 |
56 |
16,251 |
15,269 |
982 |
|
|
|
Financial Services |
3,217 |
3,138 |
79 |
3,939 |
2,961 |
978 |
|
|
|
Communication Services |
2,408 |
859 |
1,549 |
2,170 |
996 |
1,174 |
|
|
b) |
Transfers |
44,259 |
2,315 |
41,944 |
47,025 |
2,746 |
44,279 |
|
|
|
i) Official |
753 |
514 |
239 |
645 |
413 |
232 |
|
|
|
ii) Private |
43,506 |
1,801 |
41,705 |
46,380 |
2,333 |
44,047 |
|
|
c) |
Income |
14,268 |
19,185 |
-4,917 |
14,307 |
18,818 |
-4,511 |
|
|
|
i) Investment Income |
13,808 |
18,089 |
-4,281 |
13,482 |
17,499 |
-4,017 |
|
|
|
ii) Compensation of employees |
460 |
1,096 |
-636 |
825 |
1,319 |
-494 |
Total Current Account (I+II) |
314,767 |
331,801 |
-17,034 |
337,740 |
367,557 |
-29,817 |
B |
Capital Account |
|
|
|
|
|
|
|
1. |
Foreign Investment (a+b) |
272,762 |
227,805 |
44,957 |
164,909 |
161,447 |
3,462 |
|
|
a) |
Foreign Direct Investment (i+ii) |
36,838 |
21,437 |
15,401 |
36,258 |
18,762 |
17,496 |
|
|
|
i. In India |
34,361 |
125 |
34,236 |
35,148 |
166 |
34,982 |
|
|
|
Equity |
26,866 |
108 |
26,758 |
27,975 |
166 |
27,809 |
|
|
|
Reinvested Earnings |
7,168 |
- |
7,168 |
6,426 |
- |
6,426 |
|
|
|
Other Capital |
327 |
17 |
310 |
747 |
- |
747 |
|
|
|
ii. Abroad |
2,477 |
21,312 |
-18,835 |
1,110 |
18,596 |
-17,486 |
|
|
|
Equity |
2,477 |
16,898 |
-14,421 |
1,110 |
14,668 |
-13,558 |
|
|
|
Reinvested Earnings |
- |
1,084 |
-1,084 |
- |
1,084 |
-1,084 |
|
|
|
Other Capital |
- |
3,330 |
-3,330 |
- |
2,844 |
-2,844 |
|
|
b) |
Portfolio Investment |
235,924 |
206,368 |
29,556 |
1,28,651 |
142,685 |
-14,034 |
|
|
|
i) In India |
235,688 |
206,294 |
29,394 |
128,511 |
142,366 |
-13,855 |
|
|
|
of which |
|
|
|
|
|
|
|
|
|
FIIs |
226,621 |
206,294 |
20,327 |
127,349 |
142,366 |
-15,017 |
|
|
|
GDRs/ADRs |
8,769 |
- |
8,769 |
1,162 |
- |
1,162 |
|
|
|
ii) Abroad |
236 |
74 |
162 |
140 |
319 |
-179 |
|
2. |
Loans (a+b+c) |
83,528 |
41,598 |
41,930 |
60,158 |
55,157 |
5,001 |
|
|
a) |
External Assistance |
4,241 |
2,127 |
2,114 |
5,042 |
2,404 |
2,638 |
|
|
|
i) By India |
24 |
28 |
-4 |
24 |
32 |
-8 |
|
|
|
ii) To India |
4,217 |
2,099 |
2,118 |
5,018 |
2,372 |
2,646 |
|
|
b) |
Commercial Borrowings |
30,376 |
7,743 |
22,633 |
15,382 |
7,224 |
8,158 |
|
|
|
i) By India |
1,592 |
1,624 |
-32 |
2,005 |
785 |
1,220 |
|
|
|
ii) To India |
28,784 |
6,119 |
22,665 |
13,377 |
6,439 |
6,938 |
|
|
c) |
Short Term to India |
48,911 |
31,728 |
17,183 |
39,734 |
45,529 |
-5,795 |
|
|
|
i) Suppliers’ Credit > 180 days & Buyers’ Credit |
42,641 |
31,728 |
10,913 |
38,814 |
38,352 |
462 |
|
|
|
ii) Suppliers’ Credit up to 180 days |
6,270 |
- |
6,270 |
920 |
7,177 |
-6,257 |
|
3. |
Banking Capital (a+b) |
55,813 |
44,056 |
11,757 |
64,998 |
68,395 |
-3,397 |
|
|
a) |
Commercial Banks |
55,734 |
43,624 |
12,110 |
64,885 |
67,810 |
-2,925 |
|
|
|
i) Assets |
19,562 |
12,668 |
6,894 |
25,673 |
28,726 |
-3,053 |
|
|
|
ii) Liabilities |
36,172 |
30,956 |
5,216 |
39,212 |
39,084 |
128 |
|
|
|
of which :Non-Resident Deposits |
29,401 |
29,222 |
179 |
37,089 |
32,799 |
4,290 |
|
|
b) |
Others |
79 |
432 |
-353 |
113 |
585 |
-472 |
|
4. |
Rupee Debt Service |
- |
121 |
-121 |
- |
101 |
-101 |
|
5. |
Other Capital |
20,904 |
11,434 |
9,470 |
12,391 |
8,210 |
4,181 |
Total Capital Account (1to 5) |
433,007 |
325,014 |
107,993 |
302,456 |
293,310 |
9,146 |
C. |
Errors & Omissions |
1,205 |
- |
1,205 |
591 |
- |
591 |
D. |
Overall Balance (Total Current Account, Capital Account and Errors & Omissions (A+B+C)) |
748,979 |
656,815 |
92,164 |
640,787 |
660,867 |
-20,080 |
E |
Monetary Movements (i+ii) |
- |
92,164 |
-92,164 |
20,080 |
- |
20,080 |
|
i) |
I.M.F. |
- |
- |
- |
- |
- |
- |
|
ii) |
Foreign Exchange Reserves
( Increase - / Decrease +) |
- |
92,164 |
-92,164 |
20,080 |
- |
20,080 |
Statement I : India's Overall Balance of Payments (Contd.) |
(US$ million) |
Item |
Apr-Jun 2006 |
Jul-Sep 2006 |
Credit |
Debit |
Net |
Credit |
Debit |
Net |
1 |
14 |
15 |
16 |
17 |
18 |
19 |
A. |
Current Account |
|
|
|
|
|
|
|
I. |
Merchandise |
29,663 |
46,613 |
-16,950 |
32,701 |
48,717 |
-16,016 |
|
II. |
Invisibles (a+b+c) |
24,934 |
12,421 |
12,513 |
24,866 |
14,597 |
10,269 |
|
|
a) |
Services |
16,042 |
8,475 |
7,567 |
16,416 |
9,966 |
6,450 |
|
|
|
i) Travel |
1,708 |
1,488 |
220 |
1,796 |
1,811 |
-15 |
|
|
|
ii) Transportation |
1,715 |
1,997 |
-282 |
1,973 |
1,978 |
-5 |
|
|
|
iii) Insurance |
238 |
129 |
109 |
315 |
154 |
161 |
|
|
|
iv) G.n.i.e. |
40 |
79 |
-39 |
61 |
122 |
-61 |
|
|
|
v) Miscellaneous |
12,341 |
4,782 |
7,559 |
12,271 |
5,901 |
6,370 |
|
|
|
of which |
|
|
|
|
|
|
|
|
|
Software Services |
7,039 |
415 |
6,624 |
7,121 |
405 |
6,716 |
|
|
|
Business Services |
3,386 |
2,646 |
740 |
3,436 |
3,300 |
136 |
|
|
|
Financial Services |
509 |
318 |
191 |
716 |
703 |
13 |
|
|
|
Communication Services |
475 |
108 |
367 |
569 |
180 |
389 |
|
|
b) |
Transfers |
7,170 |
289 |
6,881 |
6,218 |
361 |
5,857 |
|
|
|
i) Official |
69 |
82 |
-13 |
119 |
100 |
19 |
|
|
|
ii) Private |
7,101 |
207 |
6,894 |
6,099 |
261 |
5,838 |
|
|
c) |
Income |
1,722 |
3,657 |
-1,935 |
2,232 |
4,270 |
-2,038 |
|
|
|
i) Investment Income |
1,659 |
3,461 |
-1,802 |
2,160 |
4,042 |
-1,882 |
|
|
|
ii) Compensation of Employees |
63 |
196 |
-133 |
72 |
228 |
-156 |
Total Current Account (I+II) |
54,597 |
59,034 |
-4,437 |
57,567 |
63,314 |
-5,747 |
B. |
Capital Account |
|
|
|
|
|
|
|
1. |
Foreign Investment (a+b) |
34,299 |
33,067 |
1,232 |
22,485 |
18,219 |
4,266 |
|
|
a) |
Foreign Direct Investment (i+ii) |
3,477 |
1,739 |
1,738 |
4,545 |
2,429 |
2,116 |
|
|
|
i) In India |
3,413 |
8 |
3,405 |
4,400 |
2 |
4,398 |
|
|
|
Equity |
1,946 |
8 |
1,938 |
2,886 |
2 |
2,884 |
|
|
|
Reinvested Earnings |
1,457 |
- |
1,457 |
1,457 |
- |
1,457 |
|
|
|
Other Capital |
10 |
- |
10 |
57 |
- |
57 |
|
|
|
ii) Abroad |
64 |
1,731 |
-1,667 |
145 |
2,427 |
-2,282 |
|
|
|
Equity |
64 |
1,189 |
-1,125 |
145 |
1,868 |
-1,723 |
|
|
|
Reinvested Earnings |
- |
269 |
-269 |
- |
269 |
-269 |
|
|
|
Other Capital |
- |
273 |
-273 |
- |
290 |
-290 |
|
|
b) |
Portfolio Investment |
30,822 |
31,328 |
-506 |
17,940 |
15,790 |
2,150 |
|
|
|
i) In India |
30,801 |
31,327 |
-526 |
17,929 |
15,789 |
2,140 |
|
|
|
of which |
|
|
|
|
|
|
|
|
|
FIIs |
29,540 |
31,327 |
-1,787 |
17,469 |
15,789 |
1,680 |
|
|
|
GDRs/ADRs |
1,261 |
- |
1,261 |
460 |
- |
460 |
|
|
|
ii) Abroad |
21 |
1 |
20 |
11 |
1 |
10 |
|
2. |
Loans (a+b+c) |
11,499 |
6,288 |
5,211 |
11,228 |
6,446 |
4,782 |
|
|
a) |
External Assistance |
577 |
526 |
51 |
788 |
449 |
339 |
|
|
|
i) By India |
5 |
8 |
-3 |
5 |
8 |
-3 |
|
|
|
ii) To India |
572 |
518 |
54 |
783 |
441 |
342 |
|
|
b) |
Commercial Borrowings |
5,051 |
1,073 |
3,978 |
2,680 |
920 |
1,760 |
|
|
|
i) By India |
87 |
223 |
-136 |
114 |
170 |
-56 |
|
|
|
ii) To India |
4,964 |
850 |
4,114 |
2,566 |
750 |
1,816 |
|
|
c) |
Short Term To India |
5,871 |
4,689 |
1,182 |
7,760 |
5,077 |
2,683 |
|
|
|
i) Suppliers’ Credit >180 days & Buyers’ Credit |
5,082 |
4,689 |
393 |
6,579 |
5,077 |
1,502 |
|
|
|
ii) Suppliers’ Credit up to 180 days |
789 |
- |
789 |
1,181 |
- |
1,181 |
|
3. |
Banking Capital (a+b) |
9,909 |
4,848 |
5,061 |
5,754 |
7,472 |
-1,718 |
|
|
a) |
Commercial Banks |
9,837 |
4,848 |
4,989 |
5,754 |
7,428 |
-1,674 |
|
|
|
i) Assets |
5,257 |
1,877 |
3,380 |
1,568 |
3,553 |
-1,985 |
|
|
|
ii) Liabilities |
4,580 |
2,971 |
1,609 |
4,186 |
3,875 |
311 |
|
|
|
of which: Non-Resident Deposits |
4,246 |
2,944 |
1,302 |
4,185 |
3,277 |
908 |
|
|
b) |
Others |
72 |
- |
72 |
- |
44 |
-44 |
|
4. |
Rupee Debt Service |
- |
67 |
-67 |
- |
- |
- |
|
5. |
Other Capital |
342 |
1,054 |
-712 |
1,084 |
554 |
530 |
|
Total Capital Account (1 to 5) |
56,049 |
45,324 |
10,725 |
40,551 |
32,691 |
7,860 |
C. |
Errors & Omissions |
91 |
- |
91 |
157 |
- |
157 |
D. |
Overall Balance (Total Current Account, Capital Account and Errors & Omissions (A+B+C)) |
110,737 |
104,358 |
6,379 |
98,275 |
96,005 |
2,270 |
E. |
Monetary Movements (i+ii)
|
- |
6,379 |
-6,379 |
- |
2,270 |
-2,270 |
i) I.M.F. |
- |
- |
- |
- |
- |
- |
ii) Foreign Exchange Reserves
(Increase – / Decrease +) |
- |
6,379 |
-6,379 |
- |
2,270 |
-2,270 |
Statement I : India's Overall Balance of Payments (Contd.) |
(US$ million) |
Item |
Oct-Dec 2006 |
Jan-Mar 2007 |
Credit |
Debit |
Net |
Credit |
Debit |
Net |
1 |
20 |
21 |
22 |
23 |
24 |
25 |
A. |
Current Account |
|
I. |
Merchandise |
30,824 |
47,257 |
-16,433 |
35,700 |
48,083 |
-12,383 |
|
II. |
Invisibles (a+b+c) |
29,704 |
16,875 |
12,829 |
35,054 |
18,448 |
16,606 |
|
|
a) |
Services |
18,451 |
12,371 |
6,080 |
22,871 |
13,499 |
9,372 |
|
|
|
i) Travel |
2,621 |
1,638 |
983 |
2,998 |
1,747 |
1,251 |
|
|
|
ii) Transportation |
2,092 |
2,102 |
-10 |
2,194 |
1,991 |
203 |
|
|
|
iii) Insurance |
288 |
201 |
87 |
354 |
158 |
196 |
|
|
|
iv) G.n.i.e. |
87 |
97 |
-10 |
65 |
105 |
-40 |
|
|
|
v) Miscellaneous |
13,363 |
8,333 |
5,030 |
17,260 |
9,498 |
7,762 |
|
|
|
of which |
|
|
|
|
|
|
|
|
|
Software Services |
7,602 |
684 |
6,918 |
9,538 |
763 |
8,775 |
|
|
|
Business Services |
3,690 |
4,267 |
-577 |
4,032 |
5,653 |
-1,621 |
|
|
|
Financial Services |
828 |
647 |
181 |
1,053 |
1,323 |
-270 |
|
|
|
Communication Services |
597 |
239 |
358 |
621 |
269 |
352 |
|
|
b) |
Transfers |
8,961 |
333 |
8,628 |
9,121 |
408 |
8,713 |
|
|
|
i) Official |
287 |
89 |
198 |
160 |
110 |
50 |
|
|
|
ii) Private |
8,674 |
244 |
8,430 |
8,961 |
298 |
8,663 |
|
|
c) |
Income |
2,292 |
4,171 |
-1,879 |
3,062 |
4,541 |
-1,479 |
|
|
|
i) Investment Income |
2,193 |
3,936 |
-1,743 |
2,914 |
4,249 |
-1,335 |
|
|
|
ii) Compensation of Employees |
99 |
235 |
-136 |
148 |
292 |
-144 |
Total Current Account (I+II) |
60,528 |
64,132 |
-3,604 |
70,754 |
66,531 |
4,223 |
B. |
Capital Account |
|
|
|
|
|
|
|
1. |
Foreign Investment (a+b) |
38,646 |
32,179 |
6,467 |
37,780 |
34,992 |
2,788 |
|
|
a) |
Foreign Direct Investment (i+ii) |
10,008 |
7,110 |
2,898 |
5,560 |
4,619 |
941 |
|
|
|
i) In India |
9,855 |
7 |
9,848 |
5,158 |
70 |
5,088 |
|
|
|
Equity |
8,203 |
7 |
8,196 |
3,446 |
70 |
3,376 |
|
|
|
Reinvested Earnings |
1,457 |
- |
1,457 |
1,457 |
- |
1,457 |
|
|
|
Other Capital |
195 |
- |
195 |
255 |
- |
255 |
|
|
|
ii) Abroad |
153 |
7,103 |
-6,950 |
402 |
4,549 |
-4,147 |
|
|
|
Equity |
153 |
6,454 |
-6,301 |
402 |
3,857 |
-3,455 |
|
|
|
Reinvested Earnings |
- |
269 |
-269 |
- |
269 |
-269 |
|
|
|
Other Capital |
- |
380 |
-380 |
- |
423 |
-423 |
|
|
b) |
Portfolio Investment |
28,638 |
25,069 |
3,569 |
32,220 |
30,373 |
1,847 |
|
|
|
i) In India |
28,625 |
25,063 |
3,562 |
32,179 |
30,351 |
1,828 |
|
|
|
of which |
|
|
|
|
|
|
|
|
|
FIIs |
28,418 |
25,063 |
3,355 |
30,329 |
30,351 |
-22 |
|
|
|
GDRs/ADRs |
207 |
- |
207 |
1,848 |
- |
1,848 |
|
|
|
ii) Abroad |
13 |
6 |
7 |
41 |
22 |
19 |
|
2. |
Loans (a+b+c) |
14,731 |
8,250 |
6,481 |
17,184 |
9,168 |
8,016 |
|
|
a) |
External Assistance |
1,113 |
494 |
619 |
1,289 |
523 |
766 |
|
|
|
i) By India |
5 |
8 |
-3 |
5 |
8 |
-3 |
|
|
|
ii) To India |
1,108 |
486 |
622 |
1,284 |
515 |
769 |
|
|
b) |
Commercial Borrowings |
5,418 |
1,369 |
4,049 |
7,734 |
1,418 |
6,316 |
|
|
|
i) By India |
425 |
345 |
80 |
- |
228 |
-228 |
|
|
|
ii) To India |
4,993 |
1,024 |
3,969 |
7,734 |
1,190 |
6,544 |
|
|
c) |
Short Term To India |
8,200 |
6,387 |
1,813 |
8,161 |
7,227 |
934 |
|
|
|
i) Suppliers’ Credit >180 days & Buyers’ Credit |
5,660 |
6,387 |
-727 |
8,161 |
6,022 |
2,139 |
|
|
|
ii) Suppliers’ Credit up to 180 days |
2,540 |
- |
2,540 |
- |
1,205 |
-1,205 |
|
3. |
Banking Capital (a+b) |
7,160 |
10,273 |
-3,113 |
14,386 |
12,703 |
1,683 |
|
|
a) |
Commercial Banks |
6,944 |
10,239 |
-3,295 |
14,264 |
12,703 |
1,561 |
|
|
|
i) Assets |
556 |
4,530 |
-3,974 |
7,085 |
8,000 |
-915 |
|
|
|
ii) Liabilities |
6,388 |
5,709 |
679 |
7,179 |
4,703 |
2,476 |
|
|
|
of which: Non-Resident Deposits |
6,325 |
4,862 |
1,463 |
5,158 |
4,510 |
648 |
|
|
b) |
Others |
216 |
34 |
182 |
122 |
- |
122 |
|
4. |
Rupee Debt Service |
- |
2 |
-2 |
- |
93 |
-93 |
|
5. |
Other Capital |
1,976 |
994 |
982 |
4,828 |
1,419 |
3,409 |
|
Total Capital Account (1 to 5) |
62,513 |
51,698 |
10,815 |
74,178 |
58,375 |
15,803 |
C. |
Errors & Omissions |
294 |
- |
294 |
426 |
- |
426 |
D. |
Overall Balance (Total Current Account, Capital Account and Errors & Omissions (A+B+C)) |
123,335 |
115,830 |
7,505 |
145,358 |
124,906 |
20,452 |
E. |
Monetary Movements (i+ii) |
- |
7,505 |
-7,505 |
- |
20,452 |
-20,452 |
|
i) |
I.M.F. |
- |
- |
- |
- |
- |
- |
|
ii) |
Foreign Exchange Reserves
(Increase – / Decrease +) |
- |
7,505 |
-7,505 |
- |
20,452 |
-20,452 |
Statement I : India's Overall Balance of Payments (Contd.) |
(US$ million) |
Item |
Apr-Jun 2007PR |
Jul-Sep 2007 PR |
Credit |
Debit |
Net |
Credit |
Debit |
Net |
1 |
26 |
27 |
28 |
29 |
30 |
31 |
A. |
Current Account |
|
|
|
|
|
|
|
I. |
Merchandise |
34,356 |
56,346 |
-21,990 |
38,273 |
59,510 |
-21,237 |
|
II. |
Invisibles (a+b+c) |
29,880 |
14,570 |
15,310 |
34,013 |
17,073 |
16,940 |
|
|
a) Services |
18,890 |
9,916 |
8,974 |
20,587 |
11,589 |
8,998 |
|
|
i) Travel |
2,088 |
1,906 |
182 |
2,248 |
2,047 |
201 |
|
|
ii) Transportation |
1,953 |
2,526 |
-573 |
2,091 |
2,559 |
-468 |
|
|
iii)Insurance |
373 |
185 |
188 |
341 |
284 |
57 |
|
|
iv) G.n.i.e. |
94 |
110 |
-16 |
68 |
128 |
-60 |
|
|
v) Miscellaneous |
14,382 |
5,189 |
9,193 |
15,839 |
6,571 |
9,268 |
|
|
of which |
|
|
|
|
|
|
|
|
Software Services |
8,836 |
679 |
8,157 |
9,050 |
801 |
8,249 |
|
|
Business Services |
3,758 |
3,163 |
595 |
3,894 |
3,537 |
357 |
|
|
Financial Services |
528 |
449 |
79 |
916 |
702 |
214 |
|
|
Communication Services |
513 |
231 |
282 |
613 |
180 |
433 |
|
|
b) Transfers |
8,628 |
432 |
8,196 |
9,708 |
408 |
9,300 |
|
|
i) Official |
153 |
165 |
-12 |
158 |
112 |
46 |
|
|
ii) Private |
8,475 |
267 |
8,208 |
9,550 |
296 |
9,254 |
|
|
c) Income |
2,362 |
4,222 |
-1,860 |
3,718 |
5,076 |
-1,358 |
|
|
i) Investment Income |
2,279 |
4,024 |
-1,745 |
3,608 |
4,778 |
-1,170 |
|
|
ii) Compensation of Employees |
83 |
198 |
-115 |
110 |
298 |
-188 |
|
Total Current Account (I+II) |
64,236 |
70,916 |
-6,680 |
72,286 |
76,583 |
-4,297 |
B. |
Capital Account |
|
|
|
|
|
|
|
1. |
Foreign Investment (a+b) |
43,034 |
32,756 |
10,278 |
54,205 |
41,178 |
13,027 |
|
|
a) Foreign Direct Investment (i+ii) |
8,270 |
5,534 |
2,736 |
5,502 |
3,374 |
2,128 |
|
|
i) In India |
7,477 |
20 |
7,457 |
4,728 |
19 |
4,709 |
|
|
Equity |
5,574 |
20 |
5,554 |
2,822 |
19 |
2,803 |
|
|
Reinvested Earnings |
1,792 |
- |
1,792 |
1,792 |
- |
1,792 |
|
|
Other Capital |
111 |
- |
111 |
114 |
- |
114 |
|
|
ii) Abroad |
793 |
5,514 |
-4,721 |
774 |
3,355 |
-2,581 |
|
|
Equity |
793 |
4,758 |
-3,965 |
774 |
2,515 |
-1,741 |
|
|
Reinvested Earnings |
- |
271 |
-271 |
- |
271 |
-271 |
|
|
Other Capital |
- |
485 |
-485 |
- |
569 |
-569 |
|
|
b) Portfolio Investment |
34,764 |
27,222 |
7,542 |
48,703 |
37,804 |
10,899 |
|
|
i) In India |
34,706 |
27,216 |
7,490 |
48,698 |
37,781 |
10,917 |
|
|
of which |
|
|
|
|
|
|
|
|
FIIs |
34,305 |
27,216 |
7,089 |
46,199 |
37,781 |
8,418 |
|
|
GDRs/ADRs |
316 |
- |
316 |
2,477 |
- |
2,477 |
|
|
ii) Abroad |
58 |
6 |
52 |
5 |
23 |
-18 |
|
2. |
Loans (a+b+c) |
16,749 |
7,593 |
9,156 |
19,742 |
10,437 |
9,305 |
|
|
a) External Assistance |
732 |
491 |
241 |
983 |
515 |
468 |
|
|
i) By India |
6 |
7 |
-1 |
6 |
7 |
-1 |
|
|
ii) To India |
726 |
484 |
242 |
977 |
508 |
469 |
|
|
b) Commercial Borrowings |
8,291 |
1,338 |
6,953 |
6,290 |
2,080 |
4,210 |
|
|
i) By India |
359 |
345 |
14 |
443 |
503 |
-60 |
|
|
ii) To India |
7,932 |
993 |
6,939 |
5,847 |
1,577 |
4,270 |
|
|
c) Short Term To India |
7,726 |
5,764 |
1,962 |
12,469 |
7,842 |
4,627 |
|
|
i) Suppliers’ Credit >180 days & Buyers’ Credit |
6,883 |
5,764 |
1,119 |
11,012 |
7,842 |
3,170 |
|
|
ii) Suppliers’ Credit up to 180 days |
843 |
- |
843 |
1,457 |
- |
1,457 |
|
3. |
Banking Capital (a+b) |
8,560 |
9,479 |
-919 |
13,714 |
7,071 |
6,643 |
|
|
a) Commercial Banks |
8,560 |
9,473 |
-913 |
13,690 |
7,000 |
6,690 |
|
|
i) Assets |
2,543 |
2,861 |
-318 |
4,404 |
358 |
4,046 |
|
|
ii) Liabilities |
6,017 |
6,612 |
-595 |
9,286 |
6,642 |
2,644 |
|
|
of which: Non-Resident Deposits |
5,252 |
5,699 |
-447 |
6,975 |
6,606 |
369 |
|
|
b) Others |
- |
6 |
-6 |
24 |
71 |
-47 |
|
4. |
Rupee Debt Service |
- |
43 |
-43 |
- |
2 |
-2 |
|
5. |
Other Capital |
1,151 |
1,831 |
-680 |
7,378 |
3,196 |
4,182 |
|
Total Capital Account (1 to 5) |
69,494 |
51,702 |
17,792 |
95,039 |
61,884 |
33,155 |
C. |
Errors & Omissions |
88 |
- |
88 |
378 |
- |
378 |
D. |
Overall Balance (Total Current Account, Capital Account and Errors & Omissions (A+B+C)) |
133,818 |
122,618 |
11,200 |
167,703 |
138,467 |
29,236 |
E. |
Mo netary Movements (i+ii) |
- |
11,200 |
-11,200 |
- |
29,236 |
-29,236 |
|
i) |
I.M.F. |
- |
- |
- |
- |
- |
- |
|
ii) |
Foreign Exchange Reserves
(Increase – / Decrease +) |
- |
11,200 |
-11,200 |
- |
29,236 |
-29,236 |
Statement I : India's Overall Balance of Payments (Contd.) |
(US$ million) |
Item |
Oct-Dec 2007PR |
Jan-Mar 2008 PR |
Credit |
Debit |
Net |
Credit |
Debit |
Net |
1 |
32 |
33 |
34 |
35 |
36 |
37 |
A. |
Current Account |
|
|
|
|
|
|
|
I. |
Merchandise |
40,985 |
67,038 |
-26,053 |
52,549 |
74,895 |
-22,346 |
|
II. |
Invisibles (a+b+c) |
39,553 |
18,031 |
21,522 |
45,158 |
24,338 |
20,820 |
|
|
a) |
Services |
24,618 |
12,592 |
12,026 |
25,982 |
18,415 |
7,567 |
|
|
|
i) Travel |
3,395 |
2,519 |
876 |
3,618 |
2,782 |
836 |
|
|
|
ii) Transportation |
2,799 |
3,043 |
-244 |
3,171 |
3,386 |
-215 |
|
|
|
iii) Insurance |
438 |
261 |
177 |
487 |
314 |
173 |
|
|
|
iv) G.n.i.e. |
90 |
75 |
15 |
78 |
63 |
15 |
|
|
|
v) Miscellaneous |
17,896 |
6,694 |
11,202 |
18,628 |
11,870 |
6,758 |
|
|
|
of which |
|
|
|
|
|
|
|
|
|
Software Services |
9,608 |
852 |
8,756 |
12,806 |
726 |
12,080 |
|
|
|
Business Services |
4,588 |
4,245 |
343 |
4,531 |
5,770 |
-1,239 |
|
|
|
Financial Services |
882 |
763 |
119 |
891 |
1,224 |
-333 |
|
|
|
Communication Services |
601 |
183 |
418 |
681 |
265 |
416 |
|
|
b) |
Transfers |
11,428 |
493 |
10,935 |
14,495 |
982 |
13,513 |
|
|
|
i) Official |
195 |
121 |
74 |
247 |
116 |
131 |
|
|
|
ii) Private |
11,233 |
372 |
10,861 |
14,248 |
866 |
13,382 |
|
|
c) |
Income |
3,507 |
4,946 |
-1,439 |
4,681 |
4,941 |
-260 |
|
|
|
i) Investment Income |
3,401 |
4,679 |
-1,278 |
4,520 |
4,608 |
-88 |
|
|
|
ii) Compensation of Employees |
106 |
267 |
-161 |
161 |
333 |
-172 |
Total Current Account (I+II) |
80,538 |
85,069 |
-4,531 |
97,707 |
99,233 |
-1,526 |
B. |
Capital Account |
|
|
|
|
|
|
|
1. |
Foreign Investment (a+b) |
86,531 |
69,639 |
16,892 |
88,992 |
84,232 |
4,760 |
|
|
a) |
Foreign Direct Investment (i+ii) |
8,316 |
6,275 |
2,041 |
14,750 |
6,254 |
8,496 |
|
|
|
i) In India |
7,916 |
43 |
7,873 |
14,240 |
43 |
14,197 |
|
|
|
Equity |
6,022 |
43 |
5,979 |
12,448 |
26 |
12,422 |
|
|
|
Reinvested Earnings |
1,792 |
- |
1,792 |
1,792 |
- |
1,792 |
|
|
|
Other Capital |
102 |
- |
102 |
- |
17 |
-17 |
|
|
|
ii) Abroad |
400 |
6,232 |
-5,832 |
510 |
6,211 |
-5,701 |
|
|
|
Equity |
400 |
5,206 |
-4,806 |
510 |
4,419 |
-3,909 |
|
|
|
Reinvested Earnings |
- |
271 |
-271 |
- |
271 |
-271 |
|
|
|
Other Capital |
- |
755 |
-755 |
- |
1,521 |
-1,521 |
|
|
b) |
Portfolio Investment |
78,215 |
63,364 |
14,851 |
74,242 |
77,978 |
-3,736 |
|
|
|
i) In India |
78,096 |
63,345 |
14,751 |
74,188 |
77,952 |
-3,764 |
|
|
|
of which |
|
|
|
|
|
|
|
|
|
FIIs |
72,309 |
63,345 |
8,964 |
73,808 |
77,952 |
-4,144 |
|
|
|
GDRs/ADRs |
5,597 |
- |
5,597 |
379 |
- |
379 |
|
|
|
ii) Abroad |
119 |
19 |
100 |
54 |
26 |
28 |
|
2. |
Loans (a+b+c) |
21,543 |
10,601 |
10,942 |
25,494 |
12,967 |
12,527 |
|
|
a) |
External Assistance |
1,109 |
544 |
565 |
1,417 |
577 |
840 |
|
|
|
i) By India |
6 |
7 |
-1 |
6 |
7 |
-1 |
|
|
|
ii) To India |
1,103 |
537 |
566 |
1,411 |
570 |
841 |
|
|
b) |
Commercial Borrowings |
8,449 |
2,202 |
6,247 |
7,346 |
2,123 |
5,223 |
|
|
|
i) By India |
363 |
384 |
-21 |
427 |
392 |
35 |
|
|
|
ii) To India |
8,086 |
1,818 |
6,268 |
6,919 |
1,731 |
5,188 |
|
|
c) |
Short Term To India |
11,985 |
7,855 |
4,130 |
16,731 |
10,267 |
6,464 |
|
|
|
i) Suppliers’ Credit >180 days & Buyers’ Credit |
10,231 |
7,855 |
2,376 |
14,515 |
10,267 |
4,248 |
|
|
|
ii) Suppliers’ Credit up to 180 days |
1,754 |
- |
1,754 |
2,216 |
- |
2,216 |
|
3. |
Banking Capital (a+b) |
12,588 |
12,381 |
207 |
20,951 |
15,125 |
5,826 |
|
|
a) |
Commercial Banks |
12,585 |
12,029 |
556 |
20,899 |
15,122 |
5,777 |
|
|
|
i) Assets |
5,636 |
3,939 |
1,697 |
6,979 |
5,510 |
1,469 |
|
|
|
ii) Liabilities |
6,949 |
8,090 |
-1,141 |
13,920 |
9,612 |
4,308 |
|
|
|
of which: Non-Resident Deposits |
6,456 |
7,309 |
-853 |
10,718 |
9,608 |
1,110 |
|
|
b) |
Others |
3 |
352 |
-349 |
52 |
3 |
49 |
|
4. |
Rupee Debt Service |
- |
- |
- |
- |
76 |
-76 |
|
5. |
Other Capital |
6,612 |
3,636 |
2,976 |
5,763 |
2,771 |
2,992 |
|
Total Capital Account (1 to 5) |
127,274 |
96,257 |
31,017 |
141,200 |
115,171 |
26,029 |
C. |
Errors & Omissions |
252 |
- |
252 |
487 |
- |
487 |
D. |
Overall Balance (Total Current Account, Capital Account and Errors & Omissions (A+B+C)) |
208,064 |
181,326 |
26,738 |
239,394 |
214,404 |
24,990 |
E. |
Monetary Movements (i+ii) |
- |
26,738 |
-26,738 |
|
24,990 |
-24,990 |
|
i) |
I.M.F. |
|
|
|
|
|
|
|
ii) |
Foreign Exchange Reserves
(Increase – / Decrease +) |
- |
26,738 |
-26,738 |
- |
24,990 |
-24,990 |
Statement I : India’s Overall Balance of Payments (Contd.) |
(US$ million) |
Item |
Apr-Jun 2008 PR |
Jul-Sep 2008 PR |
Oct-Dec 2008 PR |
|
Credit |
Debit |
Net |
Credit |
Debit |
Net |
Credit |
Debit |
Net |
1 |
38 |
39 |
40 |
41 |
42 |
43 |
44 |
45 |
46 |
A. |
Current Account |
|
I. |
Merchandise |
49,120 |
80,545 |
-31,425 |
48,987 |
87,663 |
-38,676 |
37,257 |
71,961 |
-34,704 |
|
II. |
Invisibles (a+b+c) |
38,939 |
16,533 |
22,406 |
45,696 |
19,532 |
26,164 |
40,260 |
18,589 |
21,671 |
|
|
a) |
Services |
23,059 |
11,441 |
11,618 |
27,832 |
13,775 |
14,057 |
26,075 |
12,923 |
13,152 |
|
|
|
i) Travel |
2,504 |
2,164 |
340 |
2,786 |
2,704 |
82 |
2,924 |
1,953 |
971 |
|
|
|
ii) Transportation |
2,611 |
3,328 |
-717 |
2,964 |
3,744 |
-780 |
2,572 |
3,210 |
-638 |
|
|
|
iii) Insurance |
350 |
228 |
122 |
367 |
306 |
61 |
344 |
269 |
75 |
|
|
|
iv) G.n.i.e. |
130 |
110 |
20 |
81 |
95 |
-14 |
97 |
233 |
-136 |
|
|
|
v) Miscellaneous |
17,464 |
5,611 |
11,853 |
21,634 |
6,926 |
14,708 |
20,138 |
7,258 |
12,880 |
|
|
|
of which |
|
|
|
|
|
|
|
|
|
|
|
|
Software Services |
12,156 |
857 |
11,299 |
12,220 |
924 |
11,296 |
11,444 |
580 |
10,864 |
|
|
|
Business Services |
3,550 |
3,133 |
417 |
4,840 |
3,984 |
856 |
4,012 |
3,540 |
472 |
|
|
|
Financial Services |
609 |
628 |
-19 |
1,670 |
965 |
705 |
889 |
735 |
154 |
|
|
|
Communication Services |
510 |
226 |
284 |
740 |
296 |
444 |
492 |
217 |
275 |
|
|
b) |
Transfers |
12,307 |
654 |
11,653 |
13,719 |
829 |
12,890 |
10,994 |
844 |
10,150 |
|
|
|
i) Official |
148 |
107 |
41 |
51 |
97 |
-46 |
285 |
98 |
187 |
|
|
|
ii) Private |
12,159 |
547 |
11,612 |
13,668 |
732 |
12,936 |
10,709 |
746 |
9,963 |
|
|
c) |
Income |
3,573 |
4,438 |
-865 |
4,145 |
4,928 |
-783 |
3,191 |
4,822 |
-1,631 |
|
|
|
i) Investment Income |
3,418 |
4,108 |
-690 |
3,855 |
4,596 |
-741 |
3,000 |
4,481 |
-1,481 |
|
|
|
ii) Compensation of employees |
155 |
330 |
-175 |
290 |
332 |
-42 |
191 |
341 |
-150 |
|
Total C urrent Account (I+II) |
88,059 |
97,078 |
-9,019 |
94,683 |
107,195 |
-12,512 |
77,517 |
90,550 |
-13,033 |
B. |
Capital Account |
|
1. |
Foreign Investment (a+b) |
52,901 |
48,145 |
4,756 |
51,774 |
48,184 |
3,590 |
33,162 |
38,538 |
-5,376 |
|
|
a) |
Foreign Direct Investment (i+ii) |
12,137 |
3,170 |
8,967 |
9,143 |
4,243 |
4,900 |
6,564 |
6,120 |
444 |
|
|
|
i.) In India |
11,898 |
22 |
11,876 |
8,825 |
52 |
8,773 |
6,352 |
29 |
6,323 |
|
|
|
Equity |
10,240 |
22 |
10,218 |
7,304 |
52 |
7,252 |
4,109 |
29 |
4,080 |
|
|
|
Reinvested Earnings |
1,492 |
- |
1,492 |
1,492 |
- |
1,492 |
1,721 |
- |
1,721 |
|
|
|
Other Capital |
166 |
- |
166 |
29 |
- |
29 |
522 |
-522 |
|
|
|
|
ii.) Abroad |
239 |
3,148 |
-2,909 |
318 |
4,191 |
-3,873 |
212 |
6,091 |
-5,879 |
|
|
|
Equity |
239 |
2,346 |
-2,107 |
318 |
3,426 |
-3,108 |
212 |
4,489 |
-4,277 |
|
|
|
Reinvested Earnings |
- |
271 |
-271 |
- |
271 |
-271 |
- |
271 |
-271 |
|
|
|
Other Capital |
- |
531 |
-531 |
- |
494 |
-494 |
- |
1,331 |
-1,331 |
|
|
b) |
Portfolio Investment |
40,764 |
44,975 |
-4,211 |
42,631 |
43,941 |
-1,310 |
26,598 |
32,418 |
-5,820 |
|
|
|
i) In India |
40,745 |
44,923 |
-4,178 |
42,618 |
43,919 |
-1,301 |
26,568 |
32,355 |
-5,787 |
|
|
|
of which |
|
|
|
|
|
|
|
|
|
|
|
|
FIIs |
39,746 |
44,923 |
-5,177 |
42,482 |
43,919 |
-1,437 |
26,561 |
32,355 |
-5,794 |
|
|
|
GDRs/ADRs |
999 |
- |
999 |
136 |
- |
136 |
7 |
- |
7 |
|
|
|
ii) Abroad |
19 |
52 |
-33 |
13 |
22 |
-9 |
30 |
63 |
-33 |
|
2. |
Loans (a+b+c) |
13,845 |
9,630 |
4,215 |
16,282 |
12,782 |
3,500 |
15,818 |
14,934 |
884 |
|
|
a) |
External Assistance |
909 |
558 |
351 |
1,095 |
577 |
518 |
1,655 |
663 |
992 |
|
|
|
i) By India |
6 |
8 |
-2 |
6 |
8 |
-2 |
6 |
8 |
-2 |
|
|
|
ii) To India |
903 |
550 |
353 |
1,089 |
569 |
520 |
1,649 |
655 |
994 |
|
|
b) |
Commercial Borrowings |
2,760 |
1,293 |
1,467 |
3,578 |
1,888 |
1,690 |
5,448 |
1,564 |
3,884 |
|
|
|
i) By India |
404 |
193 |
211 |
532 |
138 |
394 |
669 |
149 |
520 |
|
|
|
ii) To India |
2,356 |
1,100 |
1,256 |
3,046 |
1,750 |
1,296 |
4,779 |
1,415 |
3,364 |
|
|
c) |
Short Term to India |
10,176 |
7,779 |
2,397 |
11,609 |
10,317 |
1,292 |
8,715 |
12,707 |
-3,992 |
|
|
|
i) Suppliers’ Credit > 180 days & Buyers’ Credit |
9,256 |
7,779 |
1,477 |
11,609 |
9,766 |
1,843 |
8,715 |
10,357 |
-1,642 |
|
|
|
ii) Suppliers’ Credit up to 180 days |
920 |
- |
920 |
- |
551 |
-551 |
- |
2,350 |
-2,350 |
|
3. |
Banking Capital (a+b) |
21,952 |
19,256 |
2,696 |
16,208 |
14,084 |
2,124 |
14,810 |
19,766 |
-4,956 |
|
|
a) |
Commercial Banks |
21,952 |
19,105 |
2,847 |
16,208 |
14,081 |
2,127 |
14,808 |
19,335 |
-4,527 |
|
|
|
i) Assets |
11,457 |
10,533 |
924 |
6,446 |
5,154 |
1,292 |
5,192 |
7,541 |
-2,349 |
|
|
|
ii) Liabilities |
10,495 |
8,572 |
1,923 |
9,762 |
8,927 |
835 |
9,616 |
11,794 |
-2,178 |
|
|
|
of which :Non-Resident Deposits |
9,063 |
8,249 |
814 |
9,174 |
8,915 |
259 |
9,523 |
8,481 |
1,042 |
|
|
b) |
Others |
- |
151 |
-151 |
- |
3 |
-3 |
2 |
431 |
-429 |
|
4. |
Rupee Debt Service |
- |
30 |
-30 |
- |
3 |
-3 |
- |
- |
- |
|
5. |
Other Capital |
2,176 |
2,678 |
-502 |
764 |
2,410 |
-1,646 |
5,670 |
488 |
5,182 |
|
Total Capital Account (1to5) |
90,874 |
79,739 |
11,135 |
85,028 |
77,463 |
7,565 |
69,460 |
73,726 |
-4,266 |
C. |
Errors & Omissions |
119 |
- |
119 |
213 |
- |
213 |
- |
582 |
-582 |
D. |
Overall Balance (Total Current Account, Capital Account and Errors & Omissions (A+B+C)) |
179,052 |
176,817 |
2,235 |
179,924 |
184,658 |
-4,734 |
146,977 |
164,858 |
-17,881 |
E. |
Monetary Movements (i+ii) |
- |
2,235 |
-2,235 |
4,734 |
- |
4,734 |
17,881 |
- |
17,881 |
|
i) |
I.M.F. |
- |
- |
- |
- |
- |
- |
- |
- |
- |
|
ii) |
Foreign Exchange Reserves
( Increase - / Decrease +) |
- |
2,235 |
-2,235 |
4,734 |
- |
4,734 |
17,881 |
- |
17,881 |
P: Preliminary. PR: Partially Revised. |
Statement I : India’s Overall Balance of Payments (Concld.) |
(US$ million) |
Item |
Jan-Mar 2009 P |
Apr-Jun 2009 P |
Credit |
Debit |
Net |
Credit |
Debit |
Net |
1 |
47 |
48 |
49 |
50 |
51 |
52 |
A. |
Current Account |
|
|
|
|
|
|
|
I. |
Merchandise |
39,820 |
54,418 |
-14,598 |
38,789 |
64,775 |
-25,986 |
|
II. |
Invisibles (a+b+c) |
37,661 |
18,316 |
19,345 |
38,684 |
18,505 |
20,179 |
|
|
a) |
Services |
24,258 |
13,267 |
10,991 |
22,389 |
13,351 |
9,038 |
|
|
|
i) Travel |
2,680 |
2,611 |
69 |
2,286 |
2,004 |
282 |
|
|
|
ii) Transportation |
2,919 |
2,495 |
424 |
2,490 |
2,777 |
-287 |
|
|
|
iii) Insurance |
348 |
328 |
20 |
387 |
314 |
73 |
|
|
|
iv) G.n.i.e. |
81 |
353 |
-272 |
100 |
103 |
-3 |
|
|
|
v) Miscellaneous |
18,230 |
7,480 |
10,750 |
17,127 |
8,153 |
8,973 |
|
|
|
of which |
|
|
|
|
|
|
|
|
|
Software Services |
11,180 |
453 |
10,727 |
10,764 |
391 |
10,373 |
|
|
|
Business Services |
3,849 |
4,612 |
-763 |
2,586 |
3,645 |
-1,059 |
|
|
|
Financial Services |
771 |
633 |
138 |
1,116 |
928 |
189 |
|
|
|
Communication Services |
428 |
257 |
171 |
418 |
312 |
106 |
|
|
b) |
Transfers |
10,005 |
419 |
9,586 |
13,344 |
466 |
12,878 |
|
|
|
i) Official |
161 |
111 |
50 |
46 |
107 |
-61 |
|
|
|
ii) Private |
9,844 |
308 |
9,536 |
13,298 |
360 |
12,939 |
|
|
c) |
Income |
3,398 |
4,630 |
-1,232 |
2,951 |
4,688 |
-1,737 |
|
|
|
i) Investment Income |
3,209 |
4,314 |
-1,105 |
2,723 |
4,350 |
-1,627 |
|
|
|
ii) Compensation of employees |
189 |
316 |
-127 |
227 |
338 |
-110 |
|
Total Current Account (I+II) |
77,481 |
72,734 |
4,747 |
77,473 |
83,280 |
-5,808 |
B |
Capital Account |
|
|
|
|
|
|
|
1. |
Foreign Investment (a+b) |
27,072 |
26,580 |
492 |
48,238 |
33,136 |
15,101 |
|
|
a) |
Foreign Direct Investment (i+ii) |
8,414 |
5,229 |
3,185 |
9,612 |
2,779 |
6,833 |
|
|
|
i. In India |
8,073 |
63 |
8,010 |
9,488 |
29 |
9,459 |
|
|
|
Equity |
6,322 |
63 |
6,259 |
7,401 |
29 |
7,372 |
|
|
|
Reinvested Earnings |
1,721 |
- |
1,721 |
1,696 |
- |
1,696 |
|
|
|
Other Capital |
30 |
- |
30 |
391 |
- |
391 |
|
|
|
ii. Abroad |
341 |
5,166 |
-4,825 |
125 |
2,750 |
-2,626 |
|
|
|
Equity |
341 |
4,407 |
-4,066 |
125 |
2,053 |
-1,928 |
|
|
|
Reinvested Earnings |
- |
271 |
-271 |
0 |
271 |
-271 |
|
|
|
Other Capital |
- |
488 |
-488 |
0 |
426 |
-426 |
|
|
b) |
Portfolio Investment |
18,658 |
21,351 |
-2,693 |
38,625 |
30,357 |
8,268 |
|
|
|
i) In India |
18,580 |
21,169 |
-2,589 |
38,602 |
30,332 |
8,270 |
|
|
|
of which |
|
|
|
|
|
|
|
|
|
FIIs |
18,560 |
21,169 |
-2,609 |
38,559 |
30,332 |
8,227 |
|
|
|
GDRs/ADRs |
20 |
- |
20 |
43 |
0 |
43 |
|
|
|
ii) Abroad |
78 |
182 |
-104 |
23 |
25 |
-2 |
|
2. |
Loans (a+b+c) |
14,213 |
17,811 |
-3,598 |
13,038 |
16,395 |
-3,357 |
|
|
a) |
External Assistance |
1,383 |
606 |
777 |
821 |
737 |
84 |
|
|
|
i) By India |
6 |
8 |
-2 |
13 |
116 |
-103 |
|
|
|
ii) To India |
1,377 |
598 |
779 |
808 |
620 |
188 |
|
|
b) |
Commercial Borrowings |
3,596 |
2,479 |
1,117 |
2,092 |
2,448 |
-356 |
|
|
|
i) By India |
400 |
305 |
95 |
244 |
333 |
-89 |
|
|
|
ii) To India |
3,196 |
2,174 |
1,022 |
1,848 |
2,115 |
-267 |
|
|
c) |
Short Term to India |
9,234 |
14,726 |
-5,492 |
10,126 |
13,211 |
-3,085 |
|
|
|
i) Suppliers’ Credit > 180 days & Buyers’ Credit |
9,234 |
10,450 |
-1,216 |
10,126 |
9,590 |
536 |
|
|
|
ii) Suppliers’ Credit up to 180 days |
- |
4,276 |
-4,276 |
0 |
3,621 |
-3,621 |
|
|
a) |
Commercial Banks |
11,917 |
15,289 |
-3,372 |
15,577 |
18,704 |
-3,127 |
|
|
|
i) Assets |
2,578 |
5,498 |
-2,920 |
4,368 |
6,946 |
-2,578 |
|
|
|
ii) Liabilities |
9,339 |
9,791 |
-452 |
11,209 |
11,758 |
-549 |
|
|
|
of which :Non-Resident Deposits |
9,329 |
7,154 |
2,175 |
11,172 |
9,354 |
1,817 |
|
|
b) |
Others |
111 |
- |
111 |
- |
239 |
-238 |
|
4. |
Rupee Debt Service |
- |
68 |
-68 |
- |
23 |
-23 |
|
5. |
Other Capital |
3,781 |
2,634 |
1,147 |
1,636 |
3,256 |
-1,620 |
|
Total Capital Account (1to5) |
57,094 |
62,382 |
-5,288 |
78,489 |
71,753 |
6,736 |
C |
Errors & Omissions |
841 |
- |
841 |
- |
813 |
-813 |
D. |
Overall Balance (Total Current Account, Capital Account and Errors & Omissions (A+B+C)) |
135,416 |
135,116 |
300 |
155,961 |
155,846 |
115 |
E |
Monetary Movements (i+ii) |
- |
300 |
-300 |
- |
115 |
-115 |
|
i) |
I.M.F. |
- |
- |
- |
- |
- |
- |
|
ii) |
Foreign Exchange Reserves
( Increase - / Decrease +) |
- |
300 |
-300 |
- |
115 |
-115 |
* Prepared in the Division of International Finance, Department of Economic Analysis and Policy, Reserve Bank of India, |