India’s Balance of Payments Developments during the Fourth Quarter (January-March 2009) of 2008-09 and 2008-09 (April-March)* The data on India’s balance of payments (BoP) are compiled and published by the Reserve Bank on a quarterly basis with a lag of one quarter. Accordingly, the preliminary data on India’s BoP for the fourth quarter (Q4) of the financial year 2008-09, i.e., January-March 2009 and financial year 2008-09 along with the partially revised data for the first three quarters i.e., April-June 2008 (Q1), July-September 2008 (Q2) and October-December 2008 (Q3) were released by the Reserve Bank on June 30, 2009. The developments in India’s BoP for January-March 2009 quarter and full year 2008-09 are presented here. Major Highlights of BoP January-March (Q4) of 2008-09 (i) On a BoP basis, India’s merchandise exports recorded a sharp decline of 24.2 per cent in Q4 of 2008-09 as against an increase of 47.2 per cent in Q4 of 2007-08. The decline in exports became more pronounced during Q4 of 2008-09 as compared with Q3 of 2008-09 attributed to a more synchronised global economic downturn. (ii) Import growth turned negative (decline of 27.3 per cent) during Q4 of 2008-09 after a gap of almost 7 years, mainly led by lower crude oil prices and lower non-oil imports reflecting slowdown of domestic economy. (iii) The current account balance witnessed a turnaround recording a surplus of US$ 4.7 billion during the quarter due to lower trade deficit and sustained support from surplus in invisibles account. (iv) The net outflows in the capital account as witnessed in Q3 of 2008-09 continued during Q4 of 2008-09, mainly due to net outflows under portfolio investment, banking capital and short-term trade credit. Financial Year 2008-09 (April-March) (i) Despite higher net invisibles surplus (7.7 per cent of GDP), the large trade deficit (10.3 per cent of GDP) led to a higher current account deficit (CAD) of 2.6 per cent of GDP during 2008-09. (ii) Notwithstanding the adverse impact of the global crisis, software services exports (4.1 per cent of GDP) and private transfer receipts (4.0 per cent of GDP) were higher during 2008-09 than the previous year. (iii) Net capital inflows (0.8 per cent of GDP) were much lower as compared with the previous year mainly due to net outflows under portfolio investment, banking capital and short-term trade credit. (iv) In the capital account, inflows under foreign direct investment (FDI) to India were higher during 2008-09 than the previous year reflecting the attractiveness of India as a long-term investment destination.NRI deposits witnessed higher inflows since September 2008 responding to the hikes in ceiling interest rates on such deposits. (v) Despite apprehensions in the second half of 2008-09 on the availability of short-term trade credit due to tightness in the global credit markets, the gross disbursements reached US$ 39.7 billion during 2008-09, while repayments stood at US$ 45.5 billion. The gap between the disbursements and repayments of short-term trade credit to India was limited to an outflow of US$ 5.8 billion during 2008-09. Thus, financing of short-term trade credit did not pose much of a problem in India. (vi) The foreign exchange reserves on BoP basis (i.e., excluding valuation) declined mainly due to higher current account deficit coupled with lower net capital inflows. 1. Balance of Payments for January-March (Q4) of 2008-09 The major items of the BoP for the fourth quarter (Q4) of 2008-09 are set out below in Table 1. Merchandise Trade Exports (i) On a BoP basis, India’s merchandise exports recorded a sharp decline of 24.2 per cent in Q4 of 2008-09 as against an increase of 47.2 per cent in Q4 of 2007-08. (ii) As per the commodity-wise data released by the Directorate General of Commercial Intelligence and Statistics (DGCI&S) for the period January-February 2009, merchandise exports declined by 25.1 per cent, reflecting a fall in exports of all commodity groups. Amongst the commodities, the exports of raw cotton, rice, sugar and molasses, iron and steel, gems and jewellery, and petroleum products showed maximum fall in export growth during this period.
Table 1: Major Items of India's Balance of Payments |
(US$ million) |
Item |
April-June |
July-September |
October-December |
January-March |
2007-08 (PR) |
2008-09 (PR) |
2007-08 (PR) |
2008-09 (PR) |
2007-08 (PR) |
2008-09 (PR) |
2007-08 (PR) |
2008-09 (P) |
1 |
2 |
3 |
4 |
5 |
6 |
7 |
8 |
9 |
1. |
Exports |
34,356 |
49,120 |
38,273 |
48,987 |
40,985 |
37,257 |
52,549 |
39,820 |
2. |
Imports |
56,346 |
80,545 |
59,510 |
87,663 |
67,038 |
71,961 |
74,895 |
54,418 |
3. |
Trade Balance (1-2) |
-21,990 |
-31,425 |
-21,237 |
-38,676 |
-26,053 |
-34,705 |
-22,346 |
-14,598 |
4. |
Invisibles, net |
15,310 |
22,406 |
16,940 |
26,164 |
21,522 |
21,672 |
20,820 |
19,345 |
5. |
Current Account Balance (3+4) |
-6,680 |
-9,019 |
-4,297 |
-12,512 |
-4,531 |
-13,032 |
-1,526 |
4,747 |
6. |
Capital Account Balance* |
17,880 |
11,254 |
33,533 |
7,778 |
31,269 |
-4,848 |
26,516 |
-4,447 |
7. |
Change in Reserves# (-Indicates increase ; + indicates decrease) |
-11,200 |
-2,235 |
-29,236 |
4,734 |
-26,738 |
17,881 |
-24,990 |
-300 |
*: Including errors and omissions. #: On BoP basis (i.e., excluding valuation). P: Preliminary. PR: Partially Revised. |
Imports (i) Import payments, on a BoP basis, also registered a sharp decline of 27.3 per cent in Q4 of 2008-09 as against a high growth of 55.8 per cent in Q4 of 2007-08. According to the data released by DGCI&S, the decline in imports is mainly attributed to the sharp fall in oil import payments due to lower crude oil prices during Q4 of 2008-09. (ii) The commodity-wise break-up of imports data released by DGCI&S revealed a sharp decline in imports of certain commodities like gold and silver, consumption goods, capital goods, and crude oil and related products leading to a decline in imports by 31.8 per cent during January-February 2009 as against an increase of 55.4 per cent during the corresponding period of previous year. Trade Balance (i) The sharp decline in both exports and imports during Q4 of 2008-09 led to a lower trade deficit. The trade deficit on a BoP basis in Q4 of 2008-09 (US$ 14.6 billion) was less than half of the average trade deficit (US$ 34.9 billion) recorded in the first three quarters of 2008-09. The trade deficit during Q4 of 2008-09 was much lower than that of Q4 of 2007-08 (US$ 22.3 billion). Invisibles (i) Both invisibles receipts and payments recorded a negative growth during Q4 of 2008-09 reflecting the impact of global economic slowdown. In net terms, the invisibles balance (US$ 19.3 billion) was marginally lower than that in the corresponding period of the previous year (US$ 20.8 billion) (Table 2). (ii) Invisibles receipts registered a decline of 16.6 per cent in Q4 of 2008-09 (as against an increase of 28.8 per cent in Q4 of 2007-08) on account of a decline in almost all categories of services, private transfers and investment income receipts. Overall services exports, however, witnessed a decline of 6.6 per cent during the quarter (as against a positive growth of 13.6 per cent in Q4 of 2007-08).
Table 2: Net Invisibles |
(US$ million) |
Item |
April-June |
July-September |
October-December |
January-March |
2007-08 (PR) |
2008-09 (PR) |
2007-08 (PR) |
2008-09 (PR) |
2007-08 (PR) |
2008-09 (PR) |
2007-08 (PR) |
2008-09 (P) |
1 |
2 |
3 |
4 |
5 |
6 |
7 |
8 |
9 |
A. |
Services (1 to 5) |
8,974 |
11,618 |
8,998 |
14,057 |
12,026 |
13,152 |
7,567 |
10,991 |
| |
1. |
Travel |
182 |
341 |
201 |
82 |
876 |
971 |
836 |
69 |
| |
2. |
Transportation |
-573 |
-717 |
-468 |
-780 |
-244 |
-638 |
-215 |
424 |
| |
3. |
Insurance |
188 |
122 |
57 |
61 |
177 |
75 |
173 |
20 |
| |
4. |
Govt. not included elsewhere |
-16 |
20 |
-60 |
-14 |
15 |
-136 |
15 |
-272 |
| |
5. |
Miscellaneous |
9,193 |
11,853 |
9,268 |
14,708 |
11,202 |
12,880 |
6,758 |
10,750 |
| |
|
Of Which: |
|
|
|
|
|
|
|
|
| |
|
Software |
8,157 |
11,299 |
8,249 |
11,296 |
8,756 |
10,864 |
12,080 |
10,727 |
| |
|
Non-Software |
1,036 |
554 |
1,019 |
3,412 |
2,446 |
2,016 |
-5,322 |
23 |
B. |
Transfers |
8,196 |
11,653 |
9,300 |
12,890 |
10,935 |
10,150 |
13,513 |
9,586 |
| |
Private |
8,208 |
11,612 |
9,254 |
12,936 |
10,861 |
9,963 |
13,382 |
9,536 |
| |
Official |
-12 |
41 |
46 |
-46 |
74 |
187 |
131 |
50 |
C. |
Income |
-1,860 |
-865 |
-1,358 |
-783 |
-1,439 |
-1,631 |
-260 |
-1,232 |
| |
Investment |
|
|
|
|
|
|
|
|
| |
Income |
-1,745 |
-690 |
-1,170 |
-741 |
-1,278 |
-1,481 |
-88 |
-1,105 |
| |
Compensation of Employees |
-115 |
-175 |
-188 |
-42 |
-161 |
-150 |
-172 |
-127 |
Invisibles (A+B+C) |
15,310 |
22,406 |
16,940 |
26,164 |
21,522 |
21,671 |
20,820 |
19,345 |
P: Preliminary. PR: Partially Revised. |
(iii) The slowdown in private transfer receipts observed during Q3 of 2008-09 continued during Q4 of 2008-09. The decline, however, was not that significant despite the deepening of the global crisis. (iv) Software services receipts also declined by 12.7 per cent during Q4 of 2008-09.However, when compared with the performance in the first three quarters of 2008-09, software exports at US$ 11.2 billion during Q4 of 2008-09 were almost in line with the average software exports of US$ 11.9 billion recorded in the first three quarters of 2008-09. (v) Invisibles payments declined by 24.7 per cent during Q4 of 2008-09, mainly led by sharp decline in payments under transportation, software services, business services and financial services account. (vi) With the decline in invisibles payments being higher than the decline in invisibles receipts, the net invisibles receipts (invisibles receipts minus invisibles payments) were marginally lower than that in the corresponding period of the previous year. Current Account Balance (i) The net surplus under invisibles not only fully financed the lower trade deficit observed during the quarter but also led to a surplus in the current account; last recorded during the fourth quarter of 2006-07. The current account surplus during the Q4 of 2008-09 stood at US $ 4.7 billion as against a deficit of US$ 1.5 billion in Q4 of 2007-08. Capital Account and Reserves (i) As was observed during Q3 of 2008-09, the capital account balance continued to be negative showing outflows of US$ 5.3 billion during Q4 of 2008-09 (net inflows of US$ 26.0 billion during Q4 of 2007-08) mainly due to net outflows under portfolio investment, banking capital and short-term trade credit (Table 3). (ii) The gross capital inflows to India during Q4 of 2008-09 slowed down remarkably to less than half at US$ 57.1 billion as compared with US$ 141.2 billion in Q4 of 2007-08. The gross capital outflows from India also slowed down to US$ 62.4 billion from US$ 115.2 billion in Q4 of 2007-08.
Table 3: Net Capital Flows |
(US$ million) |
Item |
April-June |
July-September |
October-December |
January-March |
2007-08 (PR) |
2008-09 (PR) |
2007-08 (PR) |
2008-09 (PR) |
2007-08 (PR) |
2008-09 (PR) |
2007-08 (PR) |
2008-09 (P) |
1 |
2 |
3 |
4 |
5 |
6 |
7 |
8 |
9 |
1. |
Foreign Direct Investment |
2,736 |
8,967 |
2,128 |
4,900 |
2,041 |
444 |
8,496 |
3,185 |
| |
Inward FDI |
7,457 |
11,876 |
4,709 |
8,773 |
7,873 |
6,323 |
14,197 |
8,010 |
| |
Outward FDI |
4,721 |
2,909 |
2,581 |
3,873 |
5,832 |
5,879 |
5,701 |
4,825 |
2. |
Portfolio Investment |
|
|
|
|
|
|
|
|
| |
Of which |
7,542 |
-4,211 |
10,899 |
-1,310 |
14,851 |
-5,820 |
-3,736 |
-2,693 |
| |
FIIs |
7,089 |
-5,177 |
8,419 |
-1,437 |
8,964 |
-5,794 |
-4,144 |
-2,609 |
| |
ADRs/GDRs |
316 |
999 |
2,477 |
136 |
5,597 |
7 |
379 |
20 |
3. |
External Assistance |
241 |
351 |
468 |
518 |
565 |
992 |
840 |
777 |
4. |
External Commercial Borrowings |
6,953 |
1,467 |
4,210 |
1,690 |
6,247 |
3,884 |
5,223 |
1,117 |
5. |
NRI Deposits |
-447 |
814 |
369 |
259 |
-853 |
1,042 |
1,110 |
2,175 |
6. |
Banking Capital excluding NRI Deposits |
-472 |
1,882 |
6,274 |
1,865 |
1060 |
-5,998 |
4,716 |
-5,436 |
7. |
Short-term Trade Credits |
1,962 |
2,397 |
4,627 |
1,292 |
4,130 |
-3,992 |
6,464 |
-5,492 |
8. |
Rupee Debt Service |
-43 |
-30 |
-2 |
-3 |
0 |
0 |
-76 |
-68 |
9. |
Other Capital |
-680 |
-502 |
4,182 |
-1,646 |
2,976 |
5,182 |
2,992 |
1,147 |
Total (1 to 9) |
17,792 |
11,135 |
33,155 |
7,565 |
31,017 |
-4,266 |
26,029 |
-5,288 |
P: Preliminary. PR: Partially Revised. |
(iii) Net FDI inflows (net inward FDI minus net outward FDI) amounted to US$ 3.2 billion in Q4 of 2008-09 (US$ 8.5 billion in Q4 of 2007-08). Net inward FDI stood at US$ 8.0 billion during Q4 of 2008-09 (US$ 14.2 billion in Q4 of 2007-08). Net outward FDI remained buoyant at US$ 4.8 billion in Q4 of 2008-09 (US$ 5.7 billion in Q4 of 2007-08). (iv) Portfolio investment primarily comprising foreign institutional investors’ (FIIs) investments and American Depository Receipts (ADRs)/ Global Depository Receipts (GDRs) continued to witness net outflows of US$ 2.7 billion in Q4 of 2008-09 (net outflows of US$ 3.7 billion in Q4 of 2007-08) on top of net outflows of US$ 5.8 billion observed during Q3 of 2008-09. The FIIs continued their large sales of equities in the Indian stock market, while net inflows under ADRs/GDRs dried up. In the context of portfolio flows, the trend of decline in gross inflows and outflows observed during Q3 of 2008-09 became more pronounced in Q4 of 2008-09. During Q4 of 2008-09, the gross inflows and outflows under portfolio investment were less than half of the average gross inflows and outflows observed during the first two quarters of 2008-09. (v) Net External Commercial Borrowings (ECBs) remained lower at US$ 1.1 billion in Q4 of 2008-09 (US$ 5.2 billion in Q4 of 2007-08) due to drying up of liquidity abroad. (vi) Lower disbursements reflecting tightness in the overseas markets and increased repayments, as roll over was difficult, reflected in net outflows of US$ 5.5 billion during Q4 of 2008-09 under short-term trade credit to India (as against inflows of US$ 6.5 billion in Q4 of 2007-08). (vii) The net inflows under non-resident Indian (NRI) deposits were higher at US$ 2.2 billion during Q4 of 2008-09 (inflow of US$ 1.1 billion during Q4 of 2007-08) responding to the hike in ceiling interest rates on NRI deposits. (viii) The foreign exchange reserves on BoP basis (i.e., excluding valuation) increased marginally by US$ 0.3 billion in Q4 of 2008-09 as compared with an accretion to reserves of US$ 25.0 billion in Q4 of 2007-08. The increase in the reserves was mainly due to surplus in the current account, as there was net outflow under the capital account. 2. Balance of Payments for the Financial Year 2008-09 (April-March) (i) As mentioned earlier, taking into account the partially revised data for Q1, Q2 and Q3 of 2008-09 and the preliminary data for Q4 of 2008-09, the BoP data for the financial year 2008-09 (April-March) have been compiled. While the detailed data are set out in Statements I and II in the standard format of BoP presentation, the major items are presented in Table 4. Merchandise Trade Exports (i) Due to sharp decline in exports during the second half of 2008-09, India’s merchandise exports, on a BoP basis, posted a lower growth of 5.4 per cent during 2008-09 (28.9 per cent in the corresponding period of the previous year). (ii) Reflecting the impact of the global financial crisis, the merchandise trade performance suffered drastically during the second half of 2008-09 leading to sharp decline in exports and imports. According to the data available from the DGCI&S, both exports and imports declined by 20.0 per cent and 16.6 per cent, respectively, during the second half of 2008-09 as against an increase of 32.4 per cent and 53.1 per cent, respectively, in the first half of 2008-09. The fall in exports was more pronounced in the Q4 of 2008-09 at 27.6 per cent as compared with a decline of 10.8 per cent observed in Q3 of 2008-09. On the other hand, growth in imports, after slowing down to 8.9 per cent in Q3 of 2008-09 collapsed in Q4 of 2008-09 witnessing a sharp decline of 35.9 per cent.
Table 4: Major Items of India’s Balance of Payments |
(US$ million) |
Item |
2006-07 |
2007-08 (PR) |
2008-09 (P) |
1 |
2 |
3 |
4 |
1. |
Exports |
128,888 |
166,163 |
175,184 |
2. |
Imports |
190,670 |
257,789 |
294,587 |
3. |
Trade Balance (1-2) |
-61,782 |
-91,626 |
-119,403 |
4. |
Invisibles, net |
52,217 |
74,592 |
89,586 |
5. |
Current Account Balance (3+4) |
-9,565 |
-17,034 |
-29,817 |
6. |
Capital Account Balance* |
46,171 |
109,198 |
9,737 |
7. |
Change in Reserves# (-Indicates increase;+ indicates decrease) |
-36,606 |
-92,164 |
20,080 |
*: Including errors and omissions.#: On BoP basis (i.e., excluding valuation).P: Preliminary.PR: Partially Revised. |
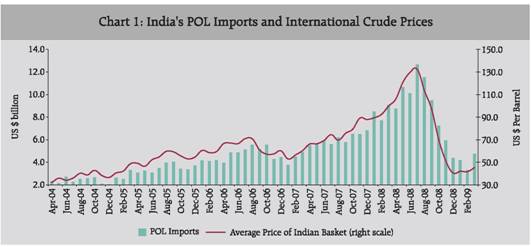
(iii) According to the commodity-wise data available for April-February 2008-09 from the DGCI&S, growth in exports of certain agricultural and allied products like tobacco and oil meal, and exports of engineering goods remained positive, while there was a decline in exports of raw cotton, rice, sugar and molasses, iron ore, carpets and handicrafts during the same period. Imports (i) Import payments, on BoP basis, slowed down to 14.3 per cent during 2008-09 from high import growth of 35.2 per cent in 2007-08, mainly due to a sharp fall in imports during Q4 of 2008-09. (ii) According to the DGCI&S data, oil imports recorded a lower growth of 16.9 per cent during 2008-09 as compared with a high growth of 39.4 per cent in 2007-08. During the same period, the growth in non-oil imports slowed down to 13.2 per cent in 2008-09 from 33.6 per cent in the previous year. In absolute terms, oil imports accounted for about 32.4 per cent of total imports during 2008-09 (31.7 per cent in 2007-08). (iii) The sharp increase in oil prices averaging US$ 116.5 per barrel during the first half of 2008-09 led to an increase in oil import payments during this period. With the decline in oil prices during the second half of 2008-09 (average of US$ 48.3 per barrel), the oil import payments came down significantly (Chart 1). For the full year 2008-09, however, the oil import payments were higher at US$ 93.2 billion as compared with US$ 79.7 billion in the previous year. According to the DGCI&S data, out of the total increase in imports of US$ 36.3 billion in 2008-09 over the previous year, oil imports contributed to an increase of US$ 13.5 billion (37.2 per cent in 2008-09 as compared with 34.3 per cent in 2007-08), while non-oil imports contributed an increase of US$ 22.8 billion (62.8 per cent in 2008-09 as compared with 65.7 per cent in 2007-08).
(iv) According to the commodity-wise DGCI&S data available for April-February 2008-09, the items under non-oil imports which showed a higher growth were edible oil, fertilizers, paper and paper products, manufactures of metals, project goods, export related items like pearls, precious and semi-precious stones, coal, coke and briquettes, and chemical materials and products, while imports of items like pulses, non-ferrous metals, transport equipments, textile yarn and fabric declined. Trade Deficit (i) On BoP basis, a sharp slowdown in exports and imports growth outpacing the growth in exports led to a widening of trade deficit to US$ 119.4 billion (or 10.3 per cent of GDP) in 2008-09 from US$ 91.6 billion (or 7.8 per cent of GDP) in 2007-08 (Chart 2).
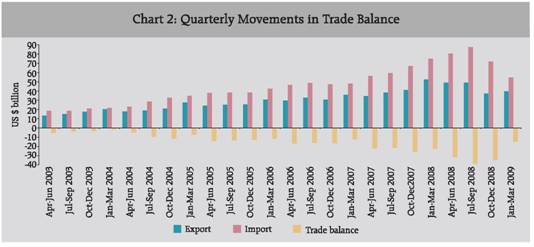
Table 5: Invisibles Gross Receipts and Payments |
(US$ million) |
Item |
Invisibles Receipts |
Invisibles Payments |
| |
2006-07 |
2007-08 (PR) |
2008-09 (P) |
2006-07 |
2007-08 (PR) |
2008-09 (P) |
1 |
2 |
3 |
4 |
5 |
6 |
7 |
A. |
Services (1 to 5) |
73,780 |
90,077 |
101,224 |
44,311 |
52,512 |
51,406 |
| |
1. |
Travel |
9,123 |
11,349 |
10,894 |
6,684 |
9,254 |
9,432 |
| |
2. |
Transportation |
7,974 |
10,014 |
11,066 |
8,068 |
11,514 |
12,777 |
| |
3. |
Insurance |
1,195 |
1,639 |
1,409 |
642 |
1,044 |
1,131 |
| |
4. |
Govt. not included elsewhere |
253 |
330 |
389 |
403 |
376 |
791 |
| |
5. |
Miscellaneous |
55,235 |
66,745 |
77,466 |
28,514 |
30,324 |
27,275 |
| |
|
Of Which: |
|
|
|
|
|
|
| |
|
Software |
31,300 |
40,300 |
47,000 |
2,267 |
3,058 |
2,814 |
| |
|
Non-Software |
23,935 |
26,445 |
30,466 |
26,247 |
27,266 |
24,461 |
B. |
Transfers (1+2) |
31,470 |
44,259 |
47,025 |
1,391 |
2,315 |
2,746 |
| |
1. |
Private |
30,835 |
43,506 |
46,380 |
1,010 |
1,801 |
2,333 |
| |
2. |
Official |
635 |
753 |
645 |
381 |
514 |
413 |
C. |
Income (1+2) |
9,308 |
14,268 |
14,307 |
16,639 |
19,185 |
18,818 |
| |
1. |
Investment Income |
8,926 |
13,808 |
13,482 |
15,688 |
18,089 |
17,499 |
| |
2. |
Compensation of Employees |
382 |
460 |
825 |
951 |
1,096 |
1,319 |
Invisibles (A+B+C) |
114,558 |
148,604 |
162,556 |
62,341 |
74,012 |
72,970 |
P: Preliminary. PR: Partially Revised.
Note: Details of Non-software services under Miscellaneous (Item 5) are given in Table 8. |
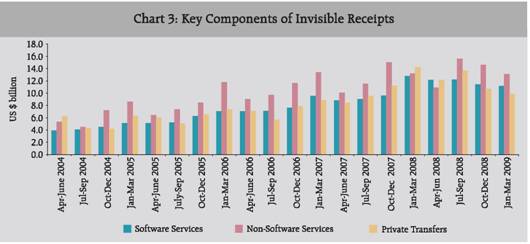
Invisibles Invisibles Receipts (i) Invisibles receipts at US$ 162.6 billion (14.0 per cent of GDP) witnessed a slower growth of 9.4 per cent during the financial year 2008-09 as compared with a growth of 29.7 per cent in the previous year (US$ 148.6 billion or 12.7 per cent of GDP) mainly due to slow pace of growth in software services and private transfer receipts along with a decline in receipts under business services, travel and investment income account (Table 5 and Chart 3). (ii) Travel receipts at US$ 10.9 billion during 2008-09 declined by 4.0 per cent as against an increase of 24.4 per cent in 2007-08 reflecting a slowdown in tourist arrivals in the country, particularly during the second half of the year. According to the data released by the Ministry of Tourism, foreign tourist arrivals declined by 9.5 per cent in the second half of 2008-09 as against an increase of 8.9 per cent in the first half of 2008-09. (iii) Private transfers are mainly in the form of (i) Inward remittances from Indian workers abroad for family maintenance, (ii) Local withdrawals from NRI Rupee deposits, (iii) Gold and silver brought through passenger baggage, and (iv) Personal gifts/ donations to charitable/religious institutions.
(iv) Private transfer receipts, comprising mainly remittances from Indians working overseas, increased to US$ 46.4 billion (4.0 per cent of GDP) during 2008-09 from US$ 43.5 billion (3.7 per cent of GDP) in the previous year. Private transfer receipts constituted 13.7 per cent of current receipts in 2008-09 (13.8 per cent in 2007-08). (v) NRI deposits, when withdrawn domestically, form part of private transfers because once withdrawn for local use these become unilateral transfers and do not have any quid pro quo. Such local withdrawals/ redemptions from NRI deposits cease to exist as liability in the capital account of the balance of payments and assume the form of private transfers, which is included in the current account of balance of payments. (vi) Under the NRI deposits, both inflows as well as outflows remained large in the recent past.A major part of outflows from NRI deposits is in the form of local withdrawals.These withdrawals, however, are not actually repatriated but are utilised domestically. During the financial year 2008-09, the share of local withdrawals in total outflows from NRI deposits declined marginally to 62.9 per cent from 64.7 per cent in 2007-08 (Table 6). (vii) Under Private transfers, the inward remittances for family maintenance accounted for about 50 per cent of the total private transfer receipts, while local withdrawals accounted for about 44 per cent in 2008-09 (Table 7). (viii) Software receipts at US$ 47.0 billion grew by 16.6 per cent during 2008-09 in line with the estimate of the NASSCOM.
Table 6: Inflows and Outflows from NRI Deposits and Local Withdrawals |
(US$ million) |
Year |
Inflows |
Outflows |
Local Withdrawals |
1 |
2 |
3 |
4 |
2006-07 |
19,914 |
15,593 |
13,208 |
2007-08 (PR) |
29,401 |
29,222 |
18,919 |
2008-09 (P) |
37,089 |
32,799 |
20,617 |
P: Preliminary. PR: Partially Revised. |
Table 7: Details of Private Transfers to India |
(US $ million) |
Year |
Total Private Transfers |
Of Which: |
Inward remittances for family maintenance |
Local withdrawals/redemptions from NRI Deposits |
Amount |
Percentage Share in Total |
Amount |
Percentage Share in Total |
1 |
2 |
3 |
4 |
5 |
6 |
2006-07 |
30,835 |
14,740 |
47.8 |
13,208 |
42.8 |
2007-08 (PR) |
43,506 |
21,920 |
50.4 |
18,919 |
43.5 |
2008-09 (P) |
46,380 |
23,148 |
49.9 |
20,617 |
44.5 |
P: Preliminary.PR: Partially Revised. |
(ix) Miscellaneous receipts, excluding software exports, stood at US$ 30.5 billion in 2008-09 (US$ 26.4 billion in 2007-08). The break-up of these data is presented in Table 8. (x) The key components of the business services receipts and payments are mainly the trade related services, business and management consultancy services, architectural, engineering and other technical services, and services relating to maintenance of offices abroad. These reflect the underlying momentum in trade of professional and technology related services. While receipts under business and management consultancy services increased, the receipts under trade related services, architectural, engineering, and other technical services declined during 2008-09 (Table 9). (xi) Investment income receipts amounted to US$ 13.5 billion in 2008-09 as compared with the US$ 13.8 billion in 2007-08.
Table 8: Break-up of Non-Software Receipts and Payments under Miscellaneous Services |
(US$ million) |
Item |
Receipts |
Payments |
2006-07 |
2007-08 (PR) |
2008-09 (P) |
2006-07 |
2007-08 (PR) |
2008-09 (P) |
1 |
2 |
3 |
4 |
5 |
6 |
7 |
1. |
Communication Services |
2,262 |
2,408 |
2,170 |
796 |
859 |
996 |
2. |
Construction |
700 |
763 |
866 |
737 |
758 |
889 |
3. |
Financial Services |
3,106 |
3,217 |
3,939 |
2,991 |
3,138 |
2,961 |
4. |
News Agency |
334 |
503 |
799 |
226 |
326 |
385 |
5. |
Royalties, Copyrights & License Fees |
97 |
157 |
132 |
1,030 |
1,088 |
1,755 |
6. |
Business Services |
14,544 |
16,771 |
16,251 |
15,866 |
16,715 |
15,269 |
7. |
Personal, Cultural and Recreational |
243 |
562 |
729 |
117 |
199 |
306 |
8. |
Others |
2,649 |
2,064 |
5,580 |
4,484 |
4,183 |
1,900 |
Total (1 to 8) |
23,935 |
26,445 |
30,466 |
26,247 |
27,266 |
24,461 |
P: Preliminary. PR: Partially Revised.
Note: Details of Business Services (item 6) are given in Table 9. |
Table 9: Details of Business Services |
(US$ million) |
Item |
Receipts |
Payments |
2006-07 |
2007-08 (PR) |
2008-09 (P) |
2006-07 |
2007-08 (PR) |
2008-09 (P) |
1 |
2 |
3 |
4 |
5 |
6 |
7 |
1. |
Trade Related |
1,325 |
2,233 |
2,008 |
1,801 |
2,285 |
1,642 |
2. |
Business & Management Consultancy |
4,476 |
4,433 |
4,847 |
3,486 |
3,653 |
3,512 |
3. |
Architectural, Engineering, and other Technical Services |
3,457 |
3,144 |
1,759 |
3,025 |
3,173 |
3,106 |
4. |
Maintenance of Offices abroad |
2,638 |
2,861 |
2,980 |
4,032 |
3,496 |
3,283 |
5. |
Others |
2,648 |
4,100 |
4,657 |
3,522 |
4,108 |
3,726 |
Total (1 to 5) |
14,544 |
16,771 |
16,251 |
15,866 |
16,715 |
15,269 |
P: Preliminary. PR: Partially Revised. |
Invisibles Payments (i) Invisibles payments at US$ 73.0 billion (6.3 per cent of GDP) showed a marginal negative growth of 1.4 per cent in 2008-09 as against an increase of 18.7 per cent (US$ 74.0 billion or 6.3 per cent of GDP) in 2007-08 mainly on account of a slowdown in payments relating to travel and transportation, and decline in payments under software, business and financial services, and investment income account. (ii) Travel payments growth remained lower at 1.9 per cent during 2008-09 (38.5 per cent in 2007-08) reflecting a sharp reduction in outbound travels. (iii) Investment income payments, reflecting mainly the interest payments on commercial borrowings, external assistance and non-resident deposits, and reinvested earnings of the foreign direct investment (FDI) enterprises operating in India declined marginally to US$ 17.5 billion during 2008-09 (US$ 18.1 billion in 2007-08) mainly due to a decline in profit and dividends; and reinvested earnings of FDI companies in India (Table 10). Invisibles Balance (i) Net invisibles (invisibles receipts minus invisibles payments) stood higher at US$ 89.6 billion (7.7 per cent of GDP) during 2008-09 (US$ 74.6 billion or 6.4 per cent of GDP during 2007-08), mainly led by receipts under private transfers and software services.At this level, the invisibles surplus financed about 75.0 per cent of the trade deficit during 2008-09 as against 81.4 per cent during 2007-08. Current Account Balance (i) Despite higher net invisibles surplus, the large trade deficit mainly on account of higher growth in imports as compared with the export growth led to a higher current account deficit at US$ 29.8 billion (2.6 per cent of GDP) during 2008-09 as compared with US$ 17.0 billion (1.5 per cent of GDP) during 2007-08. As a result of surplus in the fourth quarter of 2008-09, the current account deficit during 2008-09 was lower than that observed during April-December 2008-09 (Chart 4)
Table 10: Details of Receipts and Payments of Investment Income |
(US $ million) |
| |
2006-07 |
2007-08 (PR) |
2008-09 (P) |
1 |
2 |
3 |
4 |
A. |
Receipts |
8,926 |
13,808 |
13,482 |
| |
Of which: |
|
|
|
| |
1. |
Reinvested Earnings on Indian Investment Abroad |
1,076 |
1,084 |
1,084 |
| |
2. |
Interest/discount Earnings on Foreign exchange reserves |
6,641 |
10,124 |
10,480 |
B. |
Payments |
15,688 |
18,089 |
17,499 |
| |
Of which: |
|
|
|
| |
1. |
Interest Payment on NRI deposits |
1,969 |
1,813 |
1,547 |
| |
2. |
Interest Payment on ECBs |
1,709 |
2,655 |
2,702 |
| |
3. |
Interest Payments on External Assistance |
982 |
1,143 |
1,010 |
| |
4. |
Dividends and Profits |
3,486 |
3,576 |
3,168 |
| |
5. |
Reinvested Earnings of FDI companies in India |
5,828 |
7,168 |
6,426 |
C. |
Net Investment Income (A-B) |
-6,762 |
-4,281 |
-4,017 |
P: Preliminary. PR: Partially Revised. |
Capital Account (i) Both gross capital inflows to India and outflows from India declined in 2008-09 as compared with last year. While gross capital inflows to India declined to US$ 302 billion in 2008-09 from US$ 433 billion in 2007-08, the gross capital outflows from India declined to US$ 293 billion from US$ 325 billion during the same period (Table 11). (ii) As a result, net capital flows at US$ 9.1 billion (0.8 per cent of GDP) in 2008-09 remained much lower as compared with US$ 108.0 billion (9.2 per cent of GDP) in 2007-08. Under net capital flows, all the major components except FDI and NRI deposits, showed a decline during 2008-09 from their level in the previous year (Table 12). There were net outflows under portfolio investment, short-term trade credit to India and banking capital.
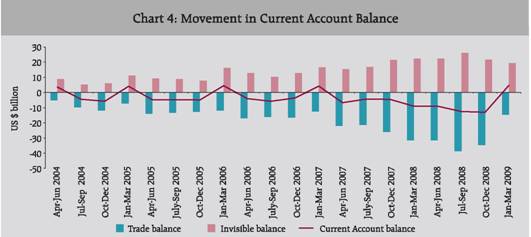
Table 11: Gross Capital Inflows and Outflows |
(US$ million) |
Item |
Gross Inflows |
Gross Outflows |
2006-07 |
2007-08 (PR) |
2008-09 (P) |
2006-07 |
2007-08 (PR) |
2008-09 (P) |
1 |
2 |
3 |
4 |
5 |
6 |
7 |
1. |
Foreign Direct Investment |
23,590 |
36,838 |
36,258 |
15,897 |
21,437 |
18,762 |
2. |
Portfolio Investment |
|
|
|
|
|
|
| |
Of which: |
109,620 |
235,924 |
128,651 |
102,560 |
206,368 |
142,685 |
| |
FIIs |
105,756 |
226,621 |
127,349 |
102,530 |
206,294 |
142,366 |
| |
ADR/GDRs |
3,776 |
8,769 |
1,162 |
- |
- |
- |
3. |
External Assistance |
3,767 |
4,241 |
5,042 |
1,992 |
2,127 |
2,404 |
4. |
External Commercial Borrowings |
20,883 |
30,376 |
15,382 |
4,780 |
7,743 |
7,224 |
5. |
NRI Deposits |
19,914 |
29,401 |
37,089 |
15,593 |
29,222 |
32,799 |
6. |
Banking Capital excluding Non Resident Deposits |
17,295 |
26,412 |
27,909 |
19,703 |
14,834 |
35,596 |
7. |
Short-term Trade Credit |
29,992 |
48,911 |
39,734 |
23,380 |
31,728 |
45,529 |
8. |
Rupee Debt Service |
0 |
0 |
0 |
162 |
121 |
101 |
9. |
Other Capital |
8,230 |
20,904 |
12,391 |
4,021 |
11,434 |
8,210 |
Total (1 to 9) |
233,291 |
433,007 |
302,456 |
188,088 |
325,014 |
293,310 |
P: Preliminary. PR: Partially Revised. |
(iii) Net inward FDI into India remained buoyant at US$ 35.0 billion (3.0 per cent of GDP) during 2008-09 (US$ 34.2 billion or 2.9 per cent of GDP in 2007-08) reflecting relatively better investment climate in India and the continuing liberalisation measures to attract the FDI.
Table 12: Net Capital Flows |
(US $ million) |
Item |
2006-07 |
2007-08 (PR) |
2008-09 (P) |
1 |
2 |
3 |
4 |
1. |
Foreign Direct Investment (FDI) |
7,693 |
15,401 |
17,496 |
| |
Inward FDI |
22,739 |
34,236 |
34,982 |
| |
Outward FDI |
15,046 |
18,835 |
17,486 |
2. |
Portfolio Investment |
7,060 |
29,556 |
-14,034 |
| |
Of which: |
|
|
|
| |
FIIs |
3,225 |
20,327 |
-15,017 |
| |
ADR/GDRs |
3,776 |
8,769 |
1,162 |
3. |
External Assistance |
1,775 |
2,114 |
2,638 |
4. |
External Commercial Borrowings |
16,103 |
22,633 |
8,158 |
5. |
NRI Deposits |
4,321 |
179 |
4,290 |
6. |
Banking Capital excluding NRI Deposits |
-2,408 |
11,578 |
-7,687 |
7. |
Short-term Trade Credits |
6,612 |
17,183 |
-5,795 |
8. |
Rupee Debt Service |
-162 |
-121 |
-101 |
9. |
Other Capital |
4,209 |
9,470 |
4,181 |
Total (1 to 9) |
45,203 |
107,993 |
9,146 |
P: Preliminary. PR: Partially Revised.
Note: Details of Other Capital (Item 9) are given in Table 13. |
(iv) During 2008-09, FDI to India was channeled mainly into manufacturing sector (21.1 per cent) followed by financial services (19.4 per cent) and construction sector (9.9 per cent). (v) The Indian corporate continued to invest overseas with the objectives of reaping economies of scale, access to technology knowhow and capturing offshore markets to face the global competition. The liberalised external payments regime has been facilitating the process of acquisition of foreign companies by Indian corporates, both in the manufacturing and services sectors. As a result, net outward FDI from India continued to remain high at US$ 17.5 billion during 2008-09 as compared with US$ 18.8 billion in 2007-08. (vi) Due to large inward FDI, the net FDI (net inward FDI minus net outward FDI) was higher at US$ 17.5 billion in 2008-09 as compared with US$ 15.4 billion in 2007-08. (vii) Portfolio investment comprising, mainly foreign institutional investors (FIIs) investments and American depository receipts (ADRs)/global depository receipts (GDRs) witnessed large net outflows of US$ 14.0 billion during 2008-09 (net inflows of US$ 29.6 billion in 2007-08) due to large sales of equities by the FIIs in the Indian stock market reflecting bearish market conditions and a slowdown in the global economy.The net outflows under FIIs at US$ 15.0 billion were spread through out the year. However, the month of October 2008 saw the maximum net outflow of US$ 5.3 billion due to heightened uncertainty following the collapse of Lehman Brothers.The inflows under ADRs/GDRs slowed down significantly to US$ 1.2 billion in 2008-09 (US$ 8.8 billion in 2007-08), as new issuances almost dried up during the second half of 2008-09. (viii) The disbursements of external commercial borrowings (ECBs) to India at US$ 13.4 billion during 2008-09 were less than half of the previous year (US$ 28.8 billion), mainly due to tight liquidity conditions in the overseas markets. As a result, net ECBs inflow slowed down to US$ 8.2 billion in 2008-09 (US$ 22.6 billion in 2007-08). (ix) Banking capital mainly consists of foreign assets and liabilities of commercial banks. NRI deposits constitute major part of the foreign liabilities. Banking capital (net), including NRI deposits, were negative at US$ 3.4 billion during 2008-09 as against a positive net inflow of US$ 11.8 billion during 2007-08. Among the components of banking capital, NRI deposits witnessed higher inflows at US$ 4.3 billion in 2008-09, particularly during the second half of 2008-09 with the revision in ceiling interest rate on NRI deposits. (x) Despite apprehensions in the second half of 2008-09 on the availability of short-term trade credit due to tightness in the global credit markets, the gross disbursements reached US$ 39.7 billion during 2008-09 (US$ 48.9 billion in 2007-08), facilitated by policy measures undertaken. Repayments of short-term trade credit were higher at US$ 45.5 billion in 2008-09 as compared with US$ 31.7 billion in 2007-08. The gap between the disbursements and repayments of short-term trade credit to India was limited to an outflow of US$ 5.8 billion (inclusive of suppliers’ credit up to 180 days) during 2008-09 (net inflows of US$ 17.2 billion during 2007-08). Thus, financing of short-term trade credit did not pose much of a problem in India.
Table 13: Details of 'Other Capital' (Net) |
(US $ million) |
Item |
2006-07 |
2007-08 (PR) |
2008-09 (P) |
1 |
2 |
3 |
4 |
1. |
Lead and Lags in Exports |
217 |
983 |
5,424 |
2. |
Net Funds Held Abroad |
619 |
-5,487 |
-2,056 |
3. |
Advances Received Pending Issue of Shares under FDI |
- |
8,700 |
1,003 |
4. |
Other capital not included elsewhere (n.i.e)* |
3,373 |
5,274 |
-190 |
Total (1 to 4) |
4,209 |
9,470 |
4,181 |
P: Preliminary. PR: Partially Revised.
*: Includes transaction related to derivatives and hedging, migrant transfers, outflows under Liberalised Remittance Scheme (LRS) and other capital transfers. |
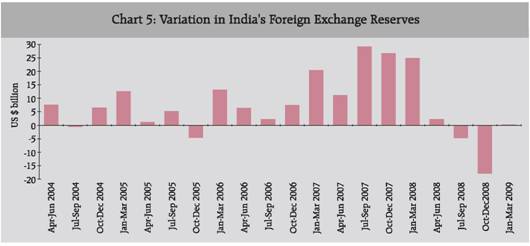
(xi) Other capital includes leads and lags in exports, funds held abroad,advances received pending for issue of shares under FDI and other capital not included elsewhere (n.i.e.).Other capital recorded net inflows of US$ 4.2 billion in 2008-09.The details of other capital are set out in Table 13. Variation in Reserves (i) The decline in foreign exchange reserves on BoP basis (i.e., excluding valuation) was US$ 20.1 billion in 2008-09 (as against an accretion to reserves of US$ 92.2 billion in 2007-08) (Table 14 & Chart 5). Taking into account the valuation loss, foreign exchange reserves recorded a decline of US$ 57.7 billion during 2008-09 (as against an accretion to reserves of US$ 110.5 billion in 2007-08). Details on sources of variation in foreign exchange reserves is at Annex A.
Table 14: Sources of Variation in Reserves (BoP Basis) in 2008-09 |
(US $ million) |
Item |
2006-07 |
2007-08 (PR) |
2008-09 (P) |
1 |
2 |
3 |
4 |
A. |
Current Account Balance |
-9,565 |
-17,034 |
-29,817 |
B. |
Capital Account* |
46,171 |
109,198 |
9,737 |
| |
Of Which |
|
|
|
| |
(i) |
Foreign Direct Investment |
7,693 |
15,401 |
17,496 |
| |
(ii) |
Portfolio Investment |
7,060 |
29,556 |
-14,034 |
| |
(iii) |
External Commercial Borrowings |
16,103 |
22,633 |
8,158 |
| |
(iv) |
Banking Capital |
1,913 |
11,757 |
-3,397 |
| |
(v) |
Short-term Trade Credits |
6,612 |
17,183 |
-5,795 |
C. |
Change in Reserves: (-) indicates increase; (+) indicates decrease)# |
-36,606 |
-92,164 |
20,080 |
*: Including errors and omissions. #: On BoP basis (i.e., excluding valuation). P:Preliminary. PR: Partially Revised. |
(ii) At the end of March 2009, outstanding foreign exchange reserves stood at US$ 252.0 billion. (iii) To sum up, the key features of India’s BoP that emerged during 2008-09 were: (i) widening of trade deficit led by a sharp slowdown in exports, (ii) increase in invisibles surplus, led by remittances from overseas Indians and software services exports, (iii) higher current account deficit due to large trade deficit, (iv) lower net capital inflows mainly led by large net outflows under banking capital, portfolio investment and large repayments under short-term trade credit, and (v) decline in reserves. 3. Reconciliation of Import Data (i) During 2008-09, based on the records of Customs imports data and the BoP merchandise imports, the difference between the two data sets works out to about US$ 6.8 billion (Table 15).
Table 15 : Customs and the BoP Import Data |
(US $ million) |
Item |
2006-07 |
2007-08 (PR) |
2008-09 (P) |
1 |
2 |
3 |
4 |
1. |
BoP Imports (Banking Channel) |
1,90,670 |
2,57,789 |
2,94,587 |
2. |
Customs Imports |
1,85,749 |
2,51,439 |
2,87,759 |
3. |
Difference (1-2) |
4,921 |
6,350 |
6,828 |
Note: Customs Import data for 2008-09 is sourced from the Press Release of Department of Commerce, Ministry of Commerce and Industry dated May 1, 2009. |
4. External Sector Indicators (i) The details of key external sector indicators are set out in Table 16.
Table 16: Key External Sector Indicators |
Item |
2006-07 |
2007-08 |
2008-09 |
1 |
2 |
3 |
4 |
Merchandise Trade |
|
|
|
1. |
Exports (US $ on BoP basis) Growth Rate ( %) |
22.6 |
28.9 |
5.4 |
2. |
Imports (US $ on BoP basis) Growth Rate ( %) |
21.4 |
35.2 |
14.3 |
3. |
Crude Oil Prices US $ Per Barrel (Indian Basket) |
62.4 |
79.2 |
82.4 |
4. |
Trade Balance (US $ billion) |
-61.8 |
-91.6 |
-119.4 |
5. |
Exports / GDP ( %) |
14.1 |
14.2 |
15.1 |
6. |
Imports / GDP ( %) |
20.9 |
22.0 |
25.5 |
7. |
Trade Balance / GDP ( % ) |
-6.8 |
-7.8 |
-10.3 |
Invisibles |
|
|
|
8. |
Net Invisibles (US $ billion) |
52.2 |
74.6 |
89.6 |
9. |
Net Invisible Surplus / Trade Deficit ( % ) |
84.5 |
81.4 |
75.0 |
10 |
Invisibles Receipts / Current Receipts ( %) |
47.1 |
47.2 |
48.1 |
11 |
Services Receipts / Current Receipts ( % ) |
30.3 |
28.6 |
30.0 |
12 |
Private Transfers Receipts / Current Receipts ( % ) |
12.7 |
13.8 |
13.7 |
13 |
Net Invisibles / GDP ( % ) |
5.7 |
6.4 |
7.7 |
14 |
Private Transfers Receipts / GDP ( % ) |
3.4 |
3.7 |
4.0 |
15 |
Software exports / GDP (%) |
3.4 |
3.4 |
4.1 |
16 |
Services (net) / GDP (%) |
3.2 |
3.2 |
4.3 |
Current Account |
|
|
|
17 |
Current Receipts ( US $ billion) |
243.4 |
314.8 |
337.7 |
18 |
Current Payments ( US $ billion) |
253.0 |
331.8 |
367.6 |
19 |
Current Account Balance (US $ billion) |
-9.6 |
-17.0 |
-29.8 |
20 |
Current Account Balance / GDP ( % ) |
-1.1 |
-1.5 |
-2.6 |
Capital Account |
|
|
|
21 |
Gross Capital Inflows ( US $ billion) |
233.3 |
433.0 |
302.5 |
22 |
Gross Capital Outflows ( US $ billion) |
188.1 |
325.0 |
293.3 |
23 |
Net Capital Flows ( US $ billion) |
45.2 |
108.0 |
9.1 |
24 |
Net FDI / Net Capital Flows ( % ) |
17.0 |
14.3 |
191.3 |
25 |
Net Portfolio Investment / Net Capital Flows ( % ) |
15.6 |
27.4 |
-153.4 |
26 |
Net ECBs / Net Capital Flows ( % ) |
35.6 |
21.0 |
89.2 |
Openness Indicators |
|
|
|
27 |
Exports plus Imports of Goods / GDP ( % ) |
35.0 |
36.1 |
40.6 |
28 |
Current Receipts plus Current Payments / GDP ( % ) |
54.4 |
55.1 |
61.0 |
29 |
Net Capital Inflows / GDP ( % ) |
4.9 |
9.2 |
0.8 |
30 |
Gross Capital Inflows plus Outflows / GDP ( % ) |
46.0 |
64.6 |
51.5 |
31 |
Current Receipts plus Current Payments & Gross Capital Inflows plus Outflows / GDP ( % ) |
100.4 |
119.7 |
112.4 |
Reserves |
|
|
|
32 |
Import Cover of Reserves (in months) |
12.5 |
14.4 |
10.3 |
33 |
Outstanding Reserves as at end period (US$ billion) |
199.2 |
309.7 |
252.0 |
Annex A: Sources of Variation in Foreign Exchange Reserves in India: 2008-09 (April-March) During 2008-09, there was a decline in foreign exchange reserves.The variation in the main components of foreign exchange reserves during 2008-09 are set out in Table A1. The foreign exchange reserves (including the valuation effects) declined by US$ 57,738 million during 2008-09 as against an increase of US$ 110,544 million during 2007-08 (Table A2). On balance of payments basis (i.e., excluding valuation effects), the foreign exchange reserves declined by US$ 20,080 million during 2008-09 as against an increase of US$ 92,164 million during 2007-08. The valuation loss, reflecting the depreciation of major currencies against the US dollar, accounted for US$ 37,658 million during 2008-09 as against a valuation gain of US$ 18,380 million during 2007-08. Accordingly, valuation loss during 2008-09 accounts for 65.2 per cent of the total decline in foreign exchange reserves. Apart from the current account deficit, outflows under portfolio investments, banking capital and short-term trade credits were the other major sources contributing to decline in foreign exchange reserves during 2008-09.
Table A1: Sources of Variation in Foreign Exchange Reserves |
(US $ million) |
Items |
2007-08 |
2008-09 |
I. |
Current Account Balance |
(-) 17,034 |
(-) 29,817 |
II. |
Capital Account (net) (a to f) |
109,198 |
9,737 |
| |
a. |
Foreign Investment (i+ii) |
44,957 |
3,462 |
| |
|
(i) Foreign Direct Investment |
15,401 |
17,496 |
| |
|
(ii) Portfolio Investment |
|
|
| |
|
Of which: |
29,556 |
(-) 14,034 |
| |
|
FIIs |
20,327 |
(-) 15,017 |
| |
|
ADRs/GDRs |
8,769 |
1,162 |
| |
b. |
External Commercial Borrowings |
22,633 |
8,158 |
| |
c. |
Banking Capital |
11,757 |
(-) 3,397 |
| |
|
of which: NRI Deposits |
179 |
4,290 |
| |
d. |
Short-Term Trade Credit |
17,183 |
(-) 5,795 |
| |
e. |
External Assistance |
2,114 |
2,638 |
| |
f. |
Other items in capital account* |
10,554 |
4,671 |
III. |
Valuation Change |
18,380 |
(-) 37,658 |
|
Total (I+II+III) |
110,544 |
(-) 57,738 |
Note: (i) * : ‘Other items in capital account’ apart from ‘Errors and Omissions’ also include leads and lags in exports, funds held abroad, advances received pending issue of shares under FDI and transactions of capital receipts not included elsewhere.(ii) Increase in reserves (+) / Decrease in reserves (-). |
Table A2: Comparative Position |
(US$ million) |
|
2007-2008 |
2008-2009 |
1. |
Change in Foreign Exchange Reserves (Including Valuation Effects) |
110,544 |
(-) 57,738 |
2. |
Valuation Effects [Gain (+)/Loss (-)] |
18,380 |
(-) 37,658 |
3. |
Change in Foreign Exchange Reserves on BoP basis (Excluding Valuation Effects) |
92,164 |
(-) 20,080 |
4. |
Percentage of increase/decline in Reserves explained by Valuation Gain/Loss |
16.6 |
65.2 |
Note: Increase in reserves (+)/Decrease in reserves (-). |
Statement I : India's Overall Balance of Payments |
(US$ million) |
Item |
2005-06 |
2006-07 |
Credit |
Debit |
Net |
Credit |
Debit |
Net |
1 |
2 |
3 |
4 |
5 |
6 |
7 |
A. |
Current Account |
|
|
|
|
|
|
| |
I. |
Merchandise |
105,152 |
157,056 |
-51,904 |
128,888 |
190,670 |
-61,782 |
| |
II. |
Invisibles (a+b+c) |
89,687 |
47,685 |
42,002 |
114,558 |
62,341 |
52,217 |
| |
|
a) |
Services |
57,659 |
34,489 |
23,170 |
73,780 |
44,311 |
29,469 |
| |
|
|
i) |
Travel |
7,853 |
6,638 |
1,215 |
9,123 |
6,684 |
2,439 |
| |
|
|
ii) |
Transportation |
6,325 |
8,337 |
-2,012 |
7,974 |
8,068 |
-94 |
| |
|
|
iii) |
Insurance |
1,062 |
1,116 |
-54 |
1,195 |
642 |
553 |
| |
|
|
iv) |
G.n.i.e. |
314 |
529 |
-215 |
253 |
403 |
-150 |
| |
|
|
v) |
Miscellaneous |
42,105 |
17,869 |
24,236 |
55,235 |
28,514 |
26,721 |
| |
|
|
|
of which |
|
|
|
|
|
|
| |
|
|
|
Software Services |
23,600 |
1,338 |
22,262 |
31,300 |
2,267 |
29,033 |
| |
|
|
|
Business Services |
9,307 |
7,748 |
1,559 |
14,544 |
15,866 |
-1,322 |
| |
|
|
|
Financial Services |
1,209 |
965 |
244 |
3,106 |
2,991 |
115 |
| |
|
|
|
Communication Services |
1,575 |
289 |
1,286 |
2,262 |
796 |
1,466 |
| |
|
b) |
Transfers |
25,620 |
933 |
24,687 |
31,470 |
1,391 |
30,079 |
| |
|
|
i) |
Official |
669 |
475 |
194 |
635 |
381 |
254 |
| |
|
|
ii) |
Private |
24,951 |
458 |
24,493 |
30,835 |
1,010 |
29,825 |
| |
|
c) |
Income |
6,408 |
12,263 |
-5,855 |
9,308 |
16,639 |
-7,331 |
| |
|
|
i) |
Investment Income |
6,229 |
11,491 |
-5,262 |
8,926 |
15,688 |
-6,762 |
| |
|
|
ii) |
Compensation of Employees |
179 |
772 |
-593 |
382 |
951 |
-569 |
| |
Total Current Account (I+II) |
194,839 |
204,741 |
-9,902 |
243,446 |
253,011 |
-9,565 |
B. |
Capital Account |
|
|
|
|
|
|
| |
1. |
Foreign Investment (a+b) |
77,298 |
61,770 |
15,528 |
133,210 |
118,457 |
14,753 |
| |
|
a) |
Foreign Direct Investment (i+ii) |
9,178 |
6,144 |
3,034 |
23,590 |
15,897 |
7,693 |
| |
|
|
i) |
In India |
8,962 |
61 |
8,901 |
22,826 |
87 |
22,739 |
| |
|
|
|
Equity |
5,976 |
61 |
5,915 |
16,481 |
87 |
16,394 |
| |
|
|
|
Reinvested Earnings |
2,760 |
- |
2,760 |
5,828 |
- |
5,828 |
| |
|
|
|
Other Capital |
226 |
- |
226 |
517 |
- |
517 |
| |
|
|
ii) |
Abroad |
216 |
6,083 |
-5,867 |
764 |
15,810 |
-15,046 |
| |
|
|
|
Equity |
216 |
3,982 |
-3,766 |
764 |
13,368 |
-12,604 |
| |
|
|
|
Reinvested Earnings |
- |
1,092 |
-1,092 |
- |
1,076 |
-1,076 |
| |
|
|
|
Other Capital |
- |
1,009 |
-1,009 |
- |
1,366 |
-1,366 |
| |
|
b) |
Portfolio Investment |
68,120 |
55,626 |
12,494 |
109,620 |
102,560 |
7,060 |
| |
|
|
i) |
In India |
68,120 |
55,626 |
12,494 |
109,534 |
102,530 |
7,004 |
| |
|
|
|
of which |
|
|
|
|
|
|
| |
|
|
|
FIIs |
- |
- |
9,926 |
105,756 |
102,530 |
3,226 |
| |
|
|
|
GDRs/ADRs |
2,552 |
- |
2,552 |
3,776 |
- |
3,776 |
| |
|
|
ii) |
Abroad |
- |
- |
- |
86 |
30 |
56 |
| |
2. |
Loans (a+b+c) |
39,479 |
31,570 |
7,909 |
54,642 |
30,152 |
24,490 |
| |
|
a) |
External Assistance |
3,631 |
1,929 |
1,702 |
3,767 |
1,992 |
1,775 |
| |
|
|
i) |
By India |
24 |
88 |
-64 |
20 |
32 |
-12 |
| |
|
|
ii) |
To India |
3,607 |
1,841 |
1,766 |
3,747 |
1,960 |
1,787 |
| |
|
b) |
Commercial Borrowings |
14,343 |
11,835 |
2,508 |
20,883 |
4,780 |
16,103 |
| |
|
|
i) |
By India |
- |
251 |
-251 |
626 |
966 |
-340 |
| |
|
|
ii) |
To India |
14,343 |
11,584 |
2,759 |
20,257 |
3,814 |
16,443 |
| |
|
c) |
Short Term To India |
21,505 |
17,806 |
3,699 |
29,992 |
23,380 |
6,612 |
| |
|
|
i) |
Suppliers’ Credit >180 days & Buyers’ Credit |
19,372 |
17,647 |
1,725 |
25,482 |
22,175 |
3,307 |
| |
|
|
ii) |
Suppliers’ Credit up to 180 days |
2,133 |
159 |
1,974 |
4,510 |
1,205 |
3,305 |
| |
3. |
Banking Capital (a+b) |
21,658 |
20,285 |
1,373 |
37,209 |
35,296 |
1,913 |
| |
|
a) |
Commercial Banks |
20,586 |
20,144 |
442 |
36,799 |
35,218 |
1,581 |
| |
|
|
i) |
Assets |
772 |
3,947 |
-3,175 |
14,466 |
17,960 |
-3,494 |
| |
|
|
ii) |
Liabilities |
19,814 |
16,197 |
3,617 |
22,333 |
17,258 |
5,075 |
| |
|
|
|
of which: Non-Resident Deposits |
17,835 |
15,046 |
2,789 |
19,914 |
15,593 |
4,321 |
| |
|
b) |
Others |
1,072 |
141 |
931 |
410 |
78 |
332 |
| |
4. |
Rupee Debt Service |
- |
572 |
-572 |
- |
162 |
-162 |
| |
5. |
Other Capital |
5,941 |
4,709 |
1,232 |
8,230 |
4,021 |
4,209 |
| |
Total Capital Account (1 to 5) |
144,376 |
118,906 |
25,470 |
233,291 |
188,088 |
45,203 |
C. |
Errors & Omissions |
- |
516 |
-516 |
968 |
- |
968 |
D. |
Overall Balance
(Total Current Account, Capital Account and Errors & Omissions (A+B+C)) |
339,215 |
324,163 |
15,052 |
477,705 |
441,099 |
36,606 |
E. |
Monetary Movements (i+ii) |
- |
15,052 |
-15,052 |
- |
36,606 |
-36,606 |
| |
i) |
I.M.F. |
- |
- |
- |
- |
- |
- |
| |
ii) |
Foreign Exchange Reserves (Increase – / Decrease +) |
- |
15,052 |
-15,052 |
- |
36,606 |
-36,606 |
P: Preliminary. PR: Partially Revised. |
Statement I : India's Overall Balance of Payments (Contd.) |
(US$ million) |
Item |
2007-08 PR |
2008-09 P |
Credit |
Debit |
Net |
Credit |
Debit |
Net |
1 |
8 |
9 |
10 |
11 |
12 |
13 |
A. |
Current Account |
|
|
|
|
|
|
| |
I. |
Merchandise |
166,163 |
257,789 |
-91,626 |
175,184 |
294,587 |
-119,403 |
| |
II. |
Invisibles (a+b+c) |
148,604 |
74,012 |
74,592 |
162,556 |
72,970 |
89,586 |
| |
|
a) |
Services |
90,077 |
52,512 |
37,565 |
101,224 |
51,406 |
49,818 |
| |
|
|
i) |
Travel |
11,349 |
9,254 |
2,095 |
10,894 |
9,432 |
1,462 |
| |
|
|
ii) |
Transportation |
10,014 |
11,514 |
-1,500 |
11,066 |
12,777 |
-1,711 |
| |
|
|
iii) |
Insurance |
1,639 |
1,044 |
595 |
1,409 |
1,131 |
278 |
| |
|
|
iv) |
G.n.i.e. |
330 |
376 |
-46 |
389 |
791 |
-402 |
| |
|
|
v) |
Miscellaneous |
66,745 |
30,324 |
36,421 |
77,466 |
27,275 |
50,191 |
| |
|
|
|
of which |
|
|
|
|
|
|
| |
|
|
|
Software Services |
40,300 |
3,058 |
37,242 |
47,000 |
2,814 |
44,186 |
| |
|
|
|
Business Services |
16,771 |
16,715 |
56 |
16,251 |
15,269 |
982 |
| |
|
|
|
Financial Services |
3,217 |
3,138 |
79 |
3,939 |
2,961 |
978 |
| |
|
|
|
Communication Services |
2,408 |
859 |
1,549 |
2,170 |
996 |
1,174 |
| |
|
b) |
Transfers |
44,259 |
2,315 |
41,944 |
47,025 |
2,746 |
44,279 |
| |
|
|
i) |
Official |
753 |
514 |
239 |
645 |
413 |
232 |
| |
|
|
ii) |
Private |
43,506 |
1,801 |
41,705 |
46,380 |
2,333 |
44,047 |
| |
|
c) |
Income |
14,268 |
19,185 |
-4,917 |
14,307 |
18,818 |
-4,511 |
| |
|
|
i) |
Investment Income |
13,808 |
18,089 |
-4,281 |
13,482 |
17,499 |
-4,017 |
| |
|
|
ii) |
Compensation of Employees |
460 |
1,096 |
-636 |
825 |
1,319 |
-494 |
| |
Total Current Account (I+II) |
314,767 |
331,801 |
-17,034 |
337,740 |
367,557 |
-29,817 |
B. |
Capital Account |
|
|
|
|
|
|
| |
1. |
Foreign Investment (a+b) |
272,762 |
227,805 |
44,957 |
164,909 |
161,447 |
3,462 |
| |
|
a) |
Foreign Direct Investment (i+ii) |
36,838 |
21,437 |
15,401 |
36,258 |
18,762 |
17,496 |
| |
|
|
i) |
In India |
34,361 |
125 |
34,236 |
35,148 |
166 |
34,982 |
| |
|
|
|
Equity |
26,866 |
108 |
26,758 |
27,975 |
166 |
27,809 |
| |
|
|
|
Reinvested Earnings |
7,168 |
- |
7,168 |
6,426 |
- |
6,426 |
| |
|
|
|
Other Capital |
327 |
17 |
310 |
747 |
- |
747 |
| |
|
|
ii) |
Abroad |
2,477 |
21,312 |
-18,835 |
1,110 |
18,596 |
-17,486 |
| |
|
|
|
Equity |
2,477 |
16,898 |
-14,421 |
1,110 |
14,668 |
-13,558 |
| |
|
|
|
Reinvested Earnings |
- |
1,084 |
-1,084 |
- |
1,084 |
-1,084 |
| |
|
|
|
Other Capital |
- |
3,330 |
-3,330 |
- |
2,844 |
-2,844 |
| |
|
b) |
Portfolio Investment |
235,924 |
206,368 |
29,556 |
128,651 |
142,685 |
-14,034 |
| |
|
|
i) |
In India |
235,688 |
206,294 |
29,394 |
128,511 |
142,366 |
-13,855 |
| |
|
|
|
of which |
|
|
|
|
|
|
| |
|
|
|
FIIs |
226,621 |
206,294 |
20,327 |
127,349 |
142,366 |
-15,017 |
| |
|
|
|
GDRs/ADRs |
8,769 |
- |
8,769 |
1,162 |
- |
1,162 |
| |
|
|
ii) |
Abroad |
236 |
74 |
162 |
140 |
319 |
-179 |
| |
2. |
Loans (a+b+c) |
83,528 |
41,598 |
41,930 |
60,158 |
55,157 |
5,001 |
| |
|
a) |
External Assistance |
4,241 |
2,127 |
2,114 |
5,042 |
2,404 |
2,638 |
| |
|
|
i) |
By India |
24 |
28 |
-4 |
24 |
32 |
-8 |
| |
|
|
ii) |
To India |
4,217 |
2,099 |
2,118 |
5,018 |
2,372 |
2,646 |
| |
|
b) |
Commercial Borrowings |
30,376 |
7,743 |
22,633 |
15,382 |
7,224 |
8,158 |
| |
|
|
i) |
By India |
1,592 |
1,624 |
-32 |
2,005 |
785 |
1,220 |
| |
|
|
ii) |
To India |
28,784 |
6,119 |
22,665 |
13,377 |
6,439 |
6,938 |
| |
|
c) |
Short Term To India |
48,911 |
31,728 |
17,183 |
39,734 |
45,529 |
-5,795 |
| |
|
|
i) |
Suppliers’ Credit >180 days & Buyers’ Credit |
42,641 |
31,728 |
10,913 |
38,814 |
38,352 |
462 |
| |
|
|
ii) |
Suppliers’ Credit up to 180 days |
6,270 |
- |
6,270 |
920 |
7,177 |
-6,257 |
| |
3. |
Banking Capital (a+b) |
55,813 |
44,056 |
11,757 |
64,998 |
68,395 |
-3,397 |
| |
|
a) |
Commercial Banks |
55,734 |
43,624 |
12,110 |
64,885 |
67,810 |
-2,925 |
| |
|
|
i) |
Assets |
19,562 |
12,668 |
6,894 |
25,673 |
28,726 |
-3,053 |
| |
|
|
ii) |
Liabilities |
36,172 |
30,956 |
5,216 |
39,212 |
39,084 |
128 |
| |
|
|
|
of which: Non-Resident Deposits |
29,401 |
29,222 |
179 |
37,089 |
32,799 |
4,290 |
| |
|
b) |
Others |
79 |
432 |
-353 |
113 |
585 |
-472 |
| |
4. |
Rupee Debt Service |
- |
121 |
-121 |
- |
101 |
-101 |
| |
5. |
Other Capital |
20,904 |
11,434 |
9,470 |
12,391 |
8,210 |
4,181 |
| |
Total Capital Account (1 to 5) |
433,007 |
325,014 |
107,993 |
302,456 |
293,310 |
9,146 |
C. |
Errors & Omissions |
1,205 |
- |
1,205 |
591 |
- |
591 |
D. |
Overall Balance
(Total Current Account, Capital Account and Errors & Omissions (A+B+C)) |
748,979 |
656,815 |
92,164 |
640,787 |
660,867 |
-20,080 |
E. |
Monetary Movements (i+ii) |
- |
92,164 |
-92,164 |
20,080 |
- |
20,080 |
| |
i) |
I.M.F. |
- |
- |
- |
- |
- |
- |
| |
ii) |
Foreign Exchange Reserves (Increase – / Decrease +) |
- |
92,164 |
-92,164 |
20,080 |
- |
20,080 |
Statement I : India's Overall Balance of Payments (Contd.) |
(US$ million) |
Item |
Apr-Jun 2006 |
Jul-Sep 2006 |
Credit |
Debit |
Net |
Credit |
Debit |
Net |
1 |
14 |
15 |
16 |
17 |
18 |
19 |
A. |
Current Account |
|
|
|
|
|
|
| |
I. |
Merchandise |
29,663 |
46,613 |
-16,950 |
32,701 |
48,717 |
-16,016 |
| |
II. |
Invisibles (a+b+c) |
24,934 |
12,421 |
12,513 |
24,866 |
14,597 |
10,269 |
| |
|
a) |
Services |
16,042 |
8,475 |
7,567 |
16,416 |
9,966 |
6,450 |
| |
|
|
i) |
Travel |
1,708 |
1,488 |
220 |
1,796 |
1,811 |
-15 |
| |
|
|
ii) |
Transportation |
1,715 |
1,997 |
-282 |
1,973 |
1,978 |
-5 |
| |
|
|
iii) |
Insurance |
238 |
129 |
109 |
315 |
154 |
161 |
| |
|
|
iv) |
G.n.i.e. |
40 |
79 |
-39 |
61 |
122 |
-61 |
| |
|
|
v) |
Miscellaneous |
12,341 |
4,782 |
7,559 |
12,271 |
5,901 |
6,370 |
| |
|
|
|
of which |
|
|
|
|
|
|
| |
|
|
|
Software Services |
7,039 |
415 |
6,624 |
7,121 |
405 |
6,716 |
| |
|
|
|
Business Services |
3,386 |
2,646 |
740 |
3,436 |
3,300 |
136 |
| |
|
|
|
Financial Services |
509 |
318 |
191 |
716 |
703 |
13 |
| |
|
|
|
Communication Services |
475 |
108 |
367 |
569 |
180 |
389 |
| |
|
b) |
Transfers |
7,170 |
289 |
6,881 |
6,218 |
361 |
5,857 |
| |
|
|
i) |
Official |
69 |
82 |
-13 |
119 |
100 |
19 |
| |
|
|
ii) |
Private |
7,101 |
207 |
6,894 |
6,099 |
261 |
5,838 |
| |
|
c) |
Income |
1,722 |
3,657 |
-1,935 |
2,232 |
4,270 |
-2,038 |
| |
|
|
i) |
Investment Income |
1,659 |
3,461 |
-1,802 |
2,160 |
4,042 |
-1,882 |
| |
|
|
ii) |
Compensation of Employees |
63 |
196 |
-133 |
72 |
228 |
-156 |
| |
Total Current Account (I+II) |
54,597 |
59,034 |
-4,437 |
57,567 |
63,314 |
-5,747 |
B. |
Capital Account |
|
|
|
|
|
|
| |
1. |
Foreign Investment (a+b) |
34,299 |
33,067 |
1,232 |
22,485 |
18,219 |
4,266 |
| |
|
a) |
Foreign Direct Investment (i+ii) |
3,477 |
1,739 |
1,738 |
4,545 |
2,429 |
2,116 |
| |
|
|
i) |
In India |
3,413 |
8 |
3,405 |
4,400 |
2 |
4,398 |
| |
|
|
|
Equity |
1,946 |
8 |
1,938 |
2,886 |
2 |
2,884 |
| |
|
|
|
Reinvested Earnings |
1,457 |
- |
1,457 |
1,457 |
- |
1,457 |
| |
|
|
|
Other Capital |
10 |
- |
10 |
57 |
- |
57 |
| |
|
|
ii) |
Abroad |
64 |
1,731 |
-1,667 |
145 |
2,427 |
-2,282 |
| |
|
|
|
Equity |
64 |
1,189 |
-1,125 |
145 |
1,868 |
-1,723 |
| |
|
|
|
Reinvested Earnings |
- |
269 |
-269 |
- |
269 |
-269 |
| |
|
|
|
Other Capital |
- |
273 |
-273 |
- |
290 |
-290 |
| |
|
b) |
Portfolio Investment |
30,822 |
31,328 |
-506 |
17,940 |
15,790 |
2,150 |
| |
|
|
i) |
In India |
30,801 |
31,327 |
-526 |
17,929 |
15,789 |
2,140 |
| |
|
|
|
of which |
|
|
|
|
|
|
| |
|
|
|
FIIs |
29,540 |
31,327 |
-1,787 |
17,469 |
15,789 |
1,680 |
| |
|
|
|
GDRs/ADRs |
1,261 |
- |
1,261 |
460 |
- |
460 |
| |
|
|
ii) |
Abroad |
21 |
1 |
20 |
11 |
1 |
10 |
| |
2. |
Loans (a+b+c) |
11,499 |
6,288 |
5,211 |
11,228 |
6,446 |
4,782 |
| |
|
a) |
External Assistance |
577 |
526 |
51 |
788 |
449 |
339 |
| |
|
|
i) |
By India |
5 |
8 |
-3 |
5 |
8 |
-3 |
| |
|
|
ii) |
To India |
572 |
518 |
54 |
783 |
441 |
342 |
| |
|
b) |
Commercial Borrowings |
5,051 |
1,073 |
3,978 |
2,680 |
920 |
1,760 |
| |
|
|
i) |
By India |
87 |
223 |
-136 |
114 |
170 |
-56 |
| |
|
|
ii) |
To India |
4,964 |
850 |
4,114 |
2,566 |
750 |
1,816 |
| |
|
c) |
Short Term To India |
5,871 |
4,689 |
1,182 |
7,760 |
5,077 |
2,683 |
| |
|
|
i) |
Suppliers’ Credit >180 days & Buyers’ Credit |
5,082 |
4,689 |
393 |
6,579 |
5,077 |
1,502 |
| |
|
|
ii) |
Suppliers’ Credit up to 180 days |
789 |
- |
789 |
1,181 |
- |
1,181 |
| |
3. |
Banking Capital (a+b) |
9,909 |
4,848 |
5,061 |
5,754 |
7,472 |
-1,718 |
| |
|
a) |
Commercial Banks |
9,837 |
4,848 |
4,989 |
5,754 |
7,428 |
-1,674 |
| |
|
|
i) |
Assets |
5,257 |
1,877 |
3,380 |
1,568 |
3,553 |
-1,985 |
| |
|
|
ii) |
Liabilities |
4,580 |
2,971 |
1,609 |
4,186 |
3,875 |
311 |
| |
|
|
|
of which: Non-Resident Deposits |
4,246 |
2,944 |
1,302 |
4,185 |
3,277 |
908 |
| |
|
b) |
Others |
72 |
- |
72 |
- |
44 |
-44 |
| |
4. |
Rupee Debt Service |
- |
67 |
-67 |
- |
- |
- |
| |
5. |
Other Capital |
342 |
1,054 |
-712 |
1,084 |
554 |
530 |
| |
Total Capital Account (1 to 5) |
56,049 |
45,324 |
10,725 |
40,551 |
32,691 |
7,860 |
C. |
Errors & Omissions |
91 |
- |
91 |
157 |
- |
157 |
D. |
Overall Balance
(Total Current Account, Capital Account and Errors & Omissions (A+B+C)) |
110,737 |
104,358 |
6,379 |
98,275 |
96,005 |
2,270 |
E. |
Monetary Movements (i+ii) |
- |
6,379 |
-6,379 |
- |
2,270 |
-2,270 |
| |
i) |
I.M.F. |
- |
|
- |
|
|
- |
| |
ii) |
Foreign Exchange Reserves (Increase – / Decrease +) |
- |
6,379 |
-6,379 |
- |
2,270 |
-2,270 |
Statement I : India's Overall Balance of Payments (Contd.) |
(US$ million) |
Item |
Oct-Dec 2006 |
Jan-Mar 2007 |
Credit |
Debit |
Net |
Credit |
Debit |
Net |
1 |
20 |
21 |
22 |
23 |
24 |
25 |
A. |
Current Account |
|
|
|
|
|
|
| |
I. |
Merchandise |
30,824 |
47,257 |
-16,433 |
35,700 |
48,083 |
-12,383 |
| |
II. |
Invisibles (a+b+c) |
29,704 |
16,875 |
12,829 |
35,054 |
18,448 |
16,606 |
| |
|
a) |
Services |
18,451 |
12,371 |
6,080 |
22,871 |
13,499 |
9,372 |
| |
|
|
i) |
Travel |
2,621 |
1,638 |
983 |
2,998 |
1,747 |
1,251 |
| |
|
|
ii) |
Transportation |
2,092 |
2,102 |
-10 |
2,194 |
1,991 |
203 |
| |
|
|
iii) |
Insurance |
288 |
201 |
87 |
354 |
158 |
196 |
| |
|
|
iv) |
G.n.i.e. |
87 |
97 |
-10 |
65 |
105 |
-40 |
| |
|
|
v) |
Miscellaneous |
13,363 |
8,333 |
5,030 |
17,260 |
9,498 |
7,762 |
| |
|
|
|
of which |
|
|
|
|
|
|
| |
|
|
|
Software Services |
7,602 |
684 |
6,918 |
9,538 |
763 |
8,775 |
| |
|
|
|
Business Services |
3,690 |
4,267 |
-577 |
4,032 |
5,653 |
-1,621 |
| |
|
|
|
Financial Services |
828 |
647 |
181 |
1,053 |
1,323 |
-270 |
| |
|
|
|
Communication Services |
597 |
239 |
358 |
621 |
269 |
352 |
| |
|
b) |
Transfers |
8,961 |
333 |
8,628 |
9,121 |
408 |
8,713 |
| |
|
|
i) |
Official |
287 |
89 |
198 |
160 |
110 |
50 |
| |
|
|
ii) |
Private |
8,674 |
244 |
8,430 |
8,961 |
298 |
8,663 |
| |
|
c) |
Income |
2,292 |
4,171 |
-1,879 |
3,062 |
4,541 |
-1,479 |
| |
|
|
i) |
Investment Income |
2,193 |
3,936 |
-1,743 |
2,914 |
4,249 |
-1,335 |
| |
|
|
ii) |
Compensation of Employees |
99 |
235 |
-136 |
148 |
292 |
-144 |
| |
Total Current Account (I+II) |
60,528 |
64,132 |
-3,604 |
70,754 |
66,531 |
4,223 |
B. |
Capital Account |
|
|
|
|
|
|
| |
1. |
Foreign Investment (a+b) |
38,646 |
32,179 |
6,467 |
37,780 |
34,992 |
2,788 |
| |
|
a) |
Foreign Direct Investment (i+ii) |
10,008 |
7,110 |
2,898 |
5,560 |
4,619 |
941 |
| |
|
|
i) |
In India |
9,855 |
7 |
9,848 |
5,158 |
70 |
5,088 |
| |
|
|
|
Equity |
8,203 |
7 |
8,196 |
3,446 |
70 |
3,376 |
| |
|
|
|
Reinvested Earnings |
1,457 |
- |
1,457 |
1,457 |
- |
1,457 |
| |
|
|
|
Other Capital |
195 |
- |
195 |
255 |
- |
255 |
| |
|
|
ii) |
Abroad |
153 |
7,103 |
-6,950 |
402 |
4,549 |
-4,147 |
| |
|
|
|
Equity |
153 |
6,454 |
-6,301 |
402 |
3,857 |
-3,455 |
| |
|
|
|
Reinvested Earnings |
- |
269 |
-269 |
- |
269 |
-269 |
| |
|
|
|
Other Capital |
- |
380 |
-380 |
- |
423 |
-423 |
| |
|
b) |
Portfolio Investment |
28,638 |
25,069 |
3,569 |
32,220 |
30,373 |
1,847 |
| |
|
|
i) |
In India |
28,625 |
25,063 |
3,562 |
32,179 |
30,351 |
1,828 |
| |
|
|
|
of which |
|
|
|
|
|
|
| |
|
|
|
FIIs |
28,418 |
25,063 |
3,355 |
30,329 |
30,351 |
-22 |
| |
|
|
|
GDRs/ADRs |
207 |
- |
207 |
1,848 |
- |
1,848 |
| |
|
|
ii) |
Abroad |
13 |
6 |
7 |
41 |
22 |
19 |
| |
2. |
Loans (a+b+c) |
14,731 |
8,250 |
6,481 |
17,184 |
9,168 |
8,016 |
| |
|
a) |
External Assistance |
1,113 |
494 |
619 |
1,289 |
523 |
766 |
| |
|
|
i) |
By India |
5 |
8 |
-3 |
5 |
8 |
-3 |
| |
|
|
ii) |
To India |
1,108 |
486 |
622 |
1,284 |
515 |
769 |
| |
|
b) |
Commercial Borrowings |
5,418 |
1,369 |
4,049 |
7,734 |
1,418 |
6,316 |
| |
|
|
i) |
By India |
425 |
345 |
80 |
- |
228 |
-228 |
| |
|
|
ii) |
To India |
4,993 |
1,024 |
3,969 |
7,734 |
1,190 |
6,544 |
| |
|
c) |
Short Term To India |
8,200 |
6,387 |
1,813 |
8,161 |
7,227 |
934 |
| |
|
|
i) |
Suppliers’ Credit >180 days & Buyers’ Credit |
5,660 |
6,387 |
-727 |
8,161 |
6,022 |
2,139 |
| |
|
|
ii) |
Suppliers’ Credit up to 180 days |
2,540 |
- |
2,540 |
- |
1,205 |
-1,205 |
| |
3. |
Banking Capital (a+b) |
7,160 |
10,273 |
-3,113 |
14,386 |
12,703 |
1,683 |
| |
|
a) |
Commercial Banks |
6,944 |
10,239 |
-3,295 |
14,264 |
12,703 |
1,561 |
| |
|
|
i) |
Assets |
556 |
4,530 |
-3,974 |
7,085 |
8,000 |
-915 |
| |
|
|
ii) |
Liabilities |
6,388 |
5,709 |
679 |
7,179 |
4,703 |
2,476 |
| |
|
|
|
of which: Non-Resident Deposits |
6,325 |
4,862 |
1,463 |
5,158 |
4,510 |
648 |
| |
|
b) |
Others |
216 |
34 |
182 |
122 |
- |
122 |
| |
4. |
Rupee Debt Service |
- |
2 |
-2 |
- |
93 |
-93 |
| |
5. |
Other Capital |
1,976 |
994 |
982 |
4,828 |
1,419 |
3,409 |
| |
Total Capital Account (1 to 5) |
62,513 |
51,698 |
10,815 |
74,178 |
58,375 |
15,803 |
C. |
Errors & Omissions |
294 |
- |
294 |
426 |
- |
426 |
D. |
Overall Balance
(Total Current Account, Capital Account and Errors & Omissions (A+B+C)) |
123,335 |
115,830 |
7,505 |
145,358 |
124,906 |
20,452 |
E. |
Monetary Movements (i+ii) |
- |
7,505 |
-7,505 |
- |
20,452 |
-20,452 |
| |
i) |
I.M.F. |
- |
- |
- |
- |
- |
- |
| |
ii) |
Foreign Exchange Reserves (Increase – / Decrease +) |
- |
7,505 |
-7,505 |
- |
20,452 |
-20,452 |
Statement I : India's Overall Balance of Payments (Contd.) |
(US$ million) |
Item |
Apr-Jun 2007PR |
Jul-Sep 2007 PR |
Credit |
Debit |
Net |
Credit |
Debit |
Net |
1 |
26 |
27 |
28 |
29 |
30 |
31 |
A. |
Current Account |
|
|
|
|
|
|
| |
I. |
Merchandise |
34,356 |
56,346 |
-21,990 |
38,273 |
59,510 |
-21,237 |
| |
II. |
Invisibles (a+b+c) |
29,880 |
14,570 |
15,310 |
34,013 |
17,073 |
16,940 |
| |
|
a) |
Services |
18,890 |
9,916 |
8,974 |
20,587 |
11,589 |
8,998 |
| |
|
|
i) |
Travel |
2,088 |
1,906 |
182 |
2,248 |
2,047 |
201 |
| |
|
|
ii) |
Transportation |
1,953 |
2,526 |
-573 |
2,091 |
2,559 |
-468 |
| |
|
|
iii) |
Insurance |
373 |
185 |
188 |
341 |
284 |
57 |
| |
|
|
iv) |
G.n.i.e. |
94 |
110 |
-16 |
68 |
128 |
-60 |
| |
|
|
v) |
Miscellaneous |
14,382 |
5,189 |
9,193 |
15,839 |
6,571 |
9,268 |
| |
|
|
|
of which |
|
|
|
|
|
|
| |
|
|
|
Software Services |
8,836 |
679 |
8,157 |
9,050 |
801 |
8,249 |
| |
|
|
|
Business Services |
3,758 |
3,163 |
595 |
3,894 |
3,537 |
357 |
| |
|
|
|
Financial Services |
528 |
449 |
79 |
916 |
702 |
214 |
| |
|
|
|
Communication Services |
513 |
231 |
282 |
613 |
180 |
433 |
| |
|
b) |
Transfers |
8,628 |
432 |
8,196 |
9,708 |
408 |
9,300 |
| |
|
|
i) |
Official |
153 |
165 |
-12 |
158 |
112 |
46 |
| |
|
|
ii) |
Private |
8,475 |
267 |
8,208 |
9,550 |
296 |
9,254 |
| |
|
c) |
Income |
2,362 |
4,222 |
-1,860 |
3,718 |
5,076 |
-1,358 |
| |
|
|
i) |
Investment Income |
2,279 |
4,024 |
-1,745 |
3,608 |
4,778 |
-1,170 |
| |
|
|
ii) |
Compensation of Employees |
83 |
198 |
-115 |
110 |
298 |
-188 |
| |
Total Current Account (I+II) |
64,236 |
70,916 |
-6,680 |
72,286 |
76,583 |
-4,297 |
B. |
Capital Account |
|
|
|
|
|
|
| |
1. |
Foreign Investment (a+b) |
43,034 |
32,756 |
10,278 |
54,205 |
41,178 |
13,027 |
| |
|
a) |
Foreign Direct Investment (i+ii) |
8,270 |
5,534 |
2,736 |
5,502 |
3,374 |
2,128 |
| |
|
|
i) |
In India |
7,477 |
20 |
7,457 |
4,728 |
19 |
4,709 |
| |
|
|
|
Equity |
5,574 |
20 |
5,554 |
2,822 |
19 |
2,803 |
| |
|
|
|
Reinvested Earnings |
1,792 |
- |
1,792 |
1,792 |
- |
1,792 |
| |
|
|
|
Other Capital |
111 |
- |
111 |
114 |
- |
114 |
| |
|
|
ii) |
Abroad |
793 |
5,514 |
-4,721 |
774 |
3,355 |
-2,581 |
| |
|
|
|
Equity |
793 |
4,758 |
-3,965 |
774 |
2,515 |
-1,741 |
| |
|
|
|
Reinvested Earnings |
- |
271 |
-271 |
- |
271 |
-271 |
| |
|
|
|
Other Capital |
- |
485 |
-485 |
- |
569 |
-569 |
| |
|
b) |
Portfolio Investment |
34,764 |
27,222 |
7,542 |
48,703 |
37,804 |
10,899 |
| |
|
|
i) |
In India |
34,706 |
27,216 |
7,490 |
48,698 |
37,781 |
10,917 |
| |
|
|
|
of which |
|
|
|
|
|
|
| |
|
|
|
FIIs |
34,305 |
27,216 |
7,089 |
46,199 |
37,781 |
8,418 |
| |
|
|
|
GDRs/ADRs |
316 |
- |
316 |
2,477 |
- |
2,477 |
| |
|
|
ii) |
Abroad |
58 |
6 |
52 |
5 |
23 |
-18 |
| |
2. |
Loans (a+b+c) |
16,749 |
7,593 |
9,156 |
19,742 |
10,437 |
9,305 |
| |
|
a) |
External Assistance |
732 |
491 |
241 |
983 |
515 |
468 |
| |
|
|
i) |
By India |
6 |
7 |
-1 |
6 |
7 |
-1 |
| |
|
|
ii) |
To India |
726 |
484 |
242 |
977 |
508 |
469 |
| |
|
b) |
Commercial Borrowings |
8,291 |
1,338 |
6,953 |
6,290 |
2,080 |
4,210 |
| |
|
|
i) |
By India |
359 |
345 |
14 |
443 |
503 |
-60 |
| |
|
|
ii) |
To India |
7,932 |
993 |
6,939 |
5,847 |
1,577 |
4,270 |
| |
|
c) |
Short Term To India |
7,726 |
5,764 |
1,962 |
12,469 |
7,842 |
4,627 |
| |
|
|
i) |
Suppliers’ Credit >180 days & Buyers’ Credit |
6,883 |
5,764 |
1,119 |
11,012 |
7,842 |
3,170 |
| |
|
|
ii) |
Suppliers’ Credit up to 180 days |
843 |
- |
843 |
1,457 |
- |
1,457 |
| |
3. |
Banking Capital (a+b) |
8,560 |
9,479 |
-919 |
13,714 |
7,071 |
6,643 |
| |
|
a) |
Commercial Banks |
8,560 |
9,473 |
-913 |
13,690 |
7,000 |
6,690 |
| |
|
|
i) |
Assets |
2,543 |
2,861 |
-318 |
4,404 |
358 |
4,046 |
| |
|
|
ii) |
Liabilities |
6,017 |
6,612 |
-595 |
9,286 |
6,642 |
2,644 |
| |
|
|
|
of which: Non-Resident Deposits |
5,252 |
5,699 |
-447 |
6,975 |
6,606 |
369 |
| |
|
b) |
Others |
- |
6 |
-6 |
24 |
71 |
-47 |
| |
4. |
Rupee Debt Service |
- |
43 |
-43 |
- |
2 |
-2 |
| |
5. |
Other Capital |
1,151 |
1,831 |
-680 |
7,378 |
3,196 |
4,182 |
| |
Total Capital Account (1 to 5) |
69,494 |
51,702 |
17,792 |
95,039 |
61,884 |
33,155 |
C. |
Errors & Omissions |
88 |
- |
88 |
378 |
- |
378 |
D. |
Overall Balance
(Total Current Account, Capital Account and Errors & Omissions (A+B+C)) |
133,818 |
122,618 |
11,200 |
167,703 |
138,467 |
29,236 |
E. |
Monetary Movements (i+ii) |
- |
11,200 |
-11,200 |
- |
29,236 |
-29,236 |
| |
i) |
I.M.F. |
- |
- |
- |
- |
- |
- |
| |
ii) |
Foreign Exchange Reserves (Increase – / Decrease +) |
- |
11,200 |
-11,200 |
- |
29,236 |
-29,236 |
Statement I : India's Overall Balance of Payments (Contd.) |
(US$ million) |
Item |
Oct-Dec 2007PR |
Jan-Mar 2008 PR |
Credit |
Debit |
Net |
Credit |
Debit |
Net |
1 |
32 |
33 |
34 |
35 |
36 |
37 |
A. |
Current Account |
|
|
|
|
|
|
| |
I. |
Merchandise |
40,985 |
67,038 |
-26,053 |
52,549 |
74,895 |
-22,346 |
| |
II. |
Invisibles (a+b+c) |
39,553 |
18,031 |
21,522 |
45,158 |
24,338 |
20,820 |
| |
|
a) |
Services |
24,618 |
12,592 |
12,026 |
25,982 |
18,415 |
7,567 |
| |
|
|
i) |
Travel |
3,395 |
2,519 |
876 |
3,618 |
2,782 |
836 |
| |
|
|
ii) |
Transportation |
2,799 |
3,043 |
-244 |
3,171 |
3,386 |
-215 |
| |
|
|
iii) |
Insurance |
438 |
261 |
177 |
487 |
314 |
173 |
| |
|
|
iv) |
G.n.i.e. |
90 |
75 |
15 |
78 |
63 |
15 |
| |
|
|
v) |
Miscellaneous |
17,896 |
6,694 |
11,202 |
18,628 |
11,870 |
6,758 |
| |
|
|
|
of which |
|
|
|
|
|
|
| |
|
|
|
Software Services |
9,608 |
852 |
8,756 |
12,806 |
726 |
12,080 |
| |
|
|
|
Business Services |
4,588 |
4,245 |
343 |
4,531 |
5,770 |
-1,239 |
| |
|
|
|
Financial Services |
882 |
763 |
119 |
891 |
1,224 |
-333 |
| |
|
|
|
Communication Services |
601 |
183 |
418 |
681 |
265 |
416 |
| |
|
b) |
Transfers |
11,428 |
493 |
10,935 |
14,495 |
982 |
13,513 |
| |
|
|
i) |
Official |
195 |
121 |
74 |
247 |
116 |
131 |
| |
|
|
ii) |
Private |
11,233 |
372 |
10,861 |
14,248 |
866 |
13,382 |
| |
|
c) |
Income |
3,507 |
4,946 |
-1,439 |
4,681 |
4,941 |
-260 |
| |
|
|
i) |
Investment Income |
3,401 |
4,679 |
-1,278 |
4,520 |
4,608 |
-88 |
| |
|
|
ii) |
Compensation of Employees |
106 |
267 |
-161 |
161 |
333 |
-172 |
| |
Total Current Account (I+II) |
80,538 |
85,069 |
-4,531 |
97,707 |
99,233 |
-1,526 |
B. |
Capital Account |
|
|
|
|
|
|
| |
1. |
Foreign Investment (a+b) |
86,531 |
69,639 |
16,892 |
88,992 |
84,232 |
4,760 |
| |
|
a) |
Foreign Direct Investment (i+ii) |
8,316 |
6,275 |
2,041 |
14,750 |
6,254 |
8,496 |
| |
|
|
i) |
In India |
7,916 |
43 |
7,873 |
14,240 |
43 |
14,197 |
| |
|
|
|
Equity |
6,022 |
43 |
5,979 |
12,448 |
26 |
12,422 |
| |
|
|
|
Reinvested Earnings |
1,792 |
- |
1,792 |
1,792 |
- |
1,792 |
| |
|
|
|
Other Capital |
102 |
- |
102 |
- |
17 |
-17 |
| |
|
|
ii) |
Abroad |
400 |
6,232 |
-5,832 |
510 |
6,211 |
-5,701 |
| |
|
|
|
Equity |
400 |
5,206 |
-4,806 |
510 |
4,419 |
-3,909 |
| |
|
|
|
Reinvested Earnings |
- |
271 |
-271 |
- |
271 |
-271 |
| |
|
|
|
Other Capital |
- |
755 |
-755 |
- |
1,521 |
-1,521 |
| |
|
b) |
Portfolio Investment |
78,215 |
63,364 |
14,851 |
74,242 |
77,978 |
-3,736 |
| |
|
|
i) |
In India |
78,096 |
63,345 |
14,751 |
74,188 |
77,952 |
-3,764 |
| |
|
|
|
of which |
|
|
|
|
|
|
| |
|
|
|
FIIs |
72,309 |
63,345 |
8,964 |
73,808 |
77,952 |
-4,144 |
| |
|
|
|
GDRs/ADRs |
5,597 |
- |
5,597 |
379 |
- |
379 |
| |
|
|
ii) |
Abroad |
119 |
19 |
100 |
54 |
26 |
28 |
| |
2. |
Loans (a+b+c) |
21,543 |
10,601 |
10,942 |
25,494 |
12,967 |
12,527 |
| |
|
a) |
External Assistance |
1,109 |
544 |
565 |
1,417 |
577 |
840 |
| |
|
|
i) |
By India |
6 |
7 |
-1 |
6 |
7 |
-1 |
| |
|
|
ii) |
To India |
1,103 |
537 |
566 |
1,411 |
570 |
841 |
| |
|
b) |
Commercial Borrowings |
8,449 |
2,202 |
6,247 |
7,346 |
2,123 |
5,223 |
| |
|
|
i) |
By India |
363 |
384 |
-21 |
427 |
392 |
35 |
| |
|
|
ii) |
To India |
8,086 |
1,818 |
6,268 |
6,919 |
1,731 |
5,188 |
| |
|
c) |
Short Term To India |
11,985 |
7,855 |
4,130 |
16,731 |
10,267 |
6,464 |
| |
|
|
i) |
Suppliers’ Credit >180 days & Buyers’ Credit |
10,231 |
7,855 |
2,376 |
14,515 |
10,267 |
4,248 |
| |
|
|
ii) |
Suppliers’ Credit up to 180 days |
1,754 |
- |
1,754 |
2,216 |
- |
2,216 |
| |
3. |
Banking Capital (a+b) |
12,588 |
12,381 |
207 |
20,951 |
15,125 |
5,826 |
| |
|
a) |
Commercial Banks |
12,585 |
12,029 |
556 |
20,899 |
15,122 |
5,777 |
| |
|
|
i) |
Assets |
5,636 |
3,939 |
1,697 |
6,979 |
5,510 |
1,469 |
| |
|
|
ii) |
Liabilities |
6,949 |
8,090 |
-1,141 |
13,920 |
9,612 |
4,308 |
| |
|
|
|
of which:Non-Resident Deposits |
6,456 |
7,309 |
-853 |
10,718 |
9,608 |
1,110 |
| |
|
b) |
Others |
3 |
352 |
-349 |
52 |
3 |
49 |
| |
4. |
Rupee Debt Service |
- |
- |
- |
- |
76 |
-76 |
| |
5. |
Other Capital |
6,612 |
3,636 |
2,976 |
5,763 |
2,771 |
2,992 |
| |
Total Capital Account (1 to 5) |
127,274 |
96,257 |
31,017 |
141,200 |
115,171 |
26,029 |
C. |
Errors & Omissions |
252 |
- |
252 |
487 |
- |
487 |
D. |
Overall Balance
(Total Current Account,Capital Account and Errors & Omissions (A+B+C)) |
208,064 |
181,326 |
26,738 |
239,394 |
214,404 |
24,990 |
E. |
Monetary Movements (i+ii) |
- |
26,738 |
-26,738 |
- |
24,990 |
-24,990 |
| |
i) |
I.M.F. |
- |
- |
- |
- |
- |
- |
| |
ii) |
Foreign Exchange Reserves (Increase – / Decrease +) |
- |
26,738 |
-26,738 |
- |
24,990 |
-24,990 |
Statement I : India's Overall Balance of Payments (Contd.) |
(US$ million) |
Item |
Apr-Jun 2008 PR |
Jul-Sep 2008 PR |
Credit |
Debit |
Net |
Credit |
Debit |
Net |
1 |
38 |
39 |
40 |
41 |
42 |
43 |
A. |
Current Account |
|
|
|
|
|
|
|
I. |
Merchandise |
49,120 |
80,545 |
-31,425 |
48,987 |
87,663 |
-38,676 |
|
II. |
Invisibles (a+b+c) |
38,939 |
16,533 |
22,406 |
45,696 |
19,532 |
26,164 |
| |
|
a) |
Services |
23,059 |
11,441 |
11,618 |
27,832 |
13,775 |
14,057 |
| |
|
|
i) |
Travel |
2,504 |
2,164 |
340 |
2,786 |
2,704 |
82 |
| |
|
|
ii) |
Transportation |
2,611 |
3,328 |
-717 |
2,964 |
3,744 |
-780 |
| |
|
|
iii) |
Insurance |
350 |
228 |
122 |
367 |
306 |
61 |
| |
|
|
iv) |
G.n.i.e. |
130 |
110 |
20 |
81 |
95 |
-14 |
| |
|
|
v) |
Miscellaneous |
17,464 |
5,611 |
11,853 |
21,634 |
6,926 |
14,708 |
| |
|
|
|
of which |
|
|
|
|
|
|
| |
|
|
|
Software Services |
12,156 |
857 |
11,299 |
12,220 |
924 |
11,296 |
| |
|
|
|
Business Services |
3,550 |
3,133 |
417 |
4,840 |
3,984 |
856 |
| |
|
|
|
Financial Services |
609 |
628 |
-19 |
1,670 |
965 |
705 |
| |
|
|
|
Communication Services |
510 |
226 |
284 |
740 |
296 |
444 |
| |
|
b) |
Transfers |
12,307 |
654 |
11,653 |
13,719 |
829 |
12,890 |
| |
|
|
i) |
Official |
148 |
107 |
41 |
51 |
97 |
-46 |
| |
|
|
ii) |
Private |
12,159 |
547 |
11,612 |
13,668 |
732 |
12,936 |
| |
|
c) |
Income |
3,573 |
4,438 |
-865 |
4,145 |
4,928 |
-783 |
| |
|
|
i) |
Investment Income |
3,418 |
4,108 |
-690 |
3,855 |
4,596 |
-741 |
| |
|
|
ii) |
Compensation of Employees |
155 |
330 |
-175 |
290 |
332 |
-42 |
| |
Total Current Account (I+II) |
88,059 |
97,078 |
-9,019 |
94,683 |
107,195 |
-12,512 |
B. |
Capital Account |
|
|
|
|
|
|
| |
1. |
Foreign Investment (a+b) |
52,901 |
48,145 |
4,756 |
51,774 |
48,184 |
3,590 |
| |
|
a) |
Foreign Direct Investment (i+ii) |
12,137 |
3,170 |
8,967 |
9,143 |
4,243 |
4,900 |
| |
|
|
i) |
In India |
11,898 |
22 |
11,876 |
8,825 |
52 |
8,773 |
| |
|
|
|
Equity |
10,240 |
22 |
10,218 |
7,304 |
52 |
7,252 |
| |
|
|
|
Reinvested Earnings |
1,492 |
- |
1,492 |
1,492 |
- |
1,492 |
| |
|
|
|
Other Capital |
166 |
- |
166 |
29 |
- |
29 |
| |
|
|
ii) |
Abroad |
239 |
3,148 |
-2,909 |
318 |
4,191 |
-3,873 |
| |
|
|
|
Equity |
239 |
2,346 |
-2,107 |
318 |
3,426 |
-3,108 |
| |
|
|
|
Reinvested Earnings |
- |
271 |
-271 |
- |
271 |
-271 |
| |
|
|
|
Other Capital |
- |
531 |
-531 |
- |
494 |
-494 |
| |
|
b) |
Portfolio Investment |
40,764 |
44,975 |
-4,211 |
42,631 |
43,941 |
-1,310 |
| |
|
|
i) |
In India |
40,745 |
44,923 |
-4,178 |
42618 |
43,919 |
-1,301 |
| |
|
|
|
of which |
|
|
|
|
|
|
| |
|
|
|
FIIs |
39,746 |
44,923 |
-5,177 |
42,482 |
43,919 |
-1,437 |
| |
|
|
|
GDRs/ADRs |
999 |
- |
999 |
136 |
- |
136 |
| |
|
|
ii) |
Abroad |
19 |
52 |
-33 |
13 |
22 |
-9 |
| |
2. |
Loans (a+b+c) |
13,845 |
9,630 |
4,215 |
16,282 |
12,782 |
3,500 |
| |
|
a) |
External Assistance |
909 |
558 |
351 |
1,095 |
577 |
518 |
| |
|
|
i) |
By India |
6 |
8 |
-2 |
6 |
8 |
-2 |
| |
|
|
ii) |
To India |
903 |
550 |
353 |
1,089 |
569 |
520 |
| |
|
b) |
Commercial Borrowings |
2,760 |
1,293 |
1,467 |
3,578 |
1,888 |
1,690 |
| |
|
|
i) |
By India |
404 |
193 |
211 |
532 |
138 |
394 |
| |
|
|
ii) |
To India |
2,356 |
1,100 |
1,256 |
3,046 |
1,750 |
1,296 |
| |
|
c) |
Short Term To India |
10,176 |
7,779 |
2,397 |
11,609 |
10,317 |
1,292 |
| |
|
|
i) |
Suppliers’ Credit >180 days & Buyers’ Credit |
9,256 |
7,779 |
1,477 |
11,609 |
9,766 |
1,843 |
| |
|
|
ii) |
Suppliers’ Credit up to 180 days |
920 |
- |
920 |
- |
551 |
-551 |
| |
3. |
Banking Capital (a+b) |
21,952 |
19,256 |
2,696 |
16,208 |
14,084 |
2,124 |
| |
|
a) |
Commercial Banks |
21,952 |
19,105 |
2,847 |
16,208 |
14,081 |
2,127 |
| |
|
|
i) |
Assets |
11,457 |
10,533 |
924 |
6,446 |
5,154 |
1,292 |
| |
|
|
ii) |
Liabilities |
10,495 |
8,572 |
1,923 |
9,762 |
8,927 |
835 |
| |
|
|
|
of which: Non-Resident Deposits |
9,063 |
8,249 |
814 |
9,174 |
8,915 |
259 |
| |
|
b) |
Others |
- |
151 |
-151 |
- |
3 |
-3 |
| |
4. |
Rupee Debt Service |
- |
30 |
-30 |
- |
3 |
-3 |
| |
5. |
Other Capital |
2,176 |
2,678 |
-502 |
764 |
2,410 |
-1,646 |
| |
Total Capital Account (1 to 5) |
90,874 |
79,739 |
11,135 |
85,028 |
77,463 |
7,565 |
C. |
Errors & Omissions |
119 |
- |
119 |
213 |
- |
213 |
D. |
Overall Balance
(Total Current Account, Capital Account and Errors & Omissions (A+B+C)) |
179,052 |
176,817 |
2,235 |
179,924 |
184,658 |
-4,734 |
E. |
Monetary Movements (i+ii) |
- |
2,235 |
-2,235 |
4,734 |
- |
4,734 |
| |
i) |
I.M.F. |
- |
- |
- |
- |
- |
- |
| |
ii) |
Foreign Exchange Reserves (Increase – / Decrease +) |
- |
2,235 |
-2,235 |
4,734 |
- |
4,734 |
Statement I : India's Overall Balance of Payments (Concld.) |
(US$ million) |
Item |
Oct-Dec 2008 PR |
Jan-Mar 2009 P |
Credit |
Debit |
Net |
Credit |
Debit |
Net |
1 |
44 |
45 |
46 |
47 |
48 |
49 |
A. |
Current Account |
|
|
|
|
|
|
| |
I. |
Merchandise |
37,257 |
71,961 |
-34,704 |
39,820 |
54,418 |
-14,598 |
| |
II. |
Invisibles (a+b+c) |
40,260 |
18,589 |
21,671 |
37,661 |
18,316 |
19,345 |
| |
|
a) |
Services |
26,075 |
12,923 |
13,152 |
24,258 |
13,267 |
10,991 |
| |
|
|
i) |
Travel |
2,924 |
1,953 |
971 |
2,680 |
2,611 |
69 |
| |
|
|
ii) |
Transportation |
2,572 |
3,210 |
-638 |
2,919 |
2,495 |
424 |
| |
|
|
iii) |
Insurance |
344 |
269 |
75 |
348 |
328 |
20 |
| |
|
|
iv) |
G.n.i.e. |
97 |
233 |
-136 |
81 |
353 |
-272 |
| |
|
|
v) |
Miscellaneous |
20,138 |
7,258 |
12,880 |
18,230 |
7,480 |
10,750 |
| |
|
|
|
of which |
|
|
|
|
|
|
| |
|
|
|
Software Services |
11,444 |
580 |
10,864 |
11,180 |
453 |
10,727 |
| |
|
|
|
Business Services |
4,012 |
3,540 |
472 |
3,849 |
4,612 |
-763 |
| |
|
|
|
Financial Services |
889 |
735 |
154 |
771 |
633 |
138 |
| |
|
|
|
Communication Services |
492 |
217 |
275 |
428 |
257 |
171 |
| |
|
b) |
Transfers |
10,994 |
844 |
10,150 |
10,005 |
419 |
9,586 |
| |
|
|
i) |
Official |
285 |
98 |
187 |
161 |
111 |
50 |
| |
|
|
ii) |
Private |
10,709 |
746 |
9,963 |
9,844 |
308 |
9,536 |
| |
|
c) |
Income |
3,191 |
4,822 |
-1,631 |
3,398 |
4,630 |
-1,232 |
| |
|
|
i) |
Investment Income |
3,000 |
4,481 |
-1,481 |
3,209 |
4,314 |
-1,105 |
| |
|
|
ii) |
Compensation of Employees |
191 |
341 |
-150 |
189 |
316 |
-127 |
| |
Total Current Account (I+II) |
77,517 |
90,550 |
-13,033 |
77,481 |
72,734 |
4,747 |
B. |
Capital Account |
|
|
|
|
|
|
| |
1. |
Foreign Investment (a+b) |
33,162 |
38,538 |
-5,376 |
27,072 |
26,580 |
492 |
| |
|
a) |
Foreign Direct Investment (i+ii) |
6,564 |
6,120 |
444 |
8,414 |
5,229 |
3,185 |
| |
|
|
i) |
In India |
6,352 |
29 |
6,323 |
8,073 |
63 |
8,010 |
| |
|
|
|
Equity |
4,109 |
29 |
4,080 |
6,322 |
63 |
6,259 |
| |
|
|
|
Reinvested Earnings |
1,721 |
- |
1,721 |
1,721 |
- |
1,721 |
| |
|
|
|
Other Capital |
522 |
- |
522 |
30 |
- |
30 |
| |
|
|
ii) |
Abroad |
212 |
6,091 |
-5,879 |
341 |
5,166 |
-4,825 |
| |
|
|
|
Equity |
212 |
4,489 |
-4,277 |
341 |
4,407 |
-4,066 |
| |
|
|
|
Reinvested Earnings |
- |
271 |
-271 |
- |
271 |
-271 |
| |
|
|
|
Other Capital |
- |
1,331 |
-1,331 |
- |
488 |
-488 |
| |
|
b) |
Portfolio Investment |
26,598 |
32,418 |
-5,820 |
18,658 |
21,351 |
-2,693 |
| |
|
|
i) |
In India |
26,568 |
32,355 |
-5,787 |
18,580 |
21,169 |
-2,589 |
| |
|
|
|
of which |
|
|
|
|
|
|
| |
|
|
|
FIIs |
26,561 |
32,355 |
-5,794 |
18,560 |
21,169 |
-2,609 |
| |
|
|
|
GDRs/ADRs |
7 |
- |
7 |
20 |
- |
20 |
| |
|
|
ii) |
Abroad |
30 |
63 |
-33 |
78 |
182 |
-104 |
| |
2. |
Loans (a+b+c) |
15,818 |
14,934 |
884 |
14,213 |
17,811 |
-3,598 |
| |
|
a) |
External Assistance |
1,655 |
663 |
992 |
1,383 |
606 |
777 |
| |
|
|
i) |
By India |
6 |
8 |
-2 |
6 |
8 |
-2 |
| |
|
|
ii) |
To India |
1,649 |
655 |
994 |
1,377 |
598 |
779 |
| |
|
b) |
Commercial Borrowings |
5,448 |
1,564 |
3,884 |
3,596 |
2,479 |
1,117 |
| |
|
|
i) |
By India |
669 |
149 |
520 |
400 |
305 |
95 |
| |
|
|
ii) |
To India |
4,779 |
1,415 |
3,364 |
3,196 |
2,174 |
1,022 |
| |
|
c) |
Short Term To India |
8,715 |
12,707 |
-3,992 |
9,234 |
14,726 |
-5,492 |
| |
|
|
i) |
Suppliers’ Credit >180 days & Buyers’ Credit |
8,715 |
10,357 |
-1,642 |
9,234 |
10,450 |
-1,216 |
| |
|
|
ii) |
Suppliers’ Credit up to 180 days |
- |
2,350 |
-2,350 |
- |
4,276 |
-4,276 |
| |
3. |
Banking Capital (a+b) |
14,810 |
19,766 |
-4,956 |
12,028 |
15,289 |
-3,261 |
| |
|
a) |
Commercial Banks |
14,808 |
19,335 |
-4,527 |
11,917 |
15,289 |
-3,372 |
| |
|
|
i) |
Assets |
5,192 |
7,541 |
-2,349 |
2,578 |
5,498 |
-2,920 |
| |
|
|
ii) |
Liabilities |
9,616 |
11,794 |
-2,178 |
9,339 |
9,791 |
-452 |
| |
|
|
|
of which: Non-Resident Deposits |
9,523 |
8,481 |
1,042 |
9,329 |
7,154 |
2,175 |
| |
|
b) |
Others |
2 |
431 |
-429 |
111 |
- |
111 |
| |
4. |
Rupee Debt Service |
- |
- |
- |
- |
68 |
-68 |
| |
5. |
Other Capital |
5,670 |
488 |
5,182 |
3,781 |
2,634 |
1,147 |
| |
Total Capital Account (1 to 5) |
69,460 |
73,726 |
-4,266 |
57,094 |
62,382 |
-5,288 |
C. |
Errors & Omissions |
- |
582 |
-582 |
841 |
- |
841 |
D. |
Overall Balance
(Total Current Account, Capital Account and Errors & Omissions (A+B+C)) |
146,977 |
164,858 |
-17,881 |
135,416 |
135,116 |
300 |
E. |
Monetary Movements (i+ii) |
17,881 |
- |
17,881 |
- |
300 |
-300 |
| |
i) |
I.M.F. |
- |
- |
- |
- |
- |
- |
| |
ii) |
Foreign Exchange Reserves (Increase – / Decrease +) |
17,881 |
- |
17,881 |
- |
300 |
-300 |
* Prepared in the Division of International Finance, Department of Economic Analysis and Policy, Reserve Bank of India, |