India’s External Debt: Trend, Policy Changes and Cross Country Comparisons* The external debt data are compiled and released by the Reserve Bank of India/ Ministry of Finance, Government of India on a quarterly basis with a lag of one quarter. As per the standard practice, India’s external debt statistics for the quarters ending March and June are compiled and released by the Reserve Bank of India and those for the quarters ending September and December by the Ministry of Finance, Government of India. Based on the data on India’s external debt as at end-June 2009 released by the Reserve Bank on September 30, 2009, this article reviews the external debt position of India in the light of recent policy measures undertaken by the authorities against the backdrop of global financial crisis for the effective management of India’s external debt1.
This article has been divided into five sections. The major highlights and review of India’s external debt as at end-June 2009 is set out in Section I. A cross country comparison of external debt among the select developing countries is presented in Section II. An assessment of the impact of global slowdown on India’s external debt is discussed in Section III. In Section IV, a synoptic review of the recent policy measures undertaken by the Government of India and the Reserve Bank for effective management of external debt is chronicled. Finally, based on the major indicators of debt sustainability, the concluding observations on India’s external debt position are presented in Section V. Section I
Major Highlights of External Debt (i) India’s external debt stood at US$ 227.7 billion at the end of June 2009. The increase in external debt by US$ 3.7 billion over end-March 2009 level was mainly due to increase in long term external debt, particularly NonResident Indian (NRI) deposits.
(ii) Excluding the valuation effects due to depreciation of US dollar against other major currencies and Indian rupee during the first quarter of the financial year 2009-10, the stock of external debt as at end-June 2009 would have declined by US$ 1.3 billion.
(iii) The share of US dollar denominated debt in the total external debt declined to 54.4 per cent as at end-June 2009 from 56.3 per cent as at end-March 2009. (iv) Based on the original maturity, the share of short-term to total debt declined to 17.8 per cent at end-June 2009 from 19.5 per cent at end-March 2009. (v) Based on the residual maturity, the short-term debt accounted for 39.1 per cent of the total external debt at end-June 2009.
(vi) The share of non-Government debt in the total external debt declined marginally to 74.8 per cent as at end-June 2009 from 75.5 per cent as at end-March 2009.
(vii) The debt service ratio declined steadily during the last three years and stood at 4.6 per cent as at end-March 2009. The debt service ratio for April-June 2009 worked out to 5.5 per cent.
Table 1: External Debt Outstanding |
(US $ billion) |
At the end of |
Total External Debt |
Variation |
Over corresponding Quarter of Previous year |
Over Previous Quarter |
Amount |
Per cent |
Amount |
Per cent |
1 |
2 |
3 |
4 |
5 |
6 |
March 2007 |
171.3 |
33.2 |
24.0 |
10.9 |
6.8 |
June 2007 |
182.3 |
37.3 |
25.7 |
11.0 |
6.4 |
September 2007 |
195.6 |
45.0 |
29.8 |
13.3 |
7.3 |
December 2007 |
206.0 |
45.6 |
28.5 |
10.4 |
5.3 |
March 2008 |
223.3 |
52.0 |
30.3 |
17.3 |
8.4 |
June 2008 |
224.3 |
42.0 |
23.0 |
1.0 |
0.4 |
September 2008 |
223.4 |
27.8 |
14.2 |
-0.8 |
-0.4 |
December 2008 |
228.9 |
23.0 |
11.1 |
5.5 |
2.5 |
March 2009 PR |
224.0 |
0.6 |
0.3 |
-5.0 |
-2.2 |
June 2009 P |
227.7 |
3.4 |
1.5 |
3.7 |
1.7 |
P: Provisional. PR: Partially Revised.
Source: Ministry of Finance, Government of India and Reserve Bank of India. |
India’s External Debt as at the end of June 2009
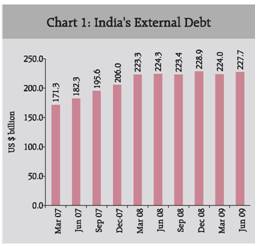
India’s external debt was placed at US$ 227.7 billion at the end of June 2009 as compared to US$ 224.0 billion as at end of March 2009. The increase in the external debt outstanding as at end-June 2009 by US$ 3.7 billion or 1.7 per cent over the end-March 2009 level was mainly due to the increase in long term external debt, particularly Non-Resident Indian (NRI) deposits (Table 1 and Chart 1). The external debt outstanding as at end-June 2009 increased by US$ 3.4 billion or 1.5 per cent over the end-June 2008 level.
Valuation Changes The valuation effect reflecting the depreciation of the US dollar against other major international currencies and Indian rupee during the first quarter of the financial year 2009-10 resulted in an increase in the external debt by US$ 5.0 billion as compared to the end-March 2009 level. This implies that excluding the valuation effect, the stock of external debt as at end-June 2009 would have declined by US$ 1.3 billion over the end-March 2009 level.
Table 2: External Debt by Component |
(US $ million) |
Item |
End- March |
End-June |
1991 |
1998 |
2005 |
2006 |
2007 |
2008 |
2009PR |
2008 |
2009 P |
1 |
2 |
3 |
4 |
5 |
6 |
7 |
8 |
9 |
10 |
1. |
Multilateral |
20,900 |
29,553 |
31,744 |
32,620 |
35,337 |
39,490 |
39,538 |
39,644 |
41,236 |
|
|
(24.9) |
(31.6) |
(23.9) |
(23.6) |
(20.6) |
(17.7) |
(17.7) |
(17.7) |
(18.1) |
2. |
Bilateral |
14,168 |
16,969 |
17,034 |
15,761 |
16,065 |
19,701 |
20,605 |
18,724 |
21,417 |
|
|
(16.9) |
(18.1) |
(12.8) |
(11.4) |
(9.4) |
(8.8) |
(9.2) |
(8.3) |
(9.4) |
3. |
IMF |
2,623 |
664 |
- |
- |
- |
- |
- |
- |
- |
|
|
(3.1) |
(0.7) |
(-) |
(-) |
(-) |
(-) |
(-) |
(-) |
(-) |
4. |
Trade Credit |
4,301 |
6,526 |
5,022 |
5,420 |
7,165 |
10,358 |
14,625 |
11,030 |
15,055 |
|
|
(5.1) |
(7.0) |
(3.8) |
(3.9) |
(4.2) |
(4.6) |
(6.5) |
(4.9) |
(6.6) |
5. |
ECBs |
10,209 |
16,986 |
26,405 |
26,452 |
41,443 |
62,337 |
62,508 |
61,058 |
63,153 |
|
|
(12.2) |
(18.2) |
(19.9) |
(19.1) |
(24.2) |
(27.9) |
(27.9) |
(27.2) |
(27.7) |
6. |
NRI Deposits |
10,209 |
11,913 |
32,743 |
36,282 |
41,240 |
43,672 |
41,554 |
42,612 |
44,579 |
|
|
(12.2) |
(12.7) |
(24.6) |
(26.3) |
(24.1) |
(19.6) |
(18.6) |
(19.0) |
(19.6) |
7. |
Rupee Debt |
12,847 |
5,874 |
2,302 |
2,059 |
1,951 |
2,016 |
1,527 |
1,866 |
1,607 |
|
|
(15.3) |
(6.3) |
(1.7) |
(1.5) |
(1.1) |
(0.9) |
(0.7) |
(0.8) |
(0.7) |
8. |
Long-term Debt |
75,257 |
88,485 |
1,15,250 |
1,18,594 |
1,43,201 |
1,77,574 |
1,80,357 |
1,74,934 |
1,87,047 |
|
(1to 7) |
(89.8) |
(94.6) |
(86.7) |
(85.9) |
(83.6) |
(79.5) |
(80.5) |
(78.0) |
(82.2) |
9. |
Short-term Debt |
8,544 |
5,046 |
17,723 |
19,539 |
28,130 |
45,738 |
43,596 |
49,330 |
40,641 |
|
|
(10.2) |
(5.4) |
(13.3) |
(14.1) |
(16.4) |
(20.5) |
(19.5) |
(22.0) |
(17.8) |
Total (8+9) |
83,801 |
93,531 |
1,32,973 |
1,38,133 |
1,71,331 |
2,23,312 |
2,23,953 |
2,24,264 |
2,27,688 |
|
|
(100.0) |
(100.0) |
(100.0) |
(100.0) |
(100.0) |
(100.0) |
(100.0) |
(100.0) |
(100.0) |
P : Provisional. PR : Partially Revised. – : Nil.
IMF : International Monetary Fund; ECBs: External Commercial Borrowings; NRI: Non-Resident Indian.
Note: Figures in parentheses are percentage to total external debt.
Source: Ministry of Finance, Government of India and Reserve Bank of India. |
Components of External Debt
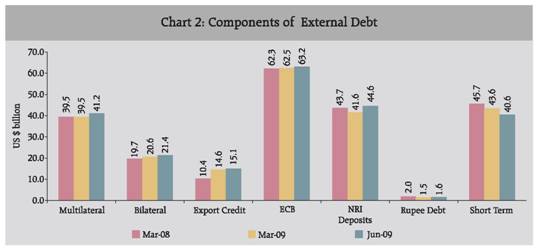
By way of composition of external debt, the share of commercial borrowings (27.7 per cent) continued to be the highest followed by NRI deposits (19.6 per cent), multilateral debt (18.1 per cent), short-term debt (17.8 per cent) and bilateral debt (9.4 per cent) as at end-June 2009 (Table 2).
The long-term debt at US$ 187.1 billion and short-term debt at US$ 40.6 billion accounted for 82.2 per cent and 17.8 per cent, respectively, of the total external debt as at end-June 2009. The increase in long-term debt by US$ 6.7 billion as at end June 2009 was mainly due to the increase in NRI deposits. Outstanding NRI deposits at US$ 44.6 billion as at end-June 2009 increased by US$ 3.0 billion over the level at end-March 2009 on account of increase in inflows under NRI deposit schemes reflecting a positive influence of hike in ceiling interest rates in a phased manner during 2008-09 (Table 3 and Chart 2). External commercial borrowings showed a marginal increase of US$ 645 million over end-March 2009, mainly due to increase in commercial bank loans and FII investment in Government securities and corporate bonds.
Table 3: Variation in Components of External Debt |
Item |
External debt outstanding at the end-of (US$ million) |
Absolute variation (US$ million) |
Percentage variation (Per cent) |
Mar 08 |
Mar 09 (PR) |
Jun 09 (P) |
Mar 09
over
Mar 08 |
Jun 09
over
Mar 09 |
Mar 09
over
Mar 08 |
Jun 09
over
Mar 09 |
1 |
2 |
3 |
4 |
5 |
6 |
7 |
8 |
1. |
Multilateral |
39,490 |
39,538 |
41,236 |
48 |
1,698 |
0.1 |
4.3 |
2. |
Bilateral |
19,701 |
20,605 |
21,417 |
904 |
812 |
4.6 |
3.9 |
3. |
IMF |
|
|
- |
|
|
- |
|
4. |
Export Credit |
10,358 |
14,625 |
15,055 |
4,267 |
429 |
41.2 |
2.9 |
5. |
Commercial Borrowing |
62,337 |
62,508 |
63,153 |
169 |
645 |
0.3 |
1.0 |
6. |
NRI Deposits |
43,672 |
41,554 |
44,579 |
-2,118 |
3,025 |
-4.8 |
7.3 |
7. |
Rupee Debt |
2,016 |
1,527 |
1,607 |
-489 |
80 |
-24.3 |
5.2 |
8. |
Short term Debt |
45,738 |
43,596 |
40,641 |
-2,142 |
-2,955 |
-4.7 |
-6.8 |
|
of which: |
|
|
|
|
|
|
|
|
(i) Short term trade credit |
41,901 |
40,198 |
37,113 |
-1,703 |
-3,085 |
-4.1 |
-7.7 |
Total Debt (1 to 8) |
223,312 |
223,953 |
227,688 |
642 |
3,735 |
0.3 |
1.7 |
Memo Items |
|
A. Long-Term Debt (1 to 7) |
177,574 |
180,357 |
187,047 |
2,783 |
6,690 |
1.6 |
3.7 |
|
B. Short-Term Debt |
45,738 |
43,596 |
40,641 |
-2,142 |
-2,955 |
-4.7 |
-6.8 |
P : Provisional PR: Partially Revised – : Nil
Source: Ministry of Finance, Government of India and Reserve Bank of India. |
External Commercial Borrowings
The ECB approval for April-June 2009 stood lower at US$ 2.7 billion as compared with US$ 3.8 billion for the corresponding quarter of the previous year. As a result, there was a lower disbursement of ECB during April-June 2009 (Table 4).
Currency Composition
While the US dollar is generally used as the numeraire currency for computing external debt in order to facilitate international comparison, the currency composition of the external debt is essential to understand the currencies in which the debt is actually denominated. It gives an idea of the extent of exposure of the economy to cross currency exchange rate movements. The currency composition of India’s external debt is generally disseminated in terms of major foreign currencies such as US dollar, Japanese Yen, Euro, Pound Sterling, Special Drawing Rights (SDR) and the domestic currency i.e., Indian Rupee.
Table 4: External Commercial Borrowings |
(US $ million) |
Year |
Approvals# |
Gross Disbursement* |
Amortisation* |
Interest* |
Total Servicing |
ECB Debt Outstanding |
1 |
2 |
3 |
4 |
5 |
6 (4+5) |
7 |
1990-91 |
1,903 |
4,252 |
2,004 |
1,410 |
3,414 |
10,209 |
1991-92 |
2,127 |
3,133 |
1,677 |
1,153 |
2,830 |
11,715 |
1992-93 |
2,200 |
1,167 |
1,525 |
1,182 |
2,707 |
11,643 |
1993-94 |
2,585 |
2,913 |
1,978 |
1,254 |
3,232 |
12,363 |
1994-95 |
4,469 |
4,152 |
2,812 |
1,478 |
4,290 |
12,991 |
1995-96 |
6,286 |
4,252 |
3,868 |
1,380 |
5,248 |
13,873 |
1996-97 |
8,581 |
7,571 |
4,605 |
1,354 |
5,959 |
14,335 |
1997-98 |
8,712 |
7,371 |
3,550 |
1,384 |
4,934 |
16,986 |
1998-99 |
5,200 |
7,226 |
3,477 |
1,593 |
5,070 |
20,978 |
1999-00 |
3,398 |
3,187 |
4,147 |
1,653 |
5,800 |
19,943 |
2000-01 |
2,837 |
9,621 |
5,378 |
1,695 |
7,073 |
24,408 |
2001-02 |
2,653 |
2,684 |
4,107 |
1,456 |
5,563 |
23,320 |
2002-03 |
4,235 |
3,505 |
5,019 |
1,167 |
6,186 |
22,472 |
2003-04 |
6,671 |
5,225 |
8,045 |
2,119 |
10,164 |
22,007 |
2004-05 |
11,490 |
9,084 |
3,571 |
959 |
4,530 |
26,405 |
2005-06 |
17,175 |
14,343 |
11,584 |
3,165 |
14,749 |
26,452 |
2006-07 |
25,353 |
20,257 |
3,814 |
2,517 |
6,331 |
41,443 |
2007-08 PR |
28,900 |
28,784 |
6,119 |
3,652 |
9,771 |
62,337 |
2008-09 PR |
17,200 |
13,377 |
6,439 |
3,962 |
10,401 |
62,508 |
2008-09 |
|
|
|
|
|
|
(Apr-Jun) |
3,775 |
2,356 |
1,100 |
944 |
2,044 |
61,058 |
2009-10 |
|
|
|
|
|
|
(Apr-Jun) P |
2,685 |
1,848 |
2,115 |
856 |
2,973 |
63,153 |
PR : Partially Revised; QE: Quick Estimates.
* : Revised; based on Balance of Payments data.
# : Based on date of agreement of the loan which may differ from the date of granting the loan registration number by the RBI. Ceiling on ECB approvals is fixed on the basis of the latter, which may either be after or before the date of agreement of the loan. Hence, there may be some difference between the amount shown under approvals in the table and the amount of ceiling fixed for a particular year.
Note: Disbursements during 1998-99 and 2000-01 include RIBs (US$ 4.2 billion) and IMDs (US$ 5.5 billion), respectively. Debt service payments during 2003-04 and 2005-06 include redemption of RIBs and IMDs, respectively. |
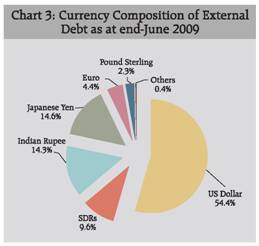
The US dollar continues to remain the predominant currency accounting for 54.4 per cent of the total external debt stock as at end-June 2009. However, there was a decline in the share of US dollar dominated external debt as compared to its share in the external debt as at end-March 2009. There was an increase in the share of Japanese yen (14.6 per cent), Indian rupee (14.3 per cent), SDR (9.6 per cent) and Euro (4.4 per cent) in the total external debt as at end-June 2009 as compared to its share in the external debt as at end-March 2009 (Table 5 and Chart 3). Instrument-wise Classification of External Debt The instrument-wise classification of India’s external debt as at end-June 2009 reveals that the share of ‘loans’ in the total external debt outstanding accounted for 53.8 per cent as compared to 53.1 per cent as at end-March 2009 (Table 6). The group ‘currency and deposits’ and ‘trade credits’ together accounted for 48.6 per cent of the total non-Government debt as at end-June 2009 as compared with 49.0 per cent as at end-March 2009.
Table 5: Currency Composition of India’s External Debt |
( Percentage share in total external debt) |
Currency |
End-March |
End-June |
2005 |
2006 |
2007 |
2008 |
2009 PR |
2009 P |
1 |
2 |
3 |
4 |
5 |
6 |
7 |
US Dollar |
48.0 |
49.2 |
51.4 |
54.4 |
56.3 |
54.4 |
SDR |
14.2 |
13.7 |
11.9 |
10.0 |
9.4 |
9.6 |
Indian Rupee |
19.6 |
18.9 |
18.6 |
17.5 |
13.6 |
14.3 |
Japanese Yen |
10.5 |
10.9 |
11.5 |
12.0 |
14.3 |
14.6 |
Euro |
4.6 |
4.4 |
3.9 |
3.6 |
4.1 |
4.4 |
Pound Sterling |
2.6 |
2.6 |
2.4 |
2.2 |
1.9 |
2.3 |
Others |
0.5 |
0.3 |
0.3 |
0.3 |
0.4 |
0.4 |
Total |
100 |
100 |
100 |
100 |
100 |
100 |
P : Provisional PR : Partially Revised
Source: Ministry of Finance, Government of India and Reserve Bank of India |
Short-term Debt
The short-term debt has become an important component for measuring the liquidity and refinancing risks. In the recent years, efforts have been made to expand the coverage of short-term external debt. The data on short-term debt now includes suppliers’ credit up to and above 180 days, FII investments in Government debt, investment by foreign central banks and international institutions in Treasury Bills and external liabilities of central banks and commercial banks.
Table 6: Instrument-wise Classification of External Debt Outstanding |
(US$ million) |
Sr. No. |
Borrower |
End-March 2009 PR |
End-June 2009 P |
1 |
2 |
3 |
4 |
A. |
Government (1+2) |
54,856 |
57,446 |
|
1. |
Short-Term |
939 |
1,248 |
|
|
(i) |
Money Market Instruments |
939 |
1,248 |
|
2. |
Long-term {(i)+(ii)+(iii)} |
53,917 |
56,199 |
|
|
(i) |
Bonds and Notes |
963 |
1,275 |
|
|
(ii) |
Loans |
51,680 |
53,605 |
|
|
(iii) |
Trade Credits |
1,274 |
1,319 |
B. |
Monetary Authority |
764 |
769 |
|
1. |
Short-term |
764 |
769 |
|
|
(i) |
Currency and Deposits |
764 |
769 |
C. |
Non-Government (1+2) |
1,68,334 |
1,69,472 |
|
1. |
Short-Term {(i)+(ii)} |
41,893 |
38,624 |
|
|
(i) |
Money Market Instruments |
1,695 |
1,512 |
|
|
(ii) |
Trade Credits |
40,198 |
37,113 |
|
2. |
Long-term {(i)+(ii)+(iii)+(iv)} |
1,26,440 |
1,30,848 |
|
|
(i) |
Bonds and Notes |
16,932 |
16,779 |
|
|
(ii) |
Loans |
67,232 |
68,780 |
|
|
(iii) |
Currency and Deposits |
41,554 |
44,579 |
|
|
(iv) |
Trade Credits |
722 |
710 |
|
Total External Debt (A+B+C) |
2,23,953 |
2,27,688 |
P: Provisional; PR: Partially Revised.
Source : Ministry of Finance, Government of India and Reserve Bank of India. |
Short-term debt by original maturity as at end-June 2009 declined to US$ 40.6 billion as against US$ 43.6 billion as at end-March 2009 mainly due to decline in short-term trade credits. The share of trade related credits in total short-term debt stood at 91.3 per cent as at end-June 2009. The ratio of trade credits to imports declined to 13.6 per cent as at end-March 2009 as against 16.3 per cent as at end-March 2008 (Table 7). External Debt by Residual Maturity
While external debt is generally compiled in terms of original maturity, analysing the external debt, in particular, short term debt in terms of residual maturity is important from the point of view of foreign exchange liquidity management and to ascertain the total foreign exchange outgo on account of debt service payments in the immediate future.
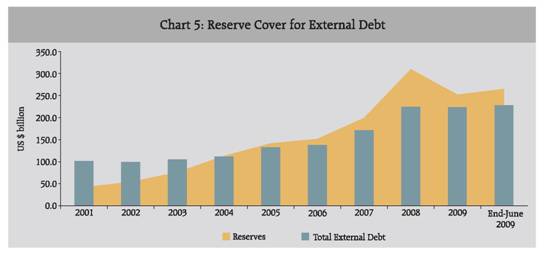
The ‘short-term debt by residual maturity’ comprises repayments due under medium and long-term debt by original maturity during one year reference period along with the short-term debt with original maturity. The balance constitutes the long-term debt by residual maturity. As at end-March 2009, the revised short-term debt by residual maturity stood at US$ 87.5 billion, which has increased to US$ 89.1 billion as at end-June 2009. Based on residual maturity, the short-term debt accounted for 39.1 per cent of total external debt as at end-June 2009. The ratio of short-term debt by residual maturity to foreign exchange reserves worked out to 33.6 per cent at end-June 2009 (Table 8).
Table 7: Short-Term Debt by Original Maturity |
(US $ million) |
Components |
End-March |
End -June |
2005 |
2006 |
2007 |
2008 |
2009 PR |
2008 |
2009 P |
1 |
2 |
3 |
4 |
5 |
6 |
7 |
8 |
A. |
Short-Term Debt |
17,723 |
19,539 |
28,130 |
45,738 |
43,596 |
49,330 |
40,641 |
|
(a) |
Trade related credits |
16,271 |
19,399 |
25,979 |
41,901 |
40,198 |
46,270 |
37,113 |
|
|
(i) above 6 months and upto 1year |
7,529 |
8,696 |
11,971 |
22,884 |
23,346 |
24,361 |
23,882 |
|
|
(ii) Upto 6 months |
8,742 |
10,703 |
14,008 |
19,017 |
16,852 |
21,909 |
13,231 |
|
(b) |
FII Investments in Govt Treasury Bills & other instruments |
1,452 |
140 |
397 |
651 |
2,065 |
676 |
2,149 |
|
(c) |
Investment in Treasury Bills by foreign central banks and international institutions etc. |
- |
- |
164 |
155 |
105 |
149 |
104 |
|
(d) |
External Debt Liabilities of: |
- |
- |
1,590 |
3,031 |
1,228 |
2,235 |
1,275 |
|
|
(i) Central Bank |
- |
- |
501 |
1,115 |
764 |
975 |
769 |
|
|
(ii) Commercial Bank |
- |
- |
1,089 |
1,916 |
464 |
1,260 |
507 |
B. |
Imports (during the year) # |
1,18,908 |
1,57,056 |
1,90,670 |
2,57,789 |
2,94,587 |
80,545 |
64,775 |
C. |
Trade Credits to Imports (%) |
13.7 |
12.4 |
13.6 |
16.3 |
13.6 |
- |
- |
PR : Partially Revised. P : Provisional.
# : On balance of payments basis.
Source: Ministry of Finance, Government of India and Reserve Bank of India. |
Government and NonGovernment External Debt
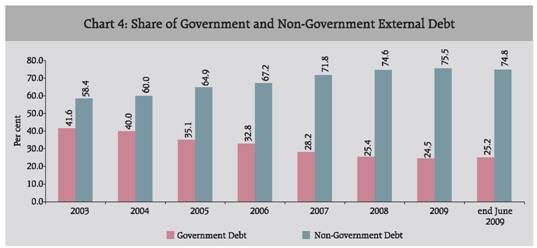
Government (Sovereign) external debt stood at US$ 57.5 billion as at end-June 2009, while non-Government debt amounted to US$ 170.2 billion. The share of nonGovernment debt in total external debt has increased steadily since March 2003. However, the share of non-Government debt in total external debt declined to 74.8 per cent as at end-June 2009 as compared to 75.5 per cent as at end-March 2009 (Table 9 and Chart 4).
Debt Service Payments
India’s debt service ratio has improved progressively over the years owing to the combined effect of moderation in debt service payments and growth in external current receipts. The debt service ratio had declined from a peak of 35.3 per cent in 1990-91 to 10.1 per cent during 2005-06 which also includes repayments relating to the India Millennium Deposits. The debt service ratio declined to 4.6 per cent during 2008-09. The debt service ratio for April-June 2009 stood at 5.5 per cent (Table 10).
Table 8: Residual Maturity of External Debt (Outstanding as at End-June 2009) P |
(US$ million) |
Components |
Short-term
Up to
one year |
Long-term |
Total (2) to (5) |
1 to 2 years |
2 to 3 years |
More than 3 years |
1 |
2 |
3 |
4 |
5 |
6 |
1 |
Sovereign Debt |
2,839 |
3,036 |
3,223 |
47,102 |
56,200 |
2 |
Commercial Borrowing (including trade credit) |
10,124 |
13,174 |
14,929 |
48,041 |
86,268 |
3 |
NRI deposits {(i)+(ii)+(iii)} |
35,526 |
4,466 |
3,526 |
1,061 |
44,579 |
|
(i) FCNR(B) |
10,931 |
2,032 |
925 |
126 |
14,014 |
|
(ii) NR(E)RA |
20,386 |
1,996 |
1,871 |
699 |
24,952 |
|
(iii) NRO |
4,210 |
438 |
730 |
236 |
5,613 |
4 |
Short-Term Debt* (Original maturity) |
40,641 |
|
|
|
40,641 |
Total (1 to 4) |
89,130 |
20,676 |
21,678 |
96,204 |
227,688 |
Memo Items |
|
|
|
|
|
Short term debt
(Residual maturity as per cent of total debt Short-term debt) |
39.1 |
|
|
|
|
Short term debt
(Residual maturity as per cent of total debt Short-term debt) |
33.6 |
|
|
|
|
P : Provisional.
* Also includes short-term component of sovereign debt amounting to US$ 1,114 million
Note : Residual Maturity of NRI Deposits is estimated on the basis of the Survey conducted by the Reserve Bank on NRI deposits outstanding as on June 30, 2009.
Source : Ministry of Finance, Government of India and Reserve Bank of India. |
Table 9: Government and Non-Government External Debt |
(US$ million) |
Sr. No. |
Components |
End- March |
End -June 2009 P |
2005 |
2006 |
2007 |
2008 |
2009 PR |
1 |
2 |
3 |
4 |
5 |
6 |
7 |
8 |
A. |
Sovereign Debt (I+II)
(As a percentage of GDP) |
46,668 |
45,278 |
48,331 |
56,947 |
54,856 |
57,446 |
(6.5) |
(5.6) |
(5.1) |
(4.8) |
(5.3) |
- |
|
I. External Debt on
Government Account under External Assistance |
43,686 |
43,510 |
46,155 |
52,538 |
51,816 |
53,716 |
|
II. Other Government External Debt @ |
2,982 |
1,768 |
2,176 |
4,409 |
3,040 |
3,730 |
B. |
Non-Government Debt # (As a percentage of GDP) |
86,305 |
92,855 |
123,000 |
166,365 |
169,097 |
170,242 |
(12.0) |
(11.5) |
(13.0) |
(14.1) |
(16.2) |
- |
C. |
Total External Debt (A+B) (As a percentage of GDP) |
1,32,973 |
1,38,133 |
1,71,331 |
2,24,312 |
223,953 |
2,27,688 |
(18.5) |
(17.2) |
(18.1) |
(18.9) |
( 21.4) |
- |
P : Provisional. PR : Partially Revised.
@ : Other Government external debt includes defence debt, investment in Treasury Bills/ Government securities by FIIs, foreign central banks and international institutions.
# : Includes external debt of Monetary Authority.
Source: Ministry of Finance, Government of India and Reserve Bank of India. |
Based on outstanding long-term debt, as at end-March 2009, the projected debt service payments will be higher at US$ 22.8 billion during 2012-13. The repayment of NRI deposits and FII investment in debt securities are not included in the projections. The projections do not include future debt service obligations arising out of fresh borrowings. At end-March 2009, the projected debt service payments for External Commercial Borrowings (ECBs) and Foreign Currency Convertible Bonds (FCCBs) revealed that the principal repayments between 2011-12 and 2012-13 would be higher (Table 11).
Table 10: India’s External Debt Service Payments |
(US$ million) |
Sr. No. |
Item |
1990-91 |
2000-01 |
2005-06 |
2006-07 |
2007-08 |
2008-09 |
End-June 2009 |
|
|
|
|
|
|
|
|
|
1 |
2 |
3 |
4 |
5 |
6 |
7 |
8 |
9 |
1 |
External Assistance |
2,315 |
3,444 |
2,652 |
2,942 |
3,241 |
3,381 |
862 |
|
Repayment |
1,187 |
2,338 |
1,945 |
1,960 |
2,099 |
2,372 |
620 |
|
Interest |
1,128 |
1,106 |
707 |
982 |
1,142 |
1,009 |
242 |
2 |
External Commercial |
|
|
|
|
|
|
|
|
Borrowings |
3,414 |
7,073 |
14,839 |
6,331 |
9,771 |
10,401 |
2,973 |
|
Repayment |
2,004 |
5,378 |
11,824 |
3,814 |
6,119 |
6,439 |
2,115 |
|
Interest |
1,410 |
1,695 |
3,015 |
2,517 |
3,652 |
3,962 |
858 |
3 |
I.M.F. |
778 |
26 |
- |
- |
- |
- |
- |
|
Repayment |
644 |
26 |
- |
- |
- |
- |
- |
|
Interest |
134 |
- |
- |
- |
- |
- |
- |
4 |
NRI Deposits |
|
|
|
|
|
|
|
|
Interest |
1,282 |
1,661 |
1,497 |
1,969 |
1,813 |
1,547 |
393 |
5 |
Rupee Debt Services |
|
|
|
|
|
|
|
|
Repayments |
1,193 |
617 |
572 |
162 |
121 |
101 |
23 |
6 |
Total Debt Service |
|
|
|
|
|
|
|
|
(1 to 5) |
8,982 |
12,821 |
19,560 |
11,404 |
14,946 |
15,430 |
4,251 |
|
Repayment |
5,028 |
8,359 |
14,341 |
5,936 |
8,339 |
8,912 |
2,758 |
|
Interest |
3,954 |
4,462 |
5,219 |
5,468 |
6,607 |
6,518 |
1,493 |
7 |
Current Receipts# Debt Service |
25,479 |
77,467 |
1,94,170 |
2,42,811 |
3,14,014 |
3,37,095 |
77,427 |
|
Ratio (6/7) (%) |
35.3 |
16.6 |
10.1 |
4.7 |
4.8 |
4.6 |
5.5 |
# : Current Receipts minus Official Transfers. –: Nil.
Note: Debt service ratio is defined as total repayments of principal and interest on debt as a ratio of current receipts.
Source : Ministry of Finance, Government of India and Reserve Bank of India. |
Table 11: Projected Debt Service Payments |
(US$ million) |
Year |
Long-Term Debt |
Of which: ECBs and FCCBs |
|
Principal |
Interest |
Total |
Principal |
Interest |
Total |
1 |
2 |
3 |
4 |
5 |
6 |
7 |
2009-10 |
11,277 |
3,093 |
14,370 |
7,842 |
1,363 |
9,204 |
2010-11 |
13,059 |
3,375 |
16,434 |
10,215 |
1,819 |
12,035 |
2011-12 |
16,819 |
3,817 |
20,636 |
13,627 |
2,257 |
15,884 |
2012-13 |
19,131 |
3,647 |
22,778 |
15,508 |
2,045 |
17,553 |
2013-14 |
13,755 |
2,523 |
16,278 |
10,221 |
949 |
11,170 |
2014-15 |
9,213 |
2,195 |
11,408 |
6,157 |
625 |
6,782 |
2015-16 |
7,496 |
1,924 |
9,420 |
4,132 |
472 |
4,604 |
2016-17 |
7,331 |
1,691 |
9,022 |
3,804 |
338 |
4,142 |
2017-18 |
6,063 |
1,462 |
7,525 |
2,404 |
226 |
2,629 |
2018-19 |
5,543 |
1,273 |
6,816 |
1,748 |
153 |
1,900 |
ECBs: External Commercial Borrowings. FCCBs: Foreign Currency Convertible Bonds.
Note : Projections on debt servicing in respect of long-term debt are based on the debt outstanding position at end-March 2009. The projections for ECBs and FCCBs are based on the outstanding position at end-June 2009. The projections exclude NRI deposits and FII investment in government debt securities. |
Section II
External Debt: Cross Country Comparison According to the latest data available on Global Development Finance Online Database, World Bank, the international comparison of external debt of the twenty most indebted countries manifests that India was the fifth most indebted country in 2007 as compared with third position in 1990 (Table 12).
(i) The element of concessionality in India’s external debt portfolio was the third highest after Indonesia and Philippines (Table 13).
(ii) India’s debt service ratio was third lowest with China and Malaysia having first and second lowest debt service ratio, respectively. (iii) In terms of ratio of external debt to Gross National Product (GNP), India’s position was sixth lowest, with China having the lowest ratio of external debt to GNP.
(iv) India’s position with respect to short-term debt to total external debt was eighth lowest with Mexico having the lowest ratio of short-term debt to total external debt.
(v) In terms of reserves to total debt, India’s position was third, similar to that of Thailand, as China and Malaysia had higher reserves to debt ratio than India.
According to the latest data available from the Quarterly External Debt Statistics (QEDS), among the top 20 debtor countries, the share of debt securities in the total external debt was highest for Mexico as at end-March 2009. The share of debt securities accounted for 9.0 per cent in the total external debt of India as at end-March 2009 while it marginally increased to 9.1 per cent as at end-June 2009 (Table 14).
Table 12: Total External Debt Outstanding |
(US $ billion) |
Country |
1990 |
2000 |
2004 |
2005 |
2006 |
2007 |
1 |
2 |
3 |
4 |
5 |
6 |
7 |
All developing countries |
1,283.1 |
2,177.8 |
2,636.5 |
2,633.0 |
2,858.4 |
3,466.0 |
1. China |
55.3 |
145.7 |
247.7 |
283.8 |
325.1 |
373.6 |
2. Russian Federation |
.. |
160.0 |
196.8 |
229.9 |
250.5 |
370.2 |
3. Turkey |
49.4 |
116.8 |
160.7 |
169.3 |
207.8 |
251.5 |
4. Brazil |
119.7 |
241.6 |
219.5 |
187.4 |
193.5 |
237.5 |
5. India |
83.8 |
101.3 |
133.0 |
138.1 |
171.3 |
223.3 |
6. Poland |
49.4 |
64.8 |
105.3 |
108.2 |
139.0 |
195.4 |
7. Mexico |
104.4 |
150.9 |
171.2 |
167.9 |
160.5 |
178.1 |
8. Indonesia |
69.9 |
144.3 |
139.6 |
132.8 |
130.8 |
140.8 |
9. Argentina |
62.2 |
140.9 |
162.4 |
125.0 |
115.9 |
127.8 |
10. Kazakhstan |
.. |
12.4 |
32.8 |
43.4 |
74.1 |
96.1 |
11. Romania |
1.1 |
11.2 |
29.6 |
38.9 |
54.0 |
85.4 |
12. Ukraine |
.. |
12.2 |
30.2 |
33.3 |
49.9 |
73.6 |
13. Philippines |
30.6 |
58.3 |
61.0 |
61.7 |
60.3 |
65.8 |
14. Thailand |
28.1 |
79.7 |
51.3 |
51.4 |
55.0 |
63.1 |
15. Chile |
19.2 |
37.3 |
43.8 |
45.4 |
48.0 |
58.6 |
16. Malaysia |
15.3 |
41.9 |
52.2 |
52.0 |
56.5 |
53.7 |
17. Croatia |
.. |
12.4 |
33.0 |
30.6 |
38.4 |
48.6 |
18. Colombia |
17.2 |
33.9 |
37.9 |
37.7 |
38.9 |
45.0 |
19. South Africa |
.. |
24.9 |
27.1 |
31.1 |
35.5 |
43.4 |
20. Venezuela, RB |
33.2 |
42.0 |
39.3 |
45.7 |
44.6 |
43.1 |
.. : Not available.
Note : The source data for India is Government of India and Reserve Bank of India. Therefore, the data for India pertains to financial year (April-March) and not calendar year.
Source : Global Development Finance Online Database, World Bank, Ministry of Finance, Government of India and Reserve Bank of India. |
According to the latest available data, for select countries, Indonesia has the largest share of Government debt in its total external debt which worked out to 55.3 per cent as at end-March 2009 followed by Colombia with 54.6 per cent (Table 15). The share of Government debt in the total external debt for India worked out to 24.5 per cent as at end-March 2009 as against 25.1 per cent as at end-December 2008.
Mexico has the largest debt outstanding in respect of the public sector debt and publicly guaranteed private sector external debt. India’s public sector debt and publicly guaranteed private sector external debt amounted to US$ 61.7 billion as at end-March 2009 as compared to US$ 64.2 billion as at end-December 2008 (Table 16).
As per the latest available data in the Global Development Finance Online Database, the concessional debt as a percentage of total debt has declined sharply since 1980 as a result of growing importance of external borrowings from private sources at commercial terms in respect of the developing countries. Although the proportion of concessionality in India’s external debt has also declined, it remains the third highest after Indonesia and Philippines among the top 20 indebted nations. Most of the total external debt incurred by each of the top twenty debtorcountries is public and public guaranteeddebt (PPG). Public sector debt burden has been declining for India and other emergingmarket economies (Table 17).
While for most of the Latin Americancountries and East Asian countries, the ratioof total debt to current receipts hasremained broadly stable during the 1990s,the ratio has declined sharply for countries like India, China, Mexico, Philippines and Malaysia indicating an improvement in debt-servicing capacity. Furthermore, the debt to national income ratio provides some indication of the potential to service external debt by switching resources from production of domestic goods to the production of exports. Among the top 20 debtor countries, India ranked sixth in respect of the lowest ratio of external debt to National Income ratio (Table 18).
Table 13: International Comparison of Top Twenty Debtor Countries, 2007 |
Country |
External debt
stocks, total
(US $ billion) |
Concessional
debt/Total
external debt
(per cent) |
Debt service
ratio
(per cent) |
External Debt
to GNP
(per cent) |
Short-term
debt/Total
external debt
(per cent) |
Forex
Reserves to
Total external
debt
(per cent) |
1 |
2 |
3 |
4 |
5 |
6 |
7 |
China |
373.6 |
10.1 |
2.2 |
11.6 |
54.5 |
413.9 |
Russian Federation |
370.2 |
0.4 |
9.1 |
29.4 |
21.4 |
129.1 |
Turkey |
251.5 |
2.1 |
32.1 |
38.8 |
16.6 |
30.4 |
Brazil |
237.5 |
1.0 |
27.8 |
18.7 |
16.5 |
75.9 |
India |
223.3 |
19.8 |
4.8 |
18.9 |
20.5 |
138.7 |
Poland |
195.4 |
0.4 |
25.6 |
47.7 |
30.9 |
33.6 |
Mexico |
178.1 |
0.6 |
12.5 |
17.7 |
5.1 |
49.0 |
Indonesia |
140.8 |
26.2 |
10.5 |
33.9 |
24.8 |
40.4 |
Argentina |
127.8 |
1.3 |
13.0 |
49.7 |
29.8 |
36.1 |
Kazakhstan |
96.1 |
1.0 |
49.6 |
103.7 |
12.2 |
18.4 |
Romania |
85.4 |
1.6 |
19.1 |
51.5 |
35.7 |
46.8 |
Ukraine |
73.6 |
2.2 |
16.9 |
52.9 |
31.1 |
44.1 |
Philippines |
65.8 |
20.0 |
13.7 |
41.9 |
10.8 |
51.2 |
Thailand |
63.1 |
9.6 |
8.1 |
26.5 |
34.3 |
138.7 |
Chile |
58.6 |
0.4 |
14.2 |
40.3 |
22.7 |
28.7 |
Malaysia |
53.7 |
6.1 |
4.6 |
29.4 |
28.4 |
189.9 |
Croatia |
48.6 |
2.1 |
33.0 |
97.7 |
10.5 |
28.1 |
Colombia |
45.0 |
2.1 |
22.0 |
22.5 |
11.9 |
46.6 |
South Africa |
43.4 |
- |
5.9 |
15.8 |
38.2 |
75.9 |
Venezuela, RB |
43.1 |
0.5 |
7.4 |
18.7 |
27.1 |
78.2 |
– : Nil/Negligible.
Source: Data for India as published by national authorities for 2007-08 and those for other countries as at end-December 2007 as available in World Bank’s Global Development Finance Online Database. |
Table 14: Gross External Debt Position by Instrument |
(US$ billion) |
Country |
End-March 2009 |
Debt Securities |
Loans |
Currency
and
Deposits |
Trade Credits |
Other Liabilities |
Dir. Inv.:
Interco.
Lend |
Total |
1 |
2 |
3 |
4 |
5 |
6 |
7 |
8 |
Argentina |
46.0 |
35.3 |
0.4 |
8.9 |
16.4 |
20.6 |
127.5 |
Brazil |
86.8 |
81.5 |
0.4 |
17.3 |
6.7 |
67.3 |
259.9 |
Colombia |
14.9 |
28.7 |
- |
2.8 |
0.4 |
0.1 |
46.8 |
India |
20.5 |
118.9 |
42.3 |
42.2 |
- |
- |
224.0 |
Indonesia |
32.7 |
113.8 |
2.5 |
1.2 |
0.9 |
- |
151.0 |
Mexico |
85.8 |
67.4 |
1.0 |
12.3 |
2.6 |
- |
169.3 |
Russian Federation |
27.3 |
352.4 |
29.7 |
- |
8.0 |
33.4 |
450.8 |
Turkey |
39.1 |
173.2 |
28.1 |
21.8 |
- |
3.2 |
265.3 |
End-December 2008 |
Argentina |
47.0 |
34.1 |
0.5 |
9.0 |
16.7 |
20.9 |
128.2 |
Brazil |
88.6 |
84.7 |
0.5 |
16.6 |
7.9 |
64.6 |
262.9 |
Colombia |
14.2 |
28.8 |
- |
2.9 |
0.3 |
0.1 |
46.4 |
India |
22.5 |
120.1 |
41.7 |
44.7 |
- |
- |
228.9 |
Indonesia |
31.1 |
116.5 |
3.9 |
1.5 |
2.1 |
- |
155.1 |
Mexico |
116.5 |
65.3 |
1.8 |
14.5 |
2.3 |
- |
200.4 |
Russian Federation |
29.8 |
377.3 |
35.6 |
- |
8.0 |
32.7 |
483.5 |
Turkey |
38.9 |
183.4 |
28.8 |
22.7 |
- |
3.3 |
277.1 |
– : Nil/Negligible.
Note : Data in respect of India is partially revised.
Source : Quarterly External Debt Statistics, the World Bank and IMF. |
Table 15: Gross External Debt Position by Sector |
(US$ billion) |
Country |
End-March 2009 |
General Government |
Monetary Authorities |
Banks |
Other Sectors |
Direct Inv. Inter-company |
1 |
2 |
3 |
4 |
5 |
6 |
Argentina |
58.5 |
6.5 |
5.0 |
37.0 |
20.6 |
Brazil |
62.7 |
- |
68.1 |
61.9 |
67.3 |
Colombia |
25.6 |
- |
3.4 |
17.8 |
0.1 |
India |
54.9 |
0.8 |
44.6 |
129.8 |
.. |
Indonesia |
83.5 |
2.1 |
8.2 |
57.2 |
.. |
Mexico |
53.9 |
0.1 |
8.9 |
106.3 |
- |
Russian Federation |
27.6 |
2.5 |
144.9 |
242.5 |
33.4 |
Turkey |
71.0 |
12.4 |
52.1 |
126.7 |
3.2 |
End-December 2008 |
Argentina |
59.9 |
4.9 |
5.1 |
37.4 |
20.9 |
Brazil |
62.6 |
- |
74.2 |
61.5 |
64.6 |
Colombia |
24.5 |
0.1 |
4.0 |
17.8 |
0.1 |
India |
57.4 |
0.8 |
43.6 |
127.2 |
.. |
Indonesia |
85.1 |
1.5 |
11.6 |
56.9 |
.. |
Mexico |
57.9 |
0.1 |
9.1 |
133.2 |
- |
Russian Federation |
29.5 |
3.3 |
164.6 |
253.4 |
32.7 |
Turkey |
72.2 |
13.5 |
55.4 |
132.7 |
3.3 |
Note : Data in respect of India is partially revised – : Nil/Negligible .. : Not available
Source : Quarterly External Debt Statistics, the World Bank and IMF. |
Table 16 - Gross External Debt Position by Original Maturity: Public Sector Debt and Publicly Guaranteed Private Sector Debt |
(US$ billion) |
Country |
End-December 2008 |
End-March 2009 |
|
Short-term |
Long-term |
Total |
Short-term |
Long-term |
Total |
1 |
2 |
3 |
4 |
5 |
6 |
7 |
Chile |
2.9 |
9.3 |
12.1 |
1.8 |
10.3 |
12.1 |
Colombia |
0.6 |
28.9 |
29.4 |
0.5 |
30.0 |
30.5 |
Croatia |
0.3 |
14.2 |
14.6 |
0.3 |
13.2 |
13.5 |
India |
1.1 |
63.1 |
64.2 |
0.9 |
60.7 |
61.7 |
Kazakhstan |
- |
2.1 |
2.2 |
- |
2.1 |
2.1 |
Mexico |
2.7 |
126.5 |
129.1 |
2.7 |
97.7 |
100.4 |
Romania |
0.5 |
15.5 |
16.0 |
1.7 |
14.8 |
16.5 |
Thailand |
0.4 |
12.6 |
13.0 |
0.3 |
11.6 |
11.8 |
Note : Data in respect of India is partially revised – : Nil/Negligible.
Source : Quarterly External Debt Statistics, the World Bank and IMF. |
Table 17: Nature of Indebtedness of Top 20 Countries |
(Per cent) |
Country |
Concessional Debt to Total Debt |
PPG @ to Total Debt |
|
1980 |
1990 |
2000 |
2007 |
1980 |
1990 |
2000 |
2007 |
1 |
2 |
3 |
4 |
5 |
6 |
7 |
8 |
9 |
Argentina |
1.3 |
0.8 |
1.2 |
1.3 |
37.5 |
75.3 |
57.9 |
51.7 |
Brazil |
2.5 |
2.5 |
0.9 |
1.0 |
57.9 |
73.1 |
39.8 |
33.7 |
Chile |
5.6 |
1.9 |
1.0 |
0.4 |
38.9 |
54.2 |
14.1 |
16.0 |
China |
.. |
17.6 |
20.8 |
10.1 |
- |
82.3 |
65.1 |
23.5 |
Colombia |
14.2 |
5.7 |
2.8 |
2.1 |
58.9 |
85.2 |
61.3 |
61.6 |
Croatia |
.. |
.. |
2.5 |
2.1 |
- |
- |
49.1 |
29.3 |
India |
74.2 |
46.2 |
37.9 |
19.8 |
87.5 |
84.9 |
80.8 |
33.7 |
Indonesia |
36.4 |
26.5 |
21.1 |
26.2 |
71.7 |
68.7 |
48.3 |
48.8 |
Kazakhstan |
.. |
.. |
3.3 |
1.0 |
- |
- |
29.1 |
1.8 |
Malaysia |
8.6 |
14.6 |
7.0 |
6.1 |
60.6 |
75.6 |
45.9 |
34.3 |
Mexico |
0.5 |
0.8 |
0.8 |
0.6 |
59.1 |
72.7 |
54.0 |
59.2 |
Philippines |
5.5 |
20.0 |
21.5 |
20 |
36.5 |
78.6 |
57.9 |
57.6 |
Poland |
.. |
7.7 |
10.4 |
0.4 |
- |
79.5 |
45.9 |
22.3 |
Romania |
1.8 |
19.2 |
3.1 |
1.6 |
73.0 |
19.6 |
59.0 |
17.8 |
Russian Federation |
.. |
.. |
0.8 |
0.4 |
- |
- |
69.4 |
19.0 |
South Africa |
.. |
.. |
- |
- |
- |
- |
36.6 |
32.0 |
Thailand |
10.0 |
15.2 |
11.5 |
9.6 |
47.5 |
44.4 |
37.0 |
15.6 |
Turkey |
20.4 |
15.1 |
4.0 |
2.1 |
78.6 |
78.6 |
47.8 |
29.9 |
Ukraine |
.. |
.. |
18.5 |
2.2 |
- |
- |
66.8 |
14.4 |
Venezuela, RB |
0.2 |
0.3 |
0.2 |
0.5 |
36.2 |
73.9 |
65.4 |
63.7 |
@: Public and public guaranteed debt; .. : Not available; – : Nil/Negligible.
Note : The source data for India is Government of India and Reserve Bank of India. Therefore, the data for India pertain to financial year (April-March) and not calendar year.
Source : Global Development Finance Online Database, World Bank, Ministry of Finance, Government of India and Reserve Bank of India. |
In terms of other solvency indicators, the ratio of debt-service payments to exports of goods and services indicates the extent to which the export revenue is used in servicing its debt. The Latin American countries have very high debt service ratios, reflecting heavy burden of amortisation and interest payments. The ratio became very high for India in the early 1990s, when its external debt became unsustainable and the country faced a severe balance of payments crisis. The debt service ratio for India has steadily improved thereafter. During 2007, the ratio was placed at 4.8 per cent, the third lowest among top 20 debtor countries of the world. The ratio of average interest payments to export earnings indicates terms of external indebtedness and thus the debt burden. This ratio has declined for most of the top debtor countries during the period 1980-2007, indicating thereby, a reduction in the burden on interest payments (Table 19). The debt service ratio for India as at end-March 2009 worked out to 4.6 per cent though increased to 5.5 per cent as at end-June 2009.
Table 18: Debt to Current Receipts and National Income Ratio |
(Per cent) |
Country |
External Debt to Current Receipts@ |
External Debt to National Income Ratio |
1980 |
1990 |
2000 |
2007 |
1980 |
1990 |
2000 |
2007 |
1 |
2 |
3 |
4 |
5 |
6 |
7 |
8 |
9 |
Argentina |
242.4 |
373.7 |
363.7 |
174.4 |
35.6 |
46.0 |
50.9 |
49.7 |
Brazil |
306.6 |
324.9 |
348.5 |
119.4 |
31.5 |
26.6 |
38.5 |
18.7 |
Chile |
192.5 |
179.6 |
149.8 |
71.5 |
45.5 |
64.5 |
51.6 |
40.3 |
China |
.. |
91.4 |
49.8 |
26.0 |
.. |
15.4 |
12.3 |
11.6 |
Colombia |
117.1 |
181.0 |
184.2 |
110.9 |
20.9 |
45.1 |
37.0 |
22.5 |
Croatia |
.. |
.. |
130.6 |
176.6 |
.. |
.. |
69.3 |
97.7 |
India |
137.2 |
292.4 |
144.8 |
70.9 |
11.2 |
26.7 |
22.0 |
18.9 |
Indonesia |
.. |
233.9 |
194.3 |
100.6 |
28.0 |
64.0 |
93.6 |
33.9 |
Kazakhstan |
.. |
.. |
117.9 |
173.2 |
.. |
.. |
72.5 |
103.7 |
Malaysia |
44.6 |
44.4 |
36.6 |
24.9 |
27.5 |
36.4 |
48.6 |
29.4 |
Mexico |
232.4 |
191.4 |
78.4 |
55.4 |
30.5 |
41.1 |
26.6 |
17.7 |
Philippines |
212.4 |
230.1 |
118.5 |
85.8 |
54.0 |
69.4 |
72.3 |
41.9 |
Poland |
.. |
251.3 |
130.0 |
104.1 |
.. |
88.8 |
38.2 |
47.7 |
Romania |
80.3 |
17.4 |
89.7 |
140.2 |
.. |
3.0 |
30.4 |
51.5 |
Russian Federation |
.. |
.. |
134.1 |
83.9 |
.. |
.. |
63.2 |
29.4 |
South Africa |
.. |
.. |
62.9 |
45.0 |
.. |
.. |
19.2 |
15.8 |
Thailand |
96.8 |
89.8 |
92.7 |
33.7 |
25.9 |
33.3 |
66.0 |
26.5 |
Turkey |
333.1 |
196.1 |
202.2 |
165.7 |
29.8 |
23.5 |
44.4 |
38.8 |
Ukraine |
.. |
.. |
62.0 |
105.2 |
.. |
.. |
40.2 |
52.9 |
Venezuela, RB |
132.0 |
154.5 |
111.1 |
53.2 |
43.5 |
71.7 |
36.2 |
18.7 |
.. : Not available; @ : Current receipts include exports of goods and services (including workers’ remittances)
Note: In this Table, the source of data for India is Government of India and Reserve Bank of India. Therefore, the data for India since 1990 onwards pertain to financial year (April-March) and not calendar year.
Source: Global Development Finance Online Database, World Bank, Ministry of Finance, Government of India and Reserve Bank of India. |
The ratio of short term debt to total outstanding debt and the ratio of short term debt to international reserves are the two most common indicators of liquidity. It is worth noting that the share of short-term debt to total debt as also short-term debt to reserves were at modest levels for India when compared with the top 20 debtor countries of the world (Table 20). In terms of the ratio of short term external debt to Gross National Product (GNP), India’s position was fourth lowest among the top 20 debtor countries of the world.
The Quarterly External Debt Statistics (QEDS) database, jointly developed by the World Bank and the International Monetary Fund, brings out detailed external debt data of countries that are subscribing to IMF’s Special Data Dissemination Standard/ General Data Dissemination System. The position in respect of the 63 reporting countries for the fourth quarter of the calendar year 2008 and the first quarter of the calendar year 2009, which has been published by the World Bank http://go.worldbank.org/ 6V603CE490 is given at Annex I.
Table 19: Solvency Indicators : Debt and Interest Service Ratio |
(Per cent) |
Country |
Debt Service Ratio |
Interest Service Ratio |
|
1980 |
1990 |
2000 |
2007 |
1980 |
1990 |
2000 |
2007 |
1 |
2 |
3 |
4 |
5 |
6 |
7 |
8 |
9 |
Argentina |
37.3 |
37.0 |
69.3 |
13.0 |
20.8 |
16.3 |
28.8 |
6.1 |
Brazil |
63.3 |
22.1 |
93.5 |
27.8 |
33.9 |
6.1 |
24.7 |
7.5 |
Chile |
43.1 |
25.9 |
24.8 |
14.2 |
19.0 |
16.7 |
9.0 |
2.9 |
China |
.. |
11.7 |
9.3 |
2.2 |
.. |
5.4 |
2.4 |
0.8 |
Colombia |
16.0 |
40.9 |
27.7 |
22.0 |
11.6 |
17.9 |
12.0 |
7.6 |
Croatia |
.. |
.. |
31.9 |
33.0 |
.. |
.. |
6.3 |
5.8 |
India |
9.4 |
31.9 |
14.5 |
4.8 |
4.3 |
18.7 |
5.6 |
2.1 |
Indonesia |
.. |
33.3 |
22.4 |
10.5 |
.. |
13.3 |
9.9 |
3.6 |
Kazakhstan |
.. |
.. |
32.0 |
49.6 |
.. |
.. |
7.4 |
7.1 |
Malaysia |
6.3 |
12.6 |
5.6 |
4.6 |
4.0 |
3.4 |
2.0 |
1.0 |
Mexico |
44.4 |
20.7 |
30.4 |
12.5 |
24.6 |
13.4 |
7.3 |
3.7 |
Philippines |
26.6 |
27.0 |
14.3 |
13.7 |
18.2 |
13.3 |
6.1 |
5.4 |
Poland |
.. |
4.9 |
20.4 |
25.6 |
.. |
1.7 |
5.0 |
3.5 |
Romania |
12.6 |
0.3 |
20.1 |
19.1 |
4.9 |
0.2 |
5.6 |
5.4 |
Russian Federation |
.. |
.. |
9.9 |
9.1 |
.. |
.. |
4.7 |
3.6 |
South Africa |
.. |
.. |
9.8 |
5.9 |
.. |
.. |
3.2 |
2.0 |
South Asia |
11.2 |
27.5 |
14.6 |
12.9 |
4.9 |
14.7 |
5.3 |
2.8 |
Thailand |
18.9 |
16.9 |
16.3 |
8.1 |
9.5 |
6.5 |
5.6 |
0.9 |
Turkey |
28.0 |
29.4 |
35.9 |
32.1 |
14.9 |
13.5 |
11.9 |
7.9 |
Ukraine |
.. |
.. |
18.6 |
16.9 |
.. |
.. |
3.6 |
4.3 |
Venezuela, RB |
27.2 |
23.3 |
16.7 |
7.4 |
13.8 |
15.1 |
7.7 |
3.7 |
.. : Not available.
Note: The source data for India is Government of India and Reserve Bank of India. Therefore, the data for India pertain to financial year (April-March) and not calendar year.
Source: Global Development Finance Online Database, World Bank, Ministry of Finance, Government of India and Reserve Bank of India. |
Section III
Impact of Global Slowdown on India’s External Debt The tightening of global credit market conditions led to a decline in debt inflows to EMEs and also impacted India, particularly through ECB and trade credit flows during 2008-09. According to the IMF, private capital flows to emerging and developing countries in 2008 declined significantly to US$ 109 billion from US$ 618 billion in 2007. According to the Global Development Finance 2009, net private debt and equity flows to developing countries are projected to decline from a record high of 8.6 percent of GDP in 2007 to just over 2 percent in 2009, exceeding the peak-to-trough drop during the Latin American debt crisis in the early 1980s (3.3 percentage points) and the combined East Asian and Russian crises of the late 1990s (2.4 percentage points). Unlike in these past crises, however, the decline in inflows has hit every developing region. The most affected region is emerging Europe and Central Asia, which also experienced the largest expansion of inflows between 2002 and 2007. Net private inflows to the region were an estimated 6.4 percent of GDP in 2008, down from 15.1 percent in 2007 (Table 21).
Table 20: Short -Term Debt Indicators |
(Per cent) |
Country |
Short -Term Debt to
Total Debt |
Short -Term Debt to
Reserves |
Short-Term Debt to
GNP |
|
1990 |
2000 |
2007 |
1990 |
2000 |
2007 |
1990 |
2000 |
2007 |
1 |
3 |
4 |
5 |
7 |
8 |
9 |
10 |
11 |
12 |
Argentina |
16.8 |
20.1 |
29.8 |
168.3 |
112.6 |
82.5 |
7.7 |
10.2 |
14.8 |
Brazil |
19.8 |
12.8 |
16.5 |
257.8 |
93.8 |
21.8 |
5.3 |
4.9 |
3.1 |
Chile |
17.6 |
16.6 |
22.7 |
49.9 |
41.0 |
79.0 |
11.3 |
8.5 |
9.1 |
China |
16.8 |
9.0 |
54.5 |
27.0 |
7.6 |
13.2 |
2.6 |
1.1 |
6.3 |
Colombia |
8.4 |
8.5 |
11.9 |
29.5 |
31.9 |
25.5 |
3.8 |
3.1 |
2.7 |
Croatia |
.. |
7.6 |
10.5 |
- |
26.7 |
37.3 |
- |
5.3 |
10.3 |
India |
10.2 |
3.6 |
20.5 |
146.5 |
8.6 |
14.8 |
2.9 |
0.8 |
3.9 |
Indonesia |
15.9 |
15.7 |
24.8 |
128.6 |
77.1 |
61.4 |
10.2 |
14.7 |
8.4 |
Kazakhstan |
.. |
7.7 |
12.2 |
0.0 |
45.8 |
66.6 |
- |
5.6 |
12.7 |
Malaysia |
12.4 |
10.9 |
28.4 |
17.9 |
16.0 |
15.0 |
4.5 |
5.3 |
8.3 |
Mexico |
15.4 |
12.5 |
5.1 |
157.4 |
53.2 |
10.3 |
6.3 |
3.3 |
0.9 |
Philippines |
14.5 |
9.4 |
10.8 |
217.4 |
36.5 |
21.0 |
10 |
6.8 |
4.5 |
Poland |
19.4 |
14.9 |
30.9 |
205.3 |
35.2 |
91.8 |
17.3 |
5.7 |
14.7 |
Romania |
79.8 |
6.8 |
35.7 |
66.2 |
22.5 |
76.3 |
2.4 |
2.1 |
18.4 |
Russian Federation |
.. |
9.8 |
21.4 |
- |
56.5 |
16.6 |
- |
6.2 |
6.3 |
South Africa |
.. |
38.4 |
38.2 |
- |
124.0 |
50.3 |
- |
7.4 |
6.0 |
Thailand |
29.6 |
18.7 |
34.3 |
58.4 |
45.6 |
24.7 |
9.9 |
12.3 |
9.1 |
Turkey |
19.2 |
24.8 |
16.6 |
124.6 |
123.0 |
54.6 |
4.5 |
11.0 |
6.4 |
Ukraine |
.. |
3.7 |
31.1 |
- |
30.3 |
70.5 |
- |
1.5 |
16.5 |
Venezuela, RB |
6.0 |
19.5 |
27.1 |
15.7 |
51.5 |
34.7 |
4.3 |
7.1 |
5.1 |
.. Not available. – : Nil/Negligible.
Note: The source data for India is Government of India and Reserve Bank of India. Therefore, the data for India pertain to financial year (April-March) and not calendar year. Source: Global Development Finance Online Database, World Bank, Ministry of Finance, Government of India and Reserve Bank of India. |
However, according to the World Economic Outlook update and Global Financial Stability Report (July 2009), the return of risk appetite, resumption of portfolio inflows, decline in global sovereign spreads etc., indicate that emerging market sentiment has strengthened. Nevertheless, the overall outlook for emerging markets remains vulnerable to lower than expected global growth and constrained international bank lending.
Net capital flows in India declined to US$ 9.1 billion in 2008-09 as compared to US$ 108.0 billion during 2007-08. There was significant reduction in the debt creating inflows for during 2008-09 as compared to 2007-08 as compared to the non-debt creating inflows (Table 22). Among debt creating inflows, net flows under ECBs showed a significant decline while short-term trade credit showed a net outflow of US$ 5.8 billion as compared to a net inflow of US$ 17.2 billion during 2007-08.
However, there was a turnaround in the flows under the NRI deposit schemes as reflected in significant rise in inflow during 2008-09, responding to the hikes in the ceiling interest rates on NRI deposit schemes by the Reserve Bank (Table 23). During 2009-10 so far (up to August 2009), net inflows under NRI deposits amounted to US$ 2.4 billion as compared to US$ 0.3 billion during the corresponding period of the previous year. With deepening of the financial crisis in September 2008, the ceiling interest rates on NRI deposits were revised upwards thrice in order to encourage inflows.
Table 21: Net Capital Inflows to Developing Countries |
(US$ billion) |
|
2001 |
2002 |
2003 |
2004 |
2005 |
2006 |
2007 |
2008 E |
1 |
2 |
3 |
4 |
5 |
6 |
7 |
8 |
9 |
Net private inflows (A+B) |
197.3 |
156.8 |
269.1 |
396.5 |
569.7 |
739.2 |
1157.5 |
706.9 |
A. |
Net non-debt inflows |
172.3 |
161.5 |
181.0 |
254.7 |
347.2 |
462.7 |
658.6 |
599.0 |
|
(i) FDI inflows |
166.0 |
152.5 |
155.5 |
216.0 |
279.1 |
358.4 |
520.0 |
583 |
|
(ii) Portfolio inflows |
6.3 |
9.0 |
25.5 |
38.7 |
68.1 |
104.3 |
138.6 |
15.7 |
B. |
Net debt flows Of which |
25.0 |
-4.7 |
88.1 |
141.8 |
222.5 |
276.5 |
498.9 |
107.9 |
Short term debt |
22.9 |
-5.4 |
61.5 |
68.5 |
86.6 |
110.1 |
202.5 |
-16.3 |
Memo: |
|
|
|
|
|
|
|
|
Net Debt Official flows |
26.9 |
5.6 |
-10.5 |
-25.8 |
-71.0 |
-70.9 |
0.2 |
20.4 |
E: Estimate;
Source: Global Development Finance 2009, World Bank Debtor Reporting System and Staff Estimates |
The financial crisis severely affected the access to trade finance for EMEs along with the widened spread and modalities. According to the World Economic Outlook (April 2009), the spreads on trade finance increased from 100-150 basis points to around 400 basis points over LIBOR with intensifying counterparty risks. As a result of difficult financing conditions prevailing in the international credit markets and increased risk aversion by the lending counterparties, gross disbursement of short-term trade credit to India was lower during 2008-09 as compared to the previous year. Repayments of short-term trade credit, however, increased significantly during 2008-09 mainly on account of problems in rollover observed in the second half of 2008-09. During 2008-09, the external assistance received by India was, however, higher than the previous year as these are not pro-cyclical. Further, the grants and loans extended by India to other countries did not show significant decline (Table 24).
Table 22: Composition of Capital Flows (Net) |
(US$ million) |
|
2004-05 |
2005-06 |
2006-07 |
2007-08 PR |
2008-09 P |
1 |
2 |
3 |
4 |
5 |
6 |
Net Capital Flows |
28,022 |
25,470 |
45,203 |
107,993 |
9,146 |
1. Non-Debt Creating Flows |
15,298 |
21,395 |
29,743 |
63,630 |
21,127 |
(i) Foreign Direct Investment |
5,987 |
8,901 |
22,739 |
34,236 |
34,982 |
(ii) Foreign Portfolio Investment |
9,311 |
12,494 |
7,004 |
29,394 |
-13,855 |
2. Debt Creating Flows |
9,864 |
10,441 |
29,001 |
42,024 |
7,978 |
(i) External Assistance |
2,027 |
1,766 |
1,787 |
2,118 |
2,646 |
(ii) External Commercial Borrowings* |
5,426 |
2,759 |
16,443 |
22,665 |
6,938 |
(iii) Short-term Credits |
3,792 |
3,699 |
6,612 |
17,183 |
-5,795 |
(iv) NRI Deposits # |
-964 |
2,789 |
4,321 |
179 |
4,290 |
(v) Rupee Debt Service |
-417 |
-572 |
-162 |
-121 |
-101 |
3. Other Capital @ |
2,860 |
-6,366 |
-13,541 |
2,339 |
-19,959 |
P : Partially Revised. P: Provisional. *: Relates to medium and long term borrowings.
# : Including NR(NR) Rupee Deposits.
@ : Includes leads and lags in exports (difference between the custom and the banking channel data), Banking Capital (assets and liabilities of Banks excluding NRI deposits), investments and loans by Indian residents abroad and India’s subscription to international institutions and quota payments to IMF. |
Table 23: Balances under NRI Deposit Schemes |
(US$ million) |
Scheme |
Outstanding |
Net Inflows |
End-March |
End- August |
April-March |
April-August |
2008 |
2009 |
2009 |
2007-08 |
2008-09 |
2009-10 |
1 |
2 |
3 |
4 |
5 |
6 |
7 |
FCNR(B) |
14,168 |
13,211 |
14,078 |
-960 |
-957 |
866 |
NR(E)RA |
26,716 |
23,570 |
24,848 |
109 |
2,508 |
466 |
NRO |
2,788 |
4,773 |
5,999 |
1030 |
2,738 |
1,064 |
Total |
43,672 |
41,554 |
44,925 |
179 |
4,289 |
2,396 |
Table 24: India’s Grants and Loans to Foreign Governments |
(US $ million) |
Item |
2007-08 |
2008-09 |
Grant |
Loan |
Total |
Grant |
Loan |
Total |
1 |
2 |
3 |
4 |
5 |
6 |
7 |
A. |
Plan (External Affairs) |
63 |
12 |
75 |
73 |
25 |
98 |
B. |
Non-Plan (i+ii+iii) |
359 |
17 |
376 |
313 |
1 |
314 |
|
i. |
External Affairs |
349 |
- |
349 |
304 |
- |
304 |
|
|
Bangladesh |
15 |
- |
15 |
1 |
- |
1 |
|
|
Bhutan |
132 |
- |
132 |
121 |
- |
121 |
|
|
Nepal |
25 |
- |
25 |
22 |
- |
22 |
|
|
Aid to African |
|
|
|
|
|
|
|
|
countries |
12 |
- |
12 |
21 |
- |
21 |
|
|
Maldives |
5 |
- |
5 |
1 |
- |
1 |
|
|
Myanmar |
5 |
- |
5 |
7 |
- |
7 |
|
|
Sri Lanka |
7 |
- |
7 |
7 |
- |
7 |
|
|
Central Asia |
5 |
- |
5 |
4 |
- |
4 |
|
|
ITEC Programme |
15 |
- |
15 |
14 |
- |
14 |
|
|
Latin African |
|
|
|
|
|
|
|
|
Countries |
- |
- |
- |
- |
- |
- |
|
|
Afghanistan |
83 |
- |
83 |
74 |
- |
74 |
|
|
Other Developing |
|
|
|
|
|
|
|
|
Countries |
45 |
- |
45 |
31 |
- |
33 |
|
ii. |
Finance |
10 |
17 |
27 |
8 |
1 |
9 |
|
iii. |
Shipping |
1 |
0 |
1 |
1 |
- |
1 |
C. |
Grand Total (A+B) |
422 |
29 |
451 |
386 |
26 |
412 |
– : Nil/Negligible. |
Section IV
External Debt Management in India The external debt management policy of Government of India continues to focus on raising sovereign loans on concessional terms with longer maturities, regulating the levels of commercial borrowings and their end-use, rationalising the interest rates on Non-Resident Indian (NRI) deposits, monitoring short-term debt and encouraging non-debt creating capital flows. The improvement in India’s overall debt scenario since the early 1990s has been brought out by policy reforms comprising the management of current account deficit at a sustainable level and keeping the external debt within manageable limits with preference for equity as against debt capital flows and monitoring of short term debt. In the recent past, the impact of global financial crisis led to the tightening of the global credit flows to EMEs as also to India.
Recent Policy Developments
External Commercial Borrowings
The ECB proposals are approved within an overall annual ceiling fixed by the Ministry of Finance keeping in view of the sectoral requirements and outcome of balance of payments in the medium term. The cases falling under the approval route are considered by an empowered Committee of the RBI. The principal elements of policy for ECBs include keeping the maturities long, costs low and encouraging investments in infrastructure and export sectors. Taking into account the financing requirements of the corporate sector and prevailing liquidity conditions in the domestic and international financial markets, the Ministry of Finance, Government of India, in consultation with the Reserve Bank of India, regularly reviews the policy stance on External Commercial Borrowings (ECBs) and trade credits and introduce various policy measures in consistent with the debt management objectives. The Reserve Bank introduces various policy measures to attract NRI deposits keeping in view the prevailing macro-economic conditions in the country.
The policy developments relating to external commercial borrowings during 2008-09 indicated a move towards liberalisation in terms of expanding the list of eligible borrowers, easing all-in-cost ceilings, relaxations in end-use stipulations, etc. Keeping in view the higher financing costs on account of tightness in the global credit markets, the all-in-cost ceilings applicable to ECBs were raised in May 2008, September 2008, October 2008 and the requirement of all-in-cost ceiling was dispensed with under the Approval route till June 30, 2009, with the stipulation that eligible borrowers proposing to avail of ECB beyond the permissible all-in-cost ceilings should approach the Reserve Bank under the Approval route. The relaxation was further extended to December 31, 2009. The date for completing the entire procedure for buyback of FCCBs was also extended from March 31, 2009 to December 31, 2009. Keeping in view the benefits accruing to the Indian companies, it was decided to increase the total amount of permissible buyback of FCCBs, out of internal accruals, from USD 50 million of the redemption value per company to USD 100 million, under the approval route by linking the higher amount of buyback to larger discounts. Accordingly, Indian companies may henceforth be permitted to buyback FCCBs up to USD 100 million of the redemption value per company, out of internal accruals, with the prior approval of the Reserve Bank, subject to certain conditions.
Non Banking Finance Companies (NBFCs) exclusively involved in financing of the infrastructure sector were allowed to avail of ECBs from multilateral / regional financial institutions and Government owned development financial institutions for on-lending to the borrowers in the infrastructure sector under the Approval route. The condition that the direct lending portfolio of these lenders vis-à-vis the total ECB to NBFC at any point of time should not be less than 3:1, has been dispensed with.
Further, SEZ developers were permitted to avail of ECBs for providing infrastructure facilities within SEZ. However, ECB will not be permissible for development of integrated township and commercial real estate within SEZ. Corporates engaged in the development of integrated township were permitted to avail ECB under the Approval Route till December 31, 2009 (Box 1).
Non-Resident Deposits
There are three types of NRI deposits in operation at present - deposits under NonResident (external) Rupee Account [NR(E)RA], Foreign Currency Non-Resident (Bank) [FCNR (B)] and Non-Resident Ordinary [NRO] rupee deposits. The FCNR(B) scheme offers only term deposits. Under FCNR(B), short-term deposits with less than one-year maturity were withdrawn with effect from October 1999. With effect from July 27, 2005, the maximum maturity period under FCNR (B) deposits was extended from three years to five years and two more currencies, viz. the Canadian dollar and the Australian dollar were introduced under FCNR(B) deposits, besides the existing currencies of US dollar, euro, pound sterling and yen. The NR(E)RA scheme offers both savings and term deposits. In April 2003, the maturity period of NR(E)RA term deposits was also placed in the range of one to three years by withdrawing short-term deposits of less than one year maturity in line with FCNR(B) deposits.
The interest rates on NRI deposits, i.e. Non-Resident (External) Rupee Account [NR(E)RA] and Foreign Currency NonResident (Banks) [FCNR(B)] deposits are revised from time to time taking into account macroeconomic and monetary conditions. The ceiling interest rate on NR(E)RA and FCNR(B) deposits was reduced in January 2007 and April 2007. However, the ceiling interest rate on NR(E)RA and FCNR(B) deposits have been increased three times since September 2008 mainly to contain the volatility in the capital flows due to drying of liquidity in the overseas market (Table 25).
Trade Credits
Trade Credits’ refer to credits extended for imports directly by the overseas supplier, bank and financial institution for maturity of less than three years. Depending on the source of finance, such trade credits termed as suppliers’ credit or buyers’ credit. Suppliers’ credit relates to credit for imports into India extended by the overseas supplier,while buyers’ credit refers to loans for payment of imports in to India arranged by the importer from a bank or financial institution outside India. As per international convention, trade credits up to one year are included under short term trade credit, which includes buyers’ credit and suppliers’ credit. Since 2007-08, the suppliers’ credit for imports up to 180 days is also covered under short-term trade credit (Box 2).
Box 1: Chronology of Policy Developments since May 2008 |
Month |
External Commercial Borrowings (ECBs) |
1 |
2 |
May 2008 |
Borrowers in infrastructure sector may avail ECB up to USD 100 million for Rupee expenditure for permissible end-uses under the Approval Route. In respect of other borrowers the existing limit of USD 20 million for Rupee expenditure was enhanced to USD 50 million for Rupee expenditure for permissible end-uses under the Approval Route. The all-in-cost ceilings for ECB (for approval and automatic route) have been revised to Libor + 200 bps for average maturity of 3-5 years and Libor +350 for average maturity for more than 5 years. Similarly, the all-in-cost ceiling for trade credit has been enhanced to Libor + 75 bps (for up to 1 year) and Libor +125 bps (for 1-3 years) |
June 2008 |
Entities in the services sector, viz. hotels, hospitals and software companies were allowed to avail ECBs up to US $ 100 million per financial year, for the purpose of import of capital goods under the Approval Route. |
July 2008 |
AD Category - I banks were allowed to convey ‘no objection’ under the Foreign Exchange Management Act (FEMA), 1999 for creation of charge on immovable assets, financial securities and issue of corporate or personal guarantees in favor of overseas lender / security trustee, to secure the ECB to be raised by the borrower. |
September 2008 |
The issue of Foreign Currency Exchangeable Bonds by Indian companies has been operationalised.
The ECB limit of US $ 100 million was raised to US $ 500 million per financial year for the borrowers in the infrastructure sector for Rupee expenditure under the Approval Route. ECBs in excess of US $ 100 million for Rupee expenditure should have a minimum average maturity period of seven years. Further, the all-in-cost ceiling for ECBs for more than seven years was revised upwards from 350 basis points to 450 basis points. |
October 2008 |
a) On a review of the ECB policy and to promote the development of the mining,
exploration and refinery sectors in the country, it was decided to expand the
definition of infrastructure sector for the purpose of availing of ECB. Accordingly,
the Infrastructure sector would henceforth be defined as (i) power, (ii)
telecommunication, (iii) railways, (iv) road including bridges, (v) sea port and
airport (vi) industrial parks (vii) urban infrastructure (water supply, sanitation
and sewage projects) and (viii) mining, exploration and refining.
b) ECBs up to US $ 500 million per borrower per financial year were permitted for
rupee expenditure and/or foreign currency expenditure for permissible end-uses
under the automatic route. Accordingly, the requirement of minimum average
maturity period of seven years for ECB of more than USD 100 million for Rupee
capital expenditure by the borrowers in the infrastructure sector was dispensed
with. Further, the all-in-cost ceiling for ECBs of average maturity period of ‘three
years and up to five years’ was raised to 300 basis points, and over five years, to
500 basis points above 6-month LIBOR.
c) In order to further develop the telecom sector in the country, payment for obtaining license/permit for 3G Spectrum to be considered an eligible end-use for the purpose of ECB. |
Box 1: Chronology of Policy Developments since May 2008 (Contd.) |
Month |
External Commercial Borrowings (ECBs) |
1 |
2 |
|
d) Earlier, ECB proceeds were required to be parked overseas until actual requirement in India and such proceeds were permitted to be invested in the following liquid assets (a) deposits or certificate of deposit offered by banks rated not less than AA (-) by Standard and Poor / Fitch IBCA or Aa3 by Moody’s; (b) deposits with overseas branch of an AD bank in India; and (c) Treasury bills and other monetary instruments of one year maturity having minimum rating as indicated above. Henceforth the borrowers were extended the flexibility to either keep these funds off-shore as above or keep it with the overseas branches / subsidiaries of Indian banks abroad or to remit these funds to India for credit to their Rupee accounts with AD Category I banks in India, pending utilisation for permissible end- uses. However, as hitherto, the rupee funds will not be permitted to be used for investment in capital markets, real estate or for inter-corporate lending.
e) The all-in-cost ceiling for raising trade credit was revised to 200 basis points over 6 months LIBOR from the then prevailing ceiling of 75 basis points over 6 months LIBOR. |
November 2008 |
The Reserve Bank of India announced to consider proposals under approval route from Indian companies to prematurely buy back their FCCBs considering the benefits accruing to the Indian companies concerned and also to the economy, as these FCCBs were being traded at a discount. The buy-back should be financed by the company’s foreign currency resources held in India or abroad and/or out of fresh ECB raised in conformity with the prevailing norms for ECBs. Extension of FCCBs was also permitted at the current all-in cost for the relative maturity. |
December 2008 |
After a review of the existing policy on the premature buyback of FCCBs, it was decided to liberalise the procedure and consider applications for buyback of FCCBs by Indian companies, both under the automatic and approval routes. |
January 2009 |
The all-in-cost ceiling for ECBs through the approval route was dispensed with up to June 30, 2009.
In May, 2007, Reserve Bank had withdrawn the exemption accorded to the ‘development of integrated township’ as a permissible end-use of ECB. It was decided to permit corporates engaged in the development of integrated township to avail of ECB under the Approval Route, with a provision to review the policy in June 2009.
As per the extant ECB policy, Non-Banking Financial Companies (NBFCs) are permitted to avail of ECB for a minimum average maturity period of five years to finance import of infrastructure equipments for leasing to infrastructure projects in India. It was decided to allow NBFCs, which are exclusively involved in financing of the infrastructure sector, to avail of ECBs from multilateral / regional financial institutions and Government owned development financial institutions for on-lending to the borrowers in the infrastructure sector under the Approval route. While considering the applications, Reserve Bank will take into account the aggregate commitment of these lenders directly to infrastructure projects in India. The direct lending portfolio of the above lenders vis-à-vis their total ECB lending to NBFCs, at any point of time should not be less than 3:1. AD Category - I banks should obtain a certificate from the eligible lenders to this effect. |
Box 1: Chronology of Policy Developments since May 2008 (Concld.) |
Month |
External Commercial Borrowings (ECBs) |
1 |
2 |
|
At present, entities in the services sector viz. Hotels, Hospitals and Software sector are allowed to avail of ECB up to USD 100 million per financial year for import of capital goods, under the Approval route. It has now been decided to permit the corporates in the Hotels, Hospitals and Software sectors to avail of ECB up to USD 100 million per financial year, under the Automatic Route, for foreign currency and / or Rupee capital expenditure for permissible end-use. The proceeds of the ECBs should not be used for acquisition of land. |
March 2009 |
It was decided to extend the date for completing the entire procedure for buyback of FCCBs from March 31, 2009 to December 31, 2009. |
April 2009 |
The extant all-in-cost ceilings for ECBs were dispensed with up to June 30, 2009 subject to the condition that ECB proposals above the prescribed all-in-cost ceilings, irrespective of the amount of the borrowing, will come under the approval route. In view of the continuing tightness of credit spreads in the international markets the relaxation in all-in-cost ceilings has been extended until December 31, 2009.
Keeping in view the benefits accruing to the Indian companies, the current policy was reviewed and it was decided to increase the total amount of permissible buyback of FCCBs, out of internal accruals, from USD 50 million of the redemption value per company to USD 100 million, under the approval route by linking the higher amount of buyback to larger discounts. Accordingly, Indian companies may henceforth be permitted to buyback FCCBs up to USD 100 million of the redemption value per company, out of internal accruals, with the prior approval of the Reserve Bank, subject to certain conditions, viz.
i) minimum discount of 25 per cent of book value for redemption value up to USD 50 million;
ii) minimum discount of 35 per cent of book value for the redemption value over USD 50 million and up to USD 75 million; and
iii) minimum discount of 50 per cent of book value for the redemption value of USD 75 million and up to USD 100 million. |
June 2009 |
Non Banking Finance Companies (NBFCs) exclusively involved in financing of the infrastructure sector were allowed to avail of ECBs from multilateral / regional financial institutions and Government owned development financial institutions for on-lending to the borrowers in the infrastructure sector under the Approval route. The condition that the direct lending portfolio of these lenders vis-à-vis the total ECB to NBFC at any point of time should not be less than 3:1, has been dispensed with.
SEZ developers are permitted to avail of ECBs for providing infrastructure facilities (as defined in the extant ECB policy) within SEZ. However, ECB will not be permissible for development of integrated township and commercial real estate within SEZ.
Corporates engaged in the development of integrated township were permitted to avail ECB under the Approval Route till December 31, 2009. Corporates which have violated the extant ECB policy and are under investigation by the Reserve Bank and / or Directorate of Enforcement, are allowed to avail ECB only under the Approval route. |
Table 25: Ceiling Interest rates on NRI Deposits |
Period |
NR(E)RA deposits |
FCNR deposits |
1 |
2 |
3 |
|
(+ )/ (-) LIBOR/SWAP Rate |
April 24, 2007 |
LIBOR/SWAP rate |
-75 basis point |
September 16, 2008 |
+ 50 basis points |
- 25 basis points |
October 15, 2008 |
+ 100 basis points |
+ 25 basis points |
November 15, 2008 |
+ 175 basis points |
+ 100 basis points |
In October 2008, as the crisis in the global economy aggravated and there were tightness in liquidity abroad, the all-in-cost ceiling for raising trade credit was revised to 200 basis points over 6 months LIBOR from the then prevailing ceiling of 75 basis points over 6 months LIBOR. Section V
Sustainability of India’s External Debt An assessment of sustainability of external debt is generally undertaken based on the trends in certain key ratios such as debt to GDP ratio, debt service ratio, short-term debt to total debt and total debt to foreign exchange reserves. India has managed its external debt successfully as reflected in the perceptible improvement in various external debt sustainability indicators. India’s foreign exchange reserves provide a cover of 116.5 per cent to the external debt stock at the end of June 2009 as compared to 112.5 per cent at end-March 2009 (Chart 5).
Box 2: Short-term Trade Financing With the deepening of the global financial crisis, especially after the collapse of Lehman Brothers in September 2008, many international banks either did not allow rollover of the credit or canceled funded overdraft facilities without warning. With the banks becoming risk averse, they tend to shift their portfolios to more creditworthy borrowers, which are in a better position to serve longer-maturity loans. Banks have moved away from funded open-account facilities, which had become most common in recent years, to more traditional forms of trade finance as counterparty risk rose rapidly. Many exporters had restricted the credit they were willing to provide their customers as a result of reduced access to capital and heightened concerns about customer creditworthiness. According to the World Bank’ Global Development Finance 2009, these changes reflected the higher capital requirements that banks faced as the creditworthiness of recipients of trade credit was downgraded. Indeed, capital requirements for trade finance tripled under the Basel II Accords over Basel I. Spreads had reportedly increased from 100 to 150 bps to around 400 bps over LIBOR as country risk and counterparty concerns intensify, with much higher spreads reported in some cases.
According to the IMF, the combination of higher cost of funds, liquidity premiums and higher risk resulted in a sharp increase in the price of short-term trade finance. Viewing that the higher cost along with declining availability of finance had the potential to undermine the efforts undertaken to stimulate domestic economies, co-ordinated initiatives globally to support trade finance were announced. For instance, the G-20 agreed to ensure availability of at least US$ 250 billion over the next two years to support trade finance.
Although the increase in costs of trade finance is global, the decline in availability of trade credit has been felt more by the emerging market economies (EMEs), especially the Asian EMEs. According to a survey by the IMF-Bankers’ Association for Finance and Trade (BAFT) on the bank-intermediated forms of international trade finance, the price of trade finance increased sharply due to increased cost of funds to the banks, which outweighed the dampening price effect of less restrictive monetary policies in many advanced economies. The trade finance problem is also sector-specific, apart from being country/region specific. India has been relatively less affected by the liquidity squeeze in international credit markets. Despite tightness in the overseas markets since September 2008, the disbursement of short-term credit to India has hovered around its monthly trend of over US$ 3 billion in the subsequent months. This is indicative of the confidence enjoyed by the Indian importers in the international financial markets. The various policy initiatives taken in this regard, such as hike in the all-in-cost ceiling for raising trade credit, enhancement of limit on overseas borrowings by banks, extending the line of credit as well as swap facility to the EXIM Bank, etc. , have also helped in easing the pressure on trade financing.
Spreads on corporate bonds issued in emerging markets, which remained high during the second half of 2008, have eased somewhat recently still much higher than the pre-crisis level (Chart ).
The ratio of external debt to GDP has declined to 21.4 per cent as at end-March 2009 from 28.7 per cent as at end-March 1991. The debt service ratio declined steadily during the last three years and stood at 4.6 per cent as at end-March 2009. The debt service ratio for April-June 2009 worked out to 5.5 per cent. The share of concessional debt in total external debt increased marginally to 19.0 per cent as at end-June 2009 from 18.7 per cent at end-March 2009. The ratio of short-term debt to foreign exchange reserves at 15.3 per cent as at end-June 2009 was lower compared to 17.3 per cent as at end-March 2009. The ratio of short-term to total debt declined to 17.8 per cent at end-June 2009 from 19.5 per cent at end-March 2009 (Table 26).
Table 26: India’s Key External Debt Indicators |
Year |
External Debt |
Ratio of
External
Debt to
GDP |
Debt
Service
Ratio |
Ratio of
Foreign
Exchange
Reserves to
Total Debt |
Ratio of
Concessional
Debt to
Total Debt |
Ratio of
Short-Term
Debt to
Foreign
Exchange
Reserves |
Ratio of
Short- Term
Debt to
Total Debt |
|
(US $ billion) |
(%) |
(%) |
(%) |
(%) |
(%) |
(%) |
1 |
2 |
3 |
4 |
5 |
6 |
7 |
8 |
1990-91 |
83.8 |
28.7 |
35.3 |
7.0 |
45.9 |
146.5 |
10.2 |
1995-96 |
93.7 |
27.0 |
26.2 |
23.1 |
44.7 |
23.2 |
5.4 |
2000-01 |
101.3 |
22.5 |
16.6 |
41.7 |
35.4 |
8.6 |
3.6 |
2001-02 |
98.8 |
21.1 |
13.7 |
54.7 |
35.9 |
5.1 |
2.8 |
2002-03 |
104.9 |
20.3 |
16.0* |
72.5 |
36.8 |
6.1 |
4.5 |
2003-04 |
111.6 |
17.8 |
16.1 ** |
101.2 |
36.1 |
3.9 |
4.0 |
2004-05 |
133.0 |
18.5 |
5.9 ^ |
106.4 |
30.9 |
12.5 |
13.3 |
2005-06 |
138.1 |
17.2 |
10.1 # |
109.8 |
28.6 |
12.9 |
14.1 |
2006-07 |
171.3 |
18.1 |
4.7 |
116.2 |
23.1 |
14.1 |
16.4 |
2007-08 |
223.3 |
18.9 |
4.8 |
138.7 |
19.8 |
14.8 |
20.5 |
2008-09 |
224.0 |
21.4 |
4.6 |
112.5 |
18.7 |
17.3 |
19.5 |
End-June 2009 |
227.7 |
.. |
5.5 |
116.5 |
19.0 |
15.3 |
17.8 |
* : Works out to 12.4 %, with the exclusion of prepayment of external debt of US $ 3,430 million
** : Works out to 8.2 % with the exclusion of pre payment of external debt of US $ 3,797 million and redemption of RIBs of US $ 5,549 million.
^ : Works out to 5.7 % with the exclusion of pre payment of external debt of US $ 381 million.
# : Works out to 6.3 % with the exclusion of IMD repayments of US $ 7.1 billion and pre payment of external debt of US $ 23.5 million.
Source: Ministry of Finance, Government of India and Reserve Bank of India. |
Statement 1 : India’s External Debt Outstanding |
(Rs. crore) |
Item |
Mar-08 |
Jun-08 |
Sep- 08 |
Dec-08 |
Mar-09 PR |
Jun-09 P |
1 |
2 |
3 |
4 |
5 |
6 |
7 |
I. |
Multilateral |
157,901 |
170,269 |
182,594 |
193,297 |
201,425 |
197,437 |
|
A. |
Government borrowing |
144,627 |
155,456 |
165,771 |
175,056 |
181,997 |
177,451 |
|
|
i) |
Concessional |
107,395 |
114,576 |
120,061 |
123,851 |
127,771 |
124,045 |
|
|
|
a) IDA |
105,947 |
113,042 |
118,450 |
122,245 |
126,127 |
122,428 |
|
|
|
b) Others # |
1,448 |
1,534 |
1,611 |
1,606 |
1,644 |
1,617 |
|
|
ii) |
Non-concessional |
37,232 |
40,880 |
45,710 |
51,205 |
54,226 |
53,406 |
|
|
|
a) IBRD |
22,630 |
24,549 |
26,820 |
28,583 |
29,948 |
29,304 |
|
|
|
b) Others ## |
14,601 |
16,332 |
18,890 |
22,622 |
24,278 |
24,101 |
|
B. |
Non-Government borrowing |
13,274 |
14,813 |
16,823 |
18,240 |
19,428 |
19,986 |
|
|
i) |
Concessional |
- |
- |
- |
- |
- |
- |
|
|
ii) |
Non-concessional |
13,274 |
14,813 |
16,823 |
18,240 |
19,428 |
19,986 |
|
|
|
a) Public sector |
10,352 |
11,449 |
12,693 |
13,855 |
14,298 |
14,323 |
|
|
|
IBRD |
4,690 |
5,390 |
5,993 |
6,773 |
7,106 |
7,302 |
|
|
|
Others ## |
5,662 |
6,060 |
6,699 |
7,082 |
7,193 |
7,021 |
|
|
|
b) Financial institutions |
2,350 |
2,781 |
3,130 |
3,335 |
3,721 |
3,797 |
|
|
|
IBRD |
593 |
647 |
700 |
729 |
744 |
715 |
|
|
|
Others ## |
1,757 |
2,133 |
2,430 |
2,607 |
2,977 |
3,083 |
|
|
|
c) Private sector |
572 |
583 |
1,000 |
1,050 |
1,409 |
1,866 |
IBRD |
- |
- |
- |
- |
- |
- |
|
|
|
Others |
572 |
583 |
1,000 |
1,050 |
1,409 |
1,866 |
II. |
Bilateral |
78,776 |
80,422 |
88,222 |
103,378 |
104,974 |
102,546 |
|
A. |
Government borrowing |
59,391 |
59,413 |
64,903 |
75,687 |
74,662 |
72,630 |
|
|
i) |
Concessional |
59,391 |
59,413 |
64,903 |
75,687 |
74,662 |
72,630 |
|
|
ii) |
Non-concessional |
- |
- |
- |
- |
- |
- |
|
B. |
Non-Government borrowing |
19,385 |
21,009 |
23,319 |
27,691 |
30,312 |
29,916 |
|
|
i) |
Concessional |
1,737 |
1,852 |
1,897 |
1,951 |
3,262 |
3,300 |
|
|
|
a) Public sector |
1,226 |
1,262 |
1,293 |
1,289 |
1,156 |
1,138 |
|
|
|
b) Financial institutions |
511 |
590 |
604 |
662 |
2,106 |
2,161 |
|
|
|
c) Private sector |
- |
- |
- |
- |
- |
- |
|
|
ii) |
Non-concessional |
17,648 |
19,157 |
21,422 |
25,740 |
27,050 |
26,617 |
|
|
|
a) Public sector |
10,097 |
11,135 |
12,285 |
14,580 |
15,076 |
14,391 |
|
|
|
b) Financial institutions |
3,735 |
3,820 |
3,930 |
4,238 |
4,312 |
4,143 |
|
|
|
c) Private sector |
3,816 |
4,202 |
5,207 |
6,922 |
7,662 |
8,083 |
III. |
International Monetary Fund |
- |
- |
- |
- |
- |
- |
IV. |
Trade Credit |
41,413 |
47,373 |
56,869 |
67,030 |
74,508 |
72,081 |
|
a) |
Buyers’ credit |
33,115 |
38,965 |
47,811 |
56,916 |
64,337 |
62,364 |
|
b) |
Suppliers’ credit |
3,134 |
3,242 |
3,414 |
3,532 |
3,678 |
3,402 |
|
c) |
Export credit component of bilateral credit |
5,164 |
5,166 |
5,644 |
6,581 |
6,492 |
6,316 |
|
d) |
Export credit for defence purposes |
- |
- |
- |
- |
- |
- |
Statement 1 : India’s External Debt Outstanding (Concld.) |
(Rs. crore) |
Item |
Mar-08 |
Jun-08 |
Sep- 08 |
Dec-08 |
Mar-09 PR |
Jun-09 P |
1 |
2 |
3 |
4 |
5 |
6 |
7 |
V. |
Commercial Borrowing |
249,255 |
262,243 |
284,958 |
318,039 |
318,446 |
302,378 |
|
a) |
Commercial bank loans |
160,844 |
171,992 |
184,478 |
213,356 |
220,251 |
209,489 |
|
b) |
Securitized borrowings $ (including FCCBs) |
82,376 |
83,959 |
93,848 |
97,865 |
91,166 |
86,443 |
|
c) |
Loans/securitized borrowings, etc. with multilateral/bilateral guarantee and IFC(W) |
6,035 |
6,292 |
6,633 |
6,819 |
7,029 |
6,446 |
|
d) |
Self Liquidating Loans |
- |
- |
- |
- |
- |
- |
VI. |
NRI Deposits |
174,623 |
183,019 |
190,660 |
195,254 |
210,118 |
216,229 |
|
(above one-year maturity) |
|
|
|
|
|
|
|
a) |
NR(E)RA |
106,824 |
109,888 |
112,081 |
112,542 |
119,181 |
121,030 |
|
b) |
FCNR(B) |
56,651 |
60,134 |
63,381 |
62,681 |
66,803 |
67,975 |
|
c) |
NRO Deposits |
11,148 |
12,997 |
15,198 |
20,031 |
24,134 |
27,224 |
VII |
.Rupee Debt * |
8,063 |
8,015 |
8,011 |
8,006 |
7,779 |
7,696 |
|
a) |
Defence |
7,170 |
7,148 |
7,146 |
7,141 |
6,954 |
6,897 |
|
b) |
Civilian + |
893 |
867 |
865 |
865 |
825 |
799 |
VII |
I. Short-term Debt |
182,881 |
211,875 |
237,376 |
224,335 |
222,100 |
194,588 |
|
a) |
Trade Related credits |
167,540 |
198,731 |
219,688 |
206,352 |
204,789 |
177,695 |
|
|
1) Above 180 days |
91,502 |
104,630 |
122,988 |
119,015 |
118,936 |
114,346 |
|
|
2) Upto 180 days |
76,038 |
94,101 |
96,700 |
87,337 |
85,853 |
63,349 |
|
b) |
FII investment in Government |
|
|
|
|
|
|
|
|
T-Bills and other instruments |
2,603 |
2,905 |
7,922 |
10,812 |
10,522 |
10,289 |
|
c) |
Investment in Treasury Bills by |
|
|
|
|
|
|
|
|
foreign central banks and |
|
|
|
|
|
|
|
|
international Institutions etc. |
620 |
641 |
582 |
529 |
534 |
498 |
|
d) |
External Debt Liabilities of : |
12,118 |
9,598 |
9,184 |
6,642 |
6,254 |
6,106 |
|
|
1) Central Banks |
4,458 |
4,188 |
4,108 |
3,752 |
3,892 |
3,681 |
|
|
2) Commercial Banks |
7,660 |
5,410 |
5,076 |
2,890 |
2,362 |
2,425 |
IX. |
Gross Total |
892,912 |
963,217 |
1,048,690 |
1,109,339 |
1,139,350 |
1,092,955 |
Memo Items |
|
|
A. |
Total Long-term Debt |
710,031 |
751,341 |
811,314 |
885,004 |
917,250 |
898,367 |
B. |
Short-term Debt |
182,881 |
211,875 |
237,376 |
224,335 |
222,100 |
194,588 |
|
Concessional Debt |
176,586 |
183,856 |
194,872 |
209,495 |
213,474 |
207,671 |
|
As % of Total Debt |
19.8 |
19.1 |
18.6 |
18.9 |
18.7 |
19.0 |
|
Short Term Debt |
182,881 |
211,875 |
237,376 |
224,335 |
222,100 |
194,588 |
|
As % of Total Debt |
20.5 |
22.0 |
22.6 |
20.2 |
19.5 |
17.8 |
P : Provisional; PR : Partially Revised. – : Nil.
# Refers to debt outstanding to Institutions like IFAD, OPEC & EEC(SAC) .
## Refers to debt outstanding against loans from ADB.
$ Includes net investment by 100 per cent FII debt funds.
* Debt denominated in Rupees and payable in exports.
+ Includes Rupee suppliers’ credit from end-March 1990 onwards.
Notes : Multilateral loans do not include revaluation of IBRD pooled loans and exchange rate adjustment under IDA loans for Pre-1971 credits. |
Statement 2 : India’s External Debt Outstanding |
(US $ million) |
Item |
Mar-08 |
Jun-08 |
Sep- 08 |
Dec-08 |
Mar-09 PR |
Jun-09 P |
1 |
2 |
3 |
4 |
5 |
6 |
7 |
I. |
Multilateral |
39,490 |
39,644 |
38,903 |
39,892 |
39,538 |
41,236 |
|
A. |
Government borrowing |
36,171 |
36,194 |
35,319 |
36,128 |
35,724 |
37,062 |
|
|
i) |
Concessional |
26,859 |
26,676 |
25,580 |
25,560 |
25,080 |
25,908 |
|
|
|
a) IDA |
26,497 |
26,319 |
25,237 |
25,229 |
24,758 |
25,570 |
|
|
|
b) Others # |
362 |
357 |
343 |
331 |
323 |
338 |
|
|
ii) |
Non-concessional |
9,312 |
9,518 |
9,739 |
10,568 |
10,644 |
11,154 |
|
|
|
a) IBRD |
5,660 |
5,716 |
5,714 |
5,899 |
5,878 |
6,120 |
|
|
|
b) Others ## |
3,652 |
3,802 |
4,025 |
4,669 |
4,766 |
5,034 |
|
B. |
Non-Government borrowing |
3,319 |
3,450 |
3,584 |
3,764 |
3,813 |
4,174 |
|
|
i) |
Concessional |
- |
- |
- |
- |
- |
- |
|
|
ii) |
Non-concessional |
3,319 |
3,450 |
3,584 |
3,764 |
3,813 |
4,174 |
|
|
|
a) Public sector |
2,589 |
2,666 |
2,704 |
2,859 |
2,807 |
2,991 |
|
|
|
IBRD |
1,173 |
1,255 |
1,277 |
1,398 |
1,395 |
1,525 |
|
|
|
Others ## |
1,416 |
1,411 |
1,427 |
1,461 |
1,412 |
1,466 |
|
|
|
b) Financial institutions |
587 |
648 |
667 |
688 |
730 |
793 |
|
|
|
IBRD |
148 |
151 |
149 |
150 |
146 |
149 |
|
|
|
Others ## |
439 |
497 |
518 |
538 |
584 |
644 |
|
|
|
c) Private sector |
143 |
136 |
213 |
217 |
277 |
390 |
|
|
|
IBRD |
- |
- |
- |
- |
- |
- |
|
|
|
Others |
143 |
136 |
213 |
217 |
277 |
390 |
II. |
Bilateral |
19,701 |
18,724 |
18,795 |
21,336 |
20,605 |
21,417 |
|
A. |
Government borrowing |
14,853 |
13,833 |
13,828 |
15,620 |
14,655 |
15,169 |
|
|
i) |
Concessional |
14,853 |
13,833 |
13,828 |
15,620 |
14,655 |
15,169 |
|
|
ii) |
Non-concessional |
- |
- |
- |
- |
- |
- |
|
B. |
Non-Government borrowing |
4,848 |
4,891 |
4,967 |
5,716 |
5,950 |
6,248 |
|
|
i) |
Concessional |
435 |
431 |
404 |
403 |
640 |
689 |
|
|
|
a) Public sector |
307 |
294 |
275 |
266 |
227 |
238 |
|
|
|
b) Financial institutions |
128 |
137 |
129 |
137 |
413 |
451 |
|
|
|
c) Private sector |
- |
- |
- |
- |
- |
- |
|
|
ii) |
Non-concessional |
4,413 |
4,460 |
4,563 |
5,313 |
5,310 |
5,559 |
|
|
|
a) Public sector |
2,525 |
2,593 |
2,617 |
3,009 |
2,959 |
3,006 |
|
|
|
b) Financial institutions |
934 |
889 |
837 |
875 |
846 |
865 |
|
|
|
c) Private sector |
954 |
978 |
1,109 |
1,429 |
1,504 |
1,688 |
III. |
International Monetary Fund |
- |
- |
- |
- |
- |
- |
IV. |
Trade Credit |
10,358 |
11,030 |
12,116 |
13,833 |
14,625 |
15,054 |
|
a) |
Buyers’ credit |
8,282 |
9,072 |
10,187 |
11,746 |
12,629 |
13,025 |
|
b) |
Suppliers’ credit |
784 |
755 |
727 |
729 |
722 |
710 |
|
c) |
Export credit component of bilateral credit |
1,292 |
1,203 |
1,202 |
1,358 |
1,274 |
1,319 |
|
d) |
Export credit for defence purposes |
- |
- |
- |
- |
- |
- |
Statement 2 : India’s External Debt Outstanding (Concld.) |
(US $ million) |
Item |
Mar-08 |
Jun-08 |
Sep- 08 |
Dec-08 |
Mar-09 PR |
Jun-09 P |
1 |
2 |
3 |
4 |
5 |
6 |
7 |
V. |
Commercial Borrowing |
62,337 |
61,058 |
60,713 |
65,636 |
62,508 |
63,153 |
|
a) |
Commercial bank loans |
40,226 |
40,045 |
39,305 |
44,032 |
43,233 |
43,753 |
|
b) |
Securitized borrowings $ (including FCCBs) |
20,602 |
19,548 |
19,995 |
20,197 |
17,895 |
18,054 |
|
c) |
Loans/securitized borrowings, etc. with multilateral/bilateral guarantee and IFC(W) |
1,509 |
1,465 |
1,413 |
1,407 |
1,380 |
1,346 |
|
d) |
Self Liquidating Loans |
- |
- |
- |
- |
- |
- |
VI. |
NRI Deposits
(above one-year maturity) |
43,672 |
42,612 |
40,622 |
40,296 |
41,554 |
44,579 |
|
a) |
NR(E)RA |
26,716 |
25,585 |
23,880 |
23,226 |
23,570 |
24,952 |
|
b) |
FCNR(B) |
14,168 |
14,001 |
13,504 |
12,936 |
13,211 |
14,014 |
|
c) |
NRO Deposits |
2,788 |
3,026 |
3,238 |
4,134 |
4,773 |
5,613 |
VII. |
Rupee Debt * |
2,016 |
1,866 |
1,707 |
1,653 |
1,527 |
1,607 |
|
a) |
Defence |
1,793 |
1,664 |
1,523 |
1,474 |
1,365 |
1,440 |
|
b) |
Civilian + |
223 |
202 |
184 |
179 |
162 |
167 |
VIII. |
Short-term Debt |
45,738 |
49,330 |
50,575 |
46,296 |
43,596 |
40,641 |
|
a) |
Trade Related credits |
41,901 |
46,270 |
46,807 |
42,586 |
40,198 |
37,113 |
|
|
1) Above 180 days |
22,884 |
24,361 |
26,204 |
24,562 |
23,346 |
23,882 |
|
|
2) Upto 180 days |
19,017 |
21,909 |
20,603 |
18,024 |
16,852 |
13,231 |
|
b) |
FII investment in Government T-Bills and other instruments |
651 |
676 |
1,688 |
2,231 |
2,065 |
2,149 |
|
c) |
Investment in Treasury Bills by foreign central banks and international Institutions etc. |
155 |
149 |
124 |
109 |
105 |
104 |
|
d) |
External Debt Liabilities of : |
3,031 |
2,235 |
1,956 |
1,370 |
1,228 |
1,275 |
|
|
1) Central Banks |
1,115 |
975 |
875 |
774 |
764 |
769 |
|
|
2) Commercial Banks |
1,916 |
1,260 |
1,081 |
596 |
464 |
507 |
IX. |
Gross Total |
223,312 |
224,264 |
223,431 |
228,942 |
223,953 |
227,688 |
Memo Items |
|
|
A. |
Total Long-term Debt |
177,574 |
174,934 |
172,856 |
182,646 |
180,357 |
187,047 |
B. |
Short-term Debt |
45,738 |
49,330 |
50,575 |
46,296 |
43,596 |
40,641 |
|
Concessional Debt |
44,163 |
42,806 |
41,519 |
43,236 |
41,903 |
43,373 |
|
As % of Total Debt |
19.8 |
19.1 |
18.6 |
18.9 |
18.7 |
19.0 |
|
Short Term Debt |
45,738 |
49,330 |
50,575 |
46,296 |
43,596 |
40,641 |
|
As % of Total Debt |
20.5 |
22.0 |
22.6 |
20.2 |
19.5 |
17.8 |
P : Provisional. PR : Partially Revised. – : Nil.
# Refers to debt outstanding to Institutions like IFAD, OPEC & EEC(SAC).
## Refers to debt outstanding against loans from ADB.
$ Includes net investment by 100 per cent FII debt funds.
* Debt denominated in Rupees and payable in exports.
+ Includes Rupee suppliers’ credit from end-March 1990 onwards.
Notes : Multilateral loans do not include revaluation of IBRD pooled loans and exchange rate adjustment under IDA loans for Pre-1971 credits. |
Annex I
Gross External Debt Position of QEDS Reporting Countries for End-December 2008 and End-March 2009 |
(US$ billion) |
Sr. No. |
Countries |
2008Q4 |
2009Q1 |
Short-term |
Long-term |
Total |
Short-term |
Long-term |
Total |
1 |
2 |
3 |
4 |
5 |
6 |
7 |
8 |
1 |
Hong Kong, China |
483.9 |
176.1 |
659.9 |
486.1 |
154.4 |
640.5 |
2 |
Russian Federation |
73.0 |
410.4 |
483.5 |
60.2 |
390.6 |
450.8 |
3 |
Turkey |
50.6 |
226.6 |
277.1 |
48.1 |
217.2 |
265.3 |
4 |
Brazil |
36.4 |
226.5 |
262.9 |
32.4 |
227.6 |
259.9 |
5 |
India |
46.3 |
182.6 |
228.9 |
43.6 |
180.4 |
224.0 |
6 |
Mexico |
24.2 |
176.2 |
200.4 |
23.8 |
145.4 |
169.3 |
7 |
Indonesia |
20.5 |
134.6 |
155.1 |
17.8 |
133.3 |
151.0 |
8 |
Argentina |
35.1 |
93.1 |
128.2 |
36.0 |
91.5 |
127.5 |
9 |
Kazakhstan |
10.2 |
97.6 |
107.8 |
8.6 |
96.5 |
105.1 |
10 |
Ukraine |
20.3 |
81.4 |
101.7 |
18.8 |
80.4 |
992 |
11 |
Romania |
26.3 |
75.3 |
101.6 |
22.8 |
72.5 |
95.3 |
12 |
Malaysia |
30.7 |
44.7 |
75.3 |
30.4 |
43.2 |
73.6 |
13 |
South Africa |
25.5 |
46.3 |
71.8 |
23.3 |
44.1 |
67.4 |
14 |
Chile |
14.3 |
50.5 |
64.8 |
12.7 |
52.1 |
64.9 |
15 |
Thailand |
20.4 |
44.6 |
65.1 |
18.5 |
43.0 |
61.5 |
16 |
Croatia |
6.7 |
48.1 |
54.8 |
5.3 |
46.9 |
52.2 |
17 |
Colombia |
5.7 |
40.7 |
46.4 |
4.8 |
42.0 |
46.8 |
18 |
Armenia |
0.5 |
3.0 |
3.4 |
0.5 |
3.1 |
3.6 |
19 |
Australia |
223.0 |
547.3 |
770.3 |
209.4 |
544.2 |
753.7 |
20 |
Austria |
266.7 |
566.1 |
832.8 |
250.9 |
533.9 |
784.8 |
21 |
Belarus |
7.6 |
7.6 |
15.2 |
7.5 |
8.8 |
16.3 |
22 |
Belgium |
962.0 |
392.3 |
1,354.3 |
872.4 |
374.0 |
1,246.4 |
23 |
Bolivia |
0.3 |
5.7 |
5.9 |
0.2 |
5.7 |
5.9 |
24 |
Bulgaria |
18.5 |
32.6 |
51.1 |
17.5 |
31.0 |
48.5 |
25 |
Canada |
304.7 |
457.5 |
762.2 |
313.4 |
460.9 |
774.3 |
26 |
Costa Rica |
4.0 |
5.2 |
9.2 |
3.6 |
5.2 |
8.7 |
27 |
Czech Republic |
25.9 |
54.5 |
80.4 |
22.9 |
50.6 |
73.4 |
28 |
Denmark |
300.1 |
285.0 |
585.1 |
281.4 |
293.8 |
575.2 |
29 |
Ecuador |
1.6 |
16.5 |
18.1 |
- |
- |
- |
30 |
Egypt |
2.8 |
29.3 |
32.1 |
2.5 |
28.4 |
30.9 |
31 |
El Salvador |
1.5 |
91 |
10.7 |
1.2 |
9.3 |
10.5 |
32 |
Estonia |
10.1 |
16.8 |
26.8 |
8.8 |
15.6 |
24.4 |
Annex I
Gross External Debt Position of QEDS Reporting Countries for End-December 2008 and End-March 2009 (Concld.) |
(US$ billion) |
Sr. No. |
Countries |
2008Q4 |
2009Q1 |
|
|
Short-term |
Long-term |
Total |
Short-term |
Long-term |
Total |
1 |
2 |
3 |
4 |
5 |
6 |
7 |
8 |
33 |
Finland |
113.1 |
219.1 |
332.2 |
118.4 |
231.2 |
349.7 |
34 |
France |
2,138.5 |
2,863.2 |
5,001.7 |
1,999.5 |
2,723.7 |
4,723.2 |
35 |
Georgia |
1.0 |
6.7 |
7.7 |
0.8 |
6.9 |
7.7 |
36 |
Germany |
1,723.7 |
3,526.1 |
5,249.8 |
1,635.9 |
3,363.7 |
4,999.6 |
37 |
Greece |
155.6 |
349.0 |
504.6 |
148.9 |
342.3 |
491.3 |
38 |
Hungary |
26.2 |
186.0 |
212.1 |
26.5 |
181.4 |
207.9 |
39 |
Ireland |
1,110.6 |
1,201.1 |
2,311.7 |
1,056.3 |
1,196.7 |
2,253.0 |
40 |
Israel |
33.2 |
52.9 |
86.1 |
31.4 |
52.7 |
84.1 |
41 |
Italy |
807.0 |
1,521.2 |
2,328.2 |
800.9 |
1,509.2 |
2,310.1 |
42 |
Japan |
1,415.6 |
815.1 |
2,230.6 |
1,341.1 |
747.9 |
2,088.9 |
43 |
Korea |
151.1 |
230.0 |
381.1 |
148.1 |
221.2 |
369.3 |
44 |
Kyrgyz Republic |
0.4 |
3.1 |
3.5 |
0.4 |
3.0 |
3.4 |
45 |
Latvia |
14.1 |
28.0 |
42.1 |
10.5 |
27.5 |
38.0 |
46 |
Lithuania |
8.2 |
24.3 |
32.5 |
6.9 |
23.1 |
30.0 |
47 |
Luxembourg |
1,163.5 |
769.5 |
1,933.0 |
1,126.0 |
696.6 |
1,822.6 |
48 |
Moldova |
1.4 |
2.7 |
4.1 |
1.4 |
2.6 |
4.0 |
49 |
Netherlands |
1,090.6 |
1,379.0 |
2,469.6 |
1,047.6 |
1,355.3 |
2,402.9 |
50 |
Norway |
276.9 |
281.6 |
558.5 |
258.0 |
285.9 |
543.9 |
51 |
Paraguay |
0.7 |
2.8 |
3.5 |
- |
- |
- |
52 |
Peru |
6.1 |
28.4 |
34.6 |
4.6 |
29.6 |
34.1 |
53 |
Poland |
51.0 |
192.7 |
243.6 |
45.6 |
177.1 |
222.6 |
54 |
Portugal |
180.4 |
304.4 |
484.7 |
173.3 |
296.8 |
470.2 |
55 |
Slovak Republic |
20.1 |
32.4 |
52.5 |
24.1 |
29.1 |
53.3 |
56 |
Slovenia |
16.2 |
38.2 |
54.4 |
12.7 |
37.2 |
49.9 |
57 |
Spain |
694.2 |
1,618.4 |
2,312.6 |
686.0 |
1,554.2 |
2,240.2 |
58 |
Sweden |
303.2 |
314.3 |
617.6 |
292.9 |
306.9 |
599.8 |
59 |
Switzerland |
912.8 |
392.2 |
1,305.0 |
891.9 |
380.0 |
1,271.9 |
60 |
Tunisia |
4.3 |
16.5 |
20.8 |
4.0 |
15.5 |
19.4 |
61 |
United Kingdom |
6,798.4 |
2,371.5 |
9,169.8 |
6,444.9 |
2,290.6 |
8,735.5 |
62 |
United States |
5,414.4 |
8,227.4 |
13,641.8 |
5,169.4 |
8,230.5 |
13,399.9 |
63 |
Uruguay |
0.1 |
10.6 |
10.7 |
0.1 |
10.9 |
11.0 |
– : Nil/Negligible.
Source: World Bank and IMF. |
* Prepared in the Division of International Finance, Department of Economic Analysis and Policy.
1 The previous article reviewing India’s external debt position as at end-June 2008 was published in the October 2008 issue of the RBI Bulletin. |