India's Foreign Trade: 2007-08 (April-November)* The provisional data on India's merchandise trade for April-November, 2007 and commodity-wise details for April-September, 2007 have been released recently by Directorate General of Commercial Intelligence and Statistics (DGCI&S). This review has been prepared on the basis of these data. Highlights
- India's merchandise exports recorded a growth of 26.8 per cent during November 2007 (34.3 per cent in November 2006), maintaining the growth momentum witnessed since July 2007. Exports growth during the first eight months of 2007-08 (April-November) at 21.9 per cent, however, showed a moderation from 26.2 per cent during April-November, 2006.
- Imports during April-November, 2007 at 26.9 per cent maintained almost the same growth recorded a year ago (27.4 per cent) mainly due to substantial increase in non-oil imports, while growth in POL imports remained subdued.
- Non-oil imports during the first eight months witnessed accelerated growth at 35.3 per cent (21.3 per cent a year ago) and contributed to about 88 per cent of the growth in overall imports during this period, on the back of substantial industrial activity.
- POL imports growth during April-November, 2007 moderated substantially to 9.8 per cent from 42.0 per cent a year ago, a combined effect of moderated growth in crude oil price and slower growth in volume of imports during the period under review.
- The average price of the Indian basket of crude oil during April-November, 2007 increased by 12 per cent as compared with 20 per cent rise in April-November, 2006.
- Trade deficit during April-November, 2007 stood at US $ 52.8 billion, an increase of US $ 14.3 billion over April-November 2006 (US $ 38.5 billion).
Exports During November, 2007, India's merchandise exports maintained the growth momentum with exports recording a growth of 26.8 per cent, though it showed deceleration from 34.3 per cent in November 2006 [Chart 1, Statement 1]. Monthly trends indicated that the growth in exports remained subdued till June, 2007, but it picked up since July, 2007. The various relief measures to exporters announced by the Government 
Table A: India’s Merchandise Trade : |
April-November |
(US $ million) |
Item |
2006-07 R |
2007-08P |
Exports |
80,648 |
98,298 |
|
(26.2) |
(21.9) |
Oil exports* |
9,956 |
12,623 |
|
(103.5) |
(26.8) |
Non-Oil exports* |
51,186 |
59,286 |
|
(18.6) |
(15.8) |
Imports |
119,106 |
151,094 |
|
(27.4) |
(26.9) |
Oil Imports |
39,419 |
43,283 |
|
(42.0) |
(9.8) |
Non-Oil Imports |
79,687 |
107,811 |
|
(21.3) |
(35.3) |
Trade Balance |
-38,457 |
-52,795 |
Note: * Figures pertain to April-September.
Figures in parentheses show percentage change over the
previous year. P: Provisional; R: Revised
Source: DGCI & S |
of India are set out in the Annex. The overall exports realisation during the first eight months of 2007-08 (April-November, 2007) at 98.3 billion (US $ 80.6 billion a year ago) constituted about 61 per cent of the exports target fixed by the Ministry of Commerce and Industry for 2007-08 (US $ 160 billion) as compared with 65 per cent in the previous year (US $ 125 billion) [Table A]. Commodity-wise trade data available for the first half of the current financial year (April-September, 2007) revealed that growth decelerated across all the major commodity groups, with the exception of gems and jewellery. However, engineering goods, petroleum products and gems and jewellery were the drivers of export growth, together contributing to 67 per cent of export growth during April- September, 2007 (Chart 2). In the primary products group, exports of agriculture and allied products continued to show deceleration, while 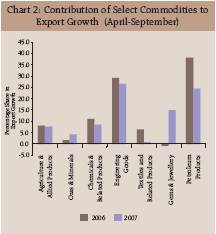 ores and minerals maintained the growth tempo. Exports of agricultural and allied products decelerated to 15.1 per cent during April-September, 2007 from 24.0 per cent a year ago, due to decline in exports of principal commodities, such as tea, coffee, wheat, cotton, cashew and marine products. Exports of these items to principal markets such as the UK, the US, Bangladesh, South Africa, Japan, Belgium and China witnessed decline during the period. Agriculture and allied products have been witnessing persistent decline in exports growth since 2006-07, mainly due to wide fluctuations in the exports of traditional items like tea, coffee, spices, wheat and cashew. The downward trend reversed after June, 2007 but again resumed during September, 2007 (Chart 3). Exports of ores and minerals during April-September, 2007 accelerated to 15.7 per cent from 8.8 per cent during previous year due to a turnaround in iron ore, with China accounting for about 89 per cent of total exports. Manufactured goods exports witnessed moderation in growth (14.1 per cent as against 18.3 per cent a year ago) emanating mainly from deceleration in chemicals and related products, engineering goods and textiles and textile products. Leather and manufactures maintained the same growth at 9.5 per cent, while handicrafts continued to show negative growth. Exports of engineering goods exhibited moderation in growth (20.8 per cent from 37.8 per cent a year ago), due to deceleration in machinery and instruments, iron and steel and electronic goods. Chemicals and related products showed moderation in growth (11.4 per cent from 22.0 per cent a year ago) on the back of negative growth in plastic and linoleum and deceleration in basic chemicals, pharmaceuticals and cosmetics, rubber, glass, paints and enamels. Textile and textile products exports staged a modest recovery with exports 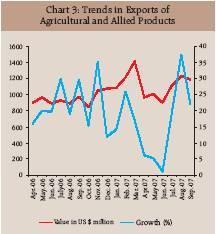 recording a growth of 1.3 per cent (11.6 per cent a year ago) from negative growth till August, 2007. However, exports of readymade garments, which accounted for about 49 per cent of the textiles and textile products exports, continued to show dismal performance (3.3 per cent decline). Gems and jewellery continued buoyant trend with exports recording a growth of 21.2 per cent during April-September, 2007 as against a decline of 1.0 per cent a year ago. Exports to Hong Kong, UAE and Belgium showed a pick up during this period. According to the Gem and Jewellery Export Promotion Council (GJEPC), exports of gems and jewellery for the period April-December, 2007 showed a 22.0 per cent growth over the same period last year. During April-September, 2007, exports of petroleum products recorded a growth of 26.8 per cent, a sharp deceleration from 103.5 per cent a year ago. Exports to major markets such as UAE, Singapore and Brazil remained lower than a year ago. Destination wise, the US continued to be the major market for India's exports, with a share of 13.7 per cent in April-September, 2007 (15.3 per cent a year ago). The other major markets were UAE (10.3 per cent), China (5.3 per cent), the UK (4.3 per cent) and Singapore (4.2 per cent). Region-wise, India's exports to European Union (EU) and Eastern Europe showed accelerated growth, while exports to North America, OPEC and developing countries witnessed deceleration during April-September, 2007 (Statement4). Imports Imports during April-November, 2007 amounted to US $ 151.1 billion, with growth rate (26.9 per cent) maintaining same pace as recorded a year ago (27.4 per cent). Non-oil imports, which registered a growth of 35.3 per cent, contributed to about 88 per cent of the overall growth in imports, while POL imports witnessed sharp deceleration. POL imports during April-November, 2007 stood at US $ 43.3 billion, accounting for about 29 per cent of the overall imports. Oil imports continued to exhibit moderation at 9.8 per cent (42.0 per cent during April-November 2006) due to moderated rise in crude oil prices and slow growth in volume of POL imports during the period under review. The average price of Indian basket of crude oil at US $ 73.0 per barrel during April-November, 2007 was higher by 12.4 per cent compared with the rise of 19.8 per cent during the corresponding period of previous year (Table B). The quantity of oil imports during April-September, 2007 incresed by 11.9 per cent as compared with 18.0 per cent a year ago. Consumption of petroleum products, according to Ministry of Petroleum and Natural Gas (Petroleum Planning and Analysis Cell), Government of India, during April-November, 2007 was higher by 4.5 per cent than that during the corresponding period of the previous year. In the case of non-oil imports, capital goods and gold and silver were the main contributors of the growth, together contributing to 42 per cent of import
| Table B: Trends in Crude Oil Prices |
| (US $/barrel) |
|
Dubai |
UK |
US- |
Indian |
|
|
Brent |
WTI |
basket* |
| 1995-96 |
16.2 |
17.5 |
18.8 |
16.7 |
| 2000-01 |
25.9 |
28.1 |
30.3 |
26.8 |
| 2001-02 |
21.8 |
23.2 |
24.1 |
22.4 |
| 2002-03 |
25.9 |
27.6 |
29.2 |
26.6 |
| 2003-04 |
26.9 |
29.0 |
31.4 |
27.8 |
| 2004-05 |
36.4 |
42.2 |
45.0 |
39.2 |
| 2005-06 |
53.4 |
58.0 |
59.9 |
55.7 |
| 2006-07 |
60.9 |
64.4 |
64.7 |
62.4 |
| 2006-07 |
|
|
|
|
| (April- November) |
63.1 |
67.0 |
67.6 |
64.9 |
| 2007-08 |
|
|
|
|
| (April- November) |
71.0 |
75.8 |
75.3 |
73.0 |
| November |
|
|
|
|
| 2006 |
56.8 |
58.5 |
59.1 |
57.8 |
| November |
|
|
|
|
| 2007 |
86.7 |
92.5 |
94.8 |
89.1 |
| Note:* The composition of Indian Basket represents average of Oman and Dubai for sour grades and Brent (dated) for sweet grade in the ratio of 61.4:38.6 for 2007-08.
Sources: (1) International Monetary Fund, International Financial Statistics,
(2) World Bank's Commodity Price Pink sheet December, 2007.
(3) Ministry of Petroleum and Natural Gas, Government of India. |
growth. During April-September, 2007, capital goods imports increased by 26.9 per cent, on top of 39.1 per cent a year ago, reflecting the buoyant industrial activity. This is evident from the co-movement of imports of capital goods and index of industrial production (Chart 4). Imports of gold and silver recorded a growth of 71.0 per cent as against a decline of 3.1 per cent a year ago. The other items which stimulated the growth in non-oil imports were iron and steel, pearls, precious and semi-precious stones, chemicals, coal, coke and briquettes (Statement 5 and Chart 5). Source-wise, China continued to be the major source of imports (oil plus non-  oil imports) during April-September, 2007, accounting for 11.2 per cent of total imports. The other major sources of imports were Saudi Arabia (7.2 per cent), the US (5.8 per cent), Switzerland (5.6 per cent), UAE (5.5 per cent), Iran (4.2 per cent), Australia (4.0 per cent) and Germany (3.8 per cent) [Statement 6]. 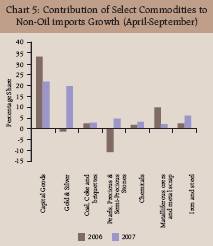
| Table C: Global Merchandise Trade Growth |
| (Per Cent) |
| Country/ Region |
|
Exports
(January- October) |
|
Imports
(January- October) |
|
2006 |
2007 |
2006 |
2007 |
| World* |
14.6 |
13.8 |
14.6 |
12.9 |
| Industrial |
|
|
|
|
| Countries* |
10.9 |
13.1 |
12.6 |
10.3 |
| Developing |
|
|
|
|
| Countries |
19.2 |
15.7 |
17.9 |
17.6 |
| USA |
14.8 |
11.9 |
12.3 |
4.1 |
| EU# |
21.9 |
17.7 |
28.5 |
14.6 |
| Japan |
8.1 |
8.9 |
12.8 |
6.2 |
| China |
26..8 |
26.5 |
20.9 |
19.7 |
| Singapore |
20.1 |
9.7 |
19.6 |
8.9 |
| Korea |
14.2 |
13.8 |
16.2 |
13.2 |
| Hong Kong |
8.5 |
9.2 |
10.8 |
10.1 |
| Malaysia |
13.2 |
9.1 |
13.9 |
11.3 |
| * January-September
# January- November
Sources:
(1) International Financial Statistics, International Monetary fund,
(2) Eurostat. |
Trade Deficit Trade deficit during April-November, 2007 at US $ 52.8 billion was higher by 37.1 per cent than a year ago (US $ 38.5 billion) [Statement 2]. The trade deficit on the oil account increased by US $ 2.3 billion during April-September, 2007 and stood at US $ 22.0 billion, while the non-oil trade deficit increased by US $ 11.1 billion to US $ 17.7 billion. Global Developments Trends in Trade According to the IMF, International Financial Statistics data, world exports registered a growth of 13.8 per cent in the first nine months of 2007 (January-September) as compared with 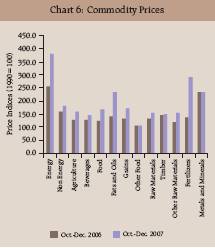 14.6 per cent a year ago (Table C). Exports from industrialized countries posted a higher growth of 13.1 per cent (10.9 per cent a year ago), while developing countries showed a moderation in growth at 15.7 per cent (19.2 per cent) during January-October, 2007. Commodity Prices According to World Bank Commodity Price Data, during the fourth quarter (October-December, 2007), commodity prices surged across the board. During the quarter, the energy prices increased by 48.4 per cent over the corresponding period of the previous year, while non-energy commodities prices increased by 16.7 per cent (Chart 6). Within the non-energy groups, prices of agriculture and food increased by 24.6 per cent and 35.6 per cent, respectively. The other items that witnessed substantial price rise were fats and oils and fertilisers. Annex: Relief Measures for Exporters The Government of India has announced, in different phases, various relief measures to specific sectors, as set out below, to help sustain export growth momentum in the context of rupee appreciation. These measures are broadly in the form of enhancement of duty entitlement pass book (DEPB)/duty drawback rates, refund of service tax, reduction of basic customs duty, subvention of interest rates on export credit and enhancement of the limit for direct receipt of import bills.
|
Date of Announcement
|
Relief Measures
|
| July 12, 2007 |
(i) DEPB rates have been enhanced by 3 per cent for nine sectors i.e., textiles (including handloom), readymade garments, leather products, handicrafts, engineering products, processed agricultural products, marine products, sports goods and toys.
For the rest of the items, DEPB rates have been enhanced by 2 per cent. (ii) The rates of duty drawback have been enhanced by around 10 to 40 per cent of the existing rates.
(iii) ECGC premium has been reduced by 10 per cent of the existing premium rates.
(iv) Clearing of all arrears of terminal excise duties (TED) and central sales tax (CST) reimbursement. (v) Subvention of 2 per cent on pre-shipment and post-shipment credit for exporters in specified sectors (textiles including handlooms, readymade garments, leather products, handicrafts, engineering products, processed agricultural products, marine products, sports goods, toys) and all exporters from SME sector. |
| September 17, 2007 |
Refund of service tax paid by exporters on four taxable services which are not in the nature of "input services" but could be linked to export goods: (a) port services provided for export (b) other port services provided for export and (c) services of transport of goods by road from ICD to port of export provided by goods transport agency and services of transport of export goods in containers by rail from ICD to port of export. |
| October 6, 2007 |
(a) Extension of refund of service tax to additional three taxable services, which are not in the nature of 'input services' but could be linked to export of goods: General insurance services provided to exporters in relation to insurance of export goods; technical testing and analysis agency services in relation to technical testing and analysis of export goods and inspection; and certification agency services in relation to inspection and certification of export goods. (b) Provision to pay interest on EEFC accounts of exporters on outstanding balances subject to a maximum of US $ 1 million valid up to 31.10.2008.
(c) The period for interest subvention on pre- shipment and post-shipment credit was extended from 31.12.2007 to 31.3. 2008.(d) Extension of interest subvention to four more sectors: (i) jute and carpets, (ii) cashew, coffee and tea, (iii) solvent extraction and deoiled cake, and (iv) plastics and linolen. (e) Extension of coverage under Vishesh Krishi and Gram Udyog Yojana (VKGUY), a scheme aimed at promoting export of agriculture and village industry products. |
| November 7, 2007 |
Reserve Bank of India announced, as a sector
specific measure, to enhance the limit for
direct receipt of import bills / documents
from US $ 100,000 to US $ 300,000 in the case
of import of rough diamonds as a relief to
non-status holder exporters. |
| November 29, 2007 |
(a) Reduction of basic customs duty on following items relating to textile sector: polyester filament yarns and polyester staple fibres from 7.5 per cent to 5 per cent; other man made filament yarns namely, acrylic, viscose etc (excluding nylon filament yarns) from 10 per cent to 5 per cent; other man made staple fibres namely, acrylic, viscose etc. (excluding nylon staple fibres) from 10 per cent to 5 per cent; spun yarns of man made staple fibres and filament yarns (excluding nylon fibres) from 10 per cent to 5 per cent; polyester chips from 7.5 per cent to 5 per cent; fibre intermediates viz. dimethyl terephthalate (DMT), pure terephthalic acid (PTA), and mono ethylene glycol (MEG) from 7.5 per cent to 5 per cent; and para-xylene from 2 per cent to zero. (b) Refund of service tax paid on business exhibition service provided to manufacturer- exporters of textile goods. (c) Extension of refund of service tax paid by exporters on taxable services linked to exports to two more taxable services, viz., storage and warehousing service, and cleaning activity service. (d) Additional subvention of 2 per cent (in addition to the 2 per cent already offered earlier) in pre-shipment and post-shipment credit to the sectors viz., leather and leather manufacturers, marine products, handicrafts, all categories of textiles under the existing scheme including RMG and carpets but excluding man-made fibre. The total subvention will be subject to the condition that the interest rate, after subvention, will not fall below 7 per cent, which is the rate applicable to the agriculture sector under priority lending. (e) Extension of payment of interest for delays in payment of terminal excise duty (TES) and central sales tax (CST). |
| Source: Notifications/Press Releases by Government of India and Reserve Bank of India |
| Statement 1 : India's Foreign Trade - November 2007 |
| Year |
Export |
Import |
Trade Balance |
|
Total |
Oil |
Non-Oil |
Total |
Oil |
Non-Oil |
Total |
Oil |
Non-Oil |
| 1 |
2 |
3 |
4 |
5 |
6 |
7 |
8 |
9 |
10 |
| Rupees crore |
| 2005-06 |
33,348 |
4,689 |
28,658 |
51,789 |
15,382 |
36,407 |
-18,441 |
-10,693 |
-7,749 |
| |
(4.3) |
(43.5) |
(-0.2) |
(22.6) |
(61.6) |
(11.3) |
|
|
|
| 2006-07 R |
43,943 |
6,079 |
37,864 |
68,812 |
19,145 |
49,666 |
-24,868 |
-13,066 |
-11,802 |
| |
(31.8) |
(29.6) |
(32.1) |
(32.9) |
(24.5) |
(36.4) |
|
|
|
| 2007-08 P |
49,000 |
.. |
.. |
78,209 |
22,966 |
55,244 |
-29,209 |
|
|
| |
(11.5) |
|
|
(13.7) |
(20.0) |
(11.2) |
|
|
|
| US dollar million |
| 2005-06 |
7,293 |
1,026 |
6,267 |
11,326 |
3,364 |
7,962 |
-4,033 |
-2,338 |
-1,695 |
| |
(2.9) |
(41.6) |
(-1.5) |
(21.0) |
(59.4) |
(9.9) |
|
|
|
| 2006-07 R |
9,798 |
1,355 |
8,442 |
15,342 |
4,269 |
11,074 |
-5,545 |
-2,913 |
-2,631 |
| |
|
|
|
|
|
|
|
|
|
| |
(34.3) |
(32.2) |
(34.7) |
(35.5) |
(26.9) |
(39.1) |
|
|
|
| 2007-08 P |
12,425 |
.. |
.. |
19,832 |
5,823 |
14,008 |
-7,407 |
|
|
| |
|
|
|
|
|
|
|
|
|
| |
(26.8) |
|
|
(29.3) |
(36.4) |
(26.5) |
|
|
|
| SDR million |
| 2005-06 |
5,111 |
719 |
4,392 |
7,937 |
2,357 |
5,580 |
-2,826 |
-1,639 |
-1,188 |
| |
(9.2) |
(50.2) |
(4.5) |
(28.4) |
(69.2) |
(16.5) |
|
|
|
| 2006-07 R |
6,580 |
910 |
5,670 |
10,304 |
2,867 |
7,437 |
-3,724 |
-1,957 |
-1,767 |
| |
(28.7) |
(26.6) |
(29.1) |
(29.8) |
(21.6) |
(33.3) |
|
|
|
| 2007-08P |
7,832 |
.. |
.. |
12,500 |
3,671 |
8,830 |
-4,669 |
|
|
| |
(19.0) |
|
|
(21.3) |
(28.0) |
(18.7) |
|
|
|
| P : Provisional. R : Revised. .. : Not available.
Note :
Figures in brackets relate to percentage variation over the corresponding previous period.
Source : DGCI & S. |
Statement 2 : India's Foreign Trade |
Year |
Exports |
Imports |
Trade Balance |
|
Total |
Oil |
Non-Oil |
Total |
Oil |
Non-Oil |
Total |
Oil |
Non-Oil |
1 |
2 |
3 |
|
4 |
5 |
6 |
7 |
8 |
9 |
10 |
April-March |
Rupees crore |
2004-2005 |
375,340 |
31,404 |
343,935 |
501,065 |
134,094 |
366,971 |
-125,725 |
-102,690 |
-23,035 |
|
(27.9) |
(91.5) |
(24.2) |
(39.5) |
(41.9) |
(38.7) |
|
|
|
2005-2006 R |
456,418 |
51,533 |
404,885 |
660,409 |
194,640 |
465,769 |
-203,991 |
-143,107 |
-60,884 |
|
(21.6) |
(64.1) |
(17.7) |
(31.8) |
(45.2) |
(26.9) |
|
|
|
2006-07 P |
571,779 |
84,520 |
487,259 |
840,506 |
258,572 |
581,935 |
-268,727 |
-174,052 |
-94,675 |
|
(25.3) |
(64.0) |
(20.3) |
(27.3) |
(32.8) |
(24.9) |
|
|
|
US dollar million |
2004-2005 |
83,536 |
6,989 |
76,547 |
111,517 |
29,844 |
81,673 |
-27,981 |
-22,855 |
-5,127 |
|
(30.8) |
(95.9) |
(27.0) |
(42.7) |
(45.1) |
(41.8) |
|
|
|
2005-2006 R |
103,091 |
11,640 |
91,451 |
149,166 |
43,963 |
105,203 |
-46,075 |
-32,323 |
-13,752 |
|
(23.4) |
(66.5) |
(19.5) |
(33.8) |
(47.3) |
(28.8) |
|
|
|
2006-07 P |
126,361 |
18,679 |
107,683 |
185,749 |
57,144 |
128,606 |
-59,388 |
-38,465 |
-20,923 |
|
(22.6) |
(60.5) |
(17.7) |
(24.5) |
(30.0) |
(22.2) |
|
|
|
SDR million |
2004-2005 |
56,081 |
4,692 |
51,389 |
74,866 |
20,036 |
54,830 |
-18,785 |
-15,343 |
-3,442 |
|
(25.6) |
(88.0) |
(21.9) |
(36.9) |
(39.2) |
(36.1) |
|
|
|
2005-2006 R |
70,774 |
7,991 |
62,783 |
102,405 |
30,182 |
72,224 |
-31,632 |
-22,191 |
-9,441 |
|
(26.2) |
(70.3) |
(22.2) |
(36.8) |
(50.6) |
(31.7) |
|
|
|
2006-07 P |
85,018 |
12,567 |
72,451 |
124,975 |
38,447 |
86,528 |
-39,957 |
-25,880 |
-14,077 |
|
(20.1) |
(57.3) |
(15.4) |
(22.0) |
(27.4) |
(19.8) |
|
|
|
April-November |
Rupees crore |
2005-2006 |
281,428 |
31,500 |
249,928 |
411,728 |
122,257 |
289,471 |
-130,300 |
-90,757 |
-39,543 |
|
(25.3) |
(57.8) |
(22.1) |
(36.7) |
(38.7) |
(35.9) |
|
|
|
2006-2007 R |
368,807 |
58,662 |
310,145 |
544,674 |
180,262 |
364,412 |
-175,867 |
-121,600 |
-54,267 |
|
(31.0) |
(86.2) |
(24.1) |
(32.3) |
(47.4) |
(25.9) |
|
|
|
2007-08 P |
398,386 |
.. |
.. |
612,357 |
175,418 |
436,939 |
-213,971 |
|
|
|
(8.0) |
|
|
(12.4) |
(-2.7) |
(19.9) |
|
|
|
US dollar million |
2005-2006 |
63,882 |
7,150 |
56,732 |
93,459 |
27,751 |
65,708 |
-29,577 |
-20,601 |
-8,976 |
|
(29.4) |
(63.0) |
(26.1) |
(41.2) |
(43.3) |
(40.4) |
|
|
|
2006-2007 R |
80,648 |
12,828 |
67,821 |
119,106 |
39,419 |
79,687 |
-38,457 |
-26,591 |
-11,867 |
|
(26.2) |
(79.4) |
(19.5) |
(27.4) |
(42.0) |
(21.3) |
|
|
|
2007-08 P |
98,298 |
12623* |
59286* |
151,094 |
43,283 |
107,811 |
-52,795 |
|
|
|
(21.9) |
(26.8) |
(15.8) |
(26.9) |
(9.8) |
(35.3) |
|
|
|
SDR million |
2005-2006 |
43,573 |
4,877 |
38,696 |
63,748 |
18,929 |
44,819 |
-20,174 |
-14,052 |
-6,122 |
|
(29.9) |
(63.6) |
(26.6) |
(41.8) |
(43.9) |
(40.9) |
|
|
|
2006-2007 R |
54,540 |
8,675 |
45,865 |
80,548 |
26,658 |
53,890 |
-26,008 |
-17,983 |
-8,025 |
|
(25.2) |
(77.9) |
(18.5) |
(26.4) |
(40.8) |
(20.2) |
|
|
|
2007-08 P |
63,956 |
.. |
.. |
98,306 |
28,161 |
70,145 |
-34,350 |
|
|
|
(17.3) |
|
|
(22.0) |
(5.6) |
(30.2) |
|
|
|
P : Provisional. R : Revised. .. : Not available. * : Figures pertain to the month of April-September.
Note :
1. Figures in brackets relate to percentage variation over the corresponding period of the previous year.
2. Data conversion has been done using period average exchange rates.
Source : DGCI & S. |
Statement 3 : India's Exports of Principal Commodities |
(US $ million) |
Commodity Group |
April-September |
Percentage Variation |
|
2005-06 |
2006-07 |
2007-08 P |
(3)/(2) |
(4)/(3) |
(1) |
(2) |
(3) |
(4) |
(5) |
(6) |
I. |
Primary Products |
7,181.7 |
8,499.7 |
9,802.9 |
18.4 |
15.3 |
|
|
(15.0) |
(13.9) |
(13.6) |
|
|
|
A. |
Agricultural & Allied Products |
4,504.3 |
5,586.2 |
6,431.7 |
24.0 |
15.1 |
|
|
of which : |
(9.4) |
(9.1) |
(8.9) |
|
|
|
|
1. |
Tea |
194.1 |
227.3 |
218.4 |
17.1 |
-3.9 |
|
|
2. |
Coffee |
181.1 |
231.1 |
208.1 |
27.6 |
-10.0 |
|
|
3. |
Rice |
692.6 |
700.4 |
1,135.4 |
1.1 |
62.1 |
|
|
4. |
Wheat |
111.0 |
6.2 |
0.0 |
-94.4 |
-99.3 |
|
|
5. |
Cotton Raw incl. Waste |
131.6 |
350.3 |
244.6 |
166.1 |
-30.2 |
|
|
6. |
Tobacco |
145.3 |
192.7 |
223.2 |
32.7 |
15.8 |
|
|
7. |
Cashew incl. CNSL |
314.2 |
271.7 |
251.0 |
-13.5 |
-7.6 |
|
|
8. |
Spices |
230.3 |
309.6 |
485.6 |
34.4 |
56.9 |
|
|
9. |
Oil Meal |
307.3 |
370.4 |
432.8 |
20.6 |
16.8 |
|
|
10. |
Marine Products |
738.2 |
772.5 |
755.4 |
4.6 |
-2.2 |
|
|
11. |
Sugar & Mollases |
16.0 |
513.0 |
614.9 |
3107.6 |
19.9 |
|
B. |
Ores & Minerals |
2,677.4 |
2,913.5 |
3,371.3 |
8.8 |
15.7 |
|
|
of which : |
(5.6) |
(4.8) |
(4.7) |
|
|
|
|
1. |
Iron Ore |
1,648.8 |
1,513.0 |
1,856.0 |
-8.2 |
22.7 |
|
|
2. |
Processed Minerals |
513.4 |
684.9 |
608.3 |
33.4 |
-11.2 |
II. |
Manufactured Goods |
34,604.4 |
40,934.8 |
46,720.1 |
18.3 |
14.1 |
|
of which : |
(72.0) |
(67.0) |
(65.0) |
|
|
|
A. |
Leather & Manufactures |
1,362.1 |
1,491.2 |
1,632.4 |
9.5 |
9.5 |
|
B. |
Chemicals & Related Products |
6,782.3 |
8,273.5 |
9,215.3 |
22.0 |
11.4 |
|
|
1. |
Basic Chemicals, Pharmaceuticals & Cosmetics |
4,111.3 |
5,200.9 |
5,985.4 |
26.5 |
15.1 |
|
|
2. |
Plastic & Linoleum |
1,395.4 |
1,567.8 |
1,484.7 |
12.4 |
-5.3 |
|
|
3. |
Rubber, Glass, Paints & Enamels etc., |
957.1 |
1,156.3 |
1,328.6 |
20.8 |
14.9 |
|
|
4. |
Residual Chemicals & Allied Products |
318.5 |
348.5 |
416.6 |
9.4 |
19.6 |
|
C. |
Engineering Goods |
10,166.8 |
14,005.8 |
16,917.2 |
37.8 |
20.8 |
|
|
of which : |
|
|
|
|
|
|
|
1. |
Manufactures of metals |
2,000.0 |
2,413.4 |
3,084.9 |
20.7 |
27.8 |
|
|
2. |
Machinery & Instruments |
2,341.1 |
3,266.5 |
4,138.4 |
39.5 |
26.7 |
|
|
3. |
Transport equipments |
2,149.9 |
2,373.1 |
3,158.7 |
10.4 |
33.1 |
|
|
4. |
Iron & steel |
1,718.2 |
2,489.2 |
2,506.4 |
44.9 |
0.7 |
|
|
5. |
Electronic goods |
965.4 |
1,379.2 |
1,551.6 |
42.9 |
12.5 |
|
D. |
Textiles and Textile Products |
7,738.6 |
8,634.6 |
8,744.8 |
11.6 |
1.3 |
|
|
1. |
Cotton Yarn, Fabrics, Made-ups, etc., |
1,878.0 |
2,120.9 |
2,146.3 |
12.9 |
1.2 |
|
|
2. |
NaturalSilkYarn,FabricsMadeupsetc.(incl.silkwaste) |
223.9 |
222.2 |
190.1 |
-0.8 |
-14.4 |
|
|
3. |
Manmade Yarn, Fabrics, Made-ups, etc., |
929.4 |
1,048.5 |
1,305.9 |
12.8 |
24.6 |
|
|
4. |
Manmade Staple Fibre |
35.5 |
74.8 |
110.3 |
110.8 |
47.4 |
|
|
5. |
Woolen Yarn, Fabrics, Madeups etc. |
43.4 |
43.2 |
41.1 |
-0.3 |
-4.9 |
|
|
6. |
Readymade Garments |
4,016.9 |
4,453.9 |
4,306.7 |
10.9 |
-3.3 |
|
|
7. |
Jute & Jute Manufactures |
149.7 |
154.7 |
152.4 |
3.4 |
-1.5 |
|
|
8. |
Coir & Coir Manufactures |
65.4 |
69.5 |
75.8 |
6.3 |
9.1 |
|
|
9. |
Carpets |
396.5 |
446.9 |
416.1 |
12.7 |
-6.9 |
|
|
|
(a) Carpet Handmade |
387.3 |
438.3 |
409.7 |
13.2 |
-6.5 |
|
|
|
(b) Carpet Millmade |
0.0 |
0.0 |
0.0 |
|
|
|
|
|
(c) Silk Carpets |
9.2 |
8.6 |
6.4 |
-7.2 |
-24.9 |
|
E. |
Gems & Jewellery |
7,811.9 |
7,731.9 |
9,371.7 |
-1.0 |
21.2 |
|
F. |
Handicrafts |
251.7 |
243.5 |
150.4 |
-3.3 |
-38.2 |
III. |
Petroleum Products |
4,892.2 |
9,956.1 |
12,623.4 |
103.5 |
26.8 |
|
|
(10.2) |
(16.3) |
(17.6) |
|
|
IV. |
Others |
1,354.7 |
1,750.9 |
2,763.1 |
29.2 |
57.8 |
|
|
(2.8) |
(2.9) |
(3.8) |
|
|
Total Exports |
48,033.1 |
61,141.5 |
71,909.6 |
27.3 |
17.6 |
P - Provisional.
Note
1 - Figures in brackets relate to percentage to total exports for the period.
2 - The percentage variation figures may not tally strictly due to rounding-off of figures.
Source - DGCI & S. |
Statement 4 : Direction of India’s Foreign Trade-Exports |
(US $ million) |
Group / Country |
|
April-September |
Percentage Variation |
|
2005-06 |
2006-07 |
2007-08 P |
(3)/(2) |
(4)/(3) |
(1) |
(2) |
(3) |
(4) |
(5) |
(6) |
I. |
O E C D Countries |
21,528.5 |
24,998.4 |
28,319.0 |
16.1 |
13.3 |
|
|
A. |
E U |
10,434.0 |
12,190.6 |
14,597.7 |
16.8 |
19.7 |
|
|
|
Of which: |
|
|
|
|
|
|
|
|
1. |
Belgium |
1,350.7 |
1,606.0 |
2,003.4 |
18.9 |
24.7 |
|
|
|
2. |
France |
1,057.3 |
1,075.4 |
1,150.3 |
1.7 |
7.0 |
|
|
|
3. |
Germany |
1,646.4 |
1,916.3 |
2,286.0 |
16.4 |
19.3 |
|
|
|
4. |
Italy |
1,160.8 |
1,694.1 |
1,826.0 |
45.9 |
7.8 |
|
|
|
5. |
Netherland |
1,107.0 |
1,175.4 |
2,026.2 |
6.2 |
72.4 |
|
|
|
6. |
U K |
2,398.0 |
2,652.2 |
3,056.5 |
10.6 |
15.2 |
|
|
B. |
North America |
8,677.8 |
9,954.8 |
10,443.6 |
14.7 |
4.9 |
|
|
|
1. |
Canada |
495.8 |
571.1 |
589.3 |
15.2 |
3.2 |
|
|
|
2. |
U S A |
8,182.0 |
9,383.7 |
9,854.3 |
14.7 |
5.0 |
|
|
C. |
Asia and Oceania |
1,649.1 |
2,094.4 |
2,173.3 |
27.0 |
3.8 |
|
|
|
Of which: |
|
|
|
|
|
|
|
|
1. |
Australia |
410.8 |
439.6 |
522.4 |
7.0 |
18.8 |
|
|
|
2. |
Japan |
1,151.6 |
1,216.5 |
1,580.8 |
5.6 |
30.0 |
|
|
D. |
Other O E C D Countries |
767.7 |
758.5 |
1,104.4 |
-1.2 |
45.6 |
|
|
|
Of which: |
|
|
|
|
|
|
|
|
1. |
Switzerland |
241.2 |
207.8 |
278.0 |
-13.8 |
33.7 |
II. |
O P E C |
6,679.6 |
10,407.5 |
12,456.5 |
55.8 |
19.7 |
|
Of which: |
|
|
|
|
|
|
1. |
Indonesia |
542.2 |
905.4 |
740.5 |
67.0 |
-18.2 |
|
2. |
Iran |
505.4 |
833.2 |
1,189.9 |
64.9 |
42.8 |
|
3. |
Iraq |
43.4 |
100.9 |
90.4 |
132.6 |
-10.4 |
|
4. |
Kuwait |
247.6 |
298.7 |
313.3 |
20.6 |
4.9 |
|
5. |
Saudi Arabia |
902.6 |
1,180.5 |
1,660.5 |
30.8 |
40.7 |
|
6. |
U A E |
3,744.3 |
6,183.8 |
7,403.9 |
65.2 |
19.7 |
III. |
Eastern Europe |
937.6 |
1,144.1 |
1,546.6 |
22.0 |
35.2 |
|
Of which: |
|
|
|
|
|
|
1. |
Romania |
43.3 |
61.2 |
139.8 |
41.3 |
128.5 |
|
2. |
Russia |
350.9 |
417.2 |
407.6 |
18.9 |
-2.3 |
IV. |
Developing Countries |
18,759.0 |
24,490.1 |
29,313.1 |
30.6 |
19.7 |
|
Of which: |
|
|
|
|
|
|
A. |
Asia |
14,588.5 |
18,191.9 |
20,956.1 |
24.7 |
15.2 |
|
|
a) |
S A A R C |
2,665.8 |
3,306.4 |
3,677.1 |
24.0 |
11.2 |
|
|
|
1. |
Bangladesh |
773.1 |
801.9 |
1,003.8 |
3.7 |
25.2 |
|
|
|
2. |
Bhutan |
52.2 |
27.5 |
37.0 |
- |
34.6 |
|
|
|
3. |
Maldives |
36.2 |
33.7 |
39.6 |
-6.8 |
17.5 |
|
|
|
4. |
Nepal |
412.4 |
468.5 |
582.3 |
13.6 |
24.3 |
|
|
|
5. |
Pakistan |
288.4 |
749.8 |
775.8 |
160.0 |
3.5 |
|
|
|
6. |
Sri Lanka |
1,038.5 |
1,147.9 |
1,124.5 |
10.5 |
-2.0 |
|
|
|
7. |
Afghanistan |
64.9 |
76.9 |
114.0 |
18.5 |
48.2 |
|
|
b) |
Other Asian Developing Countries |
11,922.7 |
14,885.5 |
17,279.0 |
24.9 |
16.1 |
|
|
|
Of which: |
|
|
|
|
|
|
|
|
1. |
People’s Rep of China |
2,900.0 |
3,445.5 |
3,783.9 |
18.8 |
9.8 |
|
|
|
2. |
Hong Kong |
2,300.0 |
2,242.8 |
2,902.8 |
-2.5 |
29.4 |
|
|
|
3. |
South Korea |
805.5 |
1,062.2 |
1,063.2 |
31.9 |
0.1 |
|
|
|
4. |
Malaysia |
514.1 |
592.6 |
954.9 |
15.3 |
61.1 |
|
|
|
5. |
Singapore |
2,693.9 |
3,504.9 |
3,045.8 |
30.1 |
-13.1 |
|
|
|
6. |
Thailand |
497.1 |
696.2 |
848.3 |
40.1 |
21.8 |
|
B. |
Africa |
2,578.6 |
4,328.0 |
5,940.3 |
67.8 |
37.3 |
|
|
Of which: |
|
|
|
|
|
|
|
1. |
Benin |
50.8 |
67.2 |
103.6 |
32.2 |
54.2 |
|
|
2. |
Egypt Arab Republic |
300.3 |
323.4 |
631.3 |
7.7 |
95.2 |
|
|
3. |
Kenya |
227.5 |
786.2 |
577.0 |
245.6 |
-26.6 |
|
|
4. |
South Africa |
718.6 |
1,218.4 |
1,297.3 |
69.5 |
6.5 |
|
|
5. |
Sudan |
154.8 |
204.6 |
177.4 |
32.1 |
-13.3 |
|
|
6. |
Tanzania |
105.4 |
145.7 |
281.5 |
38.2 |
93.2 |
|
|
7. |
Zambia |
32.2 |
61.5 |
79.0 |
91.0 |
28.4 |
|
C. |
Latin American Countries |
1,591.9 |
1,970.2 |
2,416.7 |
23.8 |
22.7 |
V. |
Others |
49.1 |
48.7 |
61.9 |
-0.8 |
27.2 |
VI. |
Unspecified |
79.3 |
52.8 |
212.6 |
-33.4 |
302.5 |
Total Exports |
48,033.1 |
61,141.5 |
71,909.6 |
27.3 |
17.6 |
P - Provisional.
Source- DGCI & S. |
| Statement 5 : India's Imports of Principal Commodities |
| (US $ million) |
| Commodity Group |
April-September |
Percentage Variation |
|
2005-06 |
2006-07 |
2007-08 P |
(3)/(2) |
(4)/(3) |
| (1) |
(2) |
(3) |
(4) |
(5) |
(6) |
| I. |
Bulk Imports |
29,807.2 |
41,531.6 |
50,331.4 |
39.3 |
21.2 |
| |
|
(42.1) |
(47.5) |
(45.1) |
|
|
| |
A. |
Petroleum, Petroleum Products |
20,952.1 |
29,576.0 |
34,583.2 |
41.2 |
16.9 |
| |
|
& Related Material |
(29.6) |
(33.8) |
(31.0) |
|
|
| |
B. |
Bulk Consumption Goods |
1,602.0 |
1,453.1 |
1,987.5 |
-9.3 |
36.8 |
| |
|
1. |
Wheat |
0.0 |
108.9 |
39.1 |
- |
- |
| |
|
2. |
Cereals & Cereal Preparations |
14.1 |
17.4 |
17.1 |
23.7 |
-2.0 |
| |
|
3. |
Edible Oil |
1,184.2 |
1,045.0 |
1,388.7 |
-11.8 |
32.9 |
| |
|
4. |
Pulses |
256.6 |
281.2 |
542.1 |
9.6 |
92.8 |
| |
|
5. |
Sugar |
147.1 |
0.6 |
0.4 |
- |
- |
| |
C. |
Other Bulk Items |
7,253.1 |
10,502.5 |
13,760.7 |
44.8 |
31.0 |
| |
|
1. |
Fertilisers |
1,009.6 |
1,496.9 |
2,243.1 |
48.3 |
49.8 |
| |
|
|
a) Crude |
170.9 |
183.3 |
210.2 |
7.3 |
14.7 |
| |
|
|
b) Sulphur & Unroasted Iron Pyrites |
71.7 |
48.9 |
97.5 |
-31.8 |
99.4 |
| |
|
|
c) Manufactured |
767.1 |
1,264.8 |
1,935.4 |
64.9 |
53.0 |
| |
|
2. |
Non-Ferrous Metals |
865.7 |
1,258.9 |
1,576.9 |
45.4 |
25.3 |
| |
|
3. |
Paper, Paperboard & Mgfd. incl. Newsprint |
471.7 |
650.2 |
683.1 |
37.9 |
5.1 |
| |
|
4. |
Crude Rubber, incl. Synthetic & Reclaimed |
231.9 |
286.8 |
358.1 |
23.6 |
24.9 |
| |
|
5. |
Pulp & Waste Paper |
295.7 |
313.0 |
362.9 |
5.9 |
15.9 |
| |
|
6. |
Metalliferrous Ores & Metal Scrap |
1,890.7 |
3,587.7 |
4,092.6 |
89.8 |
14.1 |
| |
|
7. |
Iron & Steel |
2,487.8 |
2,908.9 |
4,444.0 |
16.9 |
52.8 |
| II. |
Non-Bulk Imports |
40,943.9 |
45,850.2 |
61,240.7 |
12.0 |
33.6 |
| |
|
(57.9) |
(52.5) |
(54.9) |
|
|
| |
A. |
Capital Goods |
14,229.6 |
19,796.5 |
25,121.3 |
39.1 |
26.9 |
| |
|
1. |
Manufactures of Metals |
583.8 |
708.5 |
991.4 |
21.4 |
39.9 |
| |
|
2. |
Machine Tools |
486.5 |
678.3 |
940.9 |
39.4 |
38.7 |
| |
|
3. |
Machinery except Electrical & Electronics |
4,594.5 |
6,411.7 |
8,156.5 |
39.6 |
27.2 |
| |
|
4. |
Electrical Machinery except Electronics |
688.7 |
949.8 |
1,221.9 |
37.9 |
28.6 |
| |
|
5. |
Electronic Goods incl. Computer Software |
6,272.5 |
8,317.6 |
10,388.5 |
32.6 |
24.9 |
| |
|
6. |
Transport Equipments |
1,205.4 |
1,876.7 |
2,836.8 |
55.7 |
51.2 |
| |
|
7. |
Project Goods |
398.3 |
854.0 |
585.3 |
114.4 |
-31.5 |
| |
B. |
Mainly Export Related Items |
10,241.4 |
8,867.4 |
10,845.2 |
-13.4 |
22.3 |
| |
|
1. |
Pearls, Precious & Semi-Precious Stones |
5,368.3 |
3,607.3 |
4,710.2 |
-32.8 |
30.6 |
| |
|
2. |
Chemicals, Organic & Inorganic |
3,548.6 |
3,886.3 |
4,717.3 |
9.5 |
21.4 |
| |
|
3. |
Textile Yarn, Fabric, etc. |
1,032.4 |
1,119.5 |
1,190.9 |
8.4 |
6.4 |
| |
|
4. |
Cashew Nuts, raw |
292.2 |
254.4 |
226.8 |
-13.0 |
-10.8 |
| |
C. |
Others |
16,472.9 |
17,186.3 |
25,274.3 |
4.3 |
47.1 |
| |
|
of which : |
|
|
|
|
|
| |
|
1. |
Gold & Silver |
6,952.1 |
6,736.9 |
11,521.6 |
-3.1 |
71.0 |
| |
|
2. |
Artificial Resins & Plastic Materials |
1,126.7 |
1,307.8 |
1,729.2 |
16.1 |
32.2 |
| |
|
3. |
Professional Instruments etc. except electrical |
944.1 |
1,124.3 |
1,399.0 |
19.1 |
24.4 |
| |
|
4. |
Coal, Coke & Briquittes etc. |
1,764.8 |
2,183.2 |
2,887.2 |
23.7 |
32.2 |
| |
|
5. |
Medicinal & Pharmaceutical Products |
481.8 |
568.9 |
821.6 |
18.1 |
44.4 |
| |
|
6. |
Chemical Materials & Products |
511.1 |
684.6 |
771.2 |
33.9 |
12.7 |
| |
|
7. |
Non-Metallic Mineral Manufactures |
306.0 |
379.9 |
459.5 |
24.1 |
20.9 |
| Total Imports |
70,751.1 |
87,381.8 |
111,572.1 |
23.5 |
27.7 |
| MEMO ITEMS |
|
|
|
|
|
| |
Non-Oil Imports |
49,799.0 |
57,805.8 |
76,988.9 |
16.1 |
33.2 |
| |
Non-Oil Imports excl. Gold & Silver |
42,847.0 |
51,068.9 |
65,467.3 |
19.2 |
28.2 |
| |
Mainly Industrial Inputs* |
39,533.9 |
47,226.7 |
60,145.4 |
19.5 |
27.4 |
| P : Provisional. * : Non oil imports net of gold and silver, bulk consumption goods, manufactured fertilizers and professional instruments.
Note : Figures in brackets relate to percentage to total imports for the period.
Source : DGCI & S. |
Statement 6 : Direction of India’s Foreign Trade-Imports |
(US $ million) |
Group / Country |
|
April-September |
Percentage Variation |
|
2005-06 |
2006-07 |
2007-08 P |
(3)/(2) |
(4)/(3) |
1 |
2 |
3 |
4 |
5 |
6 |
I. |
O E C D Countries |
24,007.6 |
27,870.2 |
37,738.5 |
16.1 |
35.4 |
|
A. |
E U |
11,090.4 |
12,321.0 |
15,546.2 |
11.1 |
26.2 |
|
|
Of which: |
|
|
|
|
|
|
|
1. |
Belgium |
2,574.8 |
1,950.8 |
2,630.3 |
-24.2 |
34.8 |
|
|
2. |
France |
761.2 |
974.7 |
1,137.6 |
28.1 |
16.7 |
|
|
3. |
Germany |
2,846.2 |
3,586.5 |
4,289.4 |
26.0 |
19.6 |
|
|
4. |
Italy |
882.9 |
1,248.2 |
1,667.6 |
41.4 |
33.6 |
|
|
5. |
Netherland |
538.3 |
512.3 |
771.7 |
-4.8 |
50.6 |
|
|
6. |
U K |
1,996.7 |
1,912.0 |
2,483.8 |
-4.2 |
29.9 |
|
B. |
North America |
4,306.9 |
5,640.7 |
7,224.9 |
31.0 |
28.1 |
|
|
1. |
Canada |
450.4 |
574.0 |
785.2 |
27.5 |
36.8 |
|
|
2. |
U S A |
3,856.5 |
5,066.7 |
6,439.7 |
31.4 |
27.1 |
|
C. |
Asia and Oceania |
4,370.6 |
5,687.0 |
7,534.9 |
30.1 |
32.5 |
|
|
Of which: |
|
|
|
|
|
|
|
1. |
Australia |
2,563.7 |
3,398.7 |
4,444.9 |
32.6 |
30.8 |
|
|
2. |
Japan |
1,720.8 |
2,144.9 |
2,921.8 |
24.6 |
36.2 |
|
D. |
Other O E C D Countries |
4,239.7 |
4,221.5 |
7,432.4 |
-0.4 |
76.1 |
|
|
Of which: |
|
|
|
|
|
|
|
1. |
Switzerland |
4,054.6 |
3,933.6 |
6,192.8 |
-3.0 |
57.4 |
II. |
O P E C |
5,704.2 |
28,460.9 |
33,490.1 |
398.9 |
17.7 |
|
Of which: |
|
|
|
|
|
|
1. |
Indonesia |
1,458.7 |
1,760.6 |
2,331.6 |
20.7 |
32.4 |
|
2. |
Iran |
357.5 |
3,824.8 |
4,634.3 |
969.9 |
21.2 |
|
3. |
Iraq |
1.0 |
2,969.5 |
2,837.0 |
- |
- |
|
4. |
Kuwait |
156.7 |
2,892.1 |
3,078.2 |
1,745.7 |
6.4 |
|
5. |
Saudi Arabia |
716.2 |
7,193.4 |
7,987.0 |
904.5 |
11.0 |
|
6. |
U A E |
2,565.2 |
4,422.4 |
6,172.1 |
72.4 |
39.6 |
III. |
Eastern Europe |
1,988.9 |
2,028.3 |
2,431.9 |
2.0 |
19.9 |
|
Of which: |
|
|
|
|
|
|
1. |
Romania |
176.7 |
111.5 |
229.8 |
-36.9 |
106.2 |
|
2. |
Russia |
1,039.5 |
869.4 |
1,009.1 |
-16.4 |
16.1 |
IV. |
Developing Countries |
17,947.9 |
28,755.8 |
37,480.8 |
60.2 |
30.3 |
|
Of which: |
|
|
|
|
|
|
A. |
Asia |
14,217.3 |
22,942.0 |
29,639.9 |
61.4 |
29.2 |
|
|
a) |
S A A R C |
651.6 |
766.4 |
809.3 |
17.6 |
5.6 |
|
|
|
1. Bangladesh |
45.6 |
128.3 |
130.8 |
181.3 |
2.0 |
|
|
|
2. Bhutan |
39.3 |
55.1 |
92.9 |
40.0 |
68.8 |
|
|
|
3. Maldives |
0.9 |
1.5 |
1.7 |
- |
- |
|
|
|
4. Nepal |
183.8 |
140.5 |
189.0 |
-23.6 |
34.5 |
|
|
|
5. Pakistan |
84.7 |
148.6 |
128.1 |
75.5 |
-13.8 |
|
|
|
6. Sri Lanka |
277.4 |
265.5 |
233.1 |
-4.3 |
-12.2 |
|
|
|
7. Afghanistan |
19.9 |
27.0 |
33.6 |
35.4 |
24.6 |
|
|
b) |
Other Asian Developing Countries |
13,565.7 |
22,175.6 |
28,830.5 |
63.5 |
30.0 |
|
|
|
Of which: |
|
|
|
|
|
|
|
|
1. People’s Rep of China |
4,970.4 |
7,991.9 |
12,534.3 |
60.8 |
56.8 |
|
|
|
2. Hong Kong |
1,098.0 |
1,221.4 |
1,279.6 |
11.2 |
4.8 |
|
|
|
3. South Korea |
2,054.9 |
2,400.9 |
2,693.3 |
16.8 |
12.2 |
|
|
|
4. Malaysia |
1,180.8 |
2,562.5 |
2,924.3 |
117.0 |
14.1 |
|
|
|
5. Singapore |
1,489.3 |
2,698.2 |
3,474.0 |
81.2 |
28.8 |
|
|
|
6. Thailand |
602.7 |
812.3 |
1,169.1 |
34.8 |
43.9 |
|
B. |
Africa |
2,494.3 |
3,552.1 |
5,198.3 |
42.4 |
46.3 |
|
|
Of which: |
|
|
|
|
|
|
|
1. |
Benin |
62.9 |
59.2 |
54.2 |
-5.9 |
-8.4 |
|
|
2. |
Egypt Arab Republic |
138.1 |
935.2 |
965.8 |
577.1 |
3.3 |
|
|
3. |
Kenya |
26.6 |
27.9 |
38.1 |
5.0 |
36.4 |
|
|
4. |
South Africa |
1,343.4 |
1,288.7 |
2,086.0 |
-4.1 |
61.9 |
|
|
5. |
Sudan |
15.9 |
47.7 |
144.7 |
200.0 |
203.5 |
|
|
6. |
Tanzania |
21.6 |
17.7 |
23.7 |
-18.3 |
34.2 |
|
|
7. |
Zambia |
20.7 |
67.6 |
56.1 |
- |
-17.0 |
|
C. |
Latin American Countries |
1,236.3 |
2,261.6 |
2,642.6 |
82.9 |
16.8 |
V. |
Others |
15.7 |
33.4 |
42.7 |
112.3 |
27.9 |
VI. |
Unspecified |
21,086.7 |
233.3 |
388.1 |
-98.9 |
66.4 |
Total Imports |
70,751.1 |
87,381.8 |
111,572.1 |
23.5 |
27.7 |
P : Provisional.
Source : DGCI & S.
Note :
1. Figures in brackets relate to percentage to total imports for the period.
2. The figures for 2006-07, which include country-wise distribution of petroleum imports, are not strictly comparable with the data for previous years. |
*Prepared in the Division of International Trade, Department of Economic Analysis and Policy, Reserve Bank of India. |


