India's Foreign Trade: 2007-08 (April-September)* Provisional data on India’s merchandise trade for April-September, 2007 and commodity-wise details for April-June, 2007 have been recently released by Directorate General of Commercial Intelligence and Statistics (DGCI&S). On the basis of these data the review has been prepared.
Highlights
During September, 2007 India’s merchandise exports recorded a growth of 19.3 per cent, marginal improvement over 18.9 per cent in the previous month (August, 2007) but lower than 26.9 per cent in September, 2006. Exports during April-September, 2007 at 18.3 per cent showed a moderation compared with 27.1 per cent in April-September, 2006.
Imports during September, 2007 showed a sharp deceleration at 2.3 per cent as compared with 30.5 per cent a year ago. During April-September, 2007, imports growth was marginally higher at 25.4 per cent than 23.1 per cent a year ago.
Non-oil imports during the first half of 2007-08 (April-September) recorded a substantial increase at 35.4 per cent (15.4 per cent a year ago) and contributed to about 92 per cent of the growth in overall imports during this period.
Oil imports during April-September, 2007 showed a sharp deceleration in growth at 6.1 per cent as against 41.2 per cent a year ago, mainly due to moderation in the growth of oil prices during April-September, 2007, while growth in volume of imports recorded higher growth.
During April-September, 2007, the average price of the Indian basket of crude oil stood higher at US $ 69.2 per barrel as against US $ 67.1 per barrel a year ago.
Trade deficit during the first half of 2007-08 (April-September) stood at US $ 37.0 billion, higher by US $ 11 billion than previous year (US $ 26.0 billion).
Exports
During the month of September, 2007 India’s merchandise exports witnessed a marginal improvement recording a growth of 19.3 per cent over the previous month of August, 2007 (18.9 per cent). This increase was, however, lower than the growth witnessed during September, 2006 (26.9 per cent) [Chart 1, Statement 1].
The overall exports, during the first half of 2007-08 (April-September, 2007) at US $ 72.2 billion showed a growth of 18.3 per cent, lower than 27.1 per cent during April- 
Table A: India’s Merchandise Trade : |
April-September |
(US $ million) |
Items |
2006-07 R |
2007-08 P |
Exports |
61,035 |
72,220 |
|
(27.1) |
(18.3) |
Oil exports* |
4,430 |
5,589 |
|
(106.7) |
(26.2) |
Non-Oil exports* |
24,652 |
29,499 |
|
(15.3) |
(19.7) |
Imports |
87,067 |
1,09,204 |
|
(23.1) |
(25.4) |
Oil Imports |
29,576 |
31,372 |
|
(41.2) |
(6.1) |
Non-Oil Imports |
57,491 |
77,832 |
|
(15.4) |
(35.4) |
Trade Balance |
–26,032 |
–36,984 |
* : Figures pertain to the April-June.
P : Provisional.
R : Revised.
Note : Figures in parentheses show
Percentage change over the previous year.
Source : DGCI&S. |
September, 2006 (Table A and Statement 2). Exports realization during the first six months formed around 45 per cent of the target fixed by the Ministry of Commerce and Industries for the year 2007-08 (US $ 160 billion) as compared with 49 per cent in the previous year (US $ 125 billion).
Commodity-wise data available for April-June, 2007 showed deceleration in exports growth across all the major commodity groups, excepting gems and jewellery.
Petroleum products, engineering goods, and gems and jewellery together contributed to 52 per cent of the overall export growth (Statement 3). While agriculture and allied products as also textiles and related products recorded decline in exports, chemicals and related products showed deceleration in exports growth. Reflecting this, their shares in 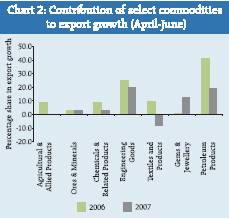
contribution to the overall export growth were lower than the corresponding period of the previous year (Chart 2).
Exports of agriculture and allied products declined by 0.2 per cent during April-June, 2007 as compared with an increase of 21.6 per cent recorded a year ago, due to decline in exports of major items such as sugar and molasses, marine products, cashew, cotton, tea and coffee. The decline in exports of agriculture and allied products during the current year is in sharp contrast with the growth trend witnessed in the recent years consistent with the global trend in agricultural trade (Box).
Exports of manufactured goods also exhibited deceleration in growth at 8.6 per cent (14.6 per cent a year ago) mainly due to decline in the exports of textiles and textile products and moderation in chemicals and related products and engineering goods. The deceleration in engineering goods exports (18.5 per cent as against 26.7 per cent a year ago) was on account of moderation in the exports of machinery and instruments, manufactures of metals and electronic goods. Chemicals and related products decelerated to 4.5 per cent (14.4 per cent a year ago) during April-June, 2007.
Exports of textiles and textile products showed a decline of 11.1 per cent as against an increase of 14.1 per cent a year ago. The continued slide in textile exports during the current year was triggered by decline in the exports of major items like readymade garments, cotton yarn, fabrics and made-ups. Exports to major markets like the US, Italy and Bangladesh also showed decline during this period. According to the US Department of Commerce, Office of Textiles and Apparel, during April-September, 2007, the US imports of textiles and apparel from India decelerated to 2.6 per cent in value terms (9.5 per cent in the corresponding period of the previous year) and 1.5 per cent in quantity terms (16.5 per cent a year ago).
Gems and jewellery exports showed a significant increase at 21.0 per cent during April-June, 2007 as against 0.7 per cent a year ago, with higher exports to major markets (USA and Hong Kong). The latest data available from the Gem and Jewellery Export Promotion Council (GJEPC) for the period April-October, 2007 showed a 25.3 per cent growth in the exports of gems and jewellery over the corresponding period of the previous year.
During April-June, 2007, exports of petroleum products recorded a growth of 26.2 per cent, a sharp decline from 106.7 per cent a year ago. Petroleum products exports which recorded 60.5 per cent growth in 2006-07 showed a deceleration during the current year (Chart 3). Exports to principal markets like UAE have shown decline during April-June 2007 compared with the previous year.
Destination wise, India’s exports to European Union (EU), Eastern Europe and Africa showed accelerated growth, while exports to North America, OPEC and developing countries showed moderation during April-June, 2007 (Statement 4).

Box: Trade in Agricultural Products and Commodity Prices The world agricultural trade which is susceptible to wide cyclical fluctuations, has witnessed a sharp upswing in recent years. The recent surge in agricultural exports benefitted mainly from the high commodity prices, while the agricultural production suffered steady decline in growth especially since 2004 (Table 1). The strong demand stemmed mainly from global economic growth, especially from emerging economies, such as China and a slow supply response are the generally attributed reasons for the price rise. Exports of agricultural products, including food registered an annual average growth of about 13 per cent during 2003 to 2006.
During the latter part of the twentieth century, prices of many of the agricultural products slumped, affecting the export earnings of several commodity-dependent developing countries. However, agricultural commodity prices staged a recovery since 2002, with the last two years witnessing consolidation (Chart 1). Among the primary commodities, prices of minerals, ores and metals were the major beneficiaries of price boom. Prices of copper, nickel, tungsten ore and zinc more than doubled during the period 2002-06. The current phase of price rise in primary products is also attributed to the expansion in demand for biofuels, which is closely linked to developments in energy prices (UNCTAD, 2007). Increased demand was experienced for commodities like maize and sugar which are used for the production of ethanol and vegetable oils for bio-diesel as well.
India’s agricultural exports also exhibited a similar pattern as witnessed at the global level. Exports of agricultural products from India in value terms 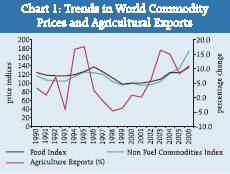
more than doubled from US $ 6.0 billion in 2000-01 to US $ 12.5 billion in 2006-07. Exports in value terms and prices measured in terms of unit value have shown steady rise since 2003-04 (Chart 2). However, the share of agriculture and allied products in the overall exports of India has been stagnated at about 10 per cent emanating from wide fluctuations in the exports of traditional items like tea, coffee, spices, etc. 
Table 1: Trends in World Agricultural Production and Trade |
(Annual percentage change) |
|
2002 |
2003 |
2004 |
2005 |
2006 |
(1) Agricultural Production
(Volume terms) |
1.5 |
2.5 |
5.0 |
1.5 |
1.0 |
(2) Agricultural Exports
(Volume terms) |
3.5 |
3.5 |
3.5 |
6.0 |
6.0 |
(3) Agricultural Exports
(Value terms) |
6.1 |
16.4 |
15.0 |
8.2 |
11.0 |
(4) Prices |
(a) Food |
–0.5 |
1.9 |
13.9 |
7.2 |
19.0 |
|
(b) Vegetable oil seeds and oils |
24.9 |
17.4 |
13.2 |
–9.5 |
5.0 |
|
(c) Minerals, ores and metals |
–2.7 |
12.4 |
40.7 |
26.2 |
60.3 |
Source: WTO International Trade Statistics, various issues; UNCTAD Trade and Development Report, 2006 and 2007 |
Imports
During April-September, 2007 India’s merchandise imports amounted to US $ 109.2 billion, recording a growth of 25.4 per cent (23.1 per cent a year ago). Non-oil imports at US $ 77.8 billion, contributed about 92 per cent of the overall growth in imports during the period, while oil imports showed sharp deceleration.
Imports of POL decelerated during April-September, 2007 (6.1 per cent as against 41.2 per cent a year ago) mainly due to moderated growth in crude oil prices, while quantity of imports remained higher than the previous year. The average price of Indian basket of crude oil at US $ 69.2 per barrel during April-September, 2007 was marginally higher by 3.1 per cent as compared with corresponding period of previous year (25.2 per cent) [(Table B)]. Quantity of POL imports during April-June, 2007 was higher by 17.9 per cent as compared with 16.7 per cent during the same period last year.
Non-oil imports recorded a growth of 35.4 per cent during April-September, 2007 (15.4 per cent a year ago). Commodity-wise details available for April-June, 2007 revealed that gold and silver was the major contributor to the growth (32.7 per cent) in non-oil imports followed by the capital goods (21.2 per cent). During the period, while the share of capital goods, coal, coke
Table B: Trends in Crude Oil Prices |
(US $/barrel) |
|
Dubai |
UK |
US- |
Indian |
|
|
Brent |
WTI |
Basket* |
1995-96 |
16.2 |
17.5 |
18.8 |
16.7 |
2000-01 |
25.9 |
28.1 |
30.3 |
26.8 |
2001-02 |
21.8 |
23.2 |
24.1 |
22.4 |
2002-03 |
25.9 |
27.6 |
29.2 |
26.6 |
2003-04 |
26.9 |
29.0 |
31.4 |
27.8 |
2004-05 |
36.4 |
42.2 |
45.0 |
38.9 |
2005-06 |
53.4 |
58.0 |
59.9 |
55.3 |
2006-07 |
60.9 |
64.4 |
64.7 |
62.3 |
2006-07 (April- |
|
|
|
|
September) |
65.3 |
69.9 |
70.4 |
67.1 |
2007-08 (April- |
|
|
|
|
September) |
67.3 |
71.9 |
70.2 |
69.2 |
September 2006 |
59. 8 |
62.8 |
63.8 |
61.0 |
September 2007 |
73.3 |
77.1 |
79.9 |
74.8 |
* : Indian basket comprises 59.8 per cent ‘sour’ variety benchmarked by Dubai crude and
40.2 per cent of ‘sweet’ variety benchmarked by UK Brent crude.
Source : International Monetary Fund,
International Financial Statistics, World Bank’s CommodityPrice Pink sheet September, 2007 . |

and briquettes, chemicals and metalliferrous ores and metal scrap in imports growth declined, the contribution of gold and silver, pearls, precious and semiprecious stones and iron and steel showed increase (Statement 5 and Chart 4).
Source-wise, China was the major source of imports (oil plus non-oil imports) during April-June, 2007, accounting for 10.7 per cent of total imports followed by Switzerland (7.0 per cent), UAE (6.0 per cent), Saudi Arabia (5.8 per cent), the US (4.9 per cent), Australia (4.6 per cent), Iran (4.3 per cent) and Germany (3.9 per cent) [Statement 6]. Trade Deficit
Trade deficit in September 2007 at US $ 4.4 billion was lower than US $ 6.1 billion a year ago facilitated by slower growth in imports. The overall trade deficit during April-September, 2007 at US $ 37.0 billion was higher by US $ 11.0 billion than the previous year (US $ 26.0 billion) [Statement 2]. The trade deficit on the oil account increased by US $ 2.1 billion during April-June, 2007 to reach US $ 11.4 billion, while the non-oil trade deficit increased by US $ 7.5 billion to US $ 10.1 billion.
Global Developments
Based on IMF, International Financial Statistics data, world exports registered a growth of 14.0 per cent (13.9 per cent a year ago) in the first seven months of 2007 (January-July). Exports from industrialized countries posted a higher growth of 13.1 per cent (10.4 per cent a year ago) while developing countries showed a moderation in growth at 15.2 per cent (18.6 per cent).
According to the US Bureau of Economic Analysis (BEA), during January-September, 2007, the US exports posted a higher growth (12.0 per cent growth) than imports (4.0 per cent). In the case of European Union, according to Euro Stat, trade showed a deceleration with exports showing a growth of 7.1 per cent during January-September, 2007 (11.3 per cent a year ago), and imports registering a growth of 4.0 per cent (18.0 per cent a year ago). Japan’s exports posted a growth of 13.6 per cent during January-September, 2007 (13.3 per cent a year ago) and imports grew by 8.4 per cent (16.9 per cent a year ago).
Among the emerging markets, China’s exports, according to Ministry of Commerce of the People’s Republic of China, during January-September, 2007 increased by 27.1 per cent while imports grew by 19.1 per cent. Malaysia’s exports, according to the Department of Statistics, Malaysia, during the same period posted a growth of 0.1 per cent, while imports grew by 2.9 per cent. Thailand’s exports during January-September, 2007 increased by 16.1 per cent as compared with 16.0 per cent a year ago.
Statement 1 : India’s Foreign Trade - Sept. 2007 |
Year |
Export |
Import |
Trade Balance |
|
Total |
Oil |
Non-Oil |
Total |
Oil |
Non-Oil |
Total |
Oil |
Non-Oil |
1 |
2 |
3 |
4 |
5 |
6 |
7 |
8 |
9 |
10 |
Rupees crore |
2005-06 |
37,138 |
4,596 |
32,542 |
56,632 |
17,778 |
38,854 |
–19,494 |
–13,182 |
–6,312 |
|
(16.4) |
(55.2) |
(12.5) |
(30.4) |
(49.8) |
(23.1) |
|
|
|
|
|
|
|
|
|
|
|
|
|
2006-07 R |
49,486 |
7,307 |
42,179 |
77,611 |
23,808 |
53,803 |
–28,125 |
–16,501 |
–11,624 |
|
(33.3) |
(59.0) |
(29.6) |
(37.0) |
(33.9) |
(38.5) |
|
|
|
|
|
|
|
|
|
|
|
|
|
2007-08 P |
51,622 |
.. |
.. |
69,456 |
22,179 |
47,277 |
–17,834 |
|
|
|
(4.3) |
|
|
(-10.5) |
(-6.8) |
(-12.1) |
|
|
|
US dollar million |
2005-06 |
8,457 |
1,046 |
7,410 |
12,896 |
4,048 |
8,902 |
–4,439 |
–3,002 |
–1,491 |
|
(22.2) |
(62.9) |
(18.1) |
(36.9) |
(57.2) |
(30.1) |
|
|
|
|
|
|
|
|
|
|
|
|
|
2006-07 R |
10,730 |
1,584 |
9,146 |
16,829 |
5,162 |
11,666 |
–6,098 |
–3,578 |
–2,521 |
|
(26.9) |
(51.4) |
(23.4) |
(30.5) |
(27.5) |
(31.1) |
|
|
|
|
|
|
|
|
|
|
|
|
|
2007-08 P |
12,797 |
.. |
.. |
17,218 |
5,498 |
11,720 |
–4,421 |
|
|
|
(19.3) |
|
|
(2.3) |
(6.5) |
(0.5) |
|
|
|
|
|
|
SDR million |
|
|
|
|
|
2005-06 |
5,768 |
714 |
5,054 |
8,795 |
2,761 |
6,034 |
–3,027 |
–2,047 |
–980 |
|
(22.1) |
(62.7) |
(17.9) |
(36.7) |
(57.0) |
(29.1) |
|
|
|
|
|
|
|
|
|
|
|
|
|
2006-07 R |
7,242 |
1,069 |
6,215 |
11,358 |
3,484 |
7,874 |
–4,116 |
–2,415 |
–1,658 |
|
(25.6) |
(49.8) |
(23.0) |
(29.1) |
(26.2) |
(30.5) |
|
|
|
2007-08P |
8,290 |
.. |
.. |
11,154 |
3,562 |
7,592 |
–2,864 |
|
|
|
(14.5) |
|
|
(-1.8) |
(2.2) |
(-3.6) |
|
|
|
P : Provisional. R : Revised. .. : Not available.
Note : Figures in brackets relate to percentage variation over the corresponding previous period.
Source : DGCI & S. |
Statement 2 : India’s Foreign Trade |
Year |
Export |
Import |
Trade Balance |
|
Total |
Oil |
Non-Oil |
Total |
Oil |
Non-Oil |
Total |
Oil |
Non-Oil |
1 |
2 |
3 |
4 |
5 |
6 |
7 |
8 |
9 |
10 |
April-March |
Rupees crore |
2004-2005 |
375,340 |
31,404 |
343,935 |
501,065 |
134,094 |
366,971 |
–125,725 |
–102,690 |
–23,035 |
|
(27.9) |
(91.5) |
(24.2) |
(39.5) |
(41.9) |
(38.7) |
|
|
|
2005-2006 R |
456,418 |
51,533 |
404,885 |
660,409 |
194,640 |
465,769 |
–203,991 |
–143,107 |
–60,884 |
|
(21.6) |
(64.1) |
(17.7) |
(31.8) |
(45.2) |
(26.9) |
|
|
|
2006-2007 P |
571,779 |
84,520 |
487,259 |
840,506 |
258,572 |
581,935 |
–268,727 |
–174,052 |
–94,675 |
|
(25.3) |
(64.0) |
(20.3) |
(27.3) |
(32.8) |
(24.9) |
|
|
|
|
|
|
US dollar million |
|
|
|
|
2004-2005 |
83,536 |
6,989 |
76,547 |
111,517 |
29,844 |
81,673 |
–27,981 |
–22,855 |
–5,127 |
|
(30.8) |
(95.9) |
(27.0) |
(42.7) |
(45.1) |
(41.8) |
|
|
|
2005-2006 R |
103,091 |
11,640 |
91,451 |
149,166 |
43,963 |
105,203 |
–46,075 |
–32,323 |
–13,752 |
|
(23.4) |
(66.5) |
(19.5) |
(33.8) |
(47.3) |
(28.8) |
|
|
|
2006-2007 P |
126,361 |
18,679 |
107,683 |
185,749 |
57,144 |
128,606 |
–59,388 |
–38,465 |
–20,923 |
|
(22.6) |
(60.5) |
(17.7) |
(24.5) |
(30.0) |
(22.2) |
|
|
|
|
|
|
SDR million |
|
|
|
|
|
2004-2005 |
56,081 |
4,692 |
51,389 |
74,866 |
20,036 |
54,830 |
–18,785 |
–15,343 |
–3,442 |
|
(25.6) |
(88.0) |
(21.9) |
(36.9) |
(39.2) |
(36.1) |
|
|
|
2005-2006 R |
70,774 |
7,991 |
62,783 |
102,405 |
30,182 |
72,224 |
–31,632 |
–22,191 |
–9,441 |
|
(26.2) |
(70.3) |
(22.2) |
(36.8) |
(50.6) |
(31.7) |
|
|
|
2006-2007 P |
85,018 |
12,567 |
72,451 |
124,975 |
38,447 |
86,528 |
–39,957 |
–25,880 |
–14,077 |
|
(20.1) |
(57.3) |
(15.4) |
(22.0) |
(27.4) |
(19.8) |
|
|
|
|
|
|
April-Sept. |
|
|
|
|
|
|
|
|
Rupees crore |
|
|
|
|
|
2005-2006 |
209,656 |
21,354 |
188,302 |
308,816 |
91,452 |
217,364 |
–99,160 |
–70,098 |
–29,062 |
2006-2007 R |
280,275 |
45,719 |
234,556 |
399,815 |
135,815 |
264,000 |
–119,540 |
–90,096 |
–29,444 |
|
(33.7) |
(114.1) |
(24.6) |
(29.5) |
(48.5) |
(21.5) |
|
|
|
2007-2008 P |
295,233 |
.. |
.. |
446,421 |
128,247 |
318,174 |
–151,188 |
|
|
|
(5.3) |
|
|
(11.7) |
(-5.6) |
(20.5) |
|
|
|
|
|
|
US dollar million |
|
|
|
|
2005-2006 |
48,033 |
4,892 |
43,141 |
70,751 |
20,952 |
49,799 |
–22,718 |
–16,060 |
–6,658 |
|
(33.4) |
(67.2) |
(30.5) |
(47.0) |
(43.7) |
(48.5) |
|
|
|
2006-2007 R |
61,035 |
9,956 |
51,079 |
87,067 |
29,576 |
57,491 |
–26,032 |
–19,620 |
–6,412 |
|
(27.1) |
(103.5) |
(18.4) |
(23.1) |
(41.2) |
(15.4) |
|
|
|
2007-2008 P |
72,220 |
5589 * |
29499 * |
109,204 |
31,372 |
77,832 |
–36,984 |
|
|
|
(18.3) |
(26.2) |
(19.7) |
(25.4) |
(6.1) |
(35.4) |
|
|
|
|
|
|
SDR million |
|
|
|
|
|
2005-2006 |
32,534 |
3,314 |
29,220 |
47,921 |
14,191 |
33,730 |
–15,387 |
–10,878 |
–4,510 |
|
(32.2) |
(65.7) |
(29.3) |
(45.7) |
(42.4) |
(47.1) |
|
|
|
2006-2007 R |
41,300 |
6,737 |
34,563 |
58,915 |
20,013 |
38,902 |
–17,615 |
–13,276 |
–4,339 |
|
(26.9) |
(103.3) |
(18.3) |
(22.9) |
(41.0) |
(15.3) |
|
|
|
2007-2008 P |
47,341 |
.. |
.. |
71,584 |
20,564 |
51,019 |
–24,243 |
|
|
|
(14.6) |
|
|
(21.5) |
(2.8) |
(31.1) |
|
|
|
P : Provisional. R : Revised. .. : Not available. * : Figures pertain to the month of April-June
Note : 1. Figures in brackets relate to percentage variation over the corresponding period of the previous year.
2. Data conversion has been done using period average exchange rates.
Source : DGCI & S. |
Statement 3 : India’s Exports of Principal Commodities |
(US $ million) |
Commodity Group |
April-June |
Percentage Variation |
|
2005-06 |
2006-07 |
2007-08 P |
(3)/(2) |
(4)/(3) |
1 |
|
|
|
2 |
3 |
4 |
5 |
6 |
I. |
Primary Products |
3,729.3 |
4,366.8 |
4,543.9 |
17.1 |
4.1 |
|
|
|
|
(15.9) |
(15.0) |
(12.9) |
|
|
|
A. |
Agricultural & Allied Products |
2,280.6 |
2,773.6 |
2,768.3 |
21.6 |
–0.2 |
|
|
of which: |
(9.7) |
(9.5) |
(7.9) |
|
|
|
|
1. |
Tea |
83.0 |
87.8 |
71.6 |
5.8 |
–18.4 |
|
|
2. |
Coffee |
110.1 |
127.2 |
115.7 |
15.5 |
–9.1 |
|
|
3. |
Rice |
363.9 |
274.3 |
504.5 |
–24.6 |
84.0 |
|
|
4. |
Wheat |
73.1 |
4.9 |
0.1 |
–93.3 |
–98.4 |
|
|
5. |
Cotton Raw incl. Waste |
86.6 |
244.6 |
113.6 |
182.5 |
–53.6 |
|
|
6. |
Tobacco |
65.2 |
88.0 |
104.8 |
35.1 |
19.0 |
|
|
7. |
Cashew incl. CNSL |
171.6 |
135.8 |
125.4 |
–20.9 |
–7.7 |
|
|
8. |
Spices |
112.6 |
141.9 |
211.8 |
26.0 |
49.3 |
|
|
9. |
Oil Meal |
166.7 |
167.3 |
193.9 |
0.4 |
15.9 |
|
|
10. |
Marine Products |
314.2 |
307.1 |
270.0 |
–2.3 |
–12.1 |
|
|
11. |
Sugar & Mollases |
10.0 |
376.3 |
295.1 |
3676.7 |
–21.6 |
|
B. |
Ores & Minerals |
1,448.6 |
1,593.2 |
1,775.6 |
10.0 |
11.4 |
|
|
of which: |
(6.2) |
(5.5) |
(5.1) |
|
|
|
|
1. |
Iron Ore |
909.4 |
858.4 |
981.2 |
–5.6 |
14.3 |
|
|
2. |
Processed Minerals |
238.4 |
363.6 |
302.6 |
52.5 |
–16.8 |
II. |
Manufactured Goods |
16,838.7 |
19,291.4 |
20,941.6 |
14.6 |
8.6 |
|
of which: |
(71.6) |
(66.3) |
(59.7) |
|
|
|
A. |
Leather & Manufactures |
627.6 |
644.4 |
659.7 |
2.7 |
2.4 |
|
B. |
Chemicals & Related Products |
3,406.1 |
3,896.2 |
4,072.0 |
14.4 |
4.5 |
|
|
1. |
Basic Chemicals, Pharmaceuticals & Cosmetics |
2,020.3 |
2,463.8 |
2,622.3 |
22.0 |
6.4 |
|
|
2. |
Plastic & Linoleum |
771.7 |
710.1 |
691.7 |
–8.0 |
–2.6 |
|
|
3. |
Rubber, Glass, Paints & Enamels, etc., |
463.6 |
552.0 |
586.4 |
19.1 |
6.2 |
|
|
4. |
Residual Chemicals & Allied Products |
150.5 |
170.4 |
171.6 |
13.2 |
0.7 |
|
C. |
Engineering Goods |
5,141.0 |
6,515.1 |
7,720.5 |
26.7 |
18.5 |
|
|
of which: |
|
|
|
|
|
|
|
1. |
Manufactures of metals |
952.5 |
1,116.0 |
1,265.9 |
17.2 |
13.4 |
|
|
2. |
Machinery & Instruments |
1,129.2 |
1,575.6 |
1,794.3 |
39.5 |
13.9 |
|
|
3. |
Transport equipments |
1,265.2 |
1,336.1 |
1,688.8 |
5.6 |
26.4 |
|
|
4. |
Iron & steel |
897.4 |
1,018.9 |
1,194.7 |
13.5 |
17.3 |
|
|
5. |
Electronic goods |
449.2 |
638.1 |
647.9 |
42.0 |
1.5 |
|
D. |
Textiles and Textile Products |
3,786.1 |
4,318.5 |
3,839.0 |
14.1 |
–11.1 |
|
|
1. |
Cotton Yarn, Fabrics, Made-ups,
etc. |
907.6 |
1,023.5 |
853.4 |
12.8 |
–16.6 |
|
|
2. |
Natural Silk Yarn, Fabrics Madeups, etc. |
|
|
|
|
|
|
|
|
(incl.silk waste) |
110.2 |
105.3 |
100.1 |
–4.4 |
–5.0 |
|
|
3. |
Manmade Yarn, Fabrics, Made-ups, etc. |
440.8 |
495.7 |
522.4 |
12.4 |
5.4 |
|
|
4. |
Manmade Staple Fibre |
18.6 |
29.8 |
60.0 |
60.6 |
101.1 |
|
|
5. |
Woolen Yarn, Fabrics, Madeups,
etc. |
22.2 |
21.4 |
21.0 |
–3.5 |
–2.1 |
|
|
6. |
Readymade Garments |
1,999.8 |
2,324.3 |
2,020.8 |
16.2 |
–13.1 |
|
|
7. |
Jute & Jute Manufactures |
71.0 |
66.8 |
64.7 |
–5.8 |
–3.1 |
|
|
8. |
Coir & Coir Manufactures |
28.9 |
30.8 |
30.2 |
6.8 |
–1.9 |
|
|
9. |
Carpets |
187.0 |
220.7 |
166.3 |
18.0 |
–24.7 |
|
|
|
(a) Carpet Handmade |
183.3 |
216.7 |
163.8 |
18.2 |
–24.4 |
|
|
|
(b) Carpet Millmade |
0.0 |
0.0 |
0.0 |
|
|
|
|
|
(c) Silk Carpets |
3.7 |
4.0 |
2.5 |
7.7 |
–37.6 |
|
E. |
Gems & Jewellery |
3,524.4 |
3,549.1 |
4,293.8 |
0.7 |
21.0 |
|
F. |
Handicrafts |
117.7 |
110.3 |
62.3 |
–6.2 |
–43.5 |
III. |
Petroleum Products |
2,143.5 |
4,429.5 |
5,588.6 |
106.7 |
26.2 |
|
|
|
|
(9.1) |
(15.2) |
(15.9) |
|
|
IV. |
Others |
816.3 |
993.5 |
4,013.9 |
21.7 |
304.0 |
|
|
|
|
(3.5) |
(3.4) |
(11.4) |
|
|
Total Exports |
23,527.7 |
29,081.3 |
35,088.0 |
23.6 |
20.7 |
P : Provisional.
Note : Figures in brackets relate to percentage to total exports for the period.
Source : DGCI & S. |
Statement 4 : Direction of India’s Foreign Trade- Exports |
(US $ million) |
Group/Country |
April-June |
Percentage Variation |
|
2005-06 |
2006-07 |
2007-08 P |
(3)/(2) |
(4)/(3) |
1 |
2 |
3 |
4 |
5 |
6 |
I. |
O E C D Countries |
10,305.3 |
11,767.8 |
13,493.7 |
14.2 |
14.7 |
|
A. |
E U |
5,262.8 |
5,760.9 |
6,952.9 |
9.5 |
20.7 |
|
|
of which: |
|
|
|
|
|
|
|
1. |
Belgium |
642.4 |
710.6 |
1,022.3 |
10.6 |
43.9 |
|
|
2. |
France |
659.1 |
614.1 |
555.7 |
–6.8 |
–9.5 |
|
|
3. |
Germany |
801.4 |
940.8 |
1,093.9 |
17.4 |
16.3 |
|
|
4. |
Italy |
603.5 |
762.0 |
923.2 |
26.3 |
21.2 |
|
|
5. |
Netherland |
505.8 |
466.5 |
784.9 |
–7.8 |
68.3 |
|
|
6. |
U K |
1,185.2 |
1,280.2 |
1,465.0 |
8.0 |
14.4 |
|
B. |
North America |
3,874.9 |
4,643.3 |
4,950.2 |
19.8 |
6.6 |
|
|
1. |
Canada |
240.3 |
269.6 |
278.0 |
12.2 |
3.1 |
|
|
2. |
U S A |
3,634.6 |
4,373.7 |
4,672.1 |
20.3 |
6.8 |
|
C. |
Asia and Oceania |
836.6 |
986.1 |
1,039.4 |
17.9 |
5.4 |
|
|
of which: |
|
|
|
|
|
|
|
1. |
Australia |
183.3 |
202.5 |
202.7 |
10.5 |
0.1 |
|
|
2. |
Japan |
597.7 |
567.6 |
803.4 |
–5.0 |
41.6 |
|
D. |
Other O E C D Countries |
331.0 |
377.5 |
551.2 |
14.0 |
46.0 |
|
|
of which: |
|
|
|
|
|
|
|
1. |
Switzerland |
114.2 |
104.4 |
146.5 |
–8.6 |
40.3 |
II. |
O P E C |
3,278.4 |
4,922.3 |
6,390.8 |
50.1 |
29.8 |
|
of which: |
|
|
|
|
|
|
1. |
Indonesia |
289.2 |
467.4 |
420.9 |
61.6 |
–9.9 |
|
2. |
Iran |
176.0 |
438.1 |
674.2 |
148.9 |
53.9 |
|
3. |
Iraq |
25.5 |
61.6 |
55.7 |
141.4 |
–9.6 |
|
4. |
Kuwait |
128.1 |
150.3 |
153.2 |
17.3 |
1.9 |
|
5. |
Saudi Arabia |
422.3 |
511.8 |
826.5 |
21.2 |
61.5 |
|
6. |
U A E |
1,871.4 |
2,913.6 |
3,807.1 |
55.7 |
30.7 |
III. |
Eastern Europe |
450.6 |
530.0 |
746.0 |
17.6 |
40.8 |
|
of which: |
|
|
|
|
|
|
1. |
Romania |
26.9 |
35.7 |
63.7 |
32.9 |
78.2 |
|
2. |
Russia |
179.0 |
181.8 |
192.5 |
1.6 |
5.9 |
IV. |
Developing Countries |
9,445.4 |
11,809.1 |
14,342.4 |
25.0 |
21.5 |
|
of which: |
|
|
|
|
|
|
A. |
Asia |
7,435.1 |
9,142.5 |
10,300.3 |
23.0 |
12.7 |
|
|
a) |
S A A R C |
1,328.1 |
1,777.6 |
1,927.3 |
33.8 |
8.4 |
|
|
|
1. Bangladesh |
408.0 |
419.8 |
475.1 |
2.9 |
13.2 |
|
|
|
2. Bhutan |
28.9 |
14.2 |
18.3 |
– |
28.4 |
|
|
|
3. Maldives |
14.6 |
14.0 |
17.4 |
–4.3 |
24.3 |
|
|
|
4. Nepal |
195.2 |
222.1 |
317.9 |
13.8 |
43.1 |
|
|
|
5. Pakistan |
166.7 |
428.2 |
406.5 |
156.9 |
–5.1 |
|
|
|
6. Sri Lanka |
489.3 |
644.1 |
644.6 |
31.6 |
0.1 |
|
|
|
7. Afghanistan |
25.5 |
35.2 |
47.7 |
38.1 |
35.6 |
|
|
b) |
Other Asian Developing Countries |
6,107.0 |
7,364.9 |
8,373.0 |
20.6 |
13.7 |
|
|
|
of which: |
|
|
|
|
|
|
|
|
1. People’s Rep of China |
1,514.5 |
1,816.9 |
1,926.4 |
20.0 |
6.0 |
|
|
|
2. Hong Kong |
1,060.9 |
1,036.4 |
1,288.7 |
–2.3 |
24.3 |
|
|
|
3. South Korea |
382.9 |
392.5 |
515.1 |
2.5 |
31.2 |
|
|
|
4. Malaysia |
234.8 |
269.6 |
377.5 |
14.8 |
40.0 |
|
|
|
5. Singapore |
1,567.8 |
1,852.2 |
1,640.5 |
18.1 |
–11.4 |
|
|
|
6. Thailand |
248.8 |
325.0 |
300.7 |
30.6 |
–7.5 |
|
B. |
Africa |
1,286.8 |
1,811.5 |
3,224.0 |
40.8 |
78.0 |
|
|
of which: |
|
|
|
|
|
|
|
1. |
Benin |
22.9 |
23.9 |
48.9 |
4.2 |
104.7 |
|
|
2. |
Egypt Arab Republic |
173.8 |
149.8 |
283.7 |
–13.8 |
89.4 |
|
|
3. |
Kenya |
150.4 |
314.8 |
299.7 |
109.3 |
–4.8 |
|
|
4. |
South Africa |
316.5 |
502.9 |
751.0 |
58.9 |
49.3 |
|
|
5. |
Sudan |
89.9 |
107.3 |
78.8 |
19.4 |
–26.6 |
|
|
6. |
Tanzania |
45.1 |
52.9 |
105.7 |
17.1 |
100.0 |
|
|
7. |
Zambia |
16.4 |
19.4 |
40.6 |
18.0 |
109.8 |
|
C. |
Latin American Countries |
723.5 |
855.2 |
818.0 |
18.2 |
–4.3 |
V. |
Others |
26.7 |
20.7 |
24.9 |
–22.6 |
20.6 |
VI. |
Unspecified |
21.2 |
31.4 |
90.2 |
48.5 |
186.7 |
Total |
Exports |
23,527.7 |
29,081.3 |
35,088.0 |
23.6 |
20.7 |
P : Provisional.
Source : DGCI & S. |
Statement 5 : India’s Imports of Principal Commodities |
(US $ million) |
Commodity Group |
April-June |
Percentage Variation |
|
2005-06 |
2006-07 |
2007-08 P |
(3)/(2) |
(4)/(3) |
1 |
2 |
3 |
4 |
5 |
6 |
I. |
Bulk Imports |
13,503.2 |
19,045.7 |
24,860.2 |
41.0 |
30.5 |
|
|
|
|
(39.3) |
(46.5) |
(43.9) |
|
|
|
A. |
Petroleum, Petroleum Products |
9,444.9 |
13,717.2 |
16,982.3 |
45.2 |
23.8 |
|
|
& Related Material |
(27.5) |
(33.5) |
(30.0) |
|
|
|
B. |
Bulk Consumption Goods |
609.7 |
679.2 |
955.9 |
11.4 |
40.7 |
|
|
1. |
Wheat |
0.0 |
0.0 |
12.0 |
— |
— |
|
|
2. |
Cereals & Cereal Preparations |
9.0 |
9.4 |
8.6 |
4.8 |
–8.6 |
|
|
3. |
Edible Oil |
462.2 |
529.8 |
682.8 |
14.6 |
28.9 |
|
|
4. |
Pulses |
92.6 |
139.7 |
252.3 |
50.9 |
80.6 |
|
|
5. |
Sugar |
45.9 |
0.2 |
0.2 |
— |
— |
|
C. |
Other Bulk Items |
3,448.6 |
4,649.3 |
6,922.0 |
34.8 |
48.9 |
|
|
1. |
Fertilisers |
412.2 |
500.5 |
697.3 |
21.4 |
39.3 |
|
|
|
a) Crude |
80.4 |
85.9 |
126.8 |
6.8 |
47.7 |
|
|
|
b) Sulphur & Unroasted Iron Pyrites |
37.4 |
24.4 |
39.4 |
–34.6 |
61.1 |
|
|
|
c) Manufactured |
294.4 |
390.2 |
531.1 |
32.5 |
36.1 |
|
|
2. |
Non-Ferrous Metals |
432.6 |
608.8 |
765.9 |
40.7 |
25.8 |
|
|
3. |
Paper, Paperboard & Mgfd. incl. Newsprint |
251.8 |
313.1 |
334.3 |
24.3 |
6.8 |
|
|
4. |
Crude Rubber, incl. Synthetic & Reclaimed |
120.9 |
139.7 |
180.7 |
15.5 |
29.4 |
|
|
5. |
Pulp & Waste Paper |
144.5 |
151.9 |
176.5 |
5.1 |
16.2 |
|
|
6. |
Metalliferrous Ores & Metal Scrap |
879.0 |
1,603.6 |
2,486.4 |
82.4 |
55.1 |
|
|
7. |
Iron & Steel |
1,207.7 |
1,331.8 |
2,280.8 |
10.3 |
71.3 |
II. |
Non-Bulk Imports |
20,898.4 |
21,889.4 |
31,764.8 |
4.7 |
45.1 |
|
|
|
|
(60.7) |
(53.5) |
(56.1) |
|
|
|
A. |
Capital Goods |
6,919.5 |
9,545.1 |
12,184.7 |
37.9 |
27.7 |
|
|
1. |
Manufactures of Metals |
301.0 |
343.2 |
461.1 |
14.0 |
34.3 |
|
|
2. |
Machine Tools |
228.5 |
282.9 |
404.3 |
23.9 |
42.9 |
|
|
3. |
Machinery except Electrical & Electronics |
2,225.6 |
2,969.8 |
4,018.1 |
33.4 |
35.3 |
|
|
4. |
Electrical Machinery except Electronics |
347.7 |
455.1 |
571.4 |
30.9 |
25.5 |
|
|
5. |
Electronic Goods incl. Computer Software |
2,890.5 |
3,938.8 |
4,930.4 |
36.3 |
25.2 |
|
|
6. |
Transport Equipments |
696.5 |
1,010.3 |
1,493.8 |
45.0 |
47.9 |
|
|
7. |
Project Goods |
229.8 |
545.0 |
305.6 |
137.1 |
–43.9 |
|
B. |
Mainly Export Related Items |
5,036.8 |
4,259.7 |
5,309.5 |
–15.4 |
24.6 |
|
|
1. |
Pearls, Precious & Semi-Precious Stones |
2,746.7 |
1,811.5 |
2,312.2 |
–34.0 |
27.6 |
|
|
2. |
Chemicals, Organic & Inorganic |
1,670.2 |
1,806.8 |
2,346.1 |
8.2 |
29.8 |
|
|
3. |
Textile Yarn, Fabric, etc. |
489.2 |
541.5 |
558.8 |
10.7 |
3.2 |
|
|
4. |
Cashew Nuts, raw |
130.8 |
100.0 |
92.5 |
–23.6 |
–7.5 |
|
C. |
Others |
8,942.0 |
8,084.5 |
14,270.6 |
–9.6 |
76.5 |
|
|
of which: |
|
|
|
|
|
|
|
1. |
Gold & Silver |
4,268.7 |
2,974.7 |
7,043.7 |
–30.3 |
136.8 |
|
|
2. |
Artificial Resins & Plastic Materials |
505.1 |
617.7 |
847.0 |
22.3 |
37.1 |
|
|
3. |
Professional Instruments, etc., except electrical |
470.0 |
556.1 |
729.4 |
18.3 |
31.2 |
|
|
4. |
Coal, Coke & Briquittes, etc. |
958.4 |
1,069.7 |
1,481.3 |
11.6 |
38.5 |
|
|
5. |
Medicinal & Pharmaceutical Products |
217.2 |
282.1 |
373.8 |
29.9 |
32.5 |
|
|
6. |
Chemical Materials & Products |
251.4 |
355.7 |
352.9 |
41.5 |
–0.8 |
|
|
7. |
Non-Metallic Mineral Manufactures |
143.9 |
181.6 |
206.3 |
26.2 |
13.6 |
Total Imports |
34,401.6 |
40,935.1 |
56,625.0 |
19.0 |
38.3 |
Memo Items |
|
|
|
|
|
|
Non-Oil Imports |
24,956.7 |
27,217.8 |
39,642.7 |
9.1 |
45.6 |
|
Non-Oil Imports excl. Gold & Silver |
20,688.0 |
24,243.1 |
32,599.0 |
17.2 |
34.5 |
|
Mainly Industrial Inputs* |
19,313.9 |
22,617.7 |
30,382.6 |
17.1 |
34.3 |
P : Provisional.
* : Non oil imports net of gold and silver, bulk consumption goods, manufactured fertilizers and professional instruments.
Note : Figures in brackets relate to percentage to total imports for the period.
Source : DGCI & S. |
Statement 6 : Direction of India’s Foreign Trade-Imports |
(US $ million) |
Group / Country |
April-June |
Percentage Variation |
|
2005-06 |
2006-07 |
2007-08 P |
(3)/(2) |
(4)/(3) |
1 |
2 |
3 |
4 |
5 |
6 |
I. |
O E C D Countries |
12,644.2 |
13,143.8 |
19,476.0 |
4.0 |
48.2 |
|
A. |
E U |
5,674.4 |
5,923.9 |
7,776.7 |
4.4 |
31.3 |
|
|
of which: |
|
|
|
|
|
|
|
1. |
Belgium |
1,458.4 |
932.2 |
1,294.8 |
–36.1 |
38.9 |
|
|
2. |
France |
380.0 |
460.5 |
525.7 |
21.2 |
14.2 |
|
|
3. |
Germany |
1,417.2 |
1,751.4 |
2,180.9 |
23.6 |
24.5 |
|
|
4. |
Italy |
415.4 |
541.7 |
801.4 |
30.4 |
47.9 |
|
|
5. |
Netherland |
284.0 |
241.3 |
402.7 |
–15.0 |
66.8 |
|
|
6. |
U K |
958.6 |
933.0 |
1,234.4 |
–2.7 |
32.3 |
|
B. |
North America |
2,052.9 |
2,663.4 |
3,085.0 |
29.7 |
15.8 |
|
|
1. |
Canada |
219.6 |
250.5 |
337.3 |
14.1 |
34.6 |
|
|
2. |
U S A |
1,833.3 |
2,412.9 |
2,747.7 |
31.6 |
13.9 |
|
C. |
Asia and Oceania |
2,237.0 |
2,700.5 |
4,168.0 |
20.7 |
54.3 |
|
|
of which: |
|
|
|
|
|
|
|
1. |
Australia |
1,365.0 |
1,524.0 |
2,587.4 |
11.6 |
69.8 |
|
|
2. |
Japan |
825.1 |
1,112.4 |
1,493.4 |
34.8 |
34.3 |
|
D. |
Other O E C D Countries |
2,679.9 |
1,855.9 |
4,446.4 |
–30.7 |
139.6 |
|
|
of which: |
|
|
|
|
|
|
|
1. |
Switzerland |
2,596.9 |
1,700.5 |
3,946.8 |
–34.5 |
132.1 |
II. |
O P E C |
2,679.8 |
13,395.2 |
17,008.6 |
399.9 |
27.0 |
|
of which: |
|
|
|
|
|
|
1. |
Indonesia |
612.7 |
807.0 |
1,247.2 |
31.7 |
54.5 |
|
2. |
Iran |
168.9 |
1,605.8 |
2,426.7 |
850.7 |
51.1 |
|
3. |
Iraq |
0.7 |
1,407.1 |
1,476.3 |
— |
— |
|
4. |
Kuwait |
72.5 |
1,489.7 |
1,470.6 |
1,955.3 |
–1.3 |
|
5. |
Saudi Arabia |
351.0 |
3,259.2 |
3,284.6 |
828.5 |
0.8 |
|
6. |
U A E |
1,266.1 |
2,274.7 |
3,408.6 |
79.7 |
49.8 |
III.Eastern Europe |
1,012.2 |
904.4 |
1,229.6 |
–10.6 |
35.9 |
|
of which: |
|
|
|
|
|
|
1. |
Romania |
88.4 |
57.2 |
121.2 |
–35.3 |
111.9 |
|
2. |
Russia |
522.0 |
376.5 |
474.3 |
–27.9 |
26.0 |
IV. |
Developing Countries |
8,561.5 |
13,372.9 |
18,586.3 |
56.2 |
39.0 |
|
of which: |
|
|
|
|
|
|
A. |
Asia |
6,905.8 |
10,732.3 |
14,621.5 |
55.4 |
36.2 |
|
|
a) |
S A A R C |
311.2 |
398.1 |
396.1 |
27.9 |
–0.5 |
|
|
|
1. Bangladesh |
20.2 |
59.4 |
70.4 |
194.3 |
18.6 |
|
|
|
2. Bhutan |
24.8 |
24.4 |
47.0 |
–1.8 |
92.7 |
|
|
|
3. Maldives |
0.5 |
0.7 |
1.0 |
– |
– |
|
|
|
4. Nepal |
88.4 |
58.5 |
96.8 |
–33.8 |
65.5 |
|
|
|
5. Pakistan |
33.8 |
82.1 |
68.2 |
142.7 |
–16.9 |
|
|
|
6. Sri Lanka |
131.9 |
153.7 |
97.7 |
16.5 |
–36.5 |
|
|
|
7. Afghanistan |
11.5 |
19.3 |
15.0 |
67.5 |
–22.0 |
|
|
b) |
Other Asian Developing Countries |
6,594.6 |
10,334.2 |
14,225.4 |
56.7 |
37.7 |
|
|
|
of which: |
|
|
|
|
|
|
|
|
1. People’s Rep of China |
2,348.6 |
3,650.2 |
6,079.6 |
55.4 |
66.6 |
|
|
|
2. Hong Kong |
499.1 |
565.0 |
709.5 |
13.2 |
25.6 |
|
|
|
3. South Korea |
995.1 |
1,079.4 |
1,375.8 |
8.5 |
27.5 |
|
|
|
4. Malaysia |
595.8 |
1,209.6 |
1,348.6 |
103.0 |
11.5 |
|
|
|
5. Singapore |
776.4 |
1,423.0 |
1,766.6 |
83.3 |
24.2 |
|
|
|
6. Thailand |
299.3 |
389.4 |
547.0 |
30.1 |
40.5 |
|
B. |
Africa |
1,178.6 |
1,567.5 |
2,571.3 |
33.0 |
64.0 |
|
|
of which: |
|
|
|
|
|
|
|
1. |
Benin |
41.1 |
36.3 |
30.8 |
–11.8 |
–15.0 |
|
|
2. |
Egypt Arab Republic |
63.1 |
460.0 |
454.4 |
629.2 |
–1.2 |
|
|
3. |
Kenya |
13.8 |
13.9 |
17.8 |
1.2 |
27.4 |
|
|
4. |
South Africa |
702.2 |
684.9 |
996.9 |
–2.5 |
45.5 |
|
|
5. |
Sudan |
7.9 |
8.9 |
110.3 |
13.1 |
1,132.5 |
|
|
6. |
Tanzania |
8.4 |
10.0 |
14.0 |
19.8 |
39.7 |
|
|
7. |
Zambia |
10.3 |
4.9 |
46.9 |
— |
851.0 |
|
C. |
Latin American Countries |
477.1 |
1,073.2 |
1,393.4 |
124.9 |
29.8 |
V. |
Others |
7.1 |
25.7 |
13.5 |
260.9 |
–47.6 |
VI. |
Unspecified |
9,496.8 |
93.0 |
311.0 |
–99.0 |
234.3 |
Total |
Imports |
34,401.6 |
40,935.1 |
56,625.0 |
19.0 |
38.3 |
P : Provisional.
Note
: The figures for 2006-07, which include country-wise distribution of petroleum imports,
are not strictly comparable with the data for previous years.
Source : DGCI & S. |
* Prepared in the Division of International Trade, Department of Economic Analysis and Policy. Previous issue of the article was published in RBI Bulletin, November 2007. |


