textiles, gems and jewellery and leather have been adversely affected under the impact of demand recession, mainly in the developed regions viz., the EU and the US.
The commodity-wise exports data released by DGCI&S for the period April-October 2008 revealed that manufactured goods continued to maintain largest share at 64.1 per cent, followed by petroleum products (18.9 per cent) and primary products (14.7 per cent). During April-October 2008, engineering goods, agriculture and allied products, chemicals and related products and petroleum products showed accelerated growth in exports, while ores and minerals, leather and manufactures, textile and textile products and gems and jewellery showed deceleration and handicrafts exports declined (Table 2). However, the month of October 2008 witnessed an across-the-board decline in the export of all major commodity
Table 2: India’s Exports of Principal Commodities |
(Percentage Shares) |
Commodity |
2006-07 |
2007-08 |
2007-08 |
2008-09 |
April-March |
April-October |
1 |
2 |
3 |
4 |
5 |
I. Primary products |
15.6 |
16.9 |
14.4 |
14.7 |
Agriculture and allied products |
10.0 |
11.3 |
9.5 |
10.4 |
| Ores and minerals |
5.5 |
5.6 |
4.8 |
4.4 |
| II. Manufactured goods |
67.2 |
63.2 |
65.6 |
64.1 |
| Leather and manufactures |
2.4 |
2.2 |
2.3 |
2.1 |
| Related Chemicals and products |
13.7 |
13.0 |
13.0 |
12.9 |
| Engineering goods |
23.4 |
22.9 |
23.2 |
25.8 |
| Textile and textile products |
13.7 |
11.9 |
12.4 |
10.7 |
| Gems and jewellery |
12.6 |
12.1 |
13.4 |
11.6 |
III.Petroleum products |
14.8 |
17.4 |
17.2 |
18.9 |
IV. Others |
2.4 |
2.5 |
2.8 |
2.3 |
Total Exports |
100.0 |
100.0 |
100.0 |
100.0 |
Source :Compiled from DGCI&S data. |
groups, except engineering goods as compared to October 2007.
Exports of primary products during April-October 2008 at US$ 16.0 billion showed a marginal deceleration in growth to 26.6 per cent from 27.7 per cent during the corresponding period of the previous year. Within primary products, agricultural and allied products exhibited a higher growth of 34.2 per cent than 29.8 per cent a year ago, due to the pick-up in the exports of oil meal, tobacco, coffee, and cashew. The other major commodities such as rice, spices, sugar and mollases and marine products continued to show deceleration/decline in export growth. Exports of ores and minerals grew by 11.6 per cent (23.7 per cent a year back).
Exports of manufactured goods during April-October 2008 at US$ 69.5 billion recorded 20.7 per cent growth, almost the same growth witnessed during the corresponding period of the previous year (20.9 per cent). Within manufactured products, engineering goods and chemicals and related products exhibited higher growth, while textiles and textile products, leather and manufactures and gems and jewellery witnessed deceleration.
Engineering goods exports during April-October 2008 at US$ 28.0 billion, which constituted almost one-fourth of total exports, showed a higher growth of 37.5 per cent than 25.7 per cent a year ago, contributed largely by transport equipments, iron and steel and electronic goods. Exports of transport equipments to the major markets such as Singapore, the US and the UK increased substantially on the back of strong export performance, particularly during the period April-September 2008.
Chemicals and related products exports during April-October 2008 at US$ 14.0 billion grew by 22.4 per cent (18.0 per cent a year ago). The increase in exports was contributed mainly by higher growth in basic chemicals, pharmaceuticals and cosmetics.
Exports of textiles and textile products during April-October 2008 at US$ 11.6 billion witnessed a moderate growth of 6.4 per cent (10.8 per cent a year ago). Readymade garments, which accounted for about 50 per cent share in textiles and textile products exports, showed deceleration in export growth. Among other major components, manmade yarn, fabrics and made-ups and cotton yarn decelerated.
Gems and jewellery exports at US$ 12.6 billion recorded a sharp deceleration to 7.4 per cent during April-October 2008 from 26.9 per cent a year ago reflecting the recessionary conditions in the major export destinations for India’s gems and jewellery viz., Hong Kong, the US and the UAE.
Exports of petroleum products at US$ 20.5 billion witnessed an accelerated growth of 35.3 per cent during April-October 2008 as compared with 31.8 per cent a year ago. The volume of exports, however, showed a decline of 11.1 per cent as against a growth of 22.5 per cent a year ago. Exports to the major markets viz., the UAE, Singapore, and the Netherlands witnessed substantial rise during the period.
Destination-wise, during April-October 2008, developing countries continued to remain the major markets for India’s exports with a share of 40.3 per cent, followed by OECD countries (37.9 per cent)
Table 3: India’s Exports to Principal Regions |
(Percentage Shares) |
Region |
2006-07 |
2007-08 |
2007-08 |
2008-09 |
April-March |
April-October |
1 |
2 |
3 |
4 |
5 |
I. OECD countries |
41.2 |
38.5 |
40.5 |
37.9 |
EU |
20.4 |
20.2 |
21.5 |
21.3 |
North America |
15.8 |
13.5 |
14.5 |
12.5 |
U.S. |
14.9 |
12.7 |
13.7 |
11.8 |
Asia and Oceania |
3.4 |
3.2 |
3.0 |
2.5 |
| Other OECD countries |
1.6 |
1.6 |
1.6 |
1.5 |
II. OPEC |
16.4 |
16.4 |
17.4 |
19.9 |
III. Eastern Europe |
2.0 |
2.1 |
1.1 |
1.2 |
IV. Developing countries |
40.2 |
42.7 |
40.6 |
40.3 |
Asia |
29.8 |
31.6 |
29.5 |
29.4 |
SAARC |
5.1 |
5.9 |
53 |
5.1 |
| Other Asian developing |
|
|
|
|
countries |
24.6 |
25.7 |
24.2 |
24.3 |
Africa |
7.0 |
7.7 |
7.9 |
7.1 |
| Latin American countries |
3.4 |
3.4 |
3.2 |
3.8 |
V. Others / unspecified |
0.3 |
0.4 |
0.4 |
0.7 |
Total Exports |
100.0 |
100.0 |
100.0 |
100.0 |
Source :Compiled from DGCI&S data. |
and OPEC (19.9 per cent). The US with a share of 11.8 per cent continued to be the single largest export destination of India, though its share declined over the previous year (13.7 per cent) [Table 3]. The US was followed by the UAE (11.2 per cent), Singapore (5.3 per cent), China (4.5 per cent) and Hong Kong (3.8 per cent). Region-wise details available for October 2008 indicated that India’s export to major regions except OPEC declined.
Imports
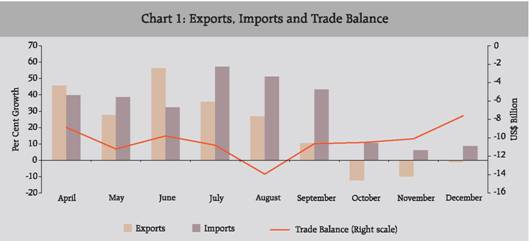
India’s merchandise imports which recorded high growth during April-September 2008 (44.9 per cent), witnessed steady deceleration in growth since October 2008 (10.6 per cent ), November (6.1 per cent), and December (8.8 per cent) reflecting the slowdown in industrial activities. The overall imports during April-December 2008 at US$ 224.4 billion, however, recorded a higher growth of 30.8 per cent than 27.6 per cent a year ago, due to strong import growth during the period April-September 2008. POL imports during April-December 2008 at US$ 78.0 billion, accelerated to 43.3 per cent (24.0 per cent a year ago), largely due to high crude oil prices prevailed during April-September 2008, though the price witnessed sharp decline since October 2008. The average price of Indian basket of crude oil during April-December 2008 stood at US$ 95.5 per barrel (ranged between US$ 40.6 – 132.5 per barrel) which was higher by 27.9 per cent than US$ 74.7 per barrel (ranged between US$ 65.5 – 89.1 per barrel) during April-December 2007 (Table 4). Non-oil imports during April-December 2008 moderated to 25.0 per cent from 29.3 per cent during previous year.
Table 4: Trends in Crude Oil Prices |
(US $/barrel) |
Year |
Dubai |
Brent |
WTI* |
Indian Basket** |
1 |
2 |
3 |
4 |
5 |
2000-01 |
25.9 |
28.1 |
30.3 |
26.8 |
2001-02 |
21.8 |
23.2 |
24.1 |
22.4 |
2002-03 |
25.9 |
27.6 |
29.2 |
26.6 |
2003-04 |
26.9 |
29.0 |
31.4 |
27.8 |
2004-05 |
36.4 |
42.2 |
45.0 |
39.2 |
2005-06 |
53.4 |
58.0 |
59.9 |
55.7 |
2006-07 |
60.9 |
64.4 |
64.7 |
62.4 |
2007-08 |
77.3 |
82.4 |
82.3 |
79.5 |
| April-December 2007 |
72.6 |
77.6 |
77.0 |
74.7 |
| April-December 2008 |
94.6 |
98.0 |
100.1 |
95.5 |
December 2007 |
85.8 |
91.5 |
91.4 |
87.9 |
December 2008 |
41.0 |
41.6 |
41.4 |
40.6 |
* : West Texas Intermediate.
** : The composition of Indian basket of crude represents average of Oman and Dubai for sour grades and Brent (dated) for sweet grade in the ratio of 62.3:37.7 for 2008-09.
Sources:International Monetary Fund, International Financial Statistics, World Bank’s Commodity
Price Pink Sheet January 2009. |
Commodity wise imports data for the period April-October 2008 indicated that POL imports showed sharp rise of 69.1 per cent as compared with 17.1 per cent a year ago on account of high international crude oil prices. Non-POL imports witnessed moderation in growth (from 33.3 per cent to 24.6 per cent), mainly due to decline in imports of pearls, precious and semiprecious stones and gold and silver. The period (April-October 2008) also witnessed deceleration/decline in imports of capital goods such as electronic goods and transport equipments, while chemicals and fertilizers recorded higher growth.
Source-wise, during April-October 2008, OPEC had the highest share in India’s imports (36.6 per cent), followed by developing countries (31.1 per cent) and OECD countries (29.6 per cent) [Table 6]. China was the single largest source of imports, with the share of 10.3 per cent in
Table 5: Imports of Principal Commodities |
(Percentage Shares) |
Commodity |
2006-07 |
2007-08 |
2007-08 |
2008-09 |
April-March |
April-October |
1 |
2 |
3 |
4 |
5 |
1.Petroleum, crude and products |
30.8 |
31.7 |
30.9 |
37.8 |
| 2.Capital goods |
253 |
28.2 |
23.2 |
20.1 |
| 3.Gold and silver |
7.9 |
7.1 |
9.5 |
6.2 |
| 4.Organic and inorganic chemicals |
4.2 |
3.9 |
4.2 |
4.7 |
| 5.Coal, coke and briquettes, etc. |
2.5 |
2.6 |
2.6 |
3.7 |
| 6.Fertilizers |
1.7 |
2.2 |
2.2 |
5.4 |
7.Metalliferrous ores, metal scrap, etc. |
4.5 |
3.1 |
3.5 |
2.9 |
8.Iron and steel |
3.5 |
3.5 |
3.9 |
33 |
9. Pearls, precious and semi precious stone |
4.0 |
3.2 |
4.1 |
2.6 |
10.Others |
19.6 |
18.7 |
21.9 |
18.4 |
Total Imports |
100.0 |
100.0 |
100.0 |
100.0 |
Source:DGCI&S. |
Table 6: Shares of Groups/Countries in India’s Imports |
(Percentage Shares) |
Group/Country |
2006-07 |
2007-08 |
2007-08 |
2008-09 |
April-March |
April-October |
1 |
2 |
3 |
4 |
5 |
I. O E C D Countries |
34.5 |
34.8 |
34.2 |
29.6 |
E U |
153 |
14.6 |
14.7 |
12.1 |
France |
2.3 |
2.5 |
1.0 |
0.9 |
Germany |
4.1 |
3.9 |
3.9 |
3.4 |
U K |
2.2 |
2.0 |
2.3 |
1.7 |
North America |
73 |
9.1 |
6.7 |
6.3 |
U S A |
6.3 |
8.4 |
5.9 |
5.7 |
Asia and Oceania |
6.4 |
5.8 |
6.6 |
5.9 |
| Other O E C D Countries |
5.5 |
5.2 |
6.3 |
53 |
II. O P E C |
30.2 |
30.3 |
30.5 |
36.6 |
III. Eastern Europe |
2.7 |
2.1 |
1.6 |
2.4 |
IV. Developing Countries |
32.2 |
32.1 |
33.3 |
31.1 |
Asia |
25.5 |
25.5 |
26.9 |
25.0 |
S A A R C |
0.8 |
0.8 |
0.8 |
0.6 |
| Other Asian |
|
|
|
|
| Developing Countries |
24.7 |
24.7 |
26.1 |
24.4 |
Of which: |
|
|
|
|
| People’s Rep of China |
9.4 |
10.8 |
11.5 |
10.3 |
Africa |
3.7 |
4.1 |
4.1 |
43 |
| Latin American Countries |
3.0 |
2.4 |
2.3 |
1.8 |
Total Imports |
100.0 |
100.0 |
100.0 |
100.0 |
Source: Compiled from DGCI&S data. |
total imports during April-October 2008, followed by Saudi Arabia (8.2 per cent), the UAE (6.2 per cent), the US (5.7 per cent), Iran (4.8 per cent) and Switzerland (4.3 per cent).
Trade Deficit
The overall trade deficit during April-December 2008 amounted to US$ 93.5 billion, showing an increase of US$ 34.5 billion (58.5 per cent) over the trade deficit of US$ 59.0 billion during April-December 2007. Trade deficit on oil account during April-October 2008 stood at US$ 49.2 billion, higher by US$ 23.1 billion than US$ 26.0 billion a year ago. Trade deficit on non-oil account during this period amounted to US$ 26.7 billion, higher by US$ 7.3 billion than US$ 19.3 billion a year back.
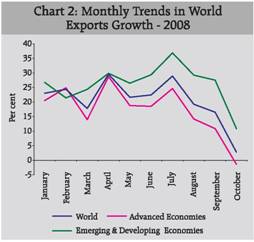
Global Trade
The persisting global economic slowdown began to impinge the world merchandise trade, particularly since August 2008. According to the International Monetary Fund’s (IMF) International Financial Statistics (IFS), world merchandise exports, in dollar terms, which grew on an average 22.6 per cent during January-September, decelerated to 2.7 per cent in October 2008. Exports from emerging and developing economies grew by 10.8 per cent, while that from advanced economies recorded a negative growth (-1.4 per cent) during October 2008 (Chart 2). However, overall exports during January-October 2008 still recorded a higher growth of 20.3 per cent than 14.8 cent a year ago, mainly because of the higher export growth recorded in the first half of 2008. Exports from advanced economies maintained a growth of 16.9 per cent (13.4 per cent a year ago), while that of emerging and developing economies grew by 26.2 per cent, as against 17.4 per cent growth recorded in January-October 2007 (Table 7). |
Statement 1 : India’s Foreign Trade - December 2008 |
Year |
Exports |
Imports |
Trade Balance |
Total |
Oil |
Non-Oil |
Total |
Oil |
Non-Oil |
Total |
Oil |
Non-Oil |
1 |
2 |
3 |
4 |
5 |
6 |
7 |
8 |
9 |
10 |
|
|
Rupees crore |
2006-07 |
47,368 |
6,666 |
40,702 |
66,848 |
19,828 |
47,020 |
-19,479 |
-13,162 |
-6,318 |
| |
(12.4) |
(39.5) |
(8.9) |
(18.2) |
(16.9) |
(18.8) |
|
|
|
2007-08 R |
50,580 |
9,005 |
41,575 |
73,395 |
26,913 |
46,482 |
-22,815 |
-17,908 |
-4,907 |
| |
(6.8) |
(35.1) |
(2.1) |
(9.8) |
(35.7) |
(-1.1) |
|
|
|
2008-09 P |
61,715 |
.. |
.. |
98,515 |
22,919 |
75,596 |
-36,800 |
|
|
| |
(22.0) |
|
|
(34.2) |
(-14.8) |
(62.6) |
|
|
|
US dollar million |
2006-07 |
10,612 |
1,494 |
9,119 |
14,977 |
4,442 |
10,534 |
-4,364 |
-2,949 |
-1415 |
| |
(14.9) |
(42.7) |
(11.4) |
(20.9) |
(19.5) |
(21.5) |
|
|
|
2007-08 R |
12,825 |
2,283 |
10,541 |
18,610 |
6,824 |
11,786 |
-5,785 |
-4,541 |
-1,244 |
| |
(20.8) |
(52.9) |
(15.6) |
(24.3) |
(53.6) |
(11.9) |
(32.6) |
|
|
2008-09 P |
12,690 |
.. |
.. |
20,256 |
4,712 |
15,544 |
-7,567 |
|
|
| |
(-1.1) |
|
|
(8.8) |
(-30.9) |
(31.9) |
(30.8) |
|
|
SDR million |
2006-07 |
7,038 |
990 |
6,048 |
9,932 |
2,946 |
6,986 |
-2,894 |
-1,956 |
-939 |
| |
(9.1) |
(35.4) |
(5.7) |
(14.7) |
(13.4) |
(15.3) |
|
|
|
2007-08 R |
8,131 |
1,448 |
6,684 |
11,799 |
4,327 |
7,473 |
-3,668 |
-2,879 |
-789 |
| |
(15.5) |
(46.2) |
(10.5) |
(18.8) |
(46.9) |
(7.0) |
|
|
|
2008-09 P |
8,335 |
|
|
13,305 |
3,095 |
10,210 |
-4,970 |
|
|
| |
(2.5) |
|
|
(12.8) |
(-28.5) |
(36.6) |
|
|
|
P : Provisional. R : Revised. .. : Not available.
Note :Figures in brackets relate to percentage variation over the corresponding previous period. Source :DGCI & S. |
Statement 2 : India’s Foreign Trade |
Year |
Exports |
Imports |
Trade Balance |
Total |
Oil |
Non-Oil |
Total |
Oil |
Non-Oil |
Total |
Oil |
Non-Oil |
1 |
2 |
3 |
4 |
5 |
6 |
7 |
8 |
9 |
10 |
April-March |
Rupees crore |
2005-06 |
456,418 |
51,533 |
404,885 |
660,409 |
194,640 |
465,769 |
-203,991 |
-143,107 |
-60,884 |
| |
(21.6) |
(64.1) |
(17.7) |
(31.8) |
(45.2) |
(26.9) |
|
|
|
2006-07 R |
571,779 |
84,520 |
487,259 |
840,506 |
258,572 |
581,935 |
-268,727 |
-174,052 |
-94,675 |
| |
(25.3) |
(64.0) |
(20.3) |
(27.3) |
(32.8) |
(24.9) |
|
|
|
2007-08 P |
655,864 |
114,192 |
541,672 |
1,012,312 |
320,655 |
691,657 |
-356,448 |
-206,463 |
-149,985 |
| |
(14.7) |
(35.1) |
(11.2) |
(20.4) |
(24.0) |
(18.9) |
|
|
|
| |
US dollar million |
2005-06 |
103,091 |
11,640 |
91,451 |
149,166 |
43,963 |
105,203 |
-46,075 |
-32,323 |
-13,752 |
| |
(23.4) |
(66.5) |
(19.5) |
(33.8) |
(47.3) |
(28.8) |
|
|
|
2006-07 R |
126,361 |
18,679 |
107,683 |
185,749 |
57,144 |
128,606 |
-59,388 |
-38,465 |
-20,923 |
| |
(22.6) |
(60.5) |
(17.7) |
(24.5) |
(30.0) |
(22.2) |
|
|
|
2007-08 P |
162,904 |
28,363 |
134,541 |
251,439 |
79,645 |
171,795 |
-88,535 |
-51,281 |
-37,254 |
| |
(28.9) |
(51.8) |
(24.9) |
(35.4) |
(39.4) |
(33.6) |
|
|
|
SDR million |
2005-06 |
70,774 |
7,991 |
62,783 |
102,405 |
30,182 |
72,224 |
-31,632 |
-22,191 |
-9,441 |
| |
(26.2) |
(70.3) |
(22.2) |
(36.8) |
(50.6) |
(31.7) |
|
|
|
2006-07 R |
85,018 |
12,567 |
72,451 |
124,975 |
38,447 |
86,528 |
-39,957 |
-25,880 |
-14,077 |
| |
(20.1) |
(57.3) |
(15.4) |
(22.0) |
(27.4) |
(19.8) |
|
|
|
2007-08 P |
104,686 |
18,227 |
86,459 |
161,581 |
51,181 |
110,399 |
-56,895 |
-32,955 |
-23,940 |
| |
(23.1) |
(45.0) |
(19.3) |
(29.3) |
(33.1) |
(27.6) |
|
|
|
April-December |
Rupees crore |
2006-07 |
416,686 |
65,328 |
351,357 |
613,523 |
200,090 |
413,433 |
-196,837 |
-134,762 |
-62,075 |
| |
(28.6) |
(80.1) |
(22.1) |
(27.1) |
(43.7) |
(20.4) |
|
|
|
2007-08 R |
454,997 |
78,920 |
376,077 |
693,445 |
219,897 |
473,548 |
-238,448 |
-140,978 |
-97,470 |
| |
(9.2) |
(20.8) |
(7.0) |
(13.0) |
(9.9) |
(14.5) |
|
|
|
2008-09 P |
585,593 |
.. |
.. |
1,003,947 |
348,868 |
655,079 |
-418,354 |
|
|
| |
(28.7) |
|
|
(44.8) |
(58.7) |
(38.3) |
|
|
|
US dollar million |
2006-07 |
91,361 |
14,324 |
77,038 |
134,519 |
43,871 |
90,648 |
-43,158 |
-29,547 |
-13,610 |
| |
(24.7) |
(74.6) |
(18.4) |
(23.3) |
(39.4) |
(16.8) |
|
|
|
2007-08 R |
112,603 |
19,531 |
93,072 |
171,614 |
54,420 |
117,194 |
-59,011 |
-34,889 |
-24,122 |
| |
(23.2) |
(36.4) |
(20.8) |
(27.6) |
(24.0) |
(29.3) |
(36.7) |
|
|
2008-09 P |
130,909 |
20454* |
87953* |
224,432 |
77,989 |
146,442 |
-93,523 |
|
|
| |
(16.3) |
(35.3) |
(21.0) |
(30.8) |
(43.3) |
(25.0) |
(58.5) |
|
|
SDR million |
2006-07 |
61,653 |
9,666 |
51,987 |
90,777 |
29,605 |
61,172 |
-29,124 |
-19,939 |
-9,185 |
| |
(23.1) |
(72.3) |
(16.9) |
(21.7) |
(37.5) |
(15.2) |
|
|
|
2007-08 R |
73,055 |
12,671 |
60,384 |
111,341 |
35,307 |
76,034 |
-38,286 |
-22,636 |
-15,650 |
| |
(18.5) |
(31.1) |
(16.2) |
(22.7) |
(19.3) |
(24.3) |
|
|
|
2008-09 P |
83,338 |
.. |
.. |
142,875 |
49,649 |
93,226 |
-59,537 |
|
|
| |
(14.1) |
|
|
(28.3) |
(40.6) |
(22.6) |
|
|
|
P : Provisional. R : Revised. .. : Not available.* : Figures pertain to the month of April-October.
Note :1. Figures in brackets relate to percentage variation over the corresponding period of the previous year.
2. Data conversion has been done using period average exchange rates.
Source :DGCI & S. |
Statement 3 : India’s Exports of Principal Commodities |
(US$ million) |
Commodity/Group |
April-October |
Percentage |
Variation |
2006-07 |
2007-08 |
2008-09 P |
(3)/(2) |
(4)/(3) |
1 |
2 |
3 |
4 |
5 |
6 |
I. Primary Products |
9,878.5 |
12,611.8 |
15,963.9 |
27.7 |
26.6 |
|
(13.9) |
(14.4) |
(14.7) |
|
|
A. Agricultural & Allied Products |
6,454.1 |
8,377.0 |
11,239.4 |
29.8 |
34.2 |
of which : |
(9.1) |
(9.5) |
(10.4) |
(4.9) |
(8.7) |
1. |
Tea |
274.4 |
284.0 |
356.6 |
3.5 |
25.6 |
2. |
Coffee |
261.9 |
242.1 |
326.4 |
-7.6 |
34.8 |
3. |
Rice |
831.6 |
1,375.2 |
1,504.2 |
65.4 |
9.4 |
4. |
Wheat |
7.0 |
0.0 |
0.1 |
-99.4 |
46.0 |
5. |
Cotton Raw incl. Waste |
372.4 |
294.7 |
386.3 |
-20.9 |
31.1 |
6. |
Tobacco |
2193 |
277.2 |
446.2 |
26.4 |
61.0 |
7. |
Cashew incl. CNSL |
319.7 |
303.6 |
424.1 |
-5.0 |
39.7 |
8. |
Spices |
363.4 |
758.1 |
862.1 |
108.6 |
13.7 |
9. |
Oil Meal |
441.9 |
555.0 |
1,208.1 |
25.6 |
117.7 |
10 |
Marine Products |
958.1 |
1,076.0 |
972.0 |
12.3 |
-9.7 |
11 |
Sugar & Mollases |
525.2 |
718.0 |
974.5 |
36.7 |
35.7 |
B. Ores & Minerals |
3,424.4 |
4,234.8 |
4,724.6 |
23.7 |
11.6 |
of which : |
(4.8) |
(4.8) |
(4.4) |
|
|
1. |
Iron Ore |
1,779.9 |
2,320.4 |
2,559.4 |
30.4 |
10.3 |
2. |
Processed Minerals |
775.4 |
736.7 |
927.6 |
-5.0 |
25.9 |
II. Manufactured Goods |
47,673.5 |
57,620.4 |
69,533.2 |
20.9 |
20.7 |
of which : |
(67.2) |
(65.6) |
(64.1) |
|
|
A. Leather & Manufactures |
1,719.9 |
1,997.1 |
2,222.9 |
16.1 |
11.3 |
B. Chemicals & Related Products |
9,686.1 |
11,427.6 |
13,984.2 |
18.0 |
22.4 |
1. |
Basic Chemicals, Pharmaceuticals & Cosmetics |
6,072.9 |
7,453.6 |
9,392.6 |
22.7 |
26.0 |
2. |
Plastic & Linoleum |
1,855.3 |
1,868.8 |
2,006.5 |
0.7 |
7.4 |
3. |
Rubber, Glass, Paints & Enamels etc., |
1,344.0 |
1,632.7 |
1,852.0 |
21.5 |
13.4 |
4. |
Residual Chemicals & Allied Products |
413.9 |
472.5 |
733.1 |
14.2 |
55.2 |
C. Engineering Goods |
16,213.4 |
20,379.7 |
28,022.9 |
25.7 |
37.5 |
of |
which : |
|
|
|
|
|
1. |
Manufactures of metals |
2,813.2 |
3,772.1 |
4,657.6 |
34.1 |
23.5 |
2. |
Machinery & Instruments |
3,784.6 |
4,933.5 |
6,361.3 |
30.4 |
28.9 |
3. |
Transport equipments |
2,634.1 |
3,704.4 |
6,408.9 |
40.6 |
73.0 |
4. |
Iron & steel |
2,932.9 |
3,108.9 |
4,372.0 |
6.0 |
40.6 |
5. |
Electronic goods |
1,604.3 |
1,820.7 |
2,609.9 |
13.5 |
43.3 |
D. Textiles and Textile Products |
9,868.5 |
10,930.7 |
11,632.0 |
10.8 |
6.4 |
1. |
Cotton Yarn, Fabrics, Made-ups, etc., |
2,444.5 |
2,589.9 |
2,684.0 |
5.9 |
3.6 |
2. |
Natural Silk Yarn, Fabrics Madeups etc. (incl.silk waste) |
254.7 |
222.9 |
229.2 |
-12.5 |
2.8 |
3. |
Manmade Yarn, Fabrics, Made-ups, etc., |
1,233.7 |
1,643.8 |
1,919.1 |
33.2 |
16.7 |
4. |
Manmade Staple Fibre |
94.8 |
139.4 |
182.6 |
47.0 |
31.0 |
5. |
Woolen Yarn, Fabrics, Madeups etc. |
49.7 |
49.4 |
60.6 |
-0.7 |
22.8 |
6. |
Readymade Garments |
5,005.9 |
5,457.4 |
5,784.1 |
9.0 |
6.0 |
7. |
Jute & Jute Manufactures |
176.4 |
190.8 |
205.3 |
8.1 |
7.6 |
8. |
Coir & Coir Manufactures |
80.5 |
91.8 |
89.5 |
14.1 |
-2.5 |
9. |
Carpets |
528.2 |
545.3 |
477.7 |
3.2 |
-12.4 |
|
(a) Carpet Handmade |
514.2 |
536.3 |
473.8 |
4.3 |
-11.7 |
|
(b) Carpet Millmade |
0.0 |
0.0 |
0.0 |
— |
— |
|
(c) Silk Carpets |
14.1 |
8.9 |
3.9 |
-36.7 |
-55.7 |
E. Gems & Jewellery |
9,259.2 |
11,747.2 |
12,622.3 |
26.9 |
7.4 |
F. Handicrafts |
275.6 |
382.2 |
187.9 |
38.7 |
-50.8 |
III. Petroleum Products |
11,467.1 |
15,116.4 |
20,453.8 |
31.8 |
35.3 |
| |
(16.2) |
(17.2) |
(18.9) |
(6.5) |
(9.6) |
IV. Others |
1,932.3 |
2,456.8 |
2,456.1 |
27.1 |
0.0 |
| |
(2.7) |
(2.8) |
(2.3) |
|
|
Total Exports |
70,951.4 |
87,805.4 |
108,407.0 |
23.8 |
23.5 |
P : Provisional.
Note :Figures in brackets relate to percentage to total exports for the period.
Source :DGCI & S. |
Statement 4 : Direction of India’s Foreign Trade - Exports |
(US$ million) |
Group/Country |
April-October |
Percentage |
Variation |
2006-07 |
2007-08 |
2008-09 P |
(3)/(2) |
(4)/(3) |
1 |
2 |
3 |
4 |
5 |
6 |
I. O E C D Countries |
29,835.4 |
35,586.8 |
41,039.6 |
19.3 |
15.3 |
A. E U |
14,740.8 |
18,840.2 |
23,083.5 |
27.8 |
22.5 |
of which: |
|
|
|
|
|
1. Belgium |
1,889.0 |
2,428.6 |
2,995.0 |
28.6 |
23.3 |
2. France |
1,200.4 |
1,393.0 |
1,686.8 |
16.0 |
21.1 |
3. Germany |
2,199.4 |
2,845.3 |
3,488.0 |
29.4 |
22.6 |
4. Italy |
1,963.0 |
2,204.7 |
2,356.0 |
12.3 |
6.9 |
5. Netherland |
1,395.3 |
2,506.6 |
3,894.0 |
79.6 |
55.3 |
6. U K |
3,099.9 |
3,794.6 |
3,780.5 |
22.4 |
-0.4 |
B. North America |
11,650.1 |
12,727.6 |
13,561.0 |
9.2 |
6.5 |
1. Canada |
654.0 |
716.2 |
802.5 |
9.5 |
12.1 |
2. U S A |
10,996.17 |
12,011.44 |
12,758.45 |
9.2 |
6.2 |
C. Asia and Oceania |
2,481.4 |
2,651.0 |
2,734.3 |
6.8 |
3.1 |
of which: |
|
|
|
|
|
1. Australia |
524.6 |
674.3 |
810.5 |
28.5 |
20.2 |
2. Japan |
1,507.4 |
1,895.4 |
1,797.0 |
25.7 |
-5.2 |
D. Other O E C D Countries |
963.1 |
1,368.0 |
1,660.8 |
42.1 |
21.4 |
of which: |
|
|
|
|
|
1. Switzerland |
241.7 |
341.0 |
392.6 |
41.1 |
15.1 |
II. O P E C |
12,140.6 |
15,309.8 |
21,576.8 |
26.1 |
40.9 |
of which: |
|
|
|
|
|
1. Indonesia |
1,013.6 |
971.3 |
1,645.6 |
-4.2 |
69.4 |
2. Iran |
977.7 |
1,424.2 |
1,570.3 |
45.7 |
10.3 |
3. Iraq |
111.5 |
117.0 |
231.5 |
4.9 |
97.9 |
4. Kuwait |
351.8 |
370.7 |
483.9 |
5.4 |
30.5 |
5. Saudi Arabia |
1,394.1 |
1,965.8 |
3,580.5 |
41.0 |
82.1 |
6. U A E |
7,144.5 |
8,966.5 |
12,140.3 |
25.5 |
35.4 |
III. Eastern Europe |
858.6 |
976.4 |
1,297.9 |
13.7 |
32.9 |
of which: |
|
|
|
|
|
1 Russia |
489.1 |
506.6 |
680.8 |
3.6 |
34.4 |
IV. Developing Countries |
27,985.9 |
35,616.9 |
43,719.6 |
27.3 |
22.7 |
of which: |
|
|
|
|
|
A. Asia |
20,754.2 |
25,860.9 |
31,888.1 |
24.6 |
23.3 |
a) S A A R C |
3,678.5 |
4,635.1 |
5,539.5 |
26.0 |
19.5 |
1. Afghanistan |
91.9 |
136.6 |
215.3 |
48.6 |
57.6 |
2. Bangladesh |
919.8 |
1,241.4 |
1,623.5 |
35.0 |
30.8 |
3. Bhutan |
27.7 |
49.1 |
63.4 |
- |
29.1 |
4. Maldives |
39.4 |
48.2 |
64.8 |
22.3 |
34.3 |
5. Nepal |
546.9 |
752.8 |
977.7 |
37.7 |
29.9 |
6. Pakistan |
789.3 |
917.1 |
914.0 |
16.2 |
-0.3 |
7 Sri Lanka |
1,263.4 |
1,489.7 |
1,680.8 |
17.9 |
12.8 |
b) Other Asian Developing Countries |
17,075.7 |
21,225.8 |
26,348.6 |
24.3 |
24.1 |
of which: |
|
|
|
|
|
1. People’s Rep of China |
4,015.5 |
4,718.3 |
4,829.6 |
17.5 |
2.4 |
2. Hong Kong |
2,633.3 |
3,532.6 |
4,154.9 |
34.1 |
17.6 |
3. South Korea |
1,267.1 |
1,362.9 |
2,216.4 |
7.6 |
62.6 |
4. Malaysia |
688.1 |
1,237.3 |
1,712.4 |
79.8 |
38.4 |
5. Singapore |
3,846.6 |
3,831.8 |
5,750.1 |
-0.4 |
50.1 |
6. Thailand |
795.4 |
1,014.9 |
1,246.4 |
27.6 |
22.8 |
B. Africa |
4,899.8 |
6,948.3 |
7,709.7 |
41.8 |
11.0 |
of which: |
|
|
|
|
|
1. Benin |
82.7 |
131.6 |
121.6 |
59.2 |
-7.6 |
2. Egypt Arab Republic |
379.6 |
757.6 |
1,134.7 |
99.6 |
49.8 |
3. Kenya |
877.1 |
720.4 |
937.3 |
-17.9 |
30.1 |
4. South Africa |
1,365.0 |
1,466.9 |
1,274.9 |
7.5 |
-13.1 |
5. Sudan |
234.8 |
223.0 |
265.7 |
-5.0 |
19.2 |
6. Tanzania |
169.7 |
326.1 |
704.4 |
92.2 |
116.0 |
7. Zambia |
68.0 |
90.6 |
62.1 |
33.2 |
-31.4 |
C. Latin American Countries |
2,331.9 |
2,807.6 |
4,121.8 |
20.4 |
46.8 |
V. Others |
68.3 |
182.1 |
339.8 |
166.5 |
86.6 |
VI. Unspecified |
62.5 |
133.5 |
433.3 |
113.5 |
224.7 |
Total Exports |
70,951.4 |
87,805.4 |
108,407.0 |
23.8 |
23.5 |
P : Provisional. Source :DGCI & S. |
Statement 5 : India’s Imports of Principal Commodities |
(US$ million) |
Commodity/Group |
April-October |
Percentage |
Variation |
| |
2006-07 |
2007-08 |
2008-09 P |
(3)/(2) |
(4)/(3) |
1 |
2 |
3 |
4 |
5 |
6 |
I. Bulk Imports |
49,405.1 |
60,204.2 |
98,010.1 |
21.9 |
62.8 |
| |
(47.4) |
(45.2) |
(53.2) |
|
|
A. Petroleum, Petroleum Products |
35,135.52 |
41,150.70 |
69,605.15 |
17.1 |
69.1 |
& Related Material |
(33.7) |
(30.9) |
(37.8) |
|
|
B. Bulk Consumption Goods |
1,964.6 |
2,553.8 |
2,611.3 |
30.0 |
2.3 |
1. Wheat |
189.3 |
117.3 |
0.0 |
-38.0 |
-100.0 |
2. Cereals & Cereal Preparations |
21.2 |
21.5 |
25.7 |
1.5 |
19.4 |
3. Edible Oil |
1,359.4 |
1,673.5 |
1,868.0 |
23.1 |
11.6 |
4. Pulses |
394.1 |
741.0 |
710.6 |
88.0 |
-4.1 |
5. Sugar |
0.6 |
0.5 |
7.0 |
-28.8 |
1,432.3 |
C. Other Bulk Items |
12,304.9 |
16,499.8 |
25,793.7 |
34.1 |
56.3 |
1. Fertilisers |
1,897.7 |
2,965.3 |
9,961.2 |
56.3 |
235.9 |
a) Crude |
213.6 |
242.5 |
647.7 |
13.5 |
167.1 |
b) Sulphur & Unroasted Iron Pyrites |
61.3 |
129.7 |
592.7 |
111.5 |
357.1 |
c) Manufactured |
1,622.8 |
2,593.2 |
8,720.7 |
59.8 |
236.3 |
2. Non-Ferrous Metals |
1,473.3 |
1,964.8 |
2,083.1 |
33.4 |
6.0 |
3. Paper, Paperboard & Mgfd. incl. Newsprint |
750.5 |
827.3 |
1,168.4 |
10.2 |
41.2 |
4. Crude Rubber, incl. Synthetic & Reclaimed |
337.8 |
437.8 |
672.9 |
29.6 |
53.7 |
5. Pulp & Waste Paper |
362.7 |
454.4 |
516.6 |
25.3 |
13.7 |
6. Metalliferrous Ores & Metal Scrap |
4,049.5 |
4,661.1 |
5,375.7 |
15.1 |
15.3 |
7. Iron & Steel |
3,433.3 |
5,189.1 |
6,015.9 |
51.1 |
15.9 |
II. Non-Bulk Imports |
54,725.1 |
72,945.2 |
86,199.0 |
33.3 |
18.2 |
|
(52.6) |
(54.8) |
(46.8) |
|
|
A. Capital Goods |
23,167.3 |
30,928.2 |
37,080.1 |
33.5 |
19.9 |
1. Manufactures of Metals |
829.3 |
1,253.2 |
1,936.4 |
51.1 |
54.5 |
2. Machine Tools |
800.7 |
1,141.8 |
1,447.5 |
42.6 |
26.8 |
3. Machinery except Electrical & Electronics |
7,468.1 |
10,044.6 |
13,291.9 |
34.5 |
32.3 |
4. Electrical Machinery except Electronics |
1,119.2 |
1,624.8 |
1,995.2 |
45.2 |
22.8 |
5. Electronic Goods incl. Computer Software |
9,732.2 |
12,659.9 |
12,324.1 |
30.1 |
-2.7 |
6. Transport Equipments |
2,219.0 |
3,457.5 |
4,316.0 |
55.8 |
24.8 |
7. Project Goods |
998.8 |
746.3 |
1,768.9 |
-25.3 |
137.0 |
B. Mainly Export Related Items |
10,390.9 |
12,843.1 |
15,313.3 |
23.6 |
19.2 |
1. Pearls, Precious & Semi-Precious Stones |
4,254.5 |
5,486.4 |
4,724.2 |
29.0 |
-13.9 |
2. Chemicals, Organic & Inorganic |
4,544.8 |
5,649.9 |
8,669.4 |
24.3 |
53.4 |
3. Textile Yarn, Fabric, etc. |
1,308.7 |
1,444.0 |
1,505.2 |
10.3 |
4.2 |
4. Cashew Nuts, raw |
282.9 |
262.7 |
414.6 |
-7.2 |
57.8 |
C. Others |
21,166.9 |
29,174.0 |
33,805.6 |
37.8 |
15.9 |
of which : |
|
|
|
|
|
1. Gold & Silver |
8,936.2 |
12,709.8 |
11,359.2 |
42.2 |
-10.6 |
2. Artificial Resins & Plastic Materials |
1,522.5 |
2,101.9 |
2,460.9 |
38.1 |
17.1 |
| 3. Professional Instruments etc. except electrical |
1,317.9 |
1,725.8 |
2,252.3 |
30.9 |
30.5 |
4. Coal, Coke & Briquittes etc. |
2,543.4 |
3,465.0 |
6,787.8 |
36.2 |
95.9 |
5. Medicinal & Pharmaceutical Products |
662.8 |
982.4 |
1,075.1 |
48.2 |
9.4 |
6. Chemical Materials & Products |
798.8 |
931.2 |
1,283.0 |
16.6 |
37.8 |
7. Non-Metallic Mineral Manufactures |
444.4 |
577.7 |
728.2 |
30.0 |
26.1 |
Total Imports |
104,130.2 |
133,149.4 |
184,209.2 |
27.9 |
38.3 |
Memo Items |
Non-Oil Imports |
68,994.6 |
91,998.7 |
114,604.0 |
33.3 |
24.6 |
Non-Oil Imports excl. Gold & Silver |
60,058.5 |
79,289.0 |
103,244.9 |
32.0 |
30.2 |
Mainly Industrial Inputs* |
55,153.1 |
72,416.2 |
89,660.5 |
31.3 |
23.8 |
P : Provisional.
* : Non oil imports net of gold and silver, bulk consumption goods, manufactured fertilizers and professional instruments.
Note :Figures in brackets relate to percentage to total imports for the period.
Source :DGCI & S. |
Statement 6 : Direction of India’s Foreign Trade-Imports |
| (US$ million) |
Group / Country |
April-October |
Percentage |
Variation |
2006-07 |
2007-08 |
2008-09 P |
(3)/(2) |
(4)/(3) |
1 |
2 |
3 |
4 |
5 |
6 |
I. O E C D Countries |
34,1493 |
45,521.3 |
54,533.7 |
33.3 |
19.8 |
A. E U |
15,093.5 |
19,507.6 |
22,268.3 |
29.2 |
14.2 |
of which: |
|
|
|
|
|
1. Belgium |
2,285.8 |
3,066.9 |
2,892.6 |
34.2 |
-5.7 |
2. France |
1,198.4 |
1,369.6 |
1,635.7 |
14.3 |
19.4 |
3. Germany |
4,150.5 |
5,185.4 |
6,272.1 |
24.9 |
21.0 |
4. Italy |
1,460.7 |
2,077.2 |
2,737.2 |
42.2 |
31.8 |
5. Netherland |
624.5 |
924.5 |
1,054.0 |
48.0 |
14.0 |
6. U K |
2,292.5 |
3,000.9 |
3,171.3 |
30.9 |
5.7 |
B. North America |
6,666.9 |
8,859.9 |
11,671.7 |
32.9 |
31.7 |
1. Canada |
731.8 |
1,021.3 |
1,212.9 |
39.6 |
18.8 |
2. U S A |
5,935.16 |
7,838.66 |
10,458.79 |
32.1 |
33.4 |
C. Asia and Oceania |
6,792.3 |
8,811.1 |
10,809.2 |
29.7 |
22.7 |
of which: |
|
|
|
|
|
1. Australia |
4,099.7 |
5,060.2 |
5,941.1 |
23.4 |
17.4 |
2. Japan |
2,534.7 |
3,551.1 |
4,600.8 |
40.1 |
29.6 |
D. Other O E C D Countries |
5,596.5 |
8,342.7 |
9,784.6 |
49.1 |
17.3 |
of which: |
|
|
|
|
|
1. Switzerland |
5,274.7 |
6,855.1 |
7,946.9 |
30.0 |
15.9 |
II. O P E C |
33,757.2 |
40,665.0 |
67,343.2 |
20.5 |
65.6 |
of which: |
|
|
|
|
|
1. Indonesia |
2,092.5 |
2,730.1 |
3,949.2 |
30.5 |
44.7 |
2. Iran |
4,491.5 |
5,594.6 |
8,774.4 |
24.6 |
56.8 |
3. Iraq |
3,517.8 |
3,319.8 |
6,101.0 |
-5.6 |
83.8 |
4. Kuwait |
3,472.0 |
3,676.1 |
7,123.2 |
5.9 |
93.8 |
5. Saudi Arabia |
8,491.6 |
9,678.6 |
15,149.8 |
14.0 |
56.5 |
6. U A E |
4,997.0 |
7,310.1 |
11,377.7 |
46.3 |
55.6 |
III.Eastern Europe |
1,893.5 |
2,169.4 |
4,352.9 |
14.6 |
100.6 |
of which: |
|
|
|
|
|
1. Russia |
1,059.9 |
1,330.0 |
2,782.3 |
25.5 |
109.2 |
IV. Developing Countries |
34,025.2 |
44,368.4 |
57,333.6 |
30.4 |
29.2 |
of which: |
|
|
|
|
|
A. Asia |
27,151.5 |
35,803.8 |
46,064.1 |
31.9 |
28.7 |
a) S A A R C |
889.5 |
1,000.1 |
1,172.4 |
12.4 |
17.2 |
1. Afghanistan |
28.1 |
46.4 |
68.7 |
65.0 |
48.1 |
2. Bangladesh |
139.4 |
163.0 |
217.9 |
16.9 |
33.7 |
3. Bhutan |
67.7 |
117.0 |
98.4 |
72.8 |
-15.9 |
4. Maldives |
1.9 |
2.3 |
2.2 |
19.0 |
-2.8 |
5. Nepal |
162.1 |
244.2 |
312.5 |
50.6 |
28.0 |
6. Pakistan |
192.5 |
149.4 |
253.6 |
-22.4 |
69.8 |
7. Sri Lanka |
297.7 |
2779 |
219.1 |
-6.7 |
-21.2 |
b) Other Asian Developing Countries |
26,262.0 |
34,803.7 |
44,891.7 |
32.5 |
29.0 |
of which: |
|
|
|
|
|
1. People’s Rep of China |
9,471.6 |
15,343.8 |
18,971.0 |
62.0 |
23.6 |
2. Hong Kong |
1,425.9 |
1,631.1 |
1,668.7 |
14.4 |
2.3 |
3. South Korea |
2,816.9 |
3,264.1 |
5,184.7 |
15.9 |
58.8 |
4. Malaysia |
3,186.0 |
3,439.8 |
4,658.8 |
8.0 |
35.4 |
5. Singapore |
3,208.1 |
4,192.7 |
4,728.4 |
30.7 |
12.8 |
6. Thailand |
953.6 |
1,391.0 |
1,650.7 |
45.9 |
18.7 |
B. Africa |
4,154.2 |
5,491.6 |
7,922.1 |
32.2 |
44.3 |
of which: |
|
|
|
|
|
1. Benin |
64.5 |
57.3 |
98.2 |
-11.1 |
71.3 |
2. Egypt Arab Republic1, |
106.9 |
1,136.6 |
1,361.4 |
2.7 |
19.8 |
3. Kenya |
33.3 |
50.6 |
49.2 |
52.0 |
-2.7 |
4. South Africa |
1,638.9 |
2,235.7 |
3,009.5 |
36.4 |
34.6 |
5. Sudan |
48.9 |
150.4 |
328.8 |
207.6 |
118.7 |
6. Tanzania |
24.6 |
38.9 |
43.8 |
58.4 |
12.6 |
7. Zambia |
71.4 |
60.8 |
59.8 |
-14.8 |
-1.6 |
C. Latin American Countries |
2,719.6 |
3,073.0 |
3,347.4 |
13.0 |
8.9 |
V. Others |
35.7 |
46.5 |
34.3 |
30.3 |
-26.3 |
VI. Unspecified |
269.2 |
378.8 |
611.5 |
40.7 |
61.4 |
Total Imports |
104,130.2 |
133,149.4 |
184,209.2 |
27.9 |
38.3 |
P : Provisional.
Note :The figures for 2006-07, which include country-wise distribution of petroleum imports, are not strictly comparable
with the data for previous years.
Source : DGCI & S. |
|
 IST,
IST,