India’s Foreign Trade 2009-10 (April)* Based on the data released by the Directorate General of Commercial Intelligence and Statistics (DGCI&S), this article reviews India’s merchandise trade for April 2009 and commodity-wise details for 2008-09 (April-February).
Highlights
- India’s merchandise exports during April 2009 at US$ 10.7 billion recorded a sharp decline of 33.2 per cent as against an increase of 46.8 per cent registered in April 2008. This is the seventh successive month that exports have shown decline since October 2008.
- Imports during April 2009 at US$ 15.7 billion showed a substantial decline of 36.6 per cent as against a growth of 39.7 per cent in April 2008, due to decline in both oil and non-oil imports.
- Petroleum, oil and lubricants (POL) imports during April 2009 at US$ 3.6 billion recorded a sharp decline of 58.5 per cent, as against an increase of 59.3 per cent in April 2008, mainly due to substantial fall in international crude oil prices over the year. The average price of Indian basket of crude oil during April 2009 stood at US$ 50.1 per barrel, which was lower by 52.6 per cent than US$ 105.8 per barrel during April 2008.
- Non-POL imports during April 2009 at US$ 12.1 billion showed a decline of 24.6 per cent as against an increase of 30.9 per cent a year ago, reflecting slowdown in domestic economic activity.
- Trade deficit during April 2009 stood at US$ 5.0 billion, which was lower by US$ 3.7 billion (42.8 per cent) than US$ 8.7 billion in April 2008, due to larger decline in oil imports.
India’s Merchandise Trade during 2009-10 (April) Exports India’s merchandise exports during April 2009 at US$ 10.7 billion recorded a sharp decline of 33.2 per cent, as against an increase of 46.8 per cent registered in April 2008 (Table 1 and Statement 1). This is the seventh successive month that exports have shown a decline since October 2008 (Chart 1). The declining trend in exports, which has occurred after a high growth phase witnessed since 2002-03, is primarily due to severe demand recession faced by India’s major markets in the aftermath of global economic crisis, as also continuous and sharp decline in the world prices of commodities (Chart 3). Moreover, sharp decline in exports in April 2009 is also the result of high base effect, as exports had shown a high growth in April 2008.
Table 1: India's Merchandise Trade : April |
(US $ billion) |
Items |
2008-09 (April) R |
2009-10 (April) P |
1 |
2 |
3 |
Exports |
|
16.1 |
|
10.7 |
| |
|
(46.8) |
|
(-33.2) |
Oil Exports |
2.8 |
|
24.9* |
|
| |
(33.8) |
|
(2.4)* |
|
Non-Oil Exports |
13.3 |
|
128.1* |
|
| |
(49.8) |
|
(7.4)* |
|
Imports |
|
24.8 |
|
15.7 |
| |
|
(39.7) |
|
(-36.6) |
Oil Imports |
8.7 |
|
3.6 |
|
| |
(59.3) |
|
(-58.5) |
|
Non-Oil Imports |
16.1 |
|
12.1 |
|
| |
(30.9) |
|
(-24.6) |
|
Trade Balance |
|
-8.7 |
|
-5.0 |
Oil Trade Balance |
-6.0 |
|
-61.5* |
|
Non-Oil Trade Balance |
-2.8 |
|
-48.8* |
|
* : Figures pertain to 2008-09 (April-February)
R : Revised. P : Provisional.
Note : Figures in parentheses show percentage change over the corresponding period of the previous year.
Source : DGCI&S. |
The latest commodity-wise exports datareleased by DGCI&S for the period 2008-09(April-February) revealed that manufacturedgoods continued to maintain the largestshare at 65.9 per cent, followed bypetroleum products (16.3 per cent) andprimary products (15.2 per cent) [Table 2].
During 2008-09 (April-February) exports of all major commodity groups slowed down, except for engineering goods, which maintained the growth. Exports of agricultural and allied products, ores and minerals and gems and jewellery declined, while those of leather and manufactures, chemicals and related products, textiles and textile products and petroleum products showed deceleration in growth during the period (Statement 2). Exports of primary products during 2008-09 (April-February) declined by 3.6 per cent as against growth of 38.6 per cent a year ago, due to decline in all its major components. Within the primary products, agricultural and allied products exports at US$ 16.0 billion showed a decline of 0.9 per cent as against a high growth of 44.2 per cent during the previous year, due to negative growth witnessed since September 2008. Slowdown in agricultural and allied products exports was mainly due to decline in rice, cotton, marine products, sugar and molasses and deceleration in export growth of oil meal and spices. Ores and minerals declined by 8.9 per cent during the period (28.4 per cent growth a year ago), mainly due decline in iron ore. This resulted from the substantial fall in exports of iron ore to the main market of China.
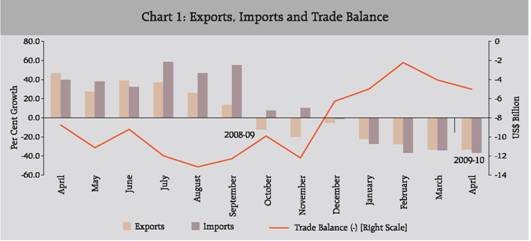
Table 2: India’s Exports of Principal Commodities |
(Percentage Shares) |
Commodity |
2006-07 |
2007-08 |
2007-08 |
2008-09 |
April-March |
April-February |
1 |
2 |
3 |
4 |
5 |
I. |
Primary products |
15.6 |
16.9 |
16.8 |
15.2 |
| |
Agriculture and allied products |
10.0 |
11.3 |
11.2 |
10.4 |
| |
Ores and minerals |
5.5 |
5.6 |
5.5 |
4.7 |
II. |
Manufactured goods |
67.2 |
63.2 |
63.8 |
65.9 |
| |
Leather and |
|
|
|
|
| |
manufactures |
2.4 |
2.2 |
2.2 |
2.2 |
| |
Chemicals and |
|
|
|
|
| |
Related products |
13.7 |
13.0 |
12.9 |
13.4 |
| |
Engineering goods |
23.4 |
22.9 |
22.9 |
26.6 |
| |
Textiles and textile |
|
|
|
|
| |
products |
13.7 |
11.9 |
12.1 |
11.6 |
| |
Gems and jewellery |
12.6 |
12.1 |
12.4 |
11.2 |
III. |
Petroleum products |
14.8 |
17.4 |
16.9 |
16.3 |
IV. |
Others |
2.4 |
2.5 |
2.5 |
2.6 |
Total Exports |
100.0 |
100.0 |
100.0 |
100.0 |
Source : DGCI&S. |
Exports of manufactured goods during 2008-09 (April-February) at US$ 100.9 billion exhibited deceleration in growth to 10.1 per cent from 20.2 per cent a year ago, due to deceleration/decline in its major components. Within manufactured goods, exports of engineering goods, which is the largest item in India’s exports, at US$ 40.7 billion maintained the growth at 23.5 per cent on the top of 24.4 per cent growth a year ago, mainly due to strong growth attained during April-September 2008. Growth in engineering goods exports was contributed largely by transport equipments, iron and steel and electronic goods. Exports of transport equipments, which is a major component of engineering goods, to principal markets, viz., Singapore, Malaysia and the US increased substantially. The share of engineering goods in total exports has gone up remarkably during the period to 26.6 per cent from 22.9 per cent, as a result of high growth maintained by engineering goods in contrast with a slowdown in all other major commodity groups. Chemicals and related products exports during 2008-09 (April-February) at US$ 20.5 billion showed moderation in growth to 10.9 per cent from 18.9 per cent during the corresponding period of the previous year, due to decline witnessed in the second half of 2008-09. The slowdown in the exports of chemicals and related products was primarily due to deceleration in growth of its largest component, viz., ‘basic chemicals, pharmaceuticals and cosmetics’ as also in other major components, and a decline in plastic and linoleum. Exports of textiles and textile products during 2008-09 (April-February) at US$ 17.7 billion showed a sharp moderation in growth to 1.4 per cent from 10.7 per cent a year ago, due to moderate growth during May-July 2008 and a decline in the subsequent period. Readymade garments, which is the largest component of textiles and textile products exhibited a deceleration in growth and exports of most of the other components such as cotton yarn, fabrics and made-ups declined. Gems and jewellery exports during 2008-09 (April-February) at US$ 17.2 billion recorded a decline of 3.7 per cent (growth of 25.3 per cent a year ago), because of the decline in most of the months during this period. This was primarily due to fall in these exports to the largest market, i.e., the US. According to the latest data released by the Gem and Jewellery Export Promotion Council (GJEPC), export growth in gems and jewellery during 2008-09 (April-March) drastically slowed down to 1.5 per cent. Exports of petroleum products, which is the second largest item in India’s exports, at US$ 24.9 billion during 2008-09 (April- February) registered a sharp deceleration in growth to 2.4 per cent from 42.6 per cent a year ago, due to continuous decline witnessed since October 2008. This was the result of persistent and sharp decline in world oil prices since August 2008 (Chart 3), as also fall in the volume of petroleum products exports. The volume of these exports declined by 8.8 per cent during the period as against the growth of 17.1 per cent a year back, as a result of reduction in demand for petroleum products from India’s major markets consequent to a slowdown in world industrial activity. Destination-wise, during 2008-09 (April-February), among the regions, developing countries and OECD countries were the major markets for India’s exports with each group accounting for 39.3 per cent share (Table 3). Another major contributor was OPEC with 19.4 per cent share. Country-wise, the US continued to be the single largest destination for India. However, its share declined to 12.0 per cent from 13.0 per cent during previous year. The US was followed by the UAE (10.8 per cent), China (5.1 per cent), Singapore (4.8 per cent) and Hong Kong (3.7 per cent). Direction of India’s exports during 2008-09 (April-February) indicated that the exports growth to EU, OPEC, Eastern Europe and Latin American developing countries decelerated, while exports to North America, Asia & Oceania and Asian & African developing countries showed a decline (Statement 3).
Table 3: India’s Exports to Principal Regions |
(Percentage Share) |
Region |
2006-07 |
2007-08 |
2007-08 |
2008-09 |
April-March |
April-February |
1 |
2 |
3 |
4 |
5 |
I. |
OECD countries |
41.2 |
38.5 |
39.8 |
39.3 |
| |
EU |
20.4 |
20.2 |
21.3 |
22.3 |
| |
North America |
15.8 |
13.5 |
13.8 |
12.8 |
| |
U.S. |
14.9 |
12.7 |
13.0 |
12.0 |
| |
Asia and Oceania |
3.4 |
3.2 |
3.0 |
2.7 |
| |
Other OECD countries |
1.6 |
1.6 |
1.7 |
1.5 |
II. |
OPEC |
16.4 |
16.4 |
16.6 |
19.4 |
III. |
Eastern Europe |
2.0 |
2.1 |
1.1 |
1.2 |
IV. |
Developing countries |
40.2 |
42.7 |
42.1 |
39.3 |
| |
Asia |
29.8 |
31.6 |
31.3 |
29.1 |
| |
SAARC |
5.1 |
5.9 |
5.7 |
5.0 |
| |
Other Asian developing |
|
|
|
|
| |
countries |
24.6 |
25.7 |
25.7 |
24.1 |
| |
Africa |
7.0 |
7.7 |
7.6 |
6.8 |
| |
Latin America |
3.4 |
3.4 |
3.2 |
3.5 |
V. |
Others |
0.3 |
0.4 |
0.3 |
0.9 |
Total Exports |
100.0 |
100.0 |
100.0 |
100.0 |
Source : DGCI&S. |
Imports
India’s merchandise imports during April 2009 at US$ 15.7 billion recorded a sharp decline of 36.6 per cent as against a high growth of 39.7 per cent in April 2008, because of decline in both POL and non-POL imports (Table 1 and Statement 1). This is the fifth successive month that imports have shown a decline since December 2008 (Chart 1). The decline in imports, which has occurred after a high growth phase witnessed since 2002-03, is mainly due to slowdown in domestic economic activity in the aftermath of global economic crisis. Besides, large decline in imports witnessed in April 2009 is also the result of high base effect, as imports had shown a high growth in April 2008. POL imports during April 2009 at US$ 3.6 billion showed a heavy fall of 58.5 per cent in contrast with a strong growth of 59.3 per cent in April 2008, mainly due to substantial decline in international crude oil prices. The average price of Indian basket of crude oil during April 2009 stood at US$ 50.1 per barrel, which was lower by 52.6 per cent than US$ 105.8 per barrel during April 2008 (Table 4). Non-POL imports during April 2009 at US$ 12.1 billion showed a decline of 24.6 per cent (30.9 per cent growth in April 2008) due to reduction in domestic demand arising from moderation in economic growth. The latest commodity-wise imports data released by DGCI&S for the period 2008-09 (April-February) indicated that POL imports at US$ 86.4 billion showed a deceleration in growth to 22.4 per cent from 35.3 per cent a year ago, mainly due to a sharp reduction in international crude oil prices since August 2008, as also due to a slowdown in the growth of volume of POL imports, which moderated to 7.3 per cent from 9.8 per cent a year ago. The deceleration in the growth of volume of POL imports was primarily due to reduction in demand for POL products as a result of a slowdown in domestic industrial activity (Statement 4).
Table 4: Trends in Crude Oil Prices |
(US $/barrel) |
Year |
Dubai |
Brent |
WTI* |
Indian Basket** |
1 |
2 |
3 |
4 |
5 |
2000-01 |
25.9 |
28.1 |
30.3 |
26.8 |
2001-02 |
21.8 |
23.2 |
24.1 |
22.4 |
2002-03 |
25.9 |
27.6 |
29.2 |
26.6 |
2003-04 |
26.9 |
29.0 |
31.4 |
27.8 |
2004-05 |
36.4 |
42.2 |
45.0 |
39.2 |
2005-06 |
53.4 |
58.0 |
59.9 |
55.7 |
2006-07 |
60.9 |
64.4 |
64.7 |
62.4 |
2007-08 |
77.3 |
82.4 |
82.3 |
79.5 |
2008-09 |
82.1 |
84.7 |
85.8 |
82.7 |
April 2008 |
103.5 |
110.2 |
112.6 |
105.8 |
April 2009 |
50.2 |
50.9 |
49.8 |
50.1 |
* : West Texas Intermediate.
** : The composition of Indian basket of crude represents average of Oman and Dubai for sour grades and Brent (dated) for sweet grade in the ratio of 62.3:37.7 for 2008-09.
Sources: International Monetary Fund, International Financial Statistics; World Bank’s Commodity Price Pink Sheet for May 2009; Ministry of Petroleum and Natural Gas, Government of India. |
Non-POL imports during 2008-09 (April-February) at US$ 176.9 billion witnessed moderation in growth to 21.4 per cent from 32.0 per cent during the corresponding period of the previous year. Slowdown in non-POL imports was mainly due to a sharp deceleration in import growth of capital goods (22.0 per cent share in total imports), gold and silver (6.8 per cent share) and chemicals (4.3 per cent share). However, imports of pearls, precious and semi-precious stones and fertilisers exhibited substantially higher growth during the period. The shares of capital goods, gold and silver, metalliferrous ores and metal scrap in total imports came down during the period, while those of pearls, precious and semiprecious stones, fertilisers, coal, coke and briquettes went up. The share of POL, which is the single largest component of imports (32.8 per cent share), has remained almost at the same level (Table 5). Source-wise, during 2008-09 (April-February), OPEC had the highest share in India’s imports (33.2 per cent), followed by developing countries (32.6 per cent) and OECD countries (31.3 per cent) [Table 6]. Country-wise, China continued to be the single largest source of imports with a share of 10.7 per cent in total imports, followed by Saudi Arabia (7.1 per cent), the UAE (6.5 per cent), the US (6.0 per cent), Iran (4.3 per cent) and Switzerland (4.2 per cent). Direction of India’s imports during 2008-09 (April-February) indicated that growth of imports from EU, North America, Asia & Oceania, OPEC, Asian & African developing countries decelerated, while imports from Latin American developing countries declined (Statement 5).
Table 5: India’s Imports of Principal Commodities |
(Percentage Share) |
Commodity |
2006-07 |
2007-08 |
2007-08 |
2008-09 |
| |
(April- March) |
(April-February) |
1 |
2 |
3 |
4 |
5 |
1. |
Petroleum, crude and products |
30.8 |
31.7 |
32.6 |
32.8 |
2. |
Capital goods |
25.3 |
28.2 |
24.4 |
22.0 |
3. |
Gold and silver |
7.9 |
7.1 |
7.6 |
6.8 |
4. |
Organic and inorganic chemicals |
4.2 |
3.9 |
4.2 |
4.3 |
5. |
Coal, coke and briquettes, etc. |
2.5 |
2.6 |
2.7 |
3.6 |
6. |
Fertilisers |
1.7 |
2.2 |
2.4 |
5.1 |
7. |
Metalliferrous ores, metal scrap, etc. |
4.5 |
3.1 |
3.3 |
2.9 |
8. |
Iron and steel |
3.5 |
3.5 |
3.7 |
3.3 |
9. |
Pearls, precious and semiprecious stones |
4.0 |
3.2 |
3.4 |
4.9 |
10. |
Others |
19.6 |
18.7 |
20.1 |
19.6 |
Total Imports |
100.0 |
100.0 |
100.0 |
100.0 |
Source: DGCI&S. |
Trade Deficit The overall trade deficit during April 2009 stood at US$ 5.0 billion, which was lower by US$ 3.7 billion (42.8 per cent) than US$ 8.7 billion in April 2008, due to relatively higher decline in imports than exports during the month (Statement 1 and Chart 1). Trade deficit on oil account during 2008-09 (April-February) stood at US$ 61.5 billion, which was higher by US$ 15.2 billion than US$ 46.3 billion a year ago. Trade deficit on non-oil account during this period stood at US$ 48.8 billion, which was higher by US$ 22.4 billion than US$ 26.4 billion a year back.
Table 6: Shares of Groups/Countries in India’s Imports |
(Percentage Shares) |
Group/Country |
2006-07 |
2007-08 |
2007-08 |
2008-09 |
April-March |
April-February |
1 |
2 |
3 |
4 |
5 |
I. |
O E C D Countries |
34.5 |
34.8 |
32.7 |
31.3 |
| |
E U |
15.3 |
14.6 |
14.6 |
13.5 |
| |
France |
2.3 |
2.5 |
1.2 |
1.1 |
| |
Germany |
4.1 |
3.9 |
4.0 |
3.6 |
| |
U K |
2.2 |
2.0 |
2.1 |
2.1 |
| |
North America |
7.3 |
9.1 |
6.5 |
6.7 |
| |
U S |
6.3 |
8.4 |
5.6 |
6.0 |
| |
Asia and Oceania |
6.4 |
5.8 |
6.1 |
5.9 |
| |
Other OECD Countries |
5.5 |
5.2 |
5.5 |
5.2 |
II. |
O P E C |
30.2 |
30.3 |
31.8 |
33.2 |
III. |
Eastern Europe |
2.7 |
2.1 |
1.7 |
2.4 |
IV. |
Developing Countries |
32.2 |
32.1 |
33.5 |
32.6 |
| |
Asia |
25.5 |
25.5 |
27.1 |
26.4 |
| |
S A A R C |
0.8 |
0.8 |
0.9 |
0.6 |
| |
Other Asian Developing Countries |
24.7 |
24.7 |
26.2 |
25.7 |
| |
of which: |
|
|
|
|
| |
People’s Rep. of China |
9.4 |
10.8 |
11.5 |
10.7 |
| |
Africa |
3.7 |
4.1 |
4.0 |
4.4 |
| |
Latin America |
3.0 |
2.4 |
2.4 |
1.9 |
V. |
Others |
0.5 |
0.8 |
0.4 |
0.4 |
Total Imports |
100.0 |
100.0 |
100.0 |
100.0 |
Source: Compiled from DGCI&S data. |
Global Trade
The persisting slowdown in the world economy caused by global economic crisis continued to impinge the world merchandise trade. World merchandise exports, which started showing a decline since November 2008, continued the declining trend in 2009 with much larger rates of decline in the first two months of 2009 (Chart 2). According to International Monetary Fund’s (IMF) International Financial Statistics, world merchandise exports during January-February 2009, in dollar terms, showed a negative growth of (-) 29.3 per cent as against a high growth of 23.9 per cent a year ago (Table 7). Exports from advanced economies declined by 31.3 per cent (growth of 23.0 per cent a year back), while exports from emerging and developing economies declined by 27.3 per cent in January 2009 as against a growth of 26.9 per cent during January 2008.
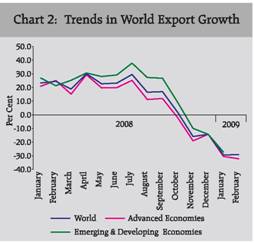
Table 7: Growth in Exports-Global Scenario |
(Per cent) |
Region/Country |
2007 |
2008 |
2008 |
2009 |
January-December |
January-February |
1 |
2 |
3 |
4 |
5 |
World |
13.9 |
14.3 |
23.9 |
-29.3 |
Advanced Economies |
13.5 |
11.3 |
23.0 |
-31.3 |
US |
12.0 |
11.9 |
20.2 |
-22.7 |
France |
12.3 |
9.8 |
25.7 |
-30.2 |
Germany |
18.0 |
10.8 |
23.2 |
-32.3 |
Japan |
7.8 |
12.3 |
33.0 |
-43.9 |
Emerging and Developing Economies |
14.7 |
21.1 |
24.1 |
-27.3* |
Singapore |
10.1 |
13.0 |
24.8 |
-35.0 |
China |
25.6 |
17.3 |
16.8 |
-21.9 |
India |
21.5 |
20.6 |
39.2 |
-25.1 |
Indonesia |
14.7 |
24.4 |
29.7 |
-33.5 |
Korea |
14.1 |
13.6 |
16.8 |
-26.4 |
Malaysia |
9.6 |
19.1 |
21.2 |
-29.9 |
Thailand |
17.0 |
12.9 |
28.7 |
-21.3 |
* : Pertains to January 2009 over January 2008.
Sources : 1. IMF (www.imfstatistics.org).
2. DGCI&S for India. |
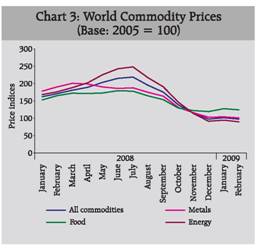
World Commodity Prices The world commodity prices, which showed deceleration in August 2008 started declining since September 2008 and the decline continued in 2009 as well (Chart 3). According to the IFS, world commodity prices declined substantially by 42.9 per cent in February 2009. The prices of energy, food and metals declined by 49.0 per cent, 24.7 per cent and 46.9 per cent, respectively.
Statement 1 : India’s Foreign Trade |
Year |
Exports |
Imports |
Trade Balance |
Total |
Oil |
Non-Oil |
Total |
Oil |
Non-Oil |
Total |
Oil |
Non-Oil |
1 |
2 |
3 |
4 |
5 |
6 |
7 |
8 |
9 |
10 |
April-March |
Rupees crore |
2006-07 |
5,71,779 |
84,520 |
4,87,259 |
8,40,506 |
2,58,572 |
5,81,935 |
-2,68,727 |
-1,74,052 |
-94,675 |
| |
(25.3) |
(64.0) |
(20.3) |
(27.3) |
(32.8) |
(24.9) |
|
|
|
2007-08 R |
6,55,863 |
1,14,192 |
5,41,672 |
10,12,312 |
3,20,655 |
6,91,658 |
-3,56,449 |
-2,06,463 |
-1,49,986 |
| |
(14.7) |
(35.1) |
(11.2) |
(20.4) |
(24.0) |
(18.9) |
|
|
|
2008-09 P |
7,66,935 |
.. |
.. |
13,05,503 |
4,17,472 |
8,88,031 |
-5,38,569 |
|
|
| |
(16.9) |
|
|
(29.0) |
(30.2) |
(28.4) |
|
|
|
US dollar million |
2006-07 |
126,361 |
18,679 |
107,683 |
185,749 |
57,144 |
128,606 |
-59,388 |
-38,465 |
-20,923 |
| |
(22.6) |
(60.5) |
(17.7) |
(24.5) |
(30.0) |
(22.2) |
|
|
|
2007-08 R |
163,132 |
28,363 |
134,769 |
251,654 |
79,715 |
171,940 |
-88,522 |
-51,352 |
-37,171 |
| |
(29.1) |
(51.8) |
(25.2) |
(35.5) |
(39.5) |
(33.7) |
|
|
|
2008-09 P |
168,704 |
24,885* |
128,133* |
287,759 |
93,176 |
194,584 |
-119,055 |
|
|
| |
(3.4) |
(2.4) |
(7.4) |
(14.3) |
(16.9) |
(13.2) |
|
|
|
SDR million |
2006-07 |
85,018 |
12,567 |
72,451 |
124,975 |
38,447 |
86,528 |
-39,957 |
-25,880 |
-14,077 |
| |
(20.1) |
(57.3) |
(15.4) |
(22.0) |
(27.4) |
(19.8) |
|
|
|
2007-08 R |
104,686 |
18,227 |
86,459 |
161,581 |
51,181 |
110,399 |
-56,895 |
-32,955 |
-23,940 |
| |
(23.1) |
(45.0) |
(19.3) |
(29.3) |
(33.1) |
(27.6) |
|
|
|
2008-09 P |
107,599 |
.. |
.. |
183,159 |
58,570 |
124,589 |
-75,560 |
|
|
| |
(2.8) |
|
|
(13.4) |
(14.4) |
(12.9) |
|
|
|
April |
Rupees crore |
2007-08 |
46,164 |
8,796 |
37,368 |
74,895 |
23,154 |
51,740 |
-28,731 |
-14,358 |
-14,373 |
| |
(19.6) |
(108.0) |
(8.7) |
(32.9) |
(29.7) |
(34.4) |
|
|
|
2008-09 R |
64,340 |
11,173 |
53,167 |
99,347 |
35,016 |
64,331 |
-35,007 |
-23,843 |
-11,164 |
| |
(39.4) |
(27.0) |
(42.3) |
(32.6) |
(51.2) |
(24.3) |
|
|
|
2009-10 P |
53,779 |
|
|
78,832 |
18,190 |
60,642 |
-25,053 |
|
|
| |
(-16.4) |
|
|
(-20.6) |
(-48.1) |
(-5.7) |
|
|
|
US dollar million |
2007-08 |
10,953 |
2,087 |
8,866 |
17,769 |
5,494 |
12,276 |
-6,817 |
-3,407 |
-3,410 |
| |
(27.5) |
(121.8) |
(15.9) |
(41.8) |
(38.3) |
(43.4) |
|
|
|
2008-09 R |
16,076 |
2,792 |
13,284 |
24,823 |
8,749 |
16,074 |
-8,747 |
-5,957 |
-2,789 |
| |
(46.8) |
(33.8) |
(49.8) |
(39.7) |
(59.3) |
(30.9) |
(28.3) |
|
|
2009-10 P |
10,743 |
.. |
.. |
15,747 |
3,634 |
12,113 |
-5,004 |
|
|
| |
(-33.2) |
|
|
(-36.6) |
(-58.5) |
(-24.6) |
(-42.8) |
|
|
SDR million |
2007-08 |
7,196 |
1,371 |
5,825 |
11,675 |
3,609 |
8,065 |
-4,479 |
-2,238 |
-2,240 |
| |
(21.7) |
(111.6) |
(10.6) |
(35.3) |
(32.0) |
(36.8) |
|
|
|
2008-09 R |
9,825 |
1,706 |
8,119 |
15,171 |
5,347 |
9,824 |
-5,346 |
-3,641 |
-1,705 |
| |
(36.5) |
(24.4) |
(39.4) |
(30.0) |
(48.2) |
(21.8) |
|
|
|
2009-10 P |
7,199 |
.. |
.. |
10,553 |
2,435 |
8,118 |
-3,354 |
|
|
| |
(-26.7) |
|
|
(-30.4) |
(-54.5) |
(-17.4) |
|
|
|
P : Provisional. R : Revised. .. : Not available. * : Figures pertain to the period of April-February.
Note : 1. Figures in brackets relate to percentage variation over the corresponding period of the previous year.
2. Data conversion has been done using period average exchange rates.
Source : DGCI & S. |
Statement 2 : India’s Exports of Principal Commodities |
(US$ million) |
Commodity/Group |
April-February |
Percentage Variation |
2006-07 |
2007-08 |
2008-09 P |
(3)/(2) |
(4)/(3) |
1 |
2 |
3 |
4 |
5 |
6 |
I. |
Primary Products |
17,368.6 |
24,067.6 |
23,210.8 |
38.6 |
-3.6 |
| |
|
(15.3) |
(16.8) |
(15.2) |
|
|
| |
A. |
Agricultural & Allied Products |
11,176.6 |
16,119.1 |
15,968.5 |
44.2 |
-0.9 |
| |
|
of which : |
(9.9) |
(11.2) |
(10.4) |
|
|
| |
|
1. |
Tea |
411.2 |
459.9 |
522.1 |
11.8 |
13.5 |
| |
|
2. |
Coffee |
378.9 |
371.9 |
431.9 |
-1.8 |
16.1 |
| |
|
3. |
Rice |
1,355.8 |
2,572.4 |
2,160.0 |
89.7 |
-16.0 |
| |
|
4. |
Wheat |
7.7 |
0.1 |
0.3 |
–99.3 |
453.6 |
| |
|
5. |
Cotton Raw incl. Waste |
1,187.2 |
1,638.8 |
550.8 |
38.0 |
-66.4 |
| |
|
6. |
Tobacco |
328.5 |
432.1 |
647.4 |
31.5 |
49.8 |
| |
|
7. |
Cashew incl. CNSL |
500.6 |
490.6 |
598.5 |
-2.0 |
22.0 |
| |
|
8. |
Spices |
607.1 |
1,154.6 |
1,264.1 |
90.2 |
9.5 |
| |
|
9. |
Oil Meal |
1,042.6 |
1,714.2 |
2,114.1 |
64.4 |
23.3 |
| |
|
10. |
Marine Products |
1,618.0 |
1,588.9 |
1,433.0 |
-1.8 |
-9.8 |
| |
|
11. |
Sugar & Mollases |
620.8 |
1,199.9 |
987.6 |
93.3 |
-17.7 |
| |
B. |
Ores & Minerals |
6,192.0 |
7,948.5 |
7,242.4 |
28.4 |
-8.9 |
| |
|
Of which : |
(5.5) |
(5.5) |
(4.7) |
|
|
| |
|
1. |
Iron Ore |
3,528.3 |
4,958.7 |
4,370.8 |
40.5 |
-11.9 |
| |
|
2. |
Processed Minerals |
1,173.9 |
1,092.5 |
1,262.3 |
-6.9 |
15.5 |
II. |
Manufactured Goods |
76,255.6 |
91,624.9 |
100,909.1 |
20.2 |
10.1 |
| |
of which : |
(67.2) |
(63.8) |
(65.9) |
|
|
| |
A. |
Leather & Manufactures |
2,755.4 |
3,206.9 |
3,298.0 |
16.4 |
2.8 |
| |
B. |
Chemicals & Related Products |
15,571.1 |
18,513.1 |
20,532.6 |
18.9 |
10.9 |
| |
|
1. |
Basic Chemicals, Pharmaceuticals & Cosmetics |
9,792.0 |
12,158.9 |
14,063.6 |
24.2 |
15.7 |
| |
|
2. |
Plastic & Linoleum |
2,968.7 |
2,940.9 |
2,734.7 |
-0.9 |
-7.0 |
| |
|
3. |
Rubber, Glass, Paints & Enamels etc., |
2,140.9 |
2,581.9 |
2,723.4 |
20.6 |
5.5 |
| |
|
4. |
Residual Chemicals & Allied Products |
669.5 |
831.4 |
1,011.0 |
24.2 |
21.6 |
| |
C. |
Engineering Goods |
26,486.2 |
32,948.7 |
40,701.7 |
24.4 |
23.5 |
| |
|
Of which : |
|
|
|
|
|
| |
|
1. |
Manufactures of metals |
4,555.8 |
6,279.1 |
6,972.7 |
37.8 |
11.0 |
| |
|
2. |
Machinery & Instruments |
6,005.8 |
8,131.9 |
9,756.0 |
35.4 |
20.0 |
| |
|
3. |
Transport equipments |
4,377.9 |
6,162.3 |
10,142.0 |
40.8 |
64.6 |
| |
|
4. |
Iron & steel |
4,725.7 |
4,696.9 |
5,348.0 |
-0.6 |
13.9 |
| |
|
5. |
Electronic goods |
2,574.6 |
2,991.9 |
3,898.8 |
16.2 |
30.3 |
| |
D. |
Textiles and Textile Products |
15,755.4 |
17,443.1 |
17,689.5 |
10.7 |
1.4 |
| |
|
1. |
Cotton Yarn, Fabrics, Made-ups, etc., |
3,830.4 |
4,093.0 |
3,872.3 |
6.9 |
-5.4 |
| |
|
2. |
Natural Silk Yarn, Fabrics Madeups etc. |
|
|
|
|
|
| |
|
|
(incl.silk waste) |
408.8 |
341.0 |
337.0 |
-16.6 |
-1.2 |
| |
|
3. |
Manmade Yarn, Fabrics, Made-ups, etc., |
1,993.5 |
2,627.0 |
2,774.7 |
31.8 |
5.6 |
| |
|
4. |
Manmade Staple Fibre |
173.4 |
245.1 |
232.4 |
41.3 |
-5.2 |
| |
|
5. |
Woolen Yarn, Fabrics, Madeups etc. |
77.4 |
83.1 |
92.6 |
7.5 |
11.4 |
| |
|
6. |
Readymade Garments |
8,046.9 |
8,717.6 |
9,242.1 |
8.3 |
6.0 |
| |
|
7. |
Jute & Jute Manufactures |
244.5 |
300.7 |
279.2 |
23.0 |
-7.1 |
| |
|
8. |
Coir & Coir Manufactures |
129.6 |
143.5 |
133.8 |
10.8 |
-6.8 |
| |
|
9. |
Carpets |
851.1 |
892.1 |
725.3 |
4.8 |
-18.7 |
| |
|
|
(a) Carpet Handmade |
822.7 |
874.7 |
714.4 |
6.3 |
-18.3 |
| |
|
|
(b) Carpet Millmade |
0.0 |
0.0 |
0.0 |
— |
— |
| |
|
|
(c) Silk Carpets |
28.4 |
17.4 |
10.9 |
-38.6 |
-37.3 |
| |
E. |
Gems & Jewellery |
14,253.3 |
17,854.6 |
17,193.5 |
25.3 |
-3.7 |
| |
F. |
Handicrafts |
405.0 |
476.6 |
279.7 |
17.7 |
-41.3 |
III. |
Petroleum Products |
17,042.9 |
24,297.8 |
24,885.1 |
42.6 |
2.4 |
| |
|
(15.0) |
(16.9) |
(16.3) |
12.6 |
-3.9 |
IV. |
Others |
2,733.8 |
3,577.6 |
4,013.2 |
30.9 |
12.2 |
| |
|
(2.4) |
(2.5) |
(2.6) |
|
|
Total Exports |
113,400.9 |
143,567.9 |
153,018.2 |
26.6 |
6.6 |
P : Provisional.
Note : Figures in brackets relate to percentage to total exports for the period.
Source : DGCI & S. |
Statement 3: Direction of India’s Foreign Trade - Exports |
(US$ million) |
Group/Country |
April-February |
Percentage Variation |
2006-07 |
2007-08 |
2008-09 P |
(3)/(2) |
(4)/(3) |
1 |
2 |
3 |
4 |
5 |
6 |
I. |
O E C D Countries |
47,587.9 |
57,201.4 |
60,091.6 |
20.2 |
5.1 |
| |
A. |
E U |
24,007.3 |
30,611.9 |
34,111.5 |
27.5 |
11.4 |
| |
|
of which: |
|
|
|
|
|
| |
|
1. |
Belgium |
3,111.5 |
3,726.7 |
3,982.9 |
19.8 |
6.9 |
| |
|
2. |
France |
1,867.4 |
2,304.5 |
2,639.8 |
23.4 |
14.6 |
| |
|
3. |
Germany |
3,504.7 |
4,568.2 |
5,284.2 |
30.3 |
15.7 |
| |
|
4. |
Italy |
3,238.1 |
3,523.6 |
3,407.0 |
8.8 |
-3.3 |
| |
|
5. |
Netherland |
2,362.5 |
4,537.3 |
5,728.4 |
92.1 |
26.3 |
| |
|
6. |
U K |
5,049.2 |
5,985.4 |
5,565.8 |
18.5 |
-7.0 |
| |
B. |
North America |
17,975.7 |
19,845.1 |
19,657.5 |
10.4 |
-0.9 |
| |
|
1. |
Canada |
1,005.6 |
1,138.2 |
1,246.2 |
13.2 |
9.5 |
| |
|
2. |
U S A |
16,970.1 |
18706.9 |
18,411.3 |
10.2 |
-1.6 |
| |
C. |
Asia and Oceania |
3,833.5 |
4,371.4 |
4,103.2 |
14.0 |
-6.1 |
| |
|
of which: |
|
|
|
|
|
| |
|
1. |
Australia |
818.2 |
1,039.0 |
1,207.8 |
27.0 |
16.2 |
| |
|
2. |
Japan |
2,522.7 |
3,196.8 |
2,731.3 |
26.7 |
-14.6 |
| |
D. |
Other O E C D Countries |
1,771.3 |
2,373.1 |
2,219.4 |
34.0 |
-6.5 |
| |
|
of which: |
|
|
|
|
|
| |
|
1. |
Switzerland |
415.1 |
529.3 |
600.1 |
27.5 |
13.4 |
II. |
O P E C |
18,840.1 |
23,869.1 |
29,632.5 |
26.7 |
24.1 |
| |
of which: |
|
|
|
|
|
| |
|
1. |
Indonesia |
1,866.6 |
1,751.2 |
2,147.6 |
-6.2 |
22.6 |
| |
|
2. |
Iran |
1,333.5 |
1,848.2 |
2,347.1 |
38.6 |
27.0 |
| |
|
3. |
Iraq |
189.1 |
227.2 |
327.0 |
20.1 |
43.9 |
| |
|
4. |
Kuwait |
558.2 |
590.0 |
699.5 |
5.7 |
18.6 |
| |
|
5. |
Saudi Arabia |
2,232.3 |
3,078.4 |
4,536.6 |
37.9 |
47.4 |
| |
|
6. |
U A E |
10,856.4 |
14,033.3 |
16,557.9 |
29.3 |
18.0 |
III. |
Eastern Europe |
1,386.4 |
1,603.5 |
1,781.0 |
15.7 |
11.1 |
| |
of which: |
|
|
|
|
|
| |
1. |
Russia |
806.3 |
812.6 |
928.9 |
0.8 |
14.3 |
IV. |
Developing Countries |
45,260.2 |
60,464.9 |
60,180.8 |
33.6 |
-0.5 |
| |
of which: |
|
|
|
|
|
| |
A. |
Asia |
33,805.6 |
44,963.0 |
44,505.7 |
33.0 |
-1.0 |
| |
|
a) |
S A A R C |
5,837.5 |
8,113.7 |
7,693.8 |
39.0 |
-5.2 |
| |
|
|
1. |
Afghanistan |
162.5 |
219.9 |
349.3 |
35.3 |
58.8 |
| |
|
|
2. |
Bangladesh |
1,452.4 |
2,231.6 |
2,264.5 |
53.6 |
1.5 |
| |
|
|
3. |
Bhutan |
51.8 |
77.6 |
97.3 |
49.7 |
25.3 |
| |
|
|
4. |
Maldives |
61.6 |
81.1 |
123.4 |
31.8 |
52.1 |
| |
|
|
5. |
Nepal |
841.7 |
1,281.6 |
1,313.7 |
52.3 |
2.5 |
| |
|
|
6. |
Pakistan |
1,224.8 |
1,696.1 |
1,290.7 |
38.5 |
-23.9 |
| |
|
|
7. |
Sri Lanka |
2,042.6 |
2,525.8 |
2,254.9 |
23.7 |
-10.7 |
| |
|
b) |
Other Asian Developing Countries |
27,968.1 |
36,849.3 |
36,811.9 |
31.8 |
-0.1 |
| |
|
|
of |
which: |
|
|
|
|
|
| |
|
|
1. |
People’s Rep of China |
7,439.0 |
9,457.9 |
7,747.1 |
27.1 |
-18.1 |
| |
|
|
2. |
Hong Kong |
4,080.4 |
5,593.6 |
5,701.2 |
37.1 |
1.9 |
| |
|
|
3. |
South Korea |
2,290.4 |
2,591.2 |
2,848.9 |
13.1 |
9.9 |
| |
|
|
4. |
Malaysia |
1,183.8 |
2,112.0 |
3,208.8 |
78.4 |
51.9 |
| |
|
|
5. |
Singapore |
5,487.7 |
6,435.6 |
7,273.5 |
17.3 |
13.0 |
| |
|
|
6. |
Thailand |
1,305.8 |
1,614.3 |
1,629.7 |
23.6 |
1.0 |
| |
B. |
Africa |
7,642.1 |
10,957.7 |
10,344.9 |
43.4 |
-5.6 |
| |
|
of which: |
|
|
|
|
|
| |
|
1. |
Benin |
138.3 |
227.2 |
192.1 |
64.3 |
-15.4 |
| |
|
2. |
Egypt Arab Republic |
677.2 |
1,208.2 |
1,443.7 |
78.4 |
19.5 |
| |
|
3. |
Kenya |
1,184.1 |
1,354.7 |
1,223.8 |
14.4 |
-9.7 |
| |
|
4. |
South Africa |
1,969.5 |
2,358.8 |
1,728.3 |
19.8 |
-26.7 |
| |
|
5. |
Sudan |
364.5 |
339.1 |
404.7 |
-7.0 |
19.3 |
| |
|
6. |
Tanzania |
258.4 |
516.2 |
994.3 |
99.7 |
92.6 |
| |
|
7. |
Zambia |
97.6 |
122.8 |
90.3 |
25.8 |
-26.5 |
| |
C. |
Latin America |
3,812.5 |
4,544.2 |
5,330.2 |
19.2 |
17.3 |
V. |
Others |
124.0 |
245.3 |
473.7 |
97.9 |
93.1 |
VI. |
Unspecified |
202.3 |
183.6 |
858.6 |
-9.3 |
367.7 |
Total Exports |
113,400.9 |
143,567.9 |
153,018.2 |
26.6 |
6.6 |
P : Provisional. Source : DGCI & S. |
Statement 4: India’s Imports of Principal Commodities |
(US$ million) |
Commodity/Group |
April-February |
Percentage Variation |
2006-07 |
2007-08 |
2008-09 P |
(3)/(2) |
(4)/(3) |
1 |
2 |
3 |
4 |
5 |
6 |
I. |
Bulk Imports |
76,058.6 |
101,077.6 |
126,715.0 |
32.9 |
25.4 |
| |
|
(46.8) |
(46.7) |
(48.1) |
|
|
| |
A. |
Petroleum, Petroleum Products |
52,160.0 |
70,562.8 |
86,357.6 |
35.3 |
22.4 |
| |
|
& Related Material |
(32.1) |
(32.6) |
(32.8) |
|
|
| |
B. |
Bulk Consumption Goods |
3,029.6 |
4,333.0 |
4491.1 |
43.0 |
3.6 |
| |
|
1. |
Wheat |
324.8 |
660.2 |
0.0 |
103.3 |
-100.0 |
| |
|
2. |
Cereals & Cereal Preparations |
29.7 |
42.5 |
43.0 |
43.1 |
1.0 |
| |
|
3. |
Edible Oil |
1,925.0 |
2,390.7 |
3,173.8 |
24.2 |
32.8 |
| |
|
4. |
Pulses |
749.4 |
1,238.3 |
1,181.5 |
65.2 |
-4.6 |
| |
|
5. |
Sugar |
0.7 |
1.4 |
92.9 |
87.3 |
6773.1 |
| |
C. |
Other Bulk Items |
20,868.9 |
26,181.8 |
35,866.3 |
25.5 |
37.0 |
| |
|
1. |
Fertilisers |
3,013.8 |
5,095.8 |
13,296.4 |
69.1 |
160.9 |
| |
|
|
a) |
Crude |
328.1 |
439.3 |
1,003.3 |
33.9 |
128.4 |
| |
|
|
b) |
Sulphur & Unroasted Iron Pyrites |
100.0 |
309.2 |
650.8 |
209.1 |
110.5 |
| |
|
|
c) |
Manufactured |
2,585.7 |
4,347.3 |
11,642.3 |
68.1 |
167.8 |
| |
|
2. |
Non-Ferrous Metals |
2,387.6 |
3,142.9 |
2,954.0 |
31.6 |
-6.0 |
| |
|
3. |
Paper, Paperboard & Mgfd. incl. Newsprint |
1,102.8 |
1,285.1 |
1,684.6 |
16.5 |
31.1 |
| |
|
4. |
Crude Rubber, incl. Synthetic & Reclaimed |
559.7 |
709.6 |
834.7 |
26.8 |
17.6 |
| |
|
5. |
Pulp & Waste Paper |
569.3 |
711.5 |
758.2 |
25.0 |
6.6 |
| |
|
6. |
Metalliferrous Ores & Metal Scrap |
7,507.3 |
7,200.5 |
7,523.4 |
-4.1 |
4.5 |
| |
|
7. |
Iron & Steel |
5,728.5 |
8,036.5 |
8,815.0 |
40.3 |
9.7 |
II. |
Non-Bulk Imports |
86,443.8 |
115,159.7 |
136,560.7 |
33.2 |
18.6 |
| |
|
(53.2) |
(53.3) |
(51.9) |
|
|
| |
A. |
Capital Goods |
37,819.4 |
52,685.0 |
58,037.3 |
39.3 |
10.2 |
| |
|
1. |
Manufactures of Metals |
1,425.0 |
2,411.4 |
2,956.7 |
69.2 |
22.6 |
| |
|
2. |
Machine Tools |
1,331.2 |
2,002.9 |
2,130.1 |
50.5 |
6.4 |
| |
|
3. |
Machinery except Electrical & Electronics |
12,390.5 |
17,835.0 |
19,097.4 |
43.9 |
7.1 |
| |
|
4. |
Electrical Machinery except Electronics |
1,759.0 |
2,613.8 |
2,946.3 |
48.6 |
12.7 |
| |
|
5. |
Electronic Goods incl. Computer Software |
15,265.4 |
19,117.5 |
20,624.8 |
25.2 |
7.9 |
| |
|
6. |
Transport Equipments |
3,993.2 |
7,589.0 |
7,451.3 |
90.0 |
-1.8 |
| |
|
7. |
Project Goods |
1,655.2 |
1,115.3 |
2,830.8 |
-32.6 |
153.8 |
| |
B. |
Mainly Export Related Items |
16,096.2 |
18,986.9 |
26,990.9 |
18.0 |
42.2 |
| |
|
1. |
Pearls, Precious & Semi-Precious Stones |
6,627.2 |
7,249.6 |
12,794.5 |
9.4 |
76.5 |
| |
|
2. |
Chemicals, Organic & Inorganic |
7,108.0 |
9,059.8 |
11,359.5 |
27.5 |
25.4 |
| |
|
3. |
Textile Yarn, Fabric, etc. |
1,979.0 |
2,283.9 |
2,269.2 |
15.4 |
-0.6 |
| |
|
4. |
Cashew Nuts, raw |
382.1 |
393.7 |
567.6 |
3.0 |
44.2 |
| |
C. |
Others |
32,528.2 |
43,487.8 |
51,532.5 |
33.7 |
18.5 |
| |
|
of which : |
|
|
|
|
|
| |
|
1. |
Gold & Silver |
13,109.2 |
16,378.2 |
18028.3 |
24.9 |
10.1 |
| |
|
2. |
Artificial Resins & Plastic Materials |
2,321.5 |
3,361.0 |
3,457.2 |
44.8 |
2.9 |
| |
|
3. |
Professional Instruments etc. except electrical |
2,090.3 |
3,485.7 |
3,702.3 |
66.8 |
6.2 |
| |
|
4. |
Coal, Coke & Briquittes etc. |
4,062.5 |
5,850.5 |
9,379.2 |
44.0 |
60.3 |
| |
|
5. |
Medicinal & Pharmaceutical Products |
1,165.0 |
1,536.1 |
1,667.0 |
31.8 |
8.5 |
| |
|
6. |
Chemical Materials & Products |
1,208.6 |
1,446.5 |
1,804.9 |
19.7 |
24.8 |
| |
|
7. |
Non-Metallic Mineral Manufactures |
713.1 |
951.2 |
1,080.3 |
33.4 |
13.6 |
Total Imports |
162,502.4 |
216,237.4 |
263,275.7 |
33.1 |
21.8 |
Memo items : |
Non-Oil Imports |
110342.4 |
145674.6 |
176,918.1 |
32.0 |
21.4 |
Non-Oil Imports excl. Gold & Silver |
97233.2 |
129296.4 |
158,889.8 |
33.0 |
22.9 |
Mainly Industrial Inputs* |
89527.6 |
117130.2 |
139,054.0 |
30.8 |
18.7 |
P : Provisional.
* : Non oil imports net of gold and silver, bulk consumption goods, manufactured fertilisers and professional instruments.
Note : Figures in brackets relate to percentage to total imports for the period.
Source : DGCI & S. |
Statement 5: Direction of India’s Foreign Trade-Imports |
(US$ million) |
Group / Country |
April-February |
Percentage Variation |
2006-07 |
2007-08 |
2008-09 P |
(3)/(2) |
(4)/(3) |
1 |
2 |
3 |
4 |
5 |
6 |
I. |
O E C D Countries |
54,160.1 |
70,626.4 |
82,394.0 |
30.4 |
16.7 |
| |
A. |
E U |
24,254.0 |
31,629.5 |
35,501.4 |
30.4 |
12.2 |
| |
|
Of which: |
|
|
|
|
|
| |
|
1. |
Belgium |
3,681.2 |
4,211.3 |
5,146.0 |
14.4 |
22.2 |
| |
|
2. |
France |
1,927.9 |
2,586.7 |
2,793.6 |
34.2 |
8.0 |
| |
|
3. |
Germany |
6,736.8 |
8,603.1 |
9,567.7 |
27.7 |
11.2 |
| |
|
4. |
Italy |
2,365.2 |
3,443.7 |
3,895.5 |
45.6 |
13.1 |
| |
|
5. |
Netherland |
1,010.1 |
1,808.4 |
1,543.3 |
79.0 |
-14.7 |
| |
|
6. |
U K |
3,685.6 |
4,608.9 |
5,450.6 |
25.1 |
18.3 |
| |
B. |
North America |
10,457.0 |
13,982.3 |
17,756.9 |
33.7 |
27.0 |
| |
|
1. |
Canada |
1,219.8 |
1,804.8 |
2,037.7 |
48.0 |
12.9 |
| |
|
2. |
U S |
9,237.2 |
12,177.5 |
15,719.2 |
31.8 |
29.1 |
| |
C. |
Asia and Oceania |
10,545.4 |
13,122.8 |
15,489.4 |
24.4 |
18.0 |
| |
|
of which: |
|
|
|
|
|
| |
|
1. |
Australia |
6,259.0 |
7,140.2 |
8,196.4 |
14.1 |
14.8 |
| |
|
2. |
Japan |
4,041.0 |
5,678.5 |
6,894.5 |
40.5 |
21.4 |
| |
D. |
Other O E C D Countries |
8,903.7 |
11,891.9 |
13,646.3 |
33.6 |
14.8 |
| |
|
of which: |
|
|
|
|
|
| |
|
1. |
Switzerland |
7,992.6 |
8,890.1 |
11,180.1 |
11.2 |
25.8 |
II. |
O P E C |
51,067.9 |
68,808.8 |
87,516.0 |
34.7 |
27.2 |
| |
of which: |
|
|
|
|
|
| |
1. |
Indonesia |
3,659.0 |
4,366.2 |
6,052.3 |
19.3 |
38.6 |
| |
2. |
Iran |
6,736.1 |
9,950.4 |
11,280.8 |
47.7 |
13.4 |
| |
3. |
Iraq |
5,085.0 |
5,630.5 |
7,396.8 |
10.7 |
31.4 |
| |
4. |
Kuwait |
5,396.7 |
6,580.6 |
8,847.5 |
21.9 |
34.4 |
| |
5. |
Saudi Arabia |
12,376.5 |
17,398.0 |
18,663.8 |
40.6 |
7.3 |
| |
6. |
U A E |
7,606.3 |
12,209.6 |
16,982.7 |
60.5 |
39.1 |
III. |
Eastern Europe |
3,265.7 |
3,571.2 |
6,348.8 |
9.4 |
77.8 |
| |
of which: |
|
|
|
|
|
| |
1. |
Russia |
1,871.3 |
2,288.2 |
4,143.8 |
22.3 |
81.1 |
IV. |
Developing Countries |
53,306.9 |
72,363.5 |
85,952.1 |
35.7 |
18.8 |
| |
of which: |
|
|
|
|
|
| |
A. |
Asia |
42,669.2 |
58,584.7 |
69,399.9 |
37.3 |
18.5 |
| |
|
a) S A A R C |
1,383.6 |
1,939.0 |
1,650.6 |
40.1 |
-14.9 |
| |
|
|
1. |
Afghanistan |
32.9 |
95.9 |
119.2 |
191.4 |
24.3 |
| |
|
|
2. |
Bangladesh |
209.7 |
239.4 |
294.7 |
14.1 |
23.1 |
| |
|
|
3. |
Bhutan |
125.4 |
181.1 |
138.8 |
44.4 |
-23.4 |
| |
|
|
4. |
Maldives |
2.8 |
3.7 |
3.7 |
32.2 |
-1.1 |
| |
|
|
5. |
Nepal |
283.5 |
585.5 |
452.2 |
106.6 |
-22.8 |
| |
|
|
6. |
Pakistan |
306.8 |
248.1 |
339.5 |
-19.1 |
36.8 |
| |
|
|
7 |
Sri Lanka |
422.5 |
585.3 |
302.5 |
38.6 |
-48.3 |
| |
b) |
Other Asian Developing Countries |
41,285.6 |
56,645.6 |
67,749.3 |
37.2 |
19.6 |
| |
|
of which: |
|
|
|
|
|
| |
|
1. |
People’s Rep of China |
15,698.0 |
24,817.8 |
28,107.8 |
58.1 |
13.3 |
| |
|
2. |
Hong Kong |
2,177.9 |
2,513.9 |
5,312.0 |
15.4 |
111.3 |
| |
|
3. |
South Korea |
4,296.7 |
5,390.1 |
7,483.9 |
25.4 |
38.8 |
| |
|
4. |
Malaysia |
4,792.5 |
5,574.3 |
6,653.8 |
16.3 |
19.4 |
| |
|
5. |
Singapore |
4,944.5 |
7,095.6 |
6,628.9 |
43.5 |
-6.6 |
| |
|
6. |
Thailand |
1,544.9 |
2,104.7 |
2,415.1 |
36.2 |
14.7 |
| |
B. |
|
Africa |
5,973.7 |
8,558.9 |
11,564.0 |
43.3 |
35.1 |
| |
|
|
of which: |
|
|
|
|
|
| |
|
1. |
Benin |
78.0 |
70.0 |
106.8 |
-10.3 |
52.6 |
| |
|
2. |
Egypt Arab Republic |
1,573.0 |
1,798.4 |
1,768.0 |
14.3 |
-1.7 |
| |
|
3. |
Kenya |
50.3 |
76.7 |
76.3 |
52.4 |
-0.5 |
| |
|
4. |
South Africa |
2,321.5 |
3,239.3 |
5,015.3 |
39.5 |
54.8 |
| |
|
5. |
Sudan |
87.0 |
428.6 |
403.0 |
392.5 |
-6.0 |
| |
|
6. |
Tanzania |
88.9 |
147.6 |
183.3 |
66.1 |
24.2 |
| |
|
7. |
Zambia |
78.6 |
73.8 |
190.3 |
-6.2 |
158.0 |
| |
C. |
Latin America |
4,664.0 |
5,219.9 |
4,988.2 |
11.9 |
-4.4 |
| V. |
Others |
61.7 |
225.7 |
59.4 |
265.9 |
-73.7 |
| VI. |
Unspecified |
640.1 |
641.7 |
1,005.4 |
0.3 |
56.7 |
P : Provisional.
Note : The figures for 2006-07, which include country-wise distribution of petroleum imports, are not strictly comparable with the data for previous years.
Source : DGCI & S. |
* Prepared in the Division of International Trade, Department of Economic Analysis and Policy. The previous issue of the article was published in RBI Bulletin, June 2009. |


