Indian Investment Abroad in Joint Ventures and Wholly Owned Subsidiaries: 2009-10 (April-June)* The article on Indian investment abroad in joint ventures (JVs) and wholly owned subsidiaries (WOSs) is brought out along with the quarterly release of India’s balance of payments (BoP) statistics. The present article reviews India’s outward foreign direct investment (FDI) in JVs and WOSs during the quarter April-June 2009.
I. India’s Outward FDI Proposals1
I.1 Magnitude
During the quarter April-June 2009, 918 proposals amounting to US$ 2,717 million were cleared for investments abroad in JVs and WOSs, as against 820 proposals amounting to US$ 3,322 million during the corresponding period of the previous year (Table 1). During the quarter under review, the number of investment proposals recorded a growth of 12.0 per cent over the corresponding quarter of the previous year, while the amount of proposals showed a decline of 18.2 per cent. Equity accounted for 44.5 per cent of the amount of proposals for investment, followed by guarantees (29.5 per cent) and loans (26.0 per cent). During the corresponding quarter of the 2008-09, equity constituted 74.5 per cent of the amount of proposals for investment, while loans and guarantees formed 17.8 per cent and 7.7 per cent, respectively. Thus, during the first quarter of 2009-10, the shares of loans and guarantees in total amount of investment proposals showed a rise, whereas the share of equity exhibited a significant fall.
Table 1: India’s Outward FDI - Proposals Cleared |
Period/Route of Approval |
Number of Proposals |
Amount of Proposals (US $ million) |
Equity |
Loans |
Guarantees |
Total |
1 |
2 |
3 |
4 |
5 |
6 |
April-June 2008 |
I. Approval Route |
2 |
37.59 |
- |
- |
37.59 |
II. Automatic Route |
818 |
2435.63 |
590.52 |
258.09 |
3284.24 |
Total (I+II) |
820 |
2473.22 |
590.52 |
258.09 |
3321.83 |
April-June 2009 |
I. Approval Route |
- |
- |
- |
- |
- |
II. Automatic Route |
918 |
1208.86 |
706.45 |
801.35 |
2716.66 |
Total (I+II) |
918 |
1208.86 |
706.45 |
801.35 |
2716.66 |
Note: Data are provisional. |
During the quarter under review, all the proposals cleared for investment were through automatic route and there was no proposal through approval route2 . During the corresponding quarter of the previous year, 99.8 per cent of the proposals involving 98.9 per cent amount were through automatic route, while the rest were through approval route. Under automatic route, equity had the highest share (74.2 per cent), while under approval route all the proposals were under equity only.
I.2 Sectoral Pattern and Direction
I.2.1 Sectoral Pattern
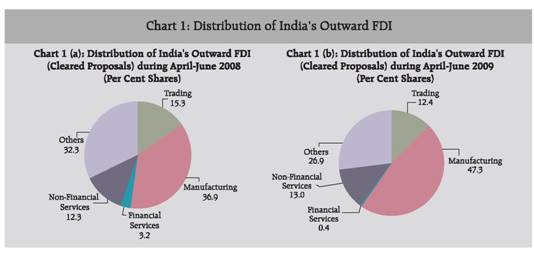
During the quarter April-June 2009, out of the total amount of outward FDI proposals cleared, 86 per cent of the amount was for the investments of US$ 5 million and above. Sector-wise distribution of these investment proposals shows that 47 per cent of the amount of proposals was in manufacturing, followed by non-financial services (13 per cent), trading (12 per cent), financial services (0.4 per cent) and the balance was in others (Table 2 and Chart 1). During the corresponding quarter of the previous year, 92 per cent of the amount of cleared proposals was for investments of US$ 5 million and above, and of these, 37 per cent of the amount was in manufacturing, followed by trading (15 per cent), non-financial services (12 per cent), financial services (3 per cent) and the rest was in others. During April-June 2009, within the manufacturing sector, proposals were in the areas like telecommunication, transport equipments, plastic and rubber products, vehicles, drugs, pharmaceuticals, mining and textiles. Proposals in trading covered investments in areas, such as electrical equipments, wood and wood products and software packages. Investment proposals in financial services comprised services like those related to shares and securities, while those in non-financial services included, inter alia, software development, professional services, oil exploration, consultancy and education. The category of ‘others’ included several miscellaneous activities such as civil construction projects, shipping, industrial tools, chemical products and mining. The pattern of investment proposals in the first quarter of 2009-10 revealed that the shares of manufacturing and non-financial services in the total amount of proposals increased, while those of trading and financial services declined.
Table 2: Distribution of India’s Outward FDI (Cleared Proposals) |
(US $ million) |
Sectors |
April-June |
2008 |
2009 |
1 |
2 |
3 |
Trading |
463.8 |
290.0 |
Manufacturing |
1121.7 |
1105.3 |
Financial Services |
97.2 |
10.0 |
Non- Financial Services |
372.6 |
303.4 |
Others |
983.6 |
628.5 |
Total |
3039.0 |
2337.2 |
Note : Figures relate to investments of US$ 5 million and above. |
I.2.2 Direction (Recipient Countries)
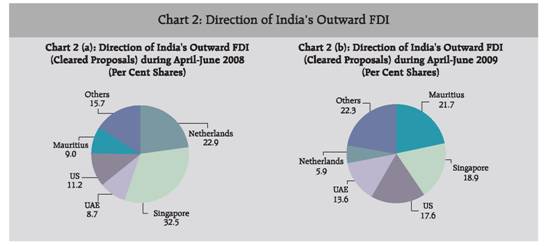
Direction of investment proposals indicated that Mauritius, Singapore, the US and the UAE together accounted for 72 per cent of the amount of proposals for outward FDI (US$ 5 million and above) during April-June 2009 (Table 3 and Chart 2). During the corresponding quarter of the previous year, Singapore, the Netherlands and the US accounted for 67 per cent of the amount of proposals. Thus, Singapore and the US continued to be the leading destinations for India’s outward FDI.
Table 3: Direction of India's Outward FDI (Cleared Proposals) |
(US $ million) |
Country |
April-June |
|
2008 |
2009 |
1 |
2 |
3 |
Mauritius |
284.1 |
551.1 |
Singapore |
1023.8 |
480.1 |
US |
352.4 |
446.0 |
UAE |
275.8 |
346.3 |
Netherlands |
723.4 |
149.8 |
Switzerland |
42.6 |
64.2 |
British Virgin Islands |
49.8 |
59.3 |
Cyprus |
13.3 |
56.1 |
Hong Kong |
22.8 |
23.0 |
Germany |
14.8 |
20.8 |
Others |
352.0 |
341.4 |
Total |
3154.8 |
2538.2 |
Note : Figures relate to investments of US$ 5 million and above. The totals in this Table may differ from those given in Table 2 as some of the country-wise proposals having an individual amount of US$ 5 million and above, may involve more than one sector and vice versa. |
II. India’s Outward FDI: Actual Outflows3 II.1 Magnitude of Outflows
The decline witnessed in India’s outward investment in 2008-09 continued in 2009-10 so far, as an outcome of global financial crisis and resultant slowdown in world GDP growth, which adversely affected global FDI flows. Actual outward FDI during the quarter April-June 2009 stood at US$ 2,026 million, which was lower by 39.4 per cent than US$ 3,343 million during the corresponding quarter of the previous year (Table 4). Outflows under equity and loans showed a decline of 38.6 per cent and 42.4 per cent, respectively. Of the total investment amount, 79 per cent was in the form of equity and the remaining 21 per cent was in loans. There was no invocation of guarantee during the period. During April-June 2008, 78 per cent of the amount of outflows was in the form of equity and the rest was in loans, while there was no invocation of guarantee. Thus, during the quarter under review, the share of equity in actual outward FDI has marginally increased. As such, equity continued to be the dominant mode of financing the investment proposals. Moreover, during April-June 2009, the proportion of ‘actual investment outflows’ to ‘cleared investment proposals’ declined to 75 per cent from 101 per cent a year ago.
Table 4: India's Outward FDI - Actual Outflows |
(US $ million) |
Period |
Equity |
Loans |
Guarantees Invoked |
Total |
1 |
2 |
3 |
4 |
5 |
2007-08 (April-March) |
15775.0 |
3175.1 |
- |
18950.1 |
2008-09 (April-March) |
13738.4 |
3005.2 |
- |
16743.6 |
April-June 2008 |
2603.1 |
739.9 |
- |
3343.0 |
April-June 2009 |
1599.2 |
426.3 |
- |
2025.5 |
Note: Data are provisional. |
Annex I:
India’s Overseas Investment – Major Liberalisation Measures since 2000 The introduction of FEMA in 2000 brought about significant policy liberalisation. The limit for investment up to US$ 50 million, which was earlier available in a block of three years, was made available annually without any profitability condition. Companies were allowed to invest 100 per cent of the proceeds of their ADR/GDR issues for acquisitions of foreign companies and direct investments in JVs and WOSs.
Automatic route was further liberalised in March 2002 wherein Indian parties investing in JVs/WOSs outside India were permitted to invest an amount not exceeding US$ 100 million as against the earlier limit of US$ 50 million in a financial year. Also, the investments under the automatic route could be funded by withdrawal of foreign exchange from an authorised dealer (AD) not exceeding 50 per cent of the net worth of the Indian party.
With a view to enabling Indian corporates to become global players by facilitating their overseas direct investment, permitted end-use for ECB was enlarged to include overseas direct investment in JVs/WOSs in February 2004. This was designed to facilitate corporates to undertake fresh investment or expansion of existing JV/WOS including mergers and acquisitions abroad by harnessing resources at globally competitive rates.
In order to promote Indian investment abroad and to enable Indian companies to reap the benefits of globalisation, the ceiling of investment by Indian entities was revised from 100 per cent of the net worth to 200 per cent of the net worth of the investing company under the automatic route for overseas investment. The limit of 200 per cent of the net worth of the Indian party was enhanced to 300 per cent of the net worth in June 2007 under automatic route (200 per cent in case of registered partnership firms). In September 2007, this was further enhanced to 400 per cent of the net worth of the Indian party.
As a simplification of the procedure, share certificates or any other document as an evidence of investment in the foreign entity by an Indian party which has acquired foreign security should not be submitted to the Reserve Bank. The share certificates or any other document as evidence of investment where share certificates are not issued would be required to be submitted to and retained by the designated AD category–I bank, which would be required to monitor the receipt of such documents to ensure bona fides of the documents so received.
The Indian venture capital funds (VCFs), registered with the SEBI, are permitted to invest in equity and equity-linked instruments of offshore venture capital undertakings, subject to an overall limit of US$ 500 million and compliance with the SEBI regulations issued in this regard.
The Liberalised Remittance Scheme (LRS) for Resident Individuals was further liberalised by enhancing the existing limit of US$ 100,000 per financial year to US$ 200,000 per financial year (April-March) in September 2007.
The limit for portfolio investment by listed Indian companies in the equity of listed foreign companies was raised in September 2007 from 35 per cent to 50 per cent of the net worth of the investing company as on the date of its last audited balance sheet. Furthermore, the requirement of reciprocal 10 per cent shareholding in Indian companies has been dispensed with.
The aggregate ceiling for overseas investment by mutual funds, registered with SEBI, was enhanced from US$ 4 billion to US$ 5 billion in September 2007. This was further raised to US$ 7 billion in April 2008. The existing facility to allow a limited number of qualified Indian mutual funds to invest cumulatively up to US$ 1 billion in overseas Exchange Traded Funds, as may be permitted by the SEBI, would continue. The investments would be subject to the terms and conditions and operational guidelines as issued by SEBI.
Registered Trusts and Societies engaged in manufacturing/educational sector have been allowed in June 2008 to make investment in the same sector(s) in a Joint Venture or Wholly Owned Subsidiary outside India, with the prior approval of the Reserve Bank.
Registered Trusts and Societies which have set up hospital(s) in India have been allowed in August 2008 to make investment in the same sector(s) in a JV/WOS outside India, with the prior approval of the Reserve Bank.
* Prepared in the Division of International Trade, Department of Economic Analysis and Policy. The previous issue of the article was published in RBI Bulletin, July 2009.
1 India’s outward FDI in this article refers to Indian investment abroad in joint ventures (JVs) and wholly owned subsidiaries (WOSs) by Indian public and private limited companies, registered partnership firms and remittances in respect of production sharing agreements for oil exploration.
2 Indian residents are permitted to make investment in overseas joint ventures and wholly owned subsidiaries under automatic route and approval route. Under automatic route, all proposals are routed through designated authorised dealer banks, and these do not require prior approval from the Reserve Bank. Proposals not covered by the conditions under automatic route require the prior clearance of the Reserve Bank and come under approval route.
3 Financing of outward FDI by Indian entities is broadly in the form of equity, loan and guarantee. These include sources, such as drawal of foreign exchange in India, capitalisation of exports, funds raised through external commercial borrowings, foreign currency convertible bonds and ADRs/GDRs, and also through leveraged buyouts by way of setting up of special purpose vehicles (SPVs). The equity data presented in this article do not include equity of individuals and banks, and the SPVs set up for funding overseas investment, while BoP statistics, in addition, include the equity of banks (unincorporated banks’ branches operating abroad). |