 IST,
IST,
Inflation Expectations Survey of Households
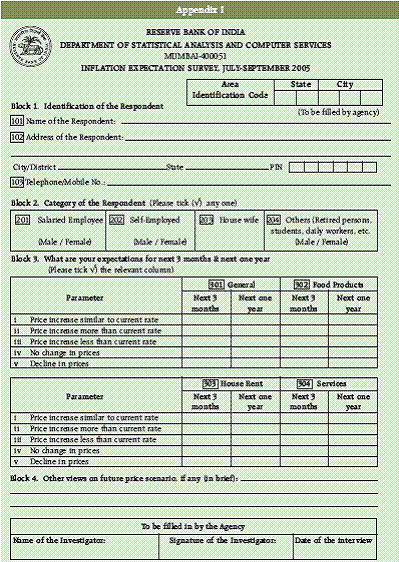
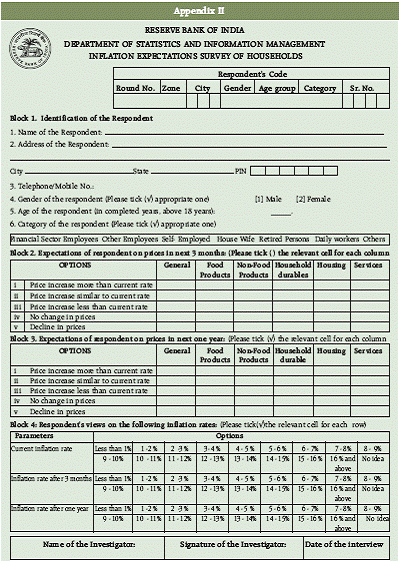
Inflation Expectations Survey of Households* Maintaining price stability is a prime objective of monetary policy. Towards this end, central banks strive to anchor inflation expectations and, therefore, need to collect information on inflation expectations. Survey-based approach is, inter alia, a mechanism to construct estimates of inflation expectation.The Reserve Bank of India has been conducting the inflation expectations survey of households (IESH) on a quarterly basis for over four years now. The survey captures the inflation expectations of 4000 urban households from 12 cities spread across the country. The survey represents the expectation of inflation for the respondent’s own basket of consumption. The inflation numbers from this survey thus represent the expectations of urban households based on the average inflation of 4000 different consumption baskets. These are not to be regarded as predictors of any official measure of inflation. The households’ inflation expectations provide useful directional information on near-term inflationary pressures and are used to supplement other economic indicators to get a better indication of future inflation. This technical note presents the details on the conceptualisation of the survey, its technical audit for methodology and data quality, methodological improvements based on expert opinion and the implementation of the recommendations of the Technical Advisory Committee on Surveys (TACS) and the survey results. I. Introduction Controlling inflation is a prime objective of monetary policy. For this purpose, central banks need to know the determinants of inflation. Both theoretical considerations and empirical evidence suggest that inflation expectations are a crucial ingredient for monetary policy. Measures of inflation expectations are therefore important to central banks to achieve their mandate towards price stability. In order to achieve their mandate for low and stable inflation, the central banks seek to gain knowledge about the public’s expectations for inflation in addition to the financial market based measures. The inflation targeting countries also use the public’s expectations of inflation as an indication of the performance and credibility of their monetary policy. Households in any economy form their inflation expectations which influence future path of inflation of the economy. A wide range of the households’ intertemporal decisions (e.g., purchases of perishable and durable goods, price of housing, borrowing costs and return on saving, investment and wage negotiation) can be affected by expectations and uncertainty about future inflation. Survey-based approach is one of the several ways of estimating inflation expectations. Some of the other approaches involve extraction of information from financial market instruments. For example, the differential yields of ordinary and inflation-indexed government bonds of similar maturity may provide some indication of inflation expectations. However, the simplest way to gauge people’s expectations for inflation is to ask them what they expect. The survey measures of inflation expectations are important to policy makers and researchers because they provide data on an otherwise unobservable variable. Keeping in view the importance of inflation expectations as an input for monetary policy, the price and inflation expectations of households are being captured by RBI through its quarterly Inflation Expectations Survey of Households (IESH) since September 2005. The survey presents a measure of households’ present perception of inflation as well as its expectations for the near future. The households’ inflation expectations are distinctly different from the inflation measures available through the official price indices as the basket of consumption of the survey participants varies as per their requirement and perception. II. Inflation Expectation Survey of Household - Background The inflation expectations survey of households is conducted in twelve cities, three each from the north, south, east and west zone covering the major metros from each zone and eight other cities. The respondents are chosen within a city in such a manner that a good geographical coverage is achieved. Quota sampling is used to get adequate representation of gender, categories and age groups. In the initial two rounds of IESH, the schedule sought only qualitative feedback on respondent’s expectation on general prices for the next quarter and for a year ahead. Additionally, expectations of prices for food products, non food products, household durables, houses and services were also collected. The initial questionnaire is placed at Appendix I. From Round 3 onwards quantitative questions were added to seek the expected rate of inflation for the next three months and one year. From the ninth round onwards a question on the respondent’s perception of the present rate of inflation was also sought. The latest questionnaire is placed in Appendix II. International experience on Inflation Expectations Many countries are now conducting household inflation expectation survey. They use different methodologies, e.g. mail survey, telephonic survey, internet survey and face-to-face interviews. Some banks do independent surveys (e.g. Federal Reserve Bank of New York, Bank of England, Reserve Bank of New Zealand, South African Reserve bank, Czech National Bank) while some as a part of their consumer confidence survey (e.g. European Commission, Riksbank, Bank of Japan, Australia). Different designs, like independent sample in each round, pure panel and repeat panel, are used by different countries for such surveys. The Bank of England has been conducting inflation attitudes survey since 1999. The survey asks a range of questions that examine public knowledge and understanding of, and attitudes towards, the MPC process, including people’s expectations of inflation. The survey is quarterly and covers 2000 households in its May, August & November rounds and 4000 households in the February round where a larger questionnaire is canvassed. The summary data is released every quarter on the bank’s web site and an annual article is put up in its Quarterly Bulletin. The United States of America has market based measures of inflation expectations but still gives importance to the survey based inflation expectations measure for more than 60 years. The monthly Michigan survey and Conference Board survey are the most widely used surveys there. The Federal Reserve Bank of New York in collaboration with the Cleveland Federal Reserve initiated the Household Inflation Expectations Project (HIEP) in late 2006. They found the importance of wording of the questions in the survey. While questions on ‘prices in general’ prompts respondents to think of the most visible prices (gasoline and food), questions on ‘rate of inflation’ makes respondents to reflect about general prices and measures the inflation concept economists have in mind. They conduct internet survey every six weeks on a fixed panel of respondents and seek probability distribution of the respondents’ inflation expectations, to help them assess the degree of individual uncertainty about future inflation outcome (see Wandi Bruine de Bruin et al1) The Reserve Bank of New Zealand (RBNZ) conducts quarterly household inflation expectation survey since 1995. The survey is telephonic and is conducted by sponsoring a market research company. The key results are published on RBNZ website according to an advance release calendar. The South African Reserve Bank conducts a dedicated quarterly inflation expectations survey since 2000 with the help of Bureau of Economic Research. It used the interview method for the household survey. In 2009, the Centre for Central Banking Studies, UK and National Bank of Poland2 carried out a survey of 21 countries, of which 14 were inflation targeters, on inflation expectation measures used. According to the survey, 85 per cent of the central banks use survey measure of inflation expectations for consumers. However, only 47.6 per cent of the banks surveyed used inflation expectations as a measure of leading indicator while 57 per cent used it in modeling and forecasting of inflation. An inter department Standing Committee in the Reserve Bank monitors the technical aspects of the survey. In March 2007, the Reserve Bank constituted a Technical Advisory Committee on Surveys (TACS) under the chairmanship of Dr. Rakesh Mohan, the then Deputy Governor and with external experts drawn from the Indian Statistical Institute, Indira Gandhi Institute of Development Research, and market analysts as external members and representatives from user departments as internal members, to review the methodology and examine the data quality of various rounds of survey. The initial analysis of TACS found that there were internal inconsistencies in the survey data. The TACS made several recommendations on improving the data quality and consistency. The Bank implemented the recommendations that largely pertained to regrouping of questions as in the present schedule, introduction of a uniform investigator training (Appendix III) at the central office and the regional offices of RBI and carrying out of field check by RBI staff at all centres where the survey is conducted. The subsequent analysis by TACS of the unit-level data from later survey rounds, conducted after implementation of those recommendations, shows satisfactory improvement in data quality. In its report of September 2009, the Committee being satisfied with the survey data quality recommended the placement of the survey results in public domain. Based on the analysis of variability in survey responses, TACS found that the sample size is adequate to get estimates at all-India level. The composition of the TACS and its report containing detailed analysis and recommendations of earlier survey rounds are presented in Appendix IV. The TACS report recommended that “the Reserve Bank should emphatically clarify that the IESH survey results are those of the respondents and are not necessarily shared by the Reserve Bank. It also needs to be explained that the inflation rate is as assessed by the respondents based on household consumption basket which need not be related with inflation rate as measured by any official price index series.” The Reserve Bank’s Internal Working Group on Surveys (Chairman: Shri Deepak Mohanty) noted that “Expectations of inflation can influence the linkage between money, interest rates, and prices. Many household and business decisions depend on the inflation expectations of market participants. First, inflation expectations are important for wage negotiations. Second, inflation expectations play a key role in households’ saving decisions. For a given level of nominal interest rates, higher expected inflation implies a lower expected real rate of return on saving. That would tend to make spending today more attractive relative to saving. Finally, businesses need to make a judgement on the likely path of the prices of other goods that they may be competing with, so that they can judge the likely demand for their product. If they expect the prices of other goods to be higher, that may prompt them to raise their own output prices [Benford and Driver3]. Thus arriving at a measure of inflation expectation attains importance for policy makers.” The Working Group on Surveys (WGS) also carried out additional evaluation of Survey Results. The analysis carried out by them revealed that, among different factors like gender, age, city and category of respondents, city is the largest source of variation in the households’ response. This was logically appealing as the consumption pattern varies across cities and large intercity variations are also reported through official price indices. They also assessed the quality of estimates of households’ inflation expectation by working out confidence intervals using bootstrap resampling plan. They found that the confidence intervals were narrow with width of around 20 to 30 basis points. The Group found that the short survey schedule that is used for the survey is adequate to meet its scope. The Group recommended that since the IESH has stabilised, the Technical Advisory Committee on Monetary Policy (TACMP) may consider placing the survey in public domain. The TACS observed “in the context of monetary transparency, it is important that all the indicators related to inflation and inflation expectations that are considered by the Reserve Bank are available to the market. As the data of the last few rounds of Survey has high consistency, the results may be placed in public domain. A one-time article may be published giving earlier survey results.” It further recommended that “when releasing the survey results, the details of the concepts and methodology may also be given by the Bank, it will be interesting to see other agencies in India take up similar surveys.” This article is expected to fulfill this need. The TACS and WGS recommendations along with the survey results were presented to the Bank’s TACMP and as recommended by them, the results were also discussed in a Seminar of select analysts, economists and market researchers in December 2009. The pros and cons of the issue were debated at length in the Seminar and a consensus was arrived that the IESH results should be placed in the public domain. III. Survey Methodology and Scope The survey schedule that has been designed for the IESH is a single-page schedule. It has been organised into four blocks. The first block seeks respondent particulars including name, contact details, gender, age and category (occupation). The second and third blocks seek product wise price expectations respectively for three months and a year ahead. The fourth block collects the rate of inflation of the respondent for three time points - current, three month ahead and one year ahead. III.1 Coverage : The Reserve Bank conducts the survey in 12 cities every quarter. The major metropolitan cities, viz., Delhi, Kolkata, Mumbai and Chennai are represented by 500 households each while the eight other cities, viz., Jaipur, Lucknow, Bhopal, Ahmedabad, Patna, Guwahati, Bangalore and Hyderabad are represented by 250 households each. The respondents are well spread across the cities to provide a good geographical coverage. The male and female respondents in the group are usually in the ratio of 3:2. The category wise representation of the respondents is presented in the table below. The sample coverage is nearly as per the target in all rounds.
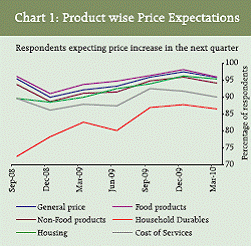
III.2 Information Collected The price expectations are sought in the survey for general prices and for five groups (food products, non-food products, consumer durables, housing and others). The general price indicates all the other product groups taken together. The options for responses are (i) price increase more than current rate, (ii) price increase similar to current rate, (iii) price increase lower than current rate, (iv) no change in prices, and (v) decline in prices. The first three of the five options pertain to the respondents’ expectations on the rate of future price increase compared to the current rate. These expectations are sought from the respondents for 3 months ahead as well as a year ahead period. The inflation expectations of the respondents that represent the year-on-year changes in prices are collected through Block 4. The inflation rates are collected in intervals - the lowest being ‘less than 1 per cent’ and the highest being ’16 per cent and above’ with 100 basis point size of all intermediate classes. The rest of this article presents the results of the survey. IV. Survey Results IV.1 Expectations on Prices General Price Expectations: The survey shows that the general prices expectations for both 3 months ahead and one year ahead which were lowest in December 2008, started rising in March 2009 and have been upwardly mobile since then. However, in March 2010, the 3 months ahead price expectations have decreased while the one year ahead price expectations have marginally increased. The percentage of respondents who expect this price increase to be higher than current rate have also risen consistently from March 2009 to December 2009, but declined significantly in March 2010 (Table 2). Product wise Price Expectations: The product wise price expectations are given in Statement I. The price expectations show that the respondents have highest expectations for price rise for food products which were continuously rising since December 2008 but declined in March 2010. The general price expectations are closer to food expectations indicating that respondents consider food prices very important when they think about the prices in general. The expectations of price rise were lowest for household durables among all product groups. IV.2 Inflation expectations The inflation expectations are collected through the Block 4 of the schedule. The average inflation expectations presented below represent the average of 4000 respondents. As mentioned earlier these are based on individual consumption baskets and are not an assessment of the prevalent official inflation rates. These should be seen as an inflation rate of households that represents the average over 4000 different consumption baskets.
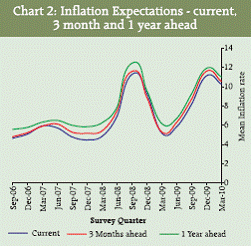
The perception of current inflation and expectations of three month and one year ahead inflation since Round 5 of the survey are shown in the graph below. The time series movement of the inflation expectations show that the future inflation expectations are usually higher than the current perception. There were, however, few exceptions to this observation- in March 2007 and in December 2008 the future (three month ahead) inflation expectations were lower than the current perception of inflation. The survey shows that during the initial two year period up to March 2008, the inflation expectations were stable and thereafter started rising sharply. There was a subsequent fall starting December 2008 that took the numbers to 5 to 6 per cent band and the inflation expectations have been increasing since then. In the latest round of the survey, the numbers were in the range of 10 to 11 per cent.
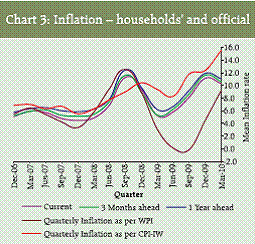
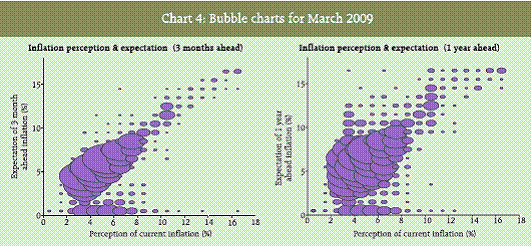
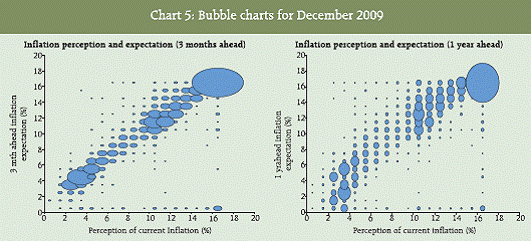
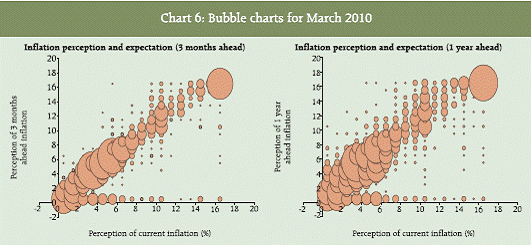
It is seen from Chart 2 that the future expectations of inflation move closely in tandem with the current perception of inflation. Thus though the numbers do not attempt to predict the quantum of future inflation, they give useful input on directional movement of inflation – i.e. when the expectations are rising and when they start moderating. The Chart 3 presents the household inflation expectations along with the official inflation measures based on Wholesale Price Index (WPI) and Consumer Price Index for Industrial Workers (CPI-IW). It shows that for a large part of the survey history, the households’ inflation expectations remained between the WPI and CPI-IW inflations. The volatility in responses over different rounds can be seen from the table below. It can be seen that the uncertainty increases with distance in time. The standard deviation is lower for current inflation rate than for the 3 month and one year ahead. This seems to be on expected track as it is more difficult to identify the forthcoming events and measure their impact on inflation. The volatility is also depicted through the bubble charts as under. In the chart, the distribution of respondents over different inflation brackets is presented. The x-axis pertains to perception of current inflation while the y axis for future inflation expectation (3 month ahead and one year ahead respectively in the two charts). The size of each bubble indicates the number of respondents selecting the corresponding options. The Chart 4 pertaining to March 2009 survey shows that the bubbles are diagonal heavy - meaning that the future expectations are influenced by current perceptions. Also there is a concentration of responses in the 2 to 8 per cent range and the average inflation expectations were between 5 to 6 per cent.
The corresponding bubble charts for December 2009 round shows that a high proportion of respondents are expecting the inflation to be in the range of more than 16 per cent. The average inflation expectations in this period were between 11 to 12 per cent. Also the responses are scattered and variability is high. This phenomenon of high variability in households’ inflation expectations has been observed, internationally, during the periods of high inflation. In the recent quarter, the concentration of inflation expectations on the lower side have started increasing and both inflation expectations and the variability in responses have come down marginally as portrayed in Chart 6.
The relationship of future inflation with current inflation from Round 13 onwards is presented in Statement II. IV.2.1 Inflation expectations by gender The inflation expectation according to gender since Round 13 shows that significant gender wise differences do not exist in the survey. However, the variability in responses is generally higher in female respondents as compared to their male counterparts for the current inflation rate. For future inflation, usually the responses of male respondents are less cohesive.
IV.2.2 Inflation expectations by category of respondent The category of respondents shows their occupation status. The category wise inflation expectations since Round 13 are given in Statement III. For the latest survey round, daily workers reported highest inflation expectations but the variation in their responses was also higher than those of other category of respondents. IV.2.3 Inflation expectations by age group The IESH covers only the adult responses of 18 years or more. The age wise inflation expectations since Round 13 are given in Statement IV. Across rounds, no uniform age wise trend is seen in the survey responses. The latest round of the survey shows that the respondents whose age is 45-50 years have highest inflation expectations. But the variation in responses is lowest for the respondents of age group upto 25 years. IV.2.4 City wise Inflation expectations The city wise responses on inflation rate show wide variations in inflation expectations across cities. The city wise inflation expectations since Round 13 are given in Statement V. It can be seen from this statement that in each survey round, city wise averages are very divergent. This reflects the divergence in consumption patterns across cities. The latest round of survey shows that the inflation expectation for Bangalore was highest while it was lowest for Chennai.
V. Summary The Reserve Bank monitors an array of measures of inflation, both overall and disaggregated components, in conjunction with other economic and financial indicators to assess the underlying inflationary pressures. The Reserve Bank of India’s quarterly inflation expectations survey of households (IESH) captures the inflation expectations of 4000 urban households across 12 cities spread across the country. The survey represents the expectation of inflation for the respondent’s own basket of consumption. The inflation numbers from this survey thus provide an expectation of urban Indian households based on the average inflation of 4000 different consumption baskets and are not predictors of any official measure of inflation. The households’ inflation expectations provide useful directional information on near-term inflationary pressures. The survey results show presence of large inter-city variances in households’ inflation expectations. The quarterly update articles on future IESH rounds would be published in the RBI Bulletin. It may again be emphasized that “IESH survey results are those of the respondents and are not necessarily shared by the Reserve Bank. The inflation rate is assessed by the respondents based on household consumption basket which need not be related with inflation rate as measured by any official price index series.”
Code Lists for filling in Respondents’ Codes:
B. City Codes
C. Gender Codes
D. Category Codes
E. Age Group Codes
Appendix III Training of investigators As recommended by TACS, a training of investigators is carried out before launch of each round of survey. The training, as designed by the experts at Indian Statistical Institute, Kolkata, is done in a uniform manner at each regional office and at the central office of the Department of Statistics and Information Management (DSIM). The training broadly covers the following:
Letter of Transmittal September , 2009 Dr. D. Subbarao Dear Sir, Report of the Technical Advisory Committee on We are pleased to submit our Report on the Inflation Expectations Survey of Households.
TABLE OF CONTENTS
Acknowledgements The Committee wishes to place on record its gratitude to Professor Shibdas Bandyopadhyay and Professor Debasish Sengupta of the Indian Statistical Institute (ISI), Kolkata for their active participation in the meetings of the Committee as special invitees and for sharing the burden of empirical validation of the micro-level data from various rounds of the IESH survey with the help of their team members at the ISI, Kolkata who handled this novel issue with expertise. The Committee also acknowledges the dedicated efforts put in by members of its Secretariat especially Shri S.N.S. Tyagi, Assistant Adviser, Department of Statistics and Information Management (DSIM), RBI who was associated with the initial analysis and Dr. (Smt.) Praggya Das, Assistant Adviser, DSIM, RBI who made valuable contributions in the deliberations and also shouldered the responsibility of drafting the Committee’s report. The Committee also appreciates the RBI team consisting of Shri M.S. Adki, Smt.Vijaya Gangadharan, Dr. O.S. Swami, Shri Avijit Joarder and other officials and staff members of Survey Division, DSIM for the secretariat support in bringing out this report. Report of the Technical Advisory Committee on Surveys 1. The Reserve Bank of India has been conducting quarterly surveys on inflation expectations (IE) of households since 2005 to seek views on inflationary expectations from the general public. The survey findings are presented every quarter in the Monetary Policy Strategy meeting and the highlights of the survey are presented in the quarterly meetings of the Technical Advisory Committee (TAC) on Monetary Policy. In the seventh meeting of the TAC on Monetary Policy held in January 2007, a member pointed to the divergence between the results of the IE survey and price movements reflected in official price indices. Subsequently, a Technical Advisory Committee on Surveys (TACS) was constituted by the Reserve Bank under the chairmanship of Dr. Rakesh Mohan, Deputy Governor to review the methodology and data quality of various rounds of survey and suggest ways to improve on it. 2. For more than a year and a half, the TACS has been watching the Survey data and suggesting recommendations on improving the data quality and consistency. This report presents the developments over this period and the recommendations of the Committee on placing the survey results in public domain. 3. The Report is organised in four sections, Section I being introduction. The Section II presents a brief theoretical background, measurement issues for inflation expectation and a review of international practice in carrying out the survey. The review indicates the findings of these surveys are used by the respective central banks of these countries for gauging the public sentiment on inflation. The central banks are usually the major stakeholders and conduct the survey themselves or by appointing an agency to conduct the survey for them. Some countries have more than one such survey. The data are published by them on their websites and periodic articles on the subject are brought out in their publications. There are several countries where private agencies, universities or statistics offices conduct such surveys. 4. Section III presents the details on RBI’s Inflation Expectation Surveys of Households (IESH). It provides details on the first report of the TACS, the recommendations it made, the follow-up of recommendations and subsequent developments. To study the effect of RBI’s close examination of the IESH data, the ISI team carried out quality checks on subsequent rounds of data. This analysis for the later rounds of survey broadly indicated that the
5. Section III also presents an exercise carried out by RBI on some additional characteristics of IESH data 6. Section IV presents the conclusion and recommendations. The major recommendations of the survey are: A. Releasing the survey results in public domain
B. The questionnaire
C. Logistic issues of the survey
D. Further analysis of data
List of Acronyms
Section I 1.1 Inflation control is central to a good public policy of which monetary policy is a critical component. Price stability is one of the prime objectives of monetary policy. Low stable inflation and well-anchored inflation expectations also aid in achieving the other two objectives of monetary policy, namely, economic growth and financial stability. Unstable inflation expectation cause noise into the price system and makes long-term financial planning more complex by undermining public confidence in the economy and in the management of economic policy, with potentially adverse effects on risk-taking, investment, and other productive activities that are sensitive to the public’s assessments of the prospects for future economic stability. 1.2 The state of inflation expectations greatly influences actual inflation and thus the central bank’s ability to achieve price stability. Central Banks pursue the objective of anchoring inflation expectations. Well-anchored inflation expectations are relatively insensitive to incoming data, i.e., the long-run expectation of inflation of public changes little, in a period witnessing inflation that is higher than their long-run expectation. If, on the other hand, the public reacts to a short period of higher-than-expected inflation by marking up their long-run expectation considerably, then expectations are poorly anchored. In a market economy, employees are concerned with the purchasing power of their earnings, and bargain their nominal pay accordingly since higher prices reduce real spending power. If inflation is expected to be persistently higher, employees may seek higher nominal wages, which could in turn lead to upward pressure on companies’ output prices and, hence, higher consumer prices. Inflation expectations of producers also affect inflation directly by influencing their pricing setting behaviour. If the business sector expects higher generalised inflation in future, it would believe that prices of products can be increased without suffering a drop in their demand. 1.3 India has a rich history of collection of price data and release of price indices. The index of Indian prices was compiled and released on a regular basis since 1861 giving inflation rates based on domestic price index at major group levels along with export and import price indices. The weekly Wholesale Price Index (WPI) is being compiled uninterruptedly since 1939 and provides rich and detailed data for monitoring of inflation at aggregate as well as at disaggregated levels. The consumer price inflation is estimated based on consumer price index (CPI) for four population groups, viz., industrial workers, urban non-manual employees, agricultural labourers and rural labourers, of which the first one is used for wage indexation in the organised sector. Inflation rates based on all the official price indices are keenly watched by public authorities for taking measures relating to supply and demand management. While these inflation measures reflect the past (observed) inflation, additional information on the perceived changes in inflation expectations is considered a prerequisite in a forward-looking framework of monetary policy analysis. 1.4 It is essential for the effectiveness of monetary policy that inflation expectations remain anchored to the target range. Good estimates of inflation expectations, and understanding what influences them, are therefore important for successful monetary policy. Most of the central banks, which have adopted inflation targeting as an objective of monetary policy and a few other central banks, which have not adopted inflation as an objective of monetary policy are conducting inflation expectation surveys regularly. The results of inflation surveys are mainly used in two ways, namely for inflation forecasts and to evaluate their policies adopted in controlling inflation. I.1 Formation of TACS 1.5 In a bid to keep a tab on changes in household expectation of prices across different population groups in major cities of the country, the Reserve Bank has been conducting quarterly survey on inflation expectations of households (IESH) since 2005. 1.6 The survey findings are presented every quarter in the Monetary Policy Strategy meeting and the highlights of the survey are presented in the quarterly meetings of the Technical Advisory Committee on Monetary Policy (TACMP). In the seventh meeting of the TAC on Monetary Policy held in January 2007, a member pointed to the divergence between the results of the IE survey and price movements reflected in official price indices. In view of its highly sensitive nature, before making the survey results public, it was considered critical to be assured of its methodological aspects, quality and consistency even though it in no way represents the views of the Reserve Bank. Subsequently in March 2007, a Technical Advisory Committee on Surveys (TACS) was constituted by the Reserve Bank under the chairmanship of Dr. Rakesh Mohan, Deputy Governor to review the methodology and examine the data quality of various rounds of survey. The composition of the TACS, both initial and current, is given in Annex–I. 1.7 For more than a year and a half, the TACS has examined the IESH data including those collected in the rounds conducted before the TACS constitution. It made several recommendations on improving the data quality and consistency and unit-level data from survey rounds conducted after implementation of those recommendations were also examined during this period. This report presents the developments over this period, the findings and the recommendations of the Committee including those on placing the survey results in public domain. I.2 Organisation of the Report 1.8 This Report is organised into four sections. Section II presents theoretical background and the international experience on inflation expectation measurement including those based on surveys. Section III presents the Inflation Expectation survey of the Reserve Bank, the findings of first TACS report, further analysis of IESH data and their consistency with other inflation measurement. The concluding Section IV presents the findings and recommendations of the Committee. Section II II.1 Theory and Measurement 2.1 Economic agents base their current demand and supply decisions based on their current and expected future income as well as their expectations on future inflation rates. Economic transactions are determined by the subjective distribution of expected inflation rates across agents and, from a macroeconomic point of view, the magnitude of their converged inflation expectations is critical 2.2 The changes in inflation expectations are associated with business cycle analysis and supply shocks. As per the “natural rate hypothesis” (Friedman–Phelps), inflation will affect output and unemployment only to the extent it is unexpected and to that extent the process of formation of inflation expectations is extremely important. On the other hand, the steady state path of inflationary expectations constitutes the difference between the nominal interest rate (influencing money demand) and the real interest rate (influencing capital accumulation decision) thereby influencing allocations of resources in an economy. Friedman (1969) argued that since there are virtually no resource costs of creating fiat money, overall efficiency requires a rate of expected inflation that drives the opportunity cost of holding money to zero and thereby satiates agents with real money balances. Until the mid- 1970s, it was generally believed expectations formation was based on adaptive expectations which make each period’s change in expectational variable proportional to the most recent expectational error. Such specifications allowed occurrence of costly repeated systemic expectational errors which were addressed under the rational expectations hypothesis which assumed economic agents expectational errors are independent over time with all elements of his information set. 2.3 There are various measures of inflation expectations, survey measures, and financial market measures. Internationally, the two main survey measures are the European Commission qualitative survey of European consumers, a monthly series, and the ECB’s own survey of professional forecasters. Whether survey measures of inflation expectations are a good representation of true scenario or not is a debatable point. They often do not track well with actual inflation rates. Indeed, survey measures of inflation expectations often tend to track better with current or past inflation than with future inflation, raising questions as to their usefulness as proxies for true expectations. However survey data generally provide very useful directional information regarding near-term inflationary pressures and can be used to supplement other economic indicators, giving a better indication of future inflation. 2.4 As regards financial market measures, prices of index-linked financial securities provide market-based measures of inflation expectations and attitudes to inflation risk. In the United Kingdom, ‘breakeven’ inflation rates derived from index-linked and conventional gilts reflect investors’ forecasts of future inflation, and also act as a barometer of monetary policy credibility. A more favourable market-based indicator is the inflation-linked swaps, in which agents trade their inflation expectations more directly. Implied breakeven inflation rates are a useful alternative to surveys and econometric forecasts. In times of fairly stable inflation, measures of inflation expectation are all very close to actual inflation. II.2 International Experience 2.5 Most of the central banks, which have adopted inflation targeting as an objective of monetary policy are conducting inflation expectation surveys regularly, while a few other central banks, which have not adopted inflation targeting are also collecting information on inflation expectations through surveys. The results of these surveys are mainly used for gauging changes in expectations and to evaluate their policies adopted for controlling inflation. 2.6 A summary of the inflation expectation surveys conducted in other major countries is provided in Table 2.1 with more details given in Annex-II. The review shows that the information on inflation expectation is either collected through dedicated Inflation Expectation Survey or by adding questions about inflation and other related parameters in Consumer Expectation/Consumer Confidence Survey. The periodicity of these surveys is either monthly or quarterly and the target respondent group of the survey is usually households. The surveys are conducted either through face-to-face telephonic interviews or through postal questionnaires. Most of the surveys attempt to elicit information on expected inflation figures along with the directional change in prices. Central bank involved in the conduct of such surveys release the survey results through their website and periodic articles on the subject are also brought out in their publications.
2.7 While some countries collect the inflation expectations as a number reported by the respondents (e.g. Australia), there are others that capture the information in class intervals. When class intervals are used, the range of classes are usually centred around their target inflation rate (e.g. United Kingdom). The Bank of England (BoE) in addition to seeking inflation expectations also seeks public’s attitude to interest rates and monetary policy and satisfaction with the BoE. Interestingly, in the wake of sharp increase in inflation during 2008, the BoE survey gave option to the respondents to indicate their perception outside the given range to capture the maximum variation while maintaining dynamic comparison across rounds. 2.8 Thus, households’ inflation expectation are critical inputs for central banks and other public agencies for gauging the public sentiment on inflation, for monitoring of the level of anchoring in inflation expectations and, consequently, for their own performance. Surveys are an important source of information in this regard. The central banks are usually the major stakeholders and conduct the survey themselves or by appointing an agency to conduct the survey for them. Some countries have more than one such survey. There are several countries where private agencies, academic/research institutions or statistics offices conduct such surveys. The survey results are generally released to the public. Section III
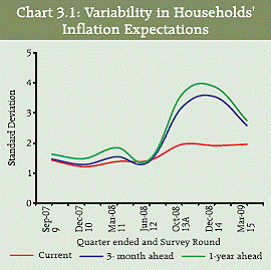
3.1 The Reserve Bank of India has been conducting the quarterly survey of inflation expectations of households since September 2005. The survey is being conducted with an endeavour for further improvement in information base used by the Bank for decision making towards meeting the objective of price stability. The first two rounds of the survey were qualitative and contained questions on changes in price expectations of households in relation to the prevailing inflation rate. In addition to expectations on general prices, expectations on prices of food products, non-food products, household durables, housing and services were also collected. The respondent categories include financial sector employees, other employees, self-employed, housewives, retired persons, daily workers and others. The survey also collected respondents’ details like name, gender, age and contact details. 3.2 From the third round onwards, additional questions on expected rate of inflation over the next three months and next one year were also asked. In September 2007, from the ninth round of the survey, a question on the respondents’ perception of the prevailing inflation rate was also added. The initial rounds of the survey kept equal representation of each category though the individual respondents keep changing across the survey rounds. From September 2008, the representation of different groups was changed, increasing the representation of “Housewife” and “Self-employed” persons and reducing those of the ‘Others’ category. 3.3 The survey is conducted in four metros and eight other major cities. The metros and other cities are chosen such that there are three cities from each of the four zones (North, South, East and West). While metros are represented by 500 households each, 250 households each are selected from other cities. The final sample is of 4000 households in each round of the survey. The sample is chosen randomly so as to cover the city uniformly. For each survey round, different areas of cities are chosen. 3.4 The survey is conducted by the Department of Statistics and Information Management (DSIM) of the Reserve Bank. An Inter-Departmental Standing Committee with a Chairman from DSIM and members from DSIM and user departments, viz., the Monetary Policy Department (MPD) and the Department of Economic Analysis (DEAP) monitors the technical aspects of the survey. 3.5 In the first meeting of the TACS held in April 2007, it was decided that Indian Statistical Institute (ISI), Kolkata will examine the survey methodology and look at the unit level data of the IE survey rounds for the four quarters of 2006. The objectives of the evaluation were to test consistency of data and to explore the scope of its analysis; to identify causes of anomaly, if any; and to make suggestions for improvements of the survey, based on the empirical investigation. III.1 First Report of TACS Findings 3.6 The findings of the ISI team were discussed in the 2nd meeting of the TACS in June 2007. These were also included the first report submitted by TACS in July 2007 to the Reserve Bank which contained the following major findings: 3.6.1 Multivariate Analysis of Variance (MANOVA) carried out with ‘gender’, ‘category’ and ‘city’ as factors indicated that city is the largest source of variation in each round of the IE survey. 3.6.2 There was very low standard deviation reported by some investigators, but mostly investigators reported variation. 3.6.3 It was found that most of the respondents gave quantitative responses on their expectation of inflation in the next quarter/year and the percentage of those who responded “don’t know” was very low. Moreover, the share of “don’t know” in 1-year horizon was more than that for the 3- month horizon which appears logical and internally consistent. 3.6.4 A consistency index was compiled for September and December 2006 for each city and category quarter surveys separately to check if there was any evidence of lack of consistency between the direct question on rate of inflation and the indirect question on change in rate of price. The analysis revealed some lack of consistency prevailing across all cities and all respondent categories. It also pointed out that there was a possibility that the direct question may have been misunderstood, as also some indirect questions. It was found that no category of respondents gave near-perfect and consistent answer. 3.6.5 In order to examine whether the respondents understood the indirect question correctly or not, a Consistency Index was constructed. It was observed that, as desired, the distribution of observations around the centre was heavy and only 7.3 per cent responses were on the extreme values indicating that the qualitative responses are broadly reliable. Recommendations 3.7 The following recommendations were made in the report: 3.7.1 On the Survey: 3.7.1.1 Considering the very large population size, adding one or two more cities in each zone will further improve the data quality. 3.7.1.2 As more rounds of surveys are conducted, there would be scope for additional useful analysis like testing the manner of expectations formation. 3.7.1.3 The instances of low standard deviation in case of few investigators to be treated with proper training of investigators. 3.7.1.4 The investigators should be trained to seek true perceptions from respondents and provide clarifications, if required, in simple terms without leading to any specific response. 3.7.1.5 There is a need for random checking of a few respondents (say 3 to 5 per cent) in each city through personal visits by the Reserve Bank’s staff to ensure the quality of data. 3.7.2 On the Questionnaire : 3.7.2.1 The option of “Don’t know” may be added in the qualitative part of the questionnaire. 3.7.2.2 A question on the rate of inflation prevailing three months ago may be added to be used as a concomitant variable for further analysis of data. 3.7.2.3 To club all the indirect (qualitative) questions together, followed by the direct (quantitative) questions. Follow up of TACS Recommendations 3.8 As suggested by the TACS, the survey schedule was modified to club all the quantitative questions in one block and place them after the qualitative block and pre-launch training of investigators was started. The investigators were sensitised about the purpose for which the survey was being conducted. They were told not to guide/ prompt the respondent or use any technical term. They were briefed about the inconsistencies. 3.9 To conduct training before each round of survey, and to keep the training uniform across the country, the specialised officers from the Regional Offices of DSIM were associated with the job of imparting the training to investigators at regional level in the future rounds of surveys. The Regional Offices were involved in conducting the survey not only by training of investigators but also by conducting quality check of the data (5 per cent each by field visit and phone calls). Thus the surveys from March 2008 onwards are being conducted with full involvement of the Regional Offices. 3.10 It was decided not to add a “Don’t know” option in the qualitative block. It was felt that if a respondent is not able to answer about the price movements for General or Food category, she/he would not be interviewed any further in keeping with the objective of the survey. Accordingly, such respondents who have not idea on the subject are not included in the survey and the schedule is canvassed in another household to ensure that the number of valid respondents does not go much below the target of 4000. On the other hand, if a respondent is able to express his/her price expectation for General and Food category, but not for any of the other categories, then the answer for those categories would not be insisted on and such schedules will be included in the survey. Subsequent developments 3.11 The TACS met for the third time on March 12, 2008. The members were briefed about the progress of the survey and the issue of placing the results of the survey in public domain was discussed in detail. The Committee reviewed the actions taken by RBI on the recommendations made by TACS. It was decided to wait and watch the quality of few more rounds of surveys after the recommendations of the TACS were implemented. 3.12 On the issue of increasing the sample size, the Committee felt that since the headline inflation is the only concern, present sample size may be adequate and the sample size of such time critical surveys cannot be too large. Meanwhile emphasis was laid on uniform training at each centre and monitoring data quality through field visit and telephonic checks. Wherever the quality was found unacceptable, the interviews were asked to be redone. The remaining incidence of inconsistency over the qualitative and quantitative block was thought to be addressed by emphasis on the same during the training to investigators. 3.13 It was felt that after assurance on methodological aspects of the IESH based on validation of subsequent survey rounds, the results could be published along with the methodology/procedure of the survey, the information about appointment of the TACS, its findings and recommendations, the subsequent action taken by the Reserve Bank and subsequent reviews by TACS. 3.14 In the 12th Round the question on 3 month back inflation was dropped as discussed with the ISI team. In the 12th Round of survey in June 2008, it was also found that more than 40 per cent respondents had responded the inflation value more than 8 per cent, the highest bracket. As high levels of inflation were prevailing in the economy then, the brackets of the qualitative blocks were extended to the right to capture the true variation in the responses. For the 13th Round, the highest class was made as ‘more than 16 per cent’ from ‘more than 8 per cent’ and the lowest class was made ‘less than 4 per cent’ as against ‘less than one per cent’ in earlier schedule. However, on a review, to keep class width same as that of earlier rounds, the brackets were again restructured, making the smallest as ‘less than 1 per cent’ and keeping the highest as ‘more than 16 per cent’. Each class width was kept as 100 basis points. An additional Round 13A was carried out in October 2008 with this set of brackets. III.2 Further Analysis of data quality by ISI team Internal consistency tests and other findings: 3.15 With close vigil on the data quality by the Reserve Bank in the subsequent survey rounds, further examination of survey data by the ISI team revealed that inconsistencies were reducing with new rounds of data (12th to 14th round). The consistency of qualitative and quantitative blocks has improved. The inter-consistency between quantitative and qualitative blocks has also shown improvement and the data is now nearly consistent. The logistic checks on interviews conducted per day, number of investigators used and duration of survey also show stability. 3.16 The details of quality checks carried out by the ISI team are given in the Annex-III. The summary of the findings are as under: 3.16.1 Inconsistency between responses to direct and indirect questions has reduced considerably; 3.16.2 Inconsistency between responses to different indirect questions has reduced considerably; 3.16.3 Standard deviation of response to direct question which was reducing over time increased in a period of high inflation; 3.16.4 Variation of average response from one city to another was observed. It was found that this trend is consistent across cities. 3.16.5 Non-uniform percentage of “Don’t know” answers to direct question across cities and over survey rounds. The trend continues and could reflect possible difference in way in which the investigator understands the question. It could also possibly indicate that in periods of high volatility in price movements, the respondents are unsure of what the inflation could be 3 month or one year down the line. 3.16.6 Three-month back inflation has as much variation as three-month ahead inflation and its presence did not serve much purpose. This question was discontinued from September 2008 round. Some cities had more than required number of investigators wheres there was more load on investigators in some other cities. This both extremes are undesirable. Incidentally, it was also noted that in instances of too many investigators, the count of investigator also increased due to different spelling of investigators’ name. 3.16.7 Wide variation was observed in the duration of survey in different cities (pointing towards different practice) continues. Further investigations revealed that the centres where the days taken appear to be too large are the centres where a particular investigator’s lot was rejected as none of his respondents could be reached. In such cases the interviews are asked to be redone at a later date and this increased the duration of survey in such centres. Thus, by and large, the survey data seems to be consistent on this account also. 3.16.8 Standard deviation of response to direct question was too small in some cities in earlier rounds. There has been some improvement in the recent rounds and this trend is not seen. In the June 2008 round, this was reported as that was the period when the inflation was reaching double digits and the households’ responses got clubbed in the largest bracket, thereby reducing the standard deviation. 3.17 Based on their analysis, the ISI team noted that the persistent efforts to improve the quality of survey data are yielding results and that the results can be put in public domain. III.3 Characteristics of IESH results 3.18 The additional analysis of new rounds of IESH data established good quality and high level of internal consistency. In order to identify the factors that explain the variations in responses of households, an analysis of the variability in households’ response is done. Behaviour of mean expectations 3.19 The inflation expectation survey of households measures perception on current inflation and expectations for 3-month ahead and 1-year ahead. The movement in these numbers over years, as seen from the table below, shows that the average perception of the households on the current rate has, throughout the survey history, been lower than the 3-month ahead expectations (with an exception of the December 2008 quarter) which are lower than the 1-year ahead expectation. Thus whether it is a low inflation environment or high inflation environment, households’ believe that the inflation in near future will be a shade higher than the prevailing rate. Deviation from central tendencies: 3.20 During 2007-08, the headline WPI inflation was stable and remained on an average around 5 per cent. The IESH rounds carried out during this period yielded stable inflation numbers, with low variation. When in 2008-09, there was a surge in inflation, the volatility in the response also increased as there was divergence in respondents’ expectation about inflation. We can see the variation in the three inflation numbers in the Chart 3.1.
Quality of estimates 3.21 The confidence intervals worked out using bootstrap resampling yields narrow confidence intervals of around 20 to 30 basis points. The size of the confidence intervals increases with the time horizon, indicating that the respondents are more coherent on their perception of the current inflation than their expectation of near future. This also shows that the estimates of households’ inflation expectations are of good quality. It can also be inferred from here that if the requirement for monetary policy is for a headline inflation expectation, than the present sample size of 4000 respondents covering different regions of the country is sufficient. However, if the intention is to get a regional flavour of inflation expectation or a measure at disaggregated level of a factor (age, category, etc), then the survey coverage could be extended by adding more cities or increase the respondents in those factors.
Factors explaining volatility in Households’ expectations 3.22 The total variability in responses is explained by different factors over different rounds. An analysis of variance carried out over different rounds of data revealed that city has been a significant source of variation in all rounds (Annex IV). City is expected to cause divergence in inflation expectations as the basket of consumption usually varies with city. Moreover different regions may be surplus or deficit in different products and the prices of these products may vary over regions. Free movements of goods may be bringing some uniformity in prices after adjusting for transportation costs, etc.; however there may be some lags in bringing about this homogeny. An analysis of city-wise data for the official consumer price index for industrial workers confirms similar wide divergence in inflation across cities. Detailed table of the analysis are presented in Annex-V.
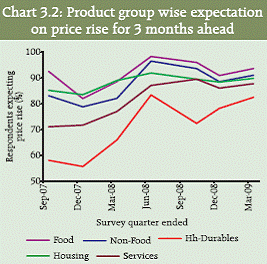
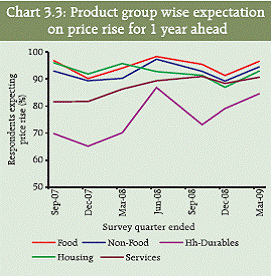
Product-wise price expectations 3.23 The price expectation, according to different product groups, shows that highest proportion of respondents expect price rise for the food products, both for the next quarter and next year. This trend has been observed so for a larger part of the survey history. In the official indices as well, the food-inflation has remained high in the last two years and the household price expectations were in tune with the actual prices movements prevailing in the economy. Similarly, the price expectations for household durables remained at the lowest among all product groups, mapping the movements of the inflation of the manufactured product group in WPI. The charts 3.2 and 3.3 show these movements for 3 month ahead and 1 year ahead periods.
Section IV 4.1 Based on the examination of the survey methodology and findings of the above analysis, and drawing from the international experience, the following recommendations are offered: 4.1.1 The quarterly Inflation Expectations Survey of Households (IESH) measures changes in consumers’ inflation expectations in the economy which is critical for monetary policy. Technical audit of the methodological aspects and consistency of such a critical survey is a right approach. Such an evaluation of survey results is one of the first of its kind in India. 4.1.2 Given the objective of timeliness of this survey, it is recognised that the survey is conducted nation-wide in a very short time span. The availability of time is even shorter for data scrutiny, processing, tabulation and analysis of results. Time-criticality becomes an overriding constraint for this policy survey. 4.1.3 It is found that local conditions and consumption patterns are the major sources of variation in differing inflation expectations across various centres. Accordingly, cities are the largest source of variations. This comes as no surprise and is consistent with the city-wise divergence in inflation based on the official CPI series. The trend in responses is found to be similar across all categories of respondents. 4.1.4 Based on this Committee’s earlier report on Survey Methodology and Data Quality of the Survey (July 2007), several measures have been taken by the Reserve Bank for training of investigators and follow up with respondents. There has been considerable improvement in consistency of survey results due to these measures. 4.1.5 The present survey schedule does not include any leading question guide to the respondents on responses in any specific direction. Investigators should be regularly sensitized to seek true perceptions from respondents so that they do not guide the respondents in filling in the schedule. Investigators can provide clarifications in simple terms (not through technical explanation) if the meanings of some economic terms are required to be explained. 4.1.6 It is necessary that the Reserve Bank continues with the recent practice of training of investigators before launching each round of the survey. Training should ensure that investigators are adequately sensitised, they understand the survey questions correctly and are told ways to ask certain questions in simple language. A manual on training should be prepared for the purpose. 4.1.7 The survey schedule can be easily filled in by respondents with tick marks. It serves the purpose well and is appropriate in the present context. 4.1.8 While the survey does not have a fixed sample frame, it needs to be recognised that price expectations move in similar direction for a majority of population and a sample of different set of individuals in each round would be able to capture the expectations closely. 4.1.9 Allotting less time to an investigator for canvassing schedule would put pressure on them and result in a hasty job. At the same time, care should be taken that investigators do not spend too much time with a respondent and possibly influence his answers. Also, the survey is timebound and the fieldwork is required to be completed within a short time span of a fortnight. It is proposed that one investigator may cover around 20 respondents of a city in a day. 4.1.10 The Reserve Bank should continuously monitor the genuineness of respondents and investigator visits from the details provided by respondents in the questionnaire. This would be akin to a follow-up survey. 4.1.11 In the context of monetary transparency, it is important that all the indicators related to inflation and inflation expectations that are considered by the Reserve Bank are available to the market. As the data of the last few rounds of Survey has high consistency, the results may be placed in public domain. A one-time article may be published giving earlier survey results. 4.1.12 The Reserve Bank may also provide unitlevel data to researchers and users with the information that the survey results are internally more consistent from Round 12 onwards. There is a scope for additional useful analysis like testing the manner of expectations formation once fairly long time series of survey results are available. 4.1.13 In India, exclusive inflation expectation survey of households is conducted only by the Reserve Bank. When releasing the survey results, the details of the concepts and methodology may also be given by the Bank, it will be interesting to see other agencies in India take up similar surveys. It would be good if more public and research agencies conduct such surveys and their results are shared, similar to the business expectation surveys conducted by several agencies. Other agencies surveys could cover general population and also the areas not covered by the RBI survey like the non-capital cities, the rural India, and other population groups. This would aid further economic analysis. 4.1.14 There is always an issue in release of inflation expectation data by the central bank as it could be seen as self-fulfilling prophecy. It is important to distinguish between the inflation projection given by the Reserve Bank for policy purposes and the inflation expectation of households. The Reserve Bank should emphatically clarify that the IESH survey results are those of the respondents and are not necessarily shared by the Reserve Bank. It also needs to be explained that the inflation rate is as assessed by the respondents based on household consumption basket which need not be related with inflation rate as measured by any official price index series. 4.2 Given the objective and focus of the survey and the criticality of timeliness of its results, the ISI study team was appreciative of the short survey questionnaire which could be processed quickly for getting desired analysis. The persistent effort to improve the quality of survey data is yielding results. Annex-I Constitution of TACS The present constitution of the Technical Advisory Committee on Surveys is as under:
Annex-II Review of International Practice- Select countries
Annex-III Findings of analysis of the latest rounds of data by the ISI team Background: After the first meeting of the TACS, the ISI studied the March to December 2006 data and identified some problem areas. As suggested by ISI changes were brought out in the questionnaire, briefing of investigators was done and some logistic adjustment was done. The survey was constantly monitored and subsequent analysis by ISI of the March to December 2007 data showed that there were improvements but some anomalies persisted. The March 2008 survey had already been launched in the meanwhile. The subsequent rounds of the survey were conducted with joint efforts of DSIM Regional Offices and Central Office. Training to investigators and trainers was provided by the ISI team at two centres. Later the training of investigators was made uniform across all Regional Office, quality checks were put in place and 10 per cent of the data was subject to scrutiny, 5 per cent by field visit and another 5 per cent by telephonic checks. The agency was asked to conduct repeat interviews if some schedules were identified as inconsistent. The data for the rounds 12 to 14 were sent to ISI to carry out the further analysis of quality and compare the findings with those of the earlier rounds and to determine is the data are ready for placement in the public domain. The findings of the analysis are detailed below: A. Consistency of response to qualitative question In the quantitative block, the respondents are asked about their expectations on the price movements in the next 3 months and in next one year. These expectations are sought for General prices and also for its breakup into Food products, Non-food products, Household durables, Housing and Services. To check the consistency of data reported through this block, an indicator is worked out as under:
The three month ahead consistency indices for the surveys carried out in 2006 and in 2008 are given in the table below
The extreme values are the consistency index values of -5 or 5. It is seen that the percentage of inconsistence response was steadily high in 2006 but has significantly improved in 2008. This establishes that the quality of responses has markedly improved. B. Consistency of response to quantitative question The consistency of responses to the quantitative question is looked at from various angles. While checking the standard deviation of 3 month and a year ahead, it was noticed in the surveys of 2006 that the standard deviation had reduced across the four survey rounds. The following subsections describe the of quantitative responses for the 2008 data. 1. Standard deviation over time The declines in standard deviations as noticed in the 2006 rounds have been arrested as can be seen from the table below. The low standard deviation for June 2008 Round was low due to a different reason. June 2008 was a period of global price shock and inflation was rising sharply and was nearing double digits in India. The households’ inflation expectations too may have increased as they were facing periods of high inflation. However the highest bracket to capture the inflation was ‘more than 8%’. The responses really intended to be 9 or above may have got coded here. More than 44% responses for 3 month and more than 55% responses for a year ahead got reported in this bracket. This reduced the standard deviation in the month of June 2008.
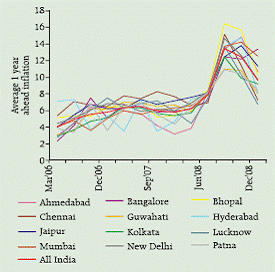
The schedule was modified after the June 2008 Round and the highest bracket was made ‘more than 16%’. In September 2008 two sets of brackets were used one with 8 classes of 200 basis points width (schedule was modified in consultation with the members of TACS) and the other with 17 classes with width of 100 basis points. These rounds are referred to as Sep-08 and Sep-08A round (conducted in October 2008). The questionnaire of Sep-08A Round has been used in the subsequent rounds as well. The table shows that the standard deviation is high in the period after June 2008. This depicts the volatility present in the households’ expectations as the actual economy was also seeing sharp changes in price movements. Thus on this count as well the quality check results are comforting on the data quality. 2. Behaviour across cities The city-to-city mean value of one-year ahead inflation expectation as shown in the following graph, looks haphazard. While in one round one city records least variation, in the other round it is a different city. Similar behaviour is seen in the CPI centre-wise data, where no city consistently records low or high variation. This finding thus shows a desirable attribute of the survey data.
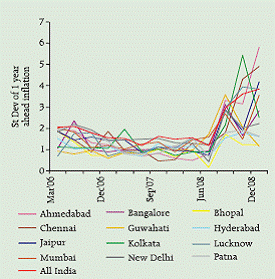
The standard deviations across cities also shows similar behaviour as the following graph shows. ISI has raised concern on too little variation in some cities. The low variation recorded in Patna and New Delhi during June 2008 represents the high sentiment that prevailed during that period which got clubbed in the last bracket, causing low standard deviation.
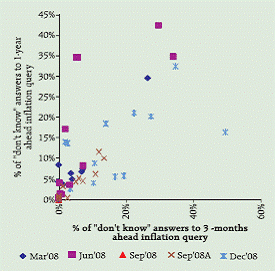
The variation in the latest rounds for the cities shows that in this aspect also the survey numbers are plausible. 3. ‘Don’t know’ responses The ‘Don’t know’ responses in the current rounds are not uniform. The ISI analysis points out that more ‘Don’t know’ answers are beginning to show. Few cities produce no ‘Don’t know’ answers. Too few Sep-08 ‘Don’t know’ answers may have been prompted by high inflation prevailing then. C. Inter-consistency between response to qualitative and quantitative questions To check the inter-consistency between the qualitative and the quantitative blocks, the variables X and Y are defined as under: Define X equal to
Define Y equal to
Now a consistency index of a group of survey response is defined as (Number of times X is equal to Y) * 100 / (Number of times X or Y is not equal to E) The consistency index should be 100 if X and Y are perfectly consistent; should have a lesser value (that can be calculated for a given cross-tabulation) if X and Y are completely independent. 1. Consistency Index The consistency indices worked out for various rounds of surveys according to city and category are presented below
a) City-wise consistency The consistency index that was just 57 per cent in March 2008, improved substantially in the recent survey rounds. This was so due to the uniform training being imparted across different centres and the field checks. The cities of Bhopal, Guwahati, Kolkata and Lucknow had very weak consistency in earlier rounds but improved considerably in the latest two rounds. b) Category-wise consistency The category wise response shown below also depicts sharp improvement in the interconsistency between qualitative and quantitative responses. 2. Weak consistency The X and Y variable as defined in this section are arranged in a X x Y size matrix. The diagonal responses in this matrix represent consistent responses. However, not all offdiagonals are incorrect responses. E.g. if a respondent says that 3 month ahead, prices are going to increase more than present rate (i.e. X=A), then in the qualitative block, the respondent should also give the 3 month ahead rate a number greater than the current rate (i.e. Y=A). Now X=A and Y=A, that is a diagonal element, is consistence response. However, if the respondent responds for the current and 3 month ahead rate in the same bracket (Y=B), he could still be correct. X=A and Y=B is an off-diagonal element, which is correct.
Based on the above example, the concept of weak consistency is defined as nder:
(Number of times X is equal to Y + Number
of near misses) * 100 / a) City-wise consistency The city-wise strong and weak consistency indices are presented in the table below. The weak consistency indices show further improvement in the data quality. The consistency indices that were very close to the expected values also show sharp improvement.
b) Category-wise consistency The category-wise weak consistency indices behave similar to the city-wise weak consistency indices. The categories that did not offer strong consistent responses did so with the relaxed criteria. The overall response for the last 2-3 rounds is very good on this count.
D. Logistic Issues The other logistic issue that were examined by ISI were the issues of number of investigators engaged and the time taken to complete the survey. 1. Number of investigators engaged The number of investigators used in the 2008 rounds shows that there is more uniformity required across cities. However on examining the cities where the number of investigators was too high, it was seen that due to typographical error in coding the investigator name, the number has so increased. It is being impressed upon the agency that they should not send too few or too many investigators for conducting as it dilutes the check that can be exercised on them. To keep a check on this aspect of quality, the present attention need to be continued in future rounds as well.
2. Duration of the survey The frequency distribution of the duration of survey is given in the table below. It shows that by and large the time taken to complete the survey is a week to ten days. The centres where the days taken appear to be too large are the centres where a particular investigator’s lot was rejected as none of his respondents could be reached. In such cases the interviews are asked to be redone. Thus by and large on this account as well the survey data seems to be consistent.
3. Households interviewed per day per investigator The frequency distribution of the households interviewed per day is presented in the following table. The instances of very high interviews conducted by an investigator per day should affect the quality of data collected. A check on this aspect needs to be kept and the matter can be handled at the time of investigator training and field check. It can still be seen that the average number of interviews conducted per day across the twelve cities is close to 20, which is an acceptable number.
Annex-IV ANOVA results for Round 12 Tests of Between-Subjects Effects
Tests of Between-Subjects Effects
Tests of Between-Subjects Effects
ANOVA results for Round 13 Tests of Between-Subjects Effects
Tests of Between-Subjects Effects
Tests of Between-Subjects Effects
ANOVA results for Round 13a Tests of Between-Subjects Effects
Tests of Between-Subjects Effects
Tests of Between-Subjects Effects
ANOVA results for Round 14 Tests of Between-Subjects Effects
Tests of Between-Subjects Effects
Tests of Between-Subjects Effects
ANOVA results for Round 15 Tests of Between-Subjects Effects
Tests of Between-Subjects Effects
Tests of Between-Subjects Effects
* Prepared in the Survey Division of Department of Statistics and Information Management. 1 Bruine de Bruin, W., Manski, C. F., Topa, G. and Van der Klaauw, W. (2009), Measuring Consumer Uncertainty about Future Inflation, Federal Reserve Bank of New York Staff Report , No. 415, December 2009. 2 http://www.bankofengland.co.uk/publications/events/ccbs_cew2009/presentation_kokoszczynski.pdf 3 Benford, James and Driver, Ronnie (2008), Public attitudes to inflation and interest rates, Bank of England Quarterly Bulletin, 2008:Q2, pp 148-156. |
|||||||||||||||||||||||||||||||||||||||||||||||||||||||||||||||||||||||||||||||||||||||||||||||||||||||||||||||||||||||||||||||||||||||||||||||||||||||||||||||||||||||||||||||||||||||||||||||||||||||||||||||||||||||||||||||||||||||||||||||||||||||||||||||||||||||||||||||||||||||||||||||||||||||||||||||||||||||||||||||||||||||||||||||||||||||||||||||||||||||||||||||||||||||||||||||||||||||||||||||||||||||||||||||||||||||||||||||||||||||||||||||||||||||||||||||||||||||||||||||||||||||||||||||||||||||||||||||||||||||||||||||||||||||||||||||||||||||||||||||||||||||||||||||||||||||||||||||||||||||||||||||||||||||||||||||||||||||||||||||||||||||||||||||||||||||||||||||||||||||||||||||||||||||||||||||||||||||||||||||||||||||||||||||||||||||||||||||||||||||||||||||||||||||||||||||||||||||||||||||||||||||||||||||||||||||||||||||||||||||||||||||||||||||||||||||||||||||||||||||||||||||||||||||||||||||||||||||||||||||||||||||||||||||||||||||||||||||||||||||||||||||||||||||||||||||||||||||||||||||
Page Last Updated on:


