Investment Portfolio of Scheduled Commercial Banks, 2008 (As on March 31)* This article presents the investment portfolio of Scheduled Commercial Banks (excluding Regional Rural Banks) in India and abroad, as at end-March 2008, as per the reporting system of annual Basic Statistical Return (BSR)-5.The investment portfolio covers investments in Central and State Government securities, securities other than Central and State Government securities - approved for the purpose of investments under the Indian Trusts Act, 1882, other domestic securities and investments, foreign securities and other foreign investments.Analysis of investments according to bank groups, namely, State Bank of India and its Associates, Nationalised Banks, Other Indian Scheduled Commercial Banks and Foreign Banks has been presented in terms of instruments, maturity, interest rate (coupon) and states.The article also highlights a comparative position of banks’ portfolio in 2008 with that of the previous year.
- During 2007-08, the total investments of the Scheduled Commercial Banks (SCBs) increased by 23.7 per cent as compared with 9.9 per cent in 2006-07.
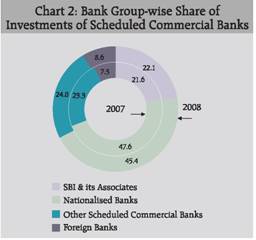
- The Nationalised Banks continued to account for the largest share of the investments of SCBs, although their share declined during 2007-08 by 2.2 percentage points to 45.4 per cent.
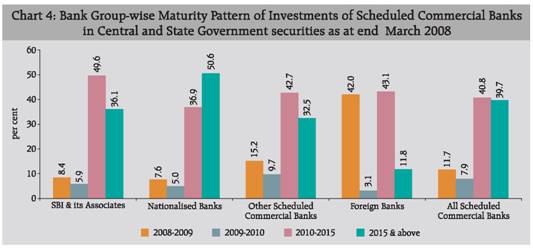
- The maturity profile of holdings of Government securities (Central and State Government securities taken together) as at end-March 2008 showed that over two-fifths (40.8 per cent) of such securities held by SCBs were in the maturity bracket 2010-15, followed closely by the maturity bracket 2015 and above (39.7 per cent) and securities maturing within one year (11.7 per cent).
- Across different bank groups, Foreign Banks reported a large part (45.1 per cent) of their holding with residual maturity of less than 2 years, as against 19.6 per cent for all SCBs.
- During 2007-08, Central Government securities with interest rate of ‘6 per cent to 10 per cent’ witnessed further increase in their share from 61.5 per cent to 69.6 per cent.
Introduction The analysis of investment portfolio of Scheduled Commercial Banks (SCBs), excluding Regional Rural Banks (RRBs), covers 79 banks, viz., 8 from the State Bank Group (SBI and its Associates), 20 from the Nationalised Banks group (including IDBI Ltd.), 23 Other Indian Scheduled Commercial Banks (OSCBs) or Indian Private Sector Banks and 28 Foreign Banks operating in India. These banks accounted for 98.5 per cent of the investments in approved securities for Statutory Liquidity Ratio (SLR) purposes of all SCBs1 (including Regional Rural Banks) on the last reporting Friday of March 2008. The analysis is based on data furnished by SCBs in the Basic Statistical Return (BSR)-5. The investments of SCBs, covered in the survey are grouped into: i) Central and State Government securities, ii) securities other than Central and State Government securities-approved for the purpose of investments under the Indian Trusts Act,1882, iii) shares, bonds and debentures of Indian joint stock companies, iv) fixed deposits with banks, v) domestic securities which are not eligible as trustee securities, such as initial contribution to the Unit Trust of India (UTI), share capital in RRBs, and vi) foreign securities and other foreign investments. The study covers domestic investments as well as foreign investments in respect of domestic banks whereas for foreign banks operating in India, only their investments made in India through their domestic branches are covered. Results The results of the survey are presented in six sections. Section I relates to aggregate investments of SCBs according to types of securities and the Section II discusses bank group-wise investments according to type of securities and also includes information on the investments of SCBs in loans floated by the State Governments, contributions in the share capital of RRBs, subscription to debentures of co-operative institutions, subscription to bonds of the State Government guaranteed bodies, viz., Municipalities, State Electricity Boards, State Financial Institutions, Road Transport Corporations, etc. Section III discusses maturity profile and interest rate classification of investments in Central and State Government securities. Classification of investments of SCBs into ‘held to maturity’ (HTM), ‘available for sale’ (AFS) and ‘held for trading’ (HFT) categories is covered in section IV. Section V discusses investments of SCBs in state level securities. A summary of the results is presented in the concluding section VI. The investment data presented in this article, in general, is referred to by their face value and in the case of investments in shares, bonds and debentures of Indian joint stock companies, market value is also indicated along with the face value. The data obtained through the current survey, together with those based on the previous survey (March 31, 2007) are presented in Statements (1 to 10) and charts (1 to 12). I. Aggregate Investments The aggregate investment of SCBs, excluding RRBs, registered 23.7 per cent increase during 2007-08 and stood at Rs. 11,61,822 crore as on March 31, 2008 as against a rise by 9.9 per cent during the preceding year (Statement 1). Investments of banks’ offices located in India continued to dominate the total investments portfolio and accounted for 98.8 per cent share as on March 31, 2008, about one percentage point higher than 97.9 per cent share as at end-March 2007. The balance 1.2 per cent of total investments was held by foreign offices of Indian banks in the form of securities of foreign countries, and shares and debentures of joint stock companies registered abroad and other foreign investments. The composition of investments according to broad categories of securities revealed banks’ preferences for investments in Government securities (Statement 1 and Chart 1). As on March 31, 2008 Government securities comprising Central Government securities, and State Governments securities accounted for 79.6 per cent of total investments of banks (78.3 per cent share as on March 31, 2007). The share of ‘other domestic securities’ continued its downward movement and declined by 0.5 percentage to 19.1 per cent as on March 31, 2008; from 19.6 per cent as on March 31, 2007 and 20.6 per cent as on March 31, 2006. Investments in foreign securities by domestic offices of SCBs at Rs. 765 crore as on March 31, 2008 accounted for a share of 0.1 per cent of total investments, which was at the same level as a year ago.

Analysis of changes in constituents of investment in Government securities (i.e., Central Government and State Government securities) during 2007-08 indicated that SCBs’ holdings of Central Government securities increased by Rs.1,54,108 crore (24.9 per cent) to Rs. 7,72,565 crore, while their investment in State Government securities increased at a higher pace by 30.2 per cent (Rs.35,186 crore) to Rs. 1,51,811 crore as on March 31, 2008. The Central Government and State Government securities had recorded an increase of 12.9 per cent and 2.6 per cent increase, respectively during the previous year. The investments of SCBs in ‘other domestic securities’ mainly comprise shares and debentures of joint stock companies, other trustee securities (excluding units of UTI), fixed deposits (FDs), units of UTI, certificates of deposit (CDs), commercial papers (CPs), mutual funds, initial contribution to share capital of UTI, bonds and debentures of quasi-government bodies, venture capital funds, etc. SCBs’ investments in such domestic securities increased by 20.8 per cent in 2007-08 as compared to 4.5 per cent increase recorded in the preceding year, and stood at Rs. 2,22,367 crore as at end March 2008. II. Bank Group-wise Investment of Scheduled Commercial Banks according to type of securities
II.1 Bank-group wise shares in total Investment of SCBs The investments of SCBs classified by bank groups and type of securities are presented in Statement 2. Among the various bank groups, Nationalised Banks continued to account for the largest share of the investments of SCBs although their share witnessed a decline during the year. As on March 31, 2008, these banks accounted for 45.4 per cent share in total investments of SCBs, as against 47.6 per cent share a year ago.The share of SBI and its Associates, increased during 2007-08 and stood at 22.1 per cent; 0.5 percentage points higher than that at end-March 2007. The OSCBs and Foreign Banks also registered increase in their shares from 23.3 per cent to 24.0 per cent and from 7.5 per cent to 8.6 per cent, respectively during the year (Chart 2). The Foreign Banks registered 41.6 per cent growth in their investment portfolio during 2007-08, whereas in the case of Nationalised Banks the increase was moderate at 17.8 per cent. SBI and its Associates and OSCBs recorded higher than all SCB growth in their investment portfolio. II.2 Composition of Investments
II.2.1 Central Government securities:
In the case of SBI and its Associates, holdings of Central Government securities increased by 20.5 per cent during 2007-08 in contrast with 9.5 per cent decline recorded during 2006-07.In the case of Foreign Banks, the holdings of Central Government securities increased by 51.2 per cent during 2007-08 and stood at Rs.83,562 crore as at end March 2008.Other bank groups recorded lower than all SCBs growth in their holdings of Central Government securities during 2007-08.
II.2.2 State Government securities:
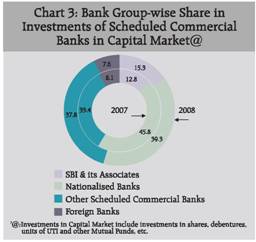
Investment in State Government securities increased by 43.6 per cent in the case of SBI & its Associates, by 36.3 per cent in the case of OSCBs, and by 23.1 per cent for the Nationalised Banks group. On the other hand Foreign Banks unwound their investment in such securities during the year, and held meager amount of Rs.2 crore as on March 31, 2008 (Rs. 91 crore as on March 31, 2007). II.2.3 Foreign securities: Investment in foreign securities, across the bank groups, continues to be negligible. Similarly, investment by foreign offices of the Indian banks in foreign securities continues to be very low (0.6 per cent to 2.3 per cent of total investment portfolio). II.2.4 Investment in Other Trustee securities: Investment of SCBs in other trustee securities comprised investment in securities/shares/bonds/debentures issued by major all-India bodies, State Financial Corporations (SFCs), State Electricity Boards (SEBs), Industrial Finance Corporation of India Ltd. (IFCI), National Bank for Agriculture and Rural Development (NABARD), Small Industries Development Bank of India (SIDBI), etc. Such investments of SCBs, amounted to Rs. 11,590 crore as on March 31, 2008, which was 22.7 per cent lower than that of Rs. 14,996 crore as on March 31, 2007 (Statement 3). Investments in securities issued by SEBs constituted about one-fifth (20.1 per cent) of investment under this category while those issued by IFCI accounted for 13.3 per cent share, as at end-March 2008. Investment in SFCs at Rs. 837 crore constituted 7.2 per cent of such investments. II.2.5 Investment in the Instruments of Capital Market: Instruments of capital market, comprise mainly shares and debentures of joint stock companies, units of UTI and other mutual funds, initial contribution to share capital of UTI, CDs, CPs, FDs with banks and shares of DICGC. Investment by SCBs in these instruments stood at Rs. 2,10,810 crore (market value) as on March 31, 2008, recording an increase of 24.7 per cent during 2007-08 (Statement 4). The investment by banks in debentures issued by joint stock companies constituted the major component (65.6 per cent in terms of market value) of total investment in shares and debentures as on March 31, 2008 as against 74.7 per cent as on March 31, 2007. Investment by banks in shares of joint stock companies increased by 48.4 per cent to Rs.31,491 crore during 2007-08, while the investment in debentures of joint stock companies declined by 4.1 per cent during this period and stood at Rs. 60,006 crore. Further, it was observed that all bank groups, except SBI and its Associates continued to show a marked preference for debentures over shares, though proportion of investment in shares has increased over the year across all bank groups. In the case of SBI and its Associates, shares accounted for 63.6 per cent of investment in shares and debentures, while they accounted for a meager 4.7 per cent in the case of Foreign Banks. The SCBs’ investments in ‘other capital market instruments’ increased by 39.9 per cent during 2007-08 to Rs.1,19,312 crore as on March 31, 2008; these had recorded 21.7 per cent growth in 2006-07. Bank group-wise investment in instruments of capital market as on March 31, 2008 indicated that the Nationalised Banks accounted for the largest share of 39.3 per cent, followed closely by OSCBs (37.8 per cent). The SBI and its Associates (15.3 per cent) and Foreign Banks (7.6 per cent) had relatively lower shares in total investments in instruments of capital market (Chart 3). While the relative shares of the SBI and its Associates and OSCBs increased, those of the other two bank groups witnessed a decline during 2007-08.
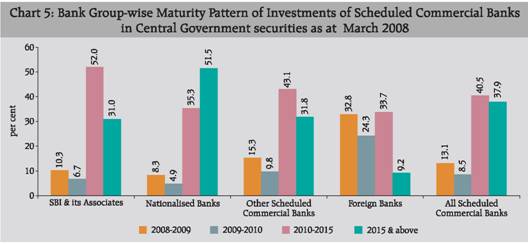
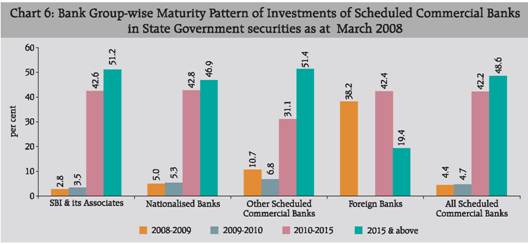
II.2.6 Investment in Public Sector Enterprises: Investment of SCBs in bonds of Public Sector Enterprises witnessed a decline of 4.9 per cent to Rs. 9,332 crore as on March 31, 2008 (Statement 5) on top of 9.3 per cent decline during 2006-07. As regards bank groups, the OSCBs registered 43.6 per cent increase in such investments, while other bank groups witnessed a decline (18.1 per cent decline in the case of SBI and its Associates and 14.1 per cent decline in case of Nationalised Banks). As regards composition of these investments as at end-March 2008, 38.4 per cent of such investments were in the bonds of Power Finance Corporation followed by those of Rural Electrification Corporation (23.9 per cent). III Maturity Profile and Interest Rate Classification of Investments in Central and State Government securities III.1 Maturity Profile of Outstanding Investment in Government Securities The maturity classification of investment in Central and State Government securities for different bank groups is presented in Statement 6. The maturity profile of holdings of Government securities (Central and State securities taken together) by SCBs as at the end-March 2008 is depicted in Chart 4. As reflected in Chart 4, over two-fifths (40.8 per cent) of such securities held by SCBs were in the maturity bracket 2010-2015, followed closely by the maturity bracket 2015 and above (39.7 per cent) while 11.7 per cent of the securities had maturity in 2008-09. The maturity profile of holdings of Government securities was, however, not uniform across different bank groups. The share in the maturity bracket of 2010-2015 for SBI and its Associates was the highest (49.6 per cent), followed by Foreign Banks (43.1 per cent), and OSCBs (42.7 per cent), while for Nationalised Banks it was at 36.9 per cent. By 2010 19.6 per cent of Government securities held by SCBs would be maturing by 2010 (i.e., residual maturity of less than 2 years). The proportion of Government securities in this maturity bracket was 14.3 per cent for SBI and its Associates, 12.6 per cent for Nationalised Banks, 24.9 per cent for OSCBs and 45.1 per cent for Foreign Banks. The maturity profile of Central Government securities held by SCBs as at end-March 2008 followed the pattern observed for their holding of Government securities (Central and State securities taken together) (Chart 5). At all SCBs level, Central Government securities maturing in 2010-2015 constituted the largest share (40.5 per cent), followed by the securities maturing beyond 2015 (37.9 per cent). In the case of SBI and its Associates, 17.0 per cent of holding of Central Government securities was with maturity upto 2010, as against 13.2 per cent in the case of Nationalised Banks. In the case of Foreign Banks, a large proportion of their holdings (57.1 per cent) fell in this bracket. The proportion of Central Government securities with maturity in 2015 and beyond was 31.0 per cent for SBI and its Associates, 51.5 per cent for Nationalised Banks, 31.8 per cent for OSCBs and 9.2 per cent for Foreign Banks. In the case of SBI and its Associates, 52.0 per cent of the Central Government security portfolio had maturity in 2010-2015; while, in case of Nationalised Banks, 51.5 per cent of Central Government securities were maturing in the year 2015 and later. As regards the State Government securities, at all SCBs level, 48.6 per cent had maturity beyond 2015 and 42.2 per cent were to mature in 2010-2015. The former maturity bracket accounted for about 51 per cent of State Government securities in the cases of SBI and its Associates and OSCBs, and 46.9 per cent for Nationalised Banks. The share was, however, low (19.4 per cent) for Foreign Banks. Over 42 per cent of State Government securities of SBI and its Associates, Nationalised Banks and Foreign Banks were in the maturity bracket 2010-2015; while the corresponding share for OSCBs was 31.1 per cent.
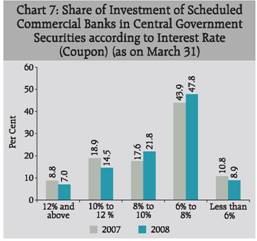
III.2 Investments in Central and State Government Securities (excluding Treasury Bills, Postal Obligations, etc.)-According to Interest Rates The distribution of banks’ investments in Central and State Government securities according to different interest (coupon) rate classes as on March 31, 2008 is set out in Statement 7. During 2007-08, Central Government securities with interest rate of ‘6 per cent to 10 per cent’ witnessed further concentration in their share from 61.5 per cent as on March 31, 2007 to 69.6 per cent; the share of such securities in March 2006 was 48.9 per cent. As against this, the proportion of banks’ holdings of Central Government securities with interest rate ’10 per cent and above’ declined from 27.7 per cent to 21.5 per cent. Share of Central Government securities with interest rate ‘less than 6 per cent’ also declined during the period from 10.8 per cent to 8.9 per cent as on March 31, 2008 (Chart 7).
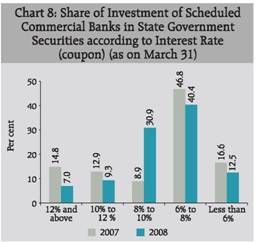
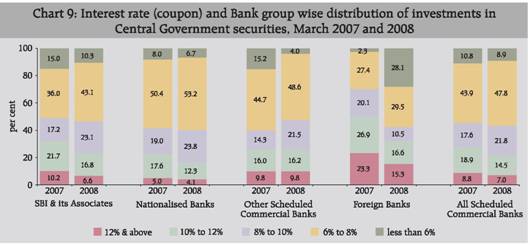
As regards State Government securities, the distribution of securities in various interest rate groups depicted changes similar to those for Central Government securities in their composition. The proportion of securities with interest rate of ‘6 per cent to 10 per cent’ increased from 55.7 per cent as on March 31, 2007 to 71.3 per cent as on March 31, 2008 (Chart 8). The proportion of State Government securities with interest rate ‘10 per cent and above’ decreased from 27.7 per cent as on March 31, 2007 to 16.3 per cent on March 31, 2008. SBI and its Associates’ holdings of Central Government securities with interest rate of ‘6 to 10 per cent’ increased from 53.2 per cent in 2007 to 65.2 per cent as on March 31, 2008 while those with interest rate ‘less than 6 per cent’ declined from 15.0 per cent as on March 31, 2007 to 10.3 per cent as on March 31, 2008. The share of Central Government securities with interest rate ’10 per cent to 12 per cent’ also declined from 21.7 per cent as on March 31, 2007 to 16.8 per cent as on March 31,2008 (Chart 9). In case of Nationalised Banks, the share of Central Government securities with interest rate of ‘12 per cent and above’ declined from 5.0 per cent to 4.1 per cent during 2007-08. The share of Central Government securities with interest rate below 10 per cent increased from 77.4 per cent as on March 31, 2007 to 83.7 per cent as on March 2008 (Chart 9). In case of OSCBs, the share of Central Government securities with interest rate of ‘6 per cent to 10 per cent’ increased from 59.0 per cent as on March 2007 to 71.1 per cent as on March 2008, while that of securities with coupon rate less than 6 per cent declined from 15.2 per cent to 4.0 per cent. Share of securities with interest rate of ’10 per cent and above’ held by Foreign Banks declined from 50.2 per cent as on March 2007 to 31.9 per cent as on March 2008, while that of securities with interest rate below 6 per cent increased from 29.7 per cent to 57.6 per cent.
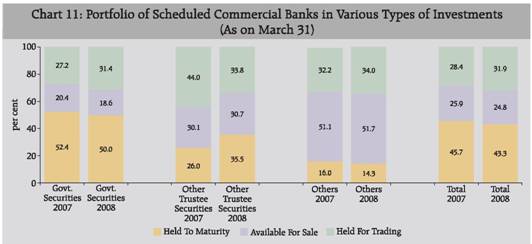
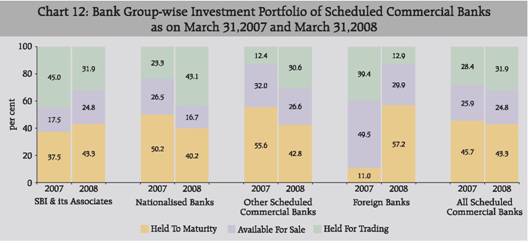
In case of State Government securities held by different bank groups, major portion of the holding was in the interest rate range of ‘6 per cent to 8 per cent’ for SBI and its Associates (46.0 per cent), Nationalised Banks (37.4 per cent) and OSCBs (34.5 per cent), respectively. The Foreign Banks, which had low share of investment in the State Government securities, had 80.6 per cent of such investments in ’10 per cent to 12 per cent’ interest rate range (Chart 10). IV. Classification of Investment Portfolio of Banks into HTM, AFS and HFT Categories The investment portfolio of SCBs classified under the categories ‘held to maturity’ (HTM), ‘available for sale’ (AFS) and ‘held for trading’ (HFT) for different types of investments as on March 31, 2007 and 2008 is depicted in Chart 11. At the aggregate level,the share of investments under the three categories did not depict significant change in March 2008 as compared with that in March 2007, although shares of securities under HTM and AFS categories declined marginally during 2007-08. The share of securities under HFT category increased from 28.4 per cent to 31.9 per cent. In the case of Government securities, the share of investments classified under HTM category decreased to 50.0 per cent as on March 31, 2008 from 52.4 per cent a year ago. As regards investments in subsidiaries and joint ventures of banks, more than one-half (71.9 per cent) of the investments were under HTM category, while in the case of investments in shares, 3.6 per cent of investments were in the HTM category and 58.0 per cent in AFS category. In terms of bank groups, the SCBs’ investments in different types of securities, as on March 31, 2007 and March 31, 2008, as classified into three categories, are depicted in Chart 12. As on March 2008, Foreign Banks held major portion of their investment portfolio (57.2 per cent) under HTM category while for other bank groups, share of HTM category investment was in the range of 40.2-43.3 per cent. As regards investments classified under AFS category, Nationalised Banks held 16.7 per cent of their investment portfolio under this category, while the respective shares were higher (24.8 per cent to 26.6 per cent) in the case of other bank groups. During 2007-08, relative share of securities classified as HTM increased for SBI and its Associates and Foreign Banks, while it declined for other bank groups. Nationalised Banks and OSCBs witnessed increase in the share of portfolio under HFT category. Foreign Banks held 29.9 per cent of their investment in AFS category, while the Nationalised Banks, OSCBs and SBI and its Associates held 16.7 per cent, 26.6 per cent and 24.8 per cent in AFS category, respectively.
V. Investment of Scheduled Commercial Banks in State-level Securities The State-wise investment of SCBs in various State-level securities as on March 31, 2007 and 2008 is presented in Statement 8. State-level securities consisted of securities floated by the State Governments, bonds of State-level bodies guaranteed by the State Governments, share capital of RRBs and debentures of cooperative institutions. SCBs’ investments in such securities increased by 27.4 per cent to Rs.1,58,188 crore as at end-March 2008. The SCBs investment in State Development Loans (SDL) increased by 30.2 per cent during 2007-08 while that in other State level securities declined by 15.1 per cent. However, investment in RRBs and in securities issued by Municipal Corporations, Municipalities, Port Trusts and SIDCs registered an increase during 2007-08. Majority of State level investments were in State Government securities (State Development Loans-SDL), accounting for 96.0 per cent of the total amount of State-level securities as on March 31, 2008 (93.9 per cent as on March 31, 2007). Other important State-level securities in which banks invested were State Electricity Boards (1.8 per cent), and State Financial Corporations (SFCs) (0.6 per cent). Banks’ investment in six States, viz., Uttar Pradesh, West Bengal, Maharashtra, Andhra Pradesh, Gujarat and Tamil Nadu accounted for 53.0 per cent of their investment in various State-level securities in 2008 (56.6 per cent as on March 31, 2007). SCBs’ investment in interest-bearing State Government securities (SDLs) as on March 31, 2007 and 2008 are presented in Statement 9. Of the total outstanding State Government securities of Rs. 2,98,845 crore, SCBs holdings amounted to Rs. 1,51,811 crore indicating the proportion (absorption rate) of investment of SCBs, at the aggregate level at 50.8 per cent of the total outstanding amount of interest-bearing state securities as at end-March 2008 (48.0 per cent as at end-March 2007). Bank group-wise pattern of investment in the State Government securities, shares, bonds, debentures, etc., issued by state level bodies, for the years 2007 and 2008 is presented in Statement 10. Of the total investments of Rs.1,58,188 crore in State-level securities as on March 31, 2008, the Nationalised Banks accounted for the highest share at 60.2 per cent, followed by the SBI and its Associates at 35.3 per cent. Specifically, with respect to investment in State-level securities in North-Eastern States, the SBI and its Associates accounted for the highest share among all bank groups. These banks contributed, more than one-half in the respective State-level securities in Mizoram (56.0 per cent), Nagaland (55.9 per cent) and Manipur (54.1 per cent). In Sikkim and Uttaranchal also, SBI and its Associates contributed a high share (54.3 per cent and 52.0 per cent, respectively) of State-level investments by SCBs. VI. Concluding Observations During 2007-08, total investments of SCBs increased by Rs.2,22,484 crore or 23.7 per cent to Rs.11,61,822 crore as on March 31, 2008 as compared with Rs.84,681 crore or 9.9 per cent increase recorded in 2006-07. Incrementally, the holdings of Central Government securities increased by Rs.1,54,108 crore, while the increase in holdings of State Government securities was Rs.35,186 crore. Of the total incremental investment of Rs.1,54,108 crore in Central Government securities in 2007-08, Nationalised Banks had the highest contribution of Rs.65,452 crore followed by that of OSCBs (Rs.32,722 crore). In case of incremental investments in State Government securities (Rs.35,186 crore), Nationalised Banks and SBI and its Associates accounted for Rs.17,138 crore and Rs.16,463 crore, respectively. Over two-fifths (40.8 per cent) of the Government securities (Central and State securities taken together) held by SCBs were in the maturity bracket 2010-2015, while 19.6 per cent of securities were maturing up to 2010 (i.e., residual maturity of less than 2 years). As regards holding of State Governments securities, 48.6 per cent of the holdings of the SCBs were in the maturity bracket 2015 and beyond. As on March 31, 2008, 69.6 per cent of Central Government securities held by SCBs were with interest (coupon) rates between ‘6 per cent and 10 per cent’ in March 2008 as against 61.5 per cent in March 2007. Share of investments of SCBs under the HTM category stood at 43.3 per cent as on March 31, 2008 as compared with 45.7 per cent as on March 31, 2007. The share of investments classified under HFT category improved from 28.4 per cent to 31.9 per cent during 2007-08, while those in AFS category declined from 25.9 per cent to 24.8 per cent. In the case of Government securities, the share of investments classified under HTM category in 2007-08 decreased from 52.4 per cent as on March 2007 to 50.0 per cent as on March 31,2008. SCBs’ investments in State-level securities (securities floated by the State Governments, bonds of State-level bodies guaranteed by the State Governments, share capital of RRBs and debentures of cooperative institutions, etc.) increased by Rs.34,046 crore (27.4 per cent) to Rs.1,58,187 crore as at end- March 2008. The increase in holding of State Development Loans (SDL) during 2007-08 was at Rs.35,185 crore, while investment in all other categories (except those in securities of RRBs and Municipal Corporation, Municipalities and Port Trusts) recorded a decline. State Government securities (State Development Loans - SDL), constituted the major part, accounting for 96.0 per cent of the total investments in State-level securities. State-wise investment of banks as on March 31, 2008, in the State Government securities (SDL) was the highest in Uttar Pradesh (Rs.17,641 crore), followed by West Bengal (Rs.16,109 crore) and Maharashtra (Rs.15,474 crore). The investment of SCBs in the bonds of SEBs was Rs.2,788 crore, as on March 31, 2008, as against Rs.3,258 crore as on March 31, 2007. SCBs’ investment in State Financial Corporations (SFCs) amounted to Rs.996 crore as on March 31, 2008, as against Rs.1,176 crore as on March 31, 2007. Banks’ investment in securities of SIDCs amounted to Rs.334 crore as on March 31, 2008, as against Rs.315 crore as on March 31, 2007. Banks’ investment in RRBs amounted to Rs.936 crore as on March 31, 2008 constituting 0.6 per cent of total investment in state level securities; such investments were Rs.730 crore in March 2007.
Statement 1 : Investments of Scheduled Commercial Banks (As at End-March) |
(Amount in Rs. lakh) |
Category |
2007 |
2008 |
Absolute Variation |
Percentage Variation |
2007 over 2006 |
2008 over 2007 |
2007 over 2006 |
2008 over 2007 |
1 |
2 |
3 |
4 |
5 |
6 |
7 |
I. |
Investment by offices in India |
9,19,99,308 |
11,47,50,776 |
79,61,705 |
22,751,468 |
9.5 |
24.7 |
| |
|
|
|
(97.9) |
(98.8) |
(94.0) |
(102.3) |
|
|
| |
A. |
Indian Government Securities |
7,35,08,174 |
9,24,37,558 |
73,56,343 |
1,89,29,384 |
11.1 |
25.8 |
| |
|
|
|
(78.3) |
(79.6) |
(86.9) |
(85.1) |
|
|
| |
|
(i) |
Central Government |
6,18,45,630 |
7,72,56,463 |
70,55,963 |
1,54,10,833 |
12.9 |
24.9 |
| |
|
|
|
(65.8) |
(66.5) |
(83.3) |
(69.3) |
|
|
| |
|
(ii) |
State Government |
1,16,62,544 |
1,51,81,095 |
3,00,380 |
35,18,551 |
2.6 |
30.2 |
| |
|
|
|
(12.4) |
(13.1) |
(3.5) |
(15.8) |
|
|
| |
|
(iii) |
Others * |
— |
— |
— |
— |
— |
— |
| |
B. |
Other Domestic Securities, |
1,84,04,545 |
2,22,36,676 |
7,88,865 |
38,32,131 |
4.5 |
20.8 |
| |
|
Bonds, Shares, etc. |
(19.6) |
(19.1) |
(9.3) |
(17.2) |
|
|
| |
|
(i) |
Other Trustee Securities |
14,96,682 |
11,55,722 |
-2,686 |
-3,40,960 |
-0.2 |
-22.8 |
| |
|
|
(excluding units of UTI) |
(1.6) |
(1.0) |
(-) |
(-1.5) |
|
|
| |
|
(ii) |
Fixed Deposits |
14,98,698 |
17,12,097 |
-79,215 |
2,13,399 |
-5.0 |
14.2 |
| |
|
|
|
(1.6) |
(1.5) |
(-0.9) |
(1.0) |
|
|
| |
|
(iii) |
Shares and Debentures of joint |
83,81,849 |
91,49,762 |
-7,27,406 |
7,67,913 |
-8.0 |
9.2 |
| |
|
|
Stock companies(Market Value) |
(8.9) |
(7.9) |
(-8.6) |
(3.5) |
|
|
| |
|
(iv) |
Initial Contribution to share |
518 |
300 |
171 |
-218 |
49.3 |
-42.1 |
| |
|
|
capital of UTI |
(—) |
(—) |
( — ) |
(—) |
|
|
| |
|
(v) |
Units of UTI |
2,917 |
3,264 |
— |
347 |
— |
11.9 |
| |
|
|
|
(—) |
(—) |
(-) |
(—) |
|
|
| |
|
(vi) |
Certificate of Deposits and |
18,96,855 |
34,31,256 |
10,51,145 |
15,34,401 |
124.3 |
80.9 |
| |
|
|
Commercial Papers. |
(2.0) |
(3.0) |
(12.4) |
(6.9) |
|
|
| |
|
(vii) |
Mutual Funds |
10,08,321 |
23,49,347 |
-1,37,141 |
13,41,026 |
-12.0 |
133.0 |
| |
|
|
|
(1.1) |
(2.0) |
(-1.6) |
(6.0) |
|
|
| |
|
(viii) |
Others @ |
41,18,705 |
44,34,928 |
6,83,997 |
3,16,223 |
19.9 |
7.7 |
| |
|
|
|
(4.4) |
(3.8) |
(8.1) |
(1.4) |
|
|
| |
C. |
Foreign Securities |
86,589 |
76,542 |
-1,83,503 |
-10,047 |
-67.9 |
-11.6 |
| |
|
|
|
(0.1) |
(0.1) |
(-2.2) |
(—) |
|
|
| |
|
(i) |
Foreign Government Securities |
1 |
1 |
— |
— |
— |
— |
| |
|
|
|
(—) |
(—) |
(-) |
|
|
|
| |
|
(ii) |
Other Foreign Investments |
86,588 |
76,541 |
-1,83,503 |
-10,047 |
-67.9 |
-11.6 |
| |
|
|
|
(0.1) |
(0.1) |
(-2.2) |
(—) |
|
|
II. |
Investments by Foreign Offices |
19,34,560 |
14,31,465 |
5,06,430 |
-5,03,095 |
35.5 |
-26.0 |
| |
of Indian Banks |
(2.1) |
(1.2) |
(6.0) |
(-2.3) |
|
|
| |
(i) |
Indian securities |
— |
— |
— |
— |
— |
— |
| |
(ii) |
Foreign Countries Securities |
3,89,576 |
2,42,267 |
1,31,228 |
-1,47309 |
50.8 |
-37.8 |
| |
|
|
(0.4) |
(0.2) |
(1.5) |
(-0.7) |
|
|
| |
(iii) |
Other Investments |
15,44,984 |
11,89,198 |
3,88,370 |
-3,55,786 |
33.6 |
-23.0 |
| |
|
|
(1.6) |
(1.0) |
(4.6) |
(-1.6) |
|
|
TOTAL |
9,39,33,868 |
11,61,82,241 |
84,68,135 |
2,22,48,373 |
9.9 |
23.7 |
| |
(100.0) |
(100.0) |
(100.0) |
(100.0) |
|
|
— : Nil or Negligible.
* : Includes Postal Savings Deposits Certificates and Other Postal Obligations.
@ : Includes Investments in Debentures and Bonds of Quasi - Govt.Bodies, Venture Capital Funds, etc.
Note : Figures in brackets indicate percentages to ‘Total’. |
Statement 2: Bank Group-Wise Investments by Types of Securities |
(Amount in Rs. lakh) |
Bank Group |
Year (end - March) |
Investments of Indian offices |
Indian Govt. Securities |
Other Trustee Securities |
Central Government Securities@ |
State Government Securities |
Total |
of which All India Bodies |
1 |
2 |
3 |
4 |
5 |
6 |
1. |
State Bank of India & Associates |
2007 |
1,34,50,178 |
37,77,204 |
4,61,567 |
2,60,841 |
| |
|
|
(66.4) |
(18.6) |
(2.3) |
(1.3) |
| |
|
2008 |
1,62,12,256 |
54,23,546 |
3,29,839 |
1,68,664 |
| |
|
|
(63.2) |
(21.2) |
(1.3) |
(0.7) |
| |
Variation in 2008 over 2007 |
|
|
|
|
|
| |
(a) Absolute |
|
27,62,078 |
16,46,342 |
-1,31,728 |
-92,177 |
| |
(b) Percentage |
|
(20.5) |
(43.6) |
(-28.5) |
(-35.3) |
2. |
Nationalised Banks |
2007 |
2,76,02,810 |
74,14,881 |
8,70,601 |
5,42,832 |
| |
|
|
(61.7) |
(16.6) |
(1.9) |
(1.2) |
| |
|
2008 |
3,41,47,978 |
91,28,632 |
7,82,091 |
4,78,667 |
| |
|
|
(64.8) |
(17.3) |
(1.5) |
(0.9) |
| |
Variation in 2008 over 2007 |
|
|
|
|
|
| |
(a) Absolute |
|
65,45,168 |
17,13,751 |
-88,510 |
-64,165 |
| |
(b) Percentage |
|
(23.7) |
(23.1) |
(-10.2) |
(-11.8) |
3. |
Other Scheduled |
2007 |
1,52,67,890 |
4,61,321 |
35,890 |
18,730 |
| |
Commercial Banks |
|
(69.7) |
(2.1) |
(0.2) |
(0.1) |
| |
|
2008 |
1,85,40,047 |
6,28,752 |
45,584 |
21,819 |
| |
|
|
(66.5) |
(2.3) |
(0.2) |
(0.1) |
| |
Variation in 2008 over 2007 |
|
|
|
|
|
| |
(a) Absolute |
|
32,72,157 |
1,67,431 |
9,694 |
3,089 |
| |
(b) Percentage |
|
(21.4) |
(36.3) |
(27.0) |
(16.5) |
4. |
Foreign Banks |
2007 |
55,24,752 |
9,138 |
1,31,541 |
1,31,367 |
| |
|
|
(78.6) |
(0.1) |
(1.9) |
(1.9) |
| |
|
2008 |
83,56,182 |
165 |
1,472 |
1,298 |
| |
|
|
(83.9) |
(-) |
(—) |
(-) |
| |
Variation in 2008 over 2007 |
|
|
|
|
|
| |
(a) Absolute |
|
28,31,430 |
-8,973 |
-1,30,069 |
-1,30,069 |
| |
(b) Percentage |
|
(51.2) |
(-98.2) |
(-98.9) |
(-99.0) |
5. |
All Scheduled Commercial Banks |
2007 |
6,18,45,630 |
1,16,62,544 |
14,99,599 |
9,53,770 |
| |
|
|
(65.8) |
(12.4) |
(1.6) |
(1.0) |
| |
|
2008 |
7,72,56,463 |
1,51,81,095 |
11,58,986 |
6,70,448 |
| |
|
|
(66.5) |
(13.1) |
(1.0) |
(0.6) |
| |
Variation in 2008 over 2007 |
|
|
|
|
|
| |
(a) Absolute |
|
1,54,10,833 |
35,18,551 |
-3,40,613 |
-2,83,322 |
| |
(b) Percentage |
|
(24.9) |
(30.2) |
(-22.7) |
(-29.7) |
— : Nil or Negligible.
@ : Inclusive of Investments in Postal Savings Deposit Certificates and other Postal Obligations.
Note : Figures in brackets indicate percentages to ‘Total’. |
Statement 2: Bank Group-Wise Investments by Types of Securities (Concld.) |
(Amount in Rs. lakh) |
Bank Group |
Year (end - March) |
Investments of Indian offices |
Investments of Foreign Offices |
Total Investments |
Shares and Debentures of Joint Stock Companies (Market Value) |
Other Domestic Securities |
Foreign Securities |
1 |
2 |
7 |
8 |
9 |
10 |
11 |
1. |
State Bank of India |
2007 |
10,55,407 |
1,105,232 |
90 |
404,939 |
2,02,54,617 |
| |
& Associates |
|
(5.2) |
(5.5) |
(-) |
(2.0) |
(100.0) |
| |
|
2008 |
13,89,768 |
1,827,514 |
80 |
452,269 |
2,56,35,272 |
| |
|
|
(5.4) |
(7.1) |
(-) |
(1.8) |
(100.0) |
| |
Variation in 2008 over 2007 |
|
|
|
|
|
|
| |
(a) |
Absolute |
|
3,34,361 |
722,282 |
-10 |
47,330 |
53,80,655 |
| |
(b) |
Percentage |
|
(31.7) |
(65.4) |
(-11.1) |
(11.7) |
(26.6) |
2. |
Nationalised Banks |
2007 |
47,95,722 |
2,938,712 |
38,645 |
1,076,862 |
4,47,38,233 |
| |
|
|
(10.7) |
(6.6) |
(0.1) |
(2.4) |
(100.0) |
| |
|
2008 |
48,04,384 |
3,488,022 |
35,367 |
326,263 |
5,27,12,737 |
| |
|
|
(9.1) |
(6.6) |
(0.1) |
(0.6) |
(100.0) |
| |
Variation in 2008 over 2007 |
|
|
|
|
|
|
| |
(a) |
Absolute |
|
8,662 |
549,310 |
-3,278 |
-750,599 |
79,74,504 |
| |
(b) |
Percentage |
|
(0.2) |
(18.7) |
(-8.5) |
(-69.7) |
(17.8) |
3. |
Other Scheduled |
2007 |
21,70,357 |
3,473,097 |
47,854 |
452,759 |
2,19,09,168 |
| |
Commercial Banks |
|
(9.9) |
(15.9) |
(0.2) |
(2.1) |
(100.0) |
| |
|
2008 |
28,03,093 |
5,162,181 |
41,095 |
652,933 |
2,78,73,685 |
| |
|
|
(10.1) |
(18.5) |
(0.1) |
(2.3) |
(100.0) |
| |
Variation in 2008 over 2007 |
|
|
|
|
|
|
| |
(a) |
Absolute |
|
6,32,736 |
1,689,084 |
-6,759 |
200,174 |
59,64,517 |
| |
(b) |
Percentage |
|
(29.2) |
(48.6) |
(-14.1) |
(44.2) |
(27.2) |
4. |
Foreign Banks |
2007 |
3,60,363 |
1,006,056 |
— |
— |
70,31,850 |
| |
|
|
(5.1) |
(14.3) |
|
|
(100.0) |
| |
|
2008 |
1,52,517 |
1,450,211 |
— |
— |
99,60,547 |
| |
|
|
(1.5) |
(14.6) |
|
|
(100.0) |
| |
Variation in 2008 over 2007 |
|
|
|
|
|
|
| |
(a) |
Absolute |
|
-2,07,846 |
444,155 |
— |
— |
29,28,697 |
| |
(b) |
Percentage |
|
(-57.7) |
(44.1) |
|
|
(41.6) |
5. |
All Scheduled |
2007 |
83,81,849 |
85,23,097 |
86,589 |
19,34,560 |
9,39,33,868 |
| |
Commercial Banks |
|
(8.9) |
(9.1) |
(0.1) |
(2.1) |
(100.0) |
| |
|
2008 |
91,49,762 |
1,19,27,928 |
76,542 |
14,31,465 |
11,61,82,241 |
| |
|
|
(7.9) |
(10.3) |
(0.1) |
(1.2) |
(100.0) |
| |
Variation in 2008 over 2007 |
|
|
|
|
|
|
| |
(a) |
Absolute |
|
7,67,913 |
34,04,831 |
-10,047 |
-5,03,095 |
2,22,48,373 |
| |
(b) |
Percentage |
|
(9.2) |
(39.9) |
(-11.6) |
(-26.0) |
(23.7) |
— : Nil or Negligible.
@ : Inclusive of Investments in Postal Savings Deposit Certificates and other Postal Obligations.
Note : Figures in brackets indicate percentages to ‘Total’. |
Statement 3 : Bank Group-wise Classification of Investments in Other Trustee Securities |
(Amount in Rs.lakh) |
Securities / Shares / Bonds / Debentures issued by |
Year (end-March) |
Bank Group |
All Scheduled Commercial Banks |
State Bank of India and its Associates |
Nationalised Banks |
Other Scheduled Commercial Banks |
Foreign Banks |
1 |
2 |
3 |
4 |
5 |
6 |
7 |
1. |
Local Authorities * |
2007 |
15,760 |
34,436 |
2,001 |
— |
52,197 |
| |
|
|
(3.4) |
(4.0) |
(5.6) |
— |
(3.5) |
| |
|
2008 |
7,642 |
29,443 |
2,858 |
— |
39,943 |
| |
|
|
(2.3) |
(3.8) |
(6.3) |
— |
(3.4) |
2. |
State Financial Corporations |
2007 |
18,907 |
80,221 |
9,484 |
— |
1,08,612 |
| |
|
|
(4.1) |
(9.2) |
(26.4) |
— |
(7.2) |
| |
|
2008 |
10,209 |
61,466 |
11,999 |
— |
83,674 |
| |
|
|
(3.1) |
(7.9) |
(26.3) |
— |
(7.2) |
3. |
State Industrial Development |
2007 |
3,494 |
8,088 |
620 |
— |
12,202 |
| |
Corporations |
|
(0.8) |
(0.9) |
(1.7) |
— |
(0.8) |
| |
|
2008 |
3,850 |
8,569 |
480 |
— |
12,899 |
| |
|
|
(1.2) |
(1.1) |
(1.1) |
— |
(1.1) |
4. |
State Electricity Boards |
2007 |
1,35,228 |
1,25,396 |
2,429 |
— |
2,63,053 |
| |
|
|
(293) |
(14.4) |
(6.8) |
— |
(17.5) |
| |
|
2008 |
1,16,059 |
1,09,940 |
6,524 |
— |
2,32,523 |
| |
|
|
(35.2) |
(14.1) |
(14.3) |
— |
(20.1) |
5. |
Co-operative Institutions |
2007 |
5,160 |
3,903 |
125 |
29 |
9,217 |
| |
|
|
(1.1) |
(0.4) |
(0.3) |
(0.0) |
(0.6) |
| |
|
2008 |
2,615 |
1,999 |
75 |
29 |
4,718 |
| |
|
|
(0.8) |
(0.3) |
(0.2) |
(2.0) |
(0.4) |
6. |
Industrial Finance Corporation |
2007 |
61,536 |
1,11,177 |
4,865 |
802 |
1,78,380 |
| |
of India |
|
(13.3) |
(12.8) |
(13.6) |
(0.6) |
(11.9) |
| |
|
2008 |
46,888 |
1,02,619 |
4,300 |
2 |
1,53,809 |
| |
|
|
(14.2) |
(13.1) |
(9.4) |
(0.1) |
(13.3) |
7. |
National Bank for Agriculture |
2007 |
3,956 |
8,720 |
530 |
1,19,100 |
1,32,306 |
| |
and Rural Development |
|
(0.9) |
(1.0) |
(1.5) |
(90.5) |
(8.8) |
| |
|
2008 |
18,205 |
7,120 |
455 |
— |
25,780 |
| |
|
|
(5.5) |
(0.9) |
(1.0) |
— |
(2.2) |
8. |
Rural Electrification Corporation |
2007 |
5,996 |
12,537 |
220 |
— |
18,753 |
| |
|
|
(1.3) |
(1.4) |
(0.6) |
— |
(1.3) |
| |
|
2008 |
5,246 |
11,700 |
20 |
— |
16,966 |
| |
|
|
(1.6) |
(1.5) |
(-) |
— |
(1.5) |
* : Includes Municipalities and Port Trust.
‘—’ : Nil or Negligible.
Note : Figures in brackets indicate percentages to ‘Total’. |
Statement 3 : Bank Group-wise Classification of Investments in Other Trustee Securities (Concld.) |
(Amount in Rs.lakh) |
Securities / Shares / Bonds / Debentures issued by |
Year (end-March) |
Bank Group |
All Scheduled Commercial Banks |
State Bank of India and its Associates |
Nationalised Banks |
Other Scheduled Commercial Banks |
Foreign Banks |
1 |
2 |
3 |
4 |
5 |
6 |
7 |
9. |
Export-Import Bank of India |
2007 |
5,045 |
13,662 |
751 |
5,870 |
25,328 |
| |
|
|
(1.1) |
(1.6) |
(2.1) |
(4.5) |
(1.7) |
| |
|
2008 |
3,463 |
11,017 |
570 |
70 |
15,120 |
| |
|
|
(1.0) |
(1.4) |
(1.3) |
(4.8) |
(1.3) |
10. |
National Co-operative Devel- |
2007 |
4,275 |
26,994 |
— |
— |
31,269 |
| |
opment Corporation of India |
|
(0.9) |
(3.1) |
|
|
(2.1) |
| |
|
2008 |
3,575 |
23,185 |
— |
— |
26,760 |
| |
|
|
(1.1) |
(3.0) |
|
|
(2.3) |
11. |
Housing and Urban Development |
2007 |
11,743 |
22,854 |
469 |
45 |
35,111 |
| |
Corporation of India |
|
(2.5) |
(2.6) |
(1.3) |
(0.0) |
(2.3) |
| |
|
2008 |
8,031 |
16,709 |
5,307 |
45 |
30,092 |
| |
|
|
(2.4) |
(2.1) |
(11.6) |
(3.1) |
(2.6) |
12. |
Unit Trust of India |
2007 |
— |
2,917 |
— |
— |
2,917 |
| |
|
|
|
(0.3) |
|
|
(0.2) |
| |
|
2008 |
347 |
2,917 |
— |
— |
3,264 |
| |
|
|
(0.1) |
(0.4) |
|
|
(0.3) |
13. |
Industrial Reconstruction |
2007 |
10,627 |
14,261 |
100 |
— |
24,988 |
| |
Bank of India |
|
(2.3) |
(1.6) |
(0.3) |
|
(1.7) |
| |
|
2008 |
6,600 |
9,984 |
100 |
— |
16,684 |
| |
|
|
(2.0) |
(1.3) |
(0.2) |
|
(1.4) |
14. |
Housing Boards |
2007 |
1,047 |
6,287 |
135 |
— |
7,469 |
| |
|
|
(0.2) |
(0.7) |
(0.4) |
|
(0.5) |
| |
|
2008 |
744 |
5,190 |
80 |
— |
6,014 |
| |
|
|
(0.2) |
(0.7) |
(0.2) |
|
(0.5) |
15. |
Others |
2007 |
1,78,793 |
3,99,148 |
14,161 |
5,695 |
5,97,797 |
| |
|
|
(38.7) |
(45.8) |
(39.5) |
(4.3) |
(39.9) |
| |
|
2008 |
96,365 |
3,80,233 |
12,816 |
1,326 |
4,90,740 |
| |
|
|
(29.2) |
(48.6) |
(28.1) |
(90.1) |
(42.3) |
TOTAL |
2007 |
4,61,567 |
8,70,601 |
35,890 |
1,31,541 |
14,99,599 |
| |
|
(100.0) |
(100.0) |
(100.0) |
(100.0) |
(100.0) |
| |
2008 |
3,29,839 |
7,82,091 |
45,584 |
1,472 |
11,58,986 |
| |
|
(100.0) |
(100.0) |
(100.0) |
(100.0) |
(100.0) |
* : Includes Municipalities and Port Trust.
‘—’ : Nil or Negligible.
Note : Figures in brackets indicate percentages to ‘Total’. |
Statement 4: Bank Group-Wise Investments in Shares and Debentures of Joint Stock Companies, Units and ‘Other’ Securities |
(Amount in Rs.lakh) |
Bank Group |
Year (end-March) |
Shares |
Debentures |
Face Value |
Market Value@ |
Face Value |
Market Value@ |
1 |
2 |
3 |
4 |
5 |
6 |
1. |
State Bank of India & its Associates |
2007 |
2,41,378 |
5,43,772 |
5,44,458 |
5,11,635 |
| |
|
|
(30.7) |
(51.5) |
(69.3) |
(48.5) |
| |
|
2008 |
3,02,795 |
8,84,536 |
5,25,479 |
5,05,232 |
| |
|
|
(36.6) |
(63.6) |
(63.4) |
(36.4) |
2. |
Nationalised Banks |
2007 |
4,20,950 |
9,00,726 |
40,43,377 |
38,94,996 |
| |
|
|
(9.4) |
(18.8) |
(90.6) |
(81.2) |
| |
|
2008 |
7,42,841 |
12,39,870 |
35,40,541 |
35,64,514 |
| |
|
|
(17.3) |
(25.8) |
(82.7) |
(74.2) |
3. |
Other Scheduled Commercial Banks |
2007 |
4,29,247 |
6,74,687 |
15,77,203 |
14,95,670 |
| |
|
|
(21.4) |
(31.1) |
(78.6) |
(68.9) |
| |
|
2008 |
5,25,937 |
10,17,546 |
18,56,323 |
17,85,547 |
| |
|
|
(22.1) |
(36.3) |
(77.9) |
(63.7) |
4. |
Foreign Banks |
2007 |
3,183 |
2,805 |
3,72,266 |
3,57,558 |
| |
|
|
(0.8) |
(0.8) |
(99.2) |
(99.2) |
| |
|
2008 |
7,886 |
7,165 |
1,46,944 |
1,45,352 |
| |
|
|
(5.1) |
(4.7) |
(94.9) |
(95.3) |
5. |
All Scheduled Commercial Banks |
2007 |
10,94,758 |
21,21,990 |
65,37,304 |
62,59,859 |
| |
|
|
(14.3) |
(25.3) |
(85.7) |
(74.7) |
| |
|
2008 |
15,79,459 |
31,49,117 |
60,69,287 |
60,00,645 |
| |
|
|
(20.6) |
(34.4) |
(79.4) |
(65.6) |
@ : Investments in shares and debentures are at estimated realiasable value where market value is not available.
* : ‘Others’ includes securities such as initial contribution to share capital of UTI, shares of DICGC, Fixed Deposits with banks and Mutual Funds. CDs and CPs.
Note : Figures in brackets indicate percentages to ‘Total’ |
Statement 4: Bank Group-Wise Investments in Shares and Debentures of Joint Stock Companies, Units and ‘Other’ Securities (Concld.) |
(Amount in Rs.lakh) |
Bank Group |
Year (end-March) |
Sub Total |
Units of UTI and Others* Face Value |
Total |
Face Value |
Market Value@ |
1 |
2 |
7 (3+5) |
8 (4+6) |
9 |
10 (8+9) |
1. |
State Bank of India & its Associates |
2007 |
7,85,836 |
10,55,407 |
11,05,232 |
21,60,639 |
| |
|
|
(100.0) |
(100.0) |
|
(12.8) |
| |
|
2008 |
8,28,274 |
13,89,768 |
18,27,861 |
32,17,629 |
| |
|
|
(100.0) |
(100.0) |
|
(15.3) |
2. |
Nationalised Banks |
2007 |
44,64,327 |
47,95,722 |
29,41,629 |
77,37,351 |
| |
|
|
(100.0) |
(100.0) |
|
(45.8) |
| |
|
2008 |
42,83,382 |
48,04,384 |
34,90,939 |
82,95,323 |
| |
|
|
(100.0) |
(100.0) |
|
(39.3) |
3. |
Other Scheduled Commercial Banks |
2007 |
20,06,450 |
21,70,357 |
34,73,097 |
56,43,454 |
| |
|
|
(100.0) |
(100.0) |
|
(33.4) |
| |
|
2008 |
23,82,260 |
28,03,093 |
51,62,181 |
79,65,274 |
| |
|
|
(100.0) |
(100.0) |
|
(37.8) |
4. |
Foreign Banks |
2007 |
3,75,449 |
3,60,363 |
10,06,056 |
13,66,419 |
| |
|
|
(100.0) |
(100.0) |
|
(8.1) |
| |
|
2008 |
1,54,830 |
1,52,517 |
14,50,211 |
16,02,728 |
| |
|
|
(100.0) |
(100.0) |
|
(7.6) |
5. |
All Scheduled Commercial Banks |
2007 |
76,32,062 |
83,81,849 |
85,26,014 |
16,907,863 |
| |
|
|
(100.0) |
(100.0) |
|
(100.0) |
| |
|
2008 |
76,48,746 |
91,49,762 |
1,19,31,192 |
21,080,954 |
| |
|
|
(100.0) |
(100.0) |
|
(100.0) |
@ : Investments in shares and debentures are at estimated realiasable value where market value is not available.
* : ‘Others’ includes securities such as initial contribution to share capital of UTI, shares of DICGC, Fixed Deposits with banks and Mutual Funds. CDs and CPs.
Note : Figures in brackets indicate percentages to ‘Total’ |
Statement 5 : Scheduled Commercial Banks’ Investments in Bonds Issued by
Public Sector Enterprises (As at end-March) |
(Amount in Rs.lakh) |
Public Sector Enterprises/Undertakings |
State Bank of India and its Associates |
Nationalised Banks |
Other Scheduled Commercial Banks |
2007 |
2008 |
2007 |
2008 |
2007 |
2008 |
1 |
2 |
3 |
4 |
5 |
6 |
7 |
1. |
Indian Railway Finance Corporation (Railway Bonds) |
2,500 |
1,500 |
93,650 |
62,049 |
26,590 |
37,590 |
2. |
National Thermal Power Corporation (NTPC) |
5,000 |
— |
29,137 |
23,440 |
1,000 |
1,000 |
3. |
National Hydro-Electric Power Corporation (NHPC) |
— |
— |
500 |
500 |
1,600 |
1,500 |
4. |
Nuclear Power Corporation |
1,075 |
— |
62,010 |
52,340 |
10,472 |
6,131 |
5. |
Power Finance Corporation |
15,810 |
16,135 |
1,20,102 |
1,66,720 |
83,747 |
1,74,635 |
6. |
Indian Telephone Industries (ITI) |
— |
634 |
35,510 |
34,010 |
10,810 |
10,500 |
7. |
Neyvelli Lignite Corporation |
— |
— |
— |
— |
— |
— |
8. |
Indian Petrochemical Corporation Limited |
— |
— |
52 |
— |
— |
— |
9. |
Mahanagar Telephone Nigam Ltd. (MTNL) |
— |
— |
— |
— |
— |
— |
10. |
Rural Electrification Corporation (REC) |
7,596 |
10,846 |
2,06,148 |
1,50,250 |
58,950 |
53,630 |
11. |
Hindustan Photo Film Mfg. Co. Ltd. |
300 |
150 |
— |
— |
— |
— |
12. |
Housing & Urban Dev. Corp. (HUDCO) |
21,811 |
15,031 |
1,11,226 |
75,764 |
22,762 |
25,182 |
Total |
54,092 |
44,296 |
6,58,335 |
5,65,073 |
2,15,931 |
3,10,168 |
— : Nil or Negligible.
Note : Figures in brackets indicate percentages to ‘Total’. |
Statement 5 : Scheduled Commercial Banks’ Investments in Bonds Issued by Public Sector Enterprises (As at end-March) (Concld.) |
(Amount in Rs.lakh) |
Public Sector Enterprises/Undertakings |
Foreign Banks |
All Scheduled Commercial Banks |
2007 |
2008 |
2007 |
2008 |
1 |
8 |
9 |
10 |
11 |
1. Indian Railway Finance |
4070 |
500 |
1,26,810 |
1,01,639 |
Corporation (Railway Bonds) |
|
|
(12.9) |
(10.9) |
2. National Thermal Power |
— |
— |
35,137 |
24,440 |
Corporation (NTPC) |
|
|
(3.6) |
(2.6) |
3. National Hydro-Electric |
— |
— |
2,100 |
2,000 |
Power Corporation (NHPC) |
|
|
(0.2) |
(0.2) |
4. Nuclear Power Corporation |
— |
— |
73,557 |
58,471 |
| |
|
|
(7.5) |
(6.3) |
5. Power Finance Corporation |
35,980 |
410 |
2,55,639 |
3,57,900 |
| |
|
|
(26.1) |
(38.4) |
6. Indian Telephone |
— |
— |
46,320 |
45,144 |
Industries (ITI) |
|
|
(4.7) |
(4.8) |
7. Neyvelli Lignite |
— |
— |
— |
— |
Corporation |
|
|
|
|
8. Indian Petrochemical |
— |
— |
52 |
— |
Corporation Limited |
|
|
(-) |
|
9. Mahanagar Telephone |
— |
— |
— |
— |
Nigam Ltd. (MTNL) |
|
|
|
|
10. Rural Electrification |
8,220 |
8,220 |
2,80,914 |
2,22,946 |
Corporation (REC) |
|
|
(28.6) |
(23.9) |
11. Hindustan Photo Film |
— |
— |
300 |
150 |
Mfg. Co. Ltd. |
|
|
(-) |
(-) |
12. Housing & Urban |
4,545 |
4,545 |
1,60,344 |
1,20,522 |
Dev. Corp. (HUDCO) |
|
|
(16.3) |
(12.9) |
Total |
52,815 |
13,675 |
9,81,173 |
9,33,212 |
| |
|
|
(100.0) |
(100.0) |
— : Nil or Negligible.
Note : Figures in brackets indicate percentages to ‘Total’. |
Statement 6 : Classification of Investments in Government Securities According to
Period of Maturity @ (As at end - March ) |
(Amount in Rs.lakh) |
Year/Period of Maturity (during April-March) |
State Bank of India and its Associates |
Nationalised Banks |
2007 |
2008 |
2007 |
2008 |
Central |
State |
Central |
State |
Central |
State |
Central |
State |
1 |
2 |
3 |
4 |
5 |
6 |
7 |
8 |
9 |
2007-08 |
19,67,109 |
2,25,575 |
— |
— |
25,49,136 |
4,17,551 |
— |
— |
| |
(12.1) |
(6.0) |
|
|
(7.5) |
(4.6) |
|
|
2008-09 |
9,91,356 |
1,59,542 |
16,71,327 |
1,49,655 |
9,32,872 |
5,31,705 |
28,46,605 |
4,55,446 |
| |
(7.4) |
(4.2) |
(10.3) |
(2.8) |
(3.4) |
(7.2) |
(8.3) |
(5.0) |
2009-10 |
14,49,907 |
2,09,368 |
10,90,902 |
1,89,182 |
19,19,753 |
5,56,107 |
16,58,779 |
4,85,229 |
| |
(10.8) |
(5.5) |
(6.7) |
(3.5) |
(7.0) |
(7.5) |
(4.9) |
(5.3) |
2010-15 |
61,46,108 |
26,03,407 |
84,24,190 |
23,08,115 |
1,01,10,398 |
41,18,714 |
1,20,48,268 |
39,05,537 |
| |
(45.7) |
(68.9) |
(52.0) |
(42.6) |
(36.6) |
(55.5) |
(35.3) |
(42.8) |
2015-20 |
27,68,730 |
5,79,312 |
37,57,246 |
27,63,613 |
82,64,284 |
17,90,437 |
1,05,96,127 |
42,52,254 |
| |
(20.6) |
(15.3) |
(23.2) |
(51.0) |
(29.9) |
(24.1) |
(31.0) |
(46.6) |
2020-2025 |
76,968 |
— |
10,48,591 |
— |
17,09,011 |
— |
25,42,488 |
— |
| |
(0.6) |
|
(6.5) |
|
(6.2) |
|
(7.4) |
|
2025 and above |
50,000 |
— |
2,20,000 |
12,981 |
21,17,356 |
367 |
44,55,711 |
30,166 |
| |
(0.4) |
|
(1.4) |
(0.2) |
(7.7) |
|
(13.0) |
(0.3) |
TOTAL |
1,34,50,178 |
37,77,204 |
1,62,12,256 |
54,23,546 |
2,76,02,810 |
74,14,881 |
3,41,47,978 |
91,28,632 |
| |
(100.0) |
(100.0) |
(100.0) |
(100.0) |
(100.0) |
(100.0) |
(100.0) |
(100.0) |
— : Nil or Negligible.
@ : Excluding postal Savings and other obligations.
Note : Figures in brackets indicate percentages to ‘Total’. |
Statement 6 : Classification of Investments in Government Securities According to
Period of Maturity @ (As at end - March) (Contd.) |
(Amount in Rs.lakh) |
Year/Period of Maturity (during April-March) |
Other Scheduled Commercial Banks |
Foreign Banks |
2007 |
2008 |
2007 |
2008 |
Central |
State |
Central |
State |
Central |
State |
Central |
State |
1 |
10 |
11 |
12 |
13 |
14 |
15 |
16 |
17 |
2007-08 |
35,95,871 |
45,667 |
— |
— |
— |
— |
— |
— |
| |
(19.4) |
(7.3) |
|
|
|
|
|
|
2008-09 |
9,78,750 |
50,531 |
28,43,536 |
67,011 |
9,56,431 |
293 |
27,42,602 |
63 |
| |
(6.4) |
(11.0) |
(15.3) |
(10.7) |
(17.3) |
(3.2) |
(32.8) |
(38.2) |
2009-10 |
16,65,816 |
30,359 |
18,10,779 |
42,784 |
8,43,546 |
— |
20,27,806 |
— |
| |
(10.9) |
(6.6) |
(9.8) |
(6.8) |
(15.3) |
|
(24.3) |
|
2010-15 |
55,55,023 |
1,93,174 |
79,85,270 |
1,95,647 |
13,87,378 |
400 |
28,17,952 |
70 |
| |
(36.4) |
(41.9) |
(43.1) |
(31.1) |
(25.1) |
(4.4) |
(33.7) |
(42.4) |
2015-20 |
28,80,428 |
1,41,590 |
38,42,777 |
3,19,382 |
4,07,311 |
8,445 |
6,56,368 |
32 |
| |
(18.9) |
(30.7) |
(20.7) |
(50.8) |
(7.4) |
(92.4) |
(7.9) |
(19.4) |
2020-2025 |
3,45,257 |
— |
14,02,244 |
— |
13,768 |
— |
67,220 |
— |
| |
(2.3) |
|
(7.6) |
|
(0.2) |
|
(0.8) |
|
2025 and above |
2,46,745 |
— |
655,441 |
3,928 |
40,716 |
— |
44,234 |
— |
| |
(1.6) |
|
(3.5) |
(0.6) |
(0.7) |
|
(0.5) |
|
TOTAL |
1,52,67,890 |
4,61,321 |
1,85,40,047 |
6,28,752 |
55,24,752 |
9,138 |
83,56,182 |
165 |
| |
(100.0) |
(100.0) |
(100.0) |
(100.0) |
(100.0) |
(100.0) |
(100.0) |
(100.0) |
— : Nil or Negligible.
@ : Excluding postal Savings and other obligations.
Note : Figures in brackets indicate percentages to ‘Total’. |
Statement 6 : Classification of Investments in Government Securities According to Period of Maturity @ (As at end - March) (Concld.) |
(Amount in Rs.lakh) |
Year/Period of Maturity (during April-March) |
All Scheduled Commercial Banks |
2007 |
2008 |
Central |
State |
Central |
State |
1 |
18 |
19 |
20 |
21 |
2007-08 |
99,87,718 |
6,88,793 |
— |
— |
| |
(12.9) |
(4.5) |
|
|
2008-09 |
38,59,409 |
7,42,071 |
1,01,04,070 |
6,72,175 |
| |
(6.2) |
(6.4) |
(13.1) |
(4.4) |
2009-10 |
58,79,022 |
7,95,834 |
65,88,266 |
7,17,195 |
| |
(9.5) |
(6.8) |
(8.5) |
(4.7) |
2010-15 |
2,31,98,907 |
69,15,695 |
3,12,75,680 |
64,09,369 |
| |
(37.5) |
(59.3) |
(40.5) |
(42.2) |
2015-20 |
1,43,20,753 |
25,19,784 |
1,88,52,518 |
73,35,281 |
| |
(23.2) |
(21.6) |
(24.4) |
(48.3) |
2020-2025 |
21,45,004 |
— |
50,60,543 |
— |
| |
(3.5) |
|
(6.6) |
|
2025 and above |
24,54,817 |
367 |
53,75,386 |
47,075 |
| |
(4.0) |
— |
(7.0) |
(0.3) |
TOTAL |
6,18,45,630 |
1,16,62,544 |
7,72,56,463 |
1,51,81,095 |
| |
(100.0) |
(100.0) |
(100.0) |
(100.0) |
— : Nil or Negligible.
@ : Excluding postal Savings and other obligations.
Note : Figures in brackets indicate percentages to ‘Total’. |
Statement 7 : Distribution of Investments of Scheduled Commercial Banks in Central Government@ and State Government Securities by Interest Rate |
(Amount in Rs.lakh) |
Bank Grou |
Year (end March) |
Less than 6% |
6% to 8% |
8% to 10 % |
10% to 11% |
Central Govt. |
State Govt. |
Central Govt. |
State Govt. |
Central Govt. |
State Govt. |
Central Govt. |
State Govt. |
1 |
2 |
3 |
4 |
5 |
6 |
7 |
8 |
9 |
10 |
State Bank of India |
2007 |
1865879 |
703319 |
4494387 |
2008903 |
2149377 |
214761 |
281443 |
138147 |
and Associates |
|
(15.0) |
(18.6) |
(36.0) |
(53.2) |
(17.2) |
(5.7) |
(2.3) |
(3.7) |
| |
2008 |
1425813 |
669851 |
5976291 |
2496860 |
3202159 |
1674300 |
267793 |
110577 |
| |
|
(10.3) |
(12.4) |
(43.1) |
(46.0) |
(23.1) |
(30.9) |
(1.9) |
(2.0) |
Nationalised Banks |
2007 |
1996092 |
1178776 |
12502674 |
3249996 |
4717716 |
751605 |
1855231 |
453853 |
| |
|
(8.0) |
(15.9) |
(50.4) |
(43.8) |
(19.0) |
(10.1) |
(7.5) |
(6.1) |
| |
2008 |
2068879 |
1167710 |
16468773 |
3411661 |
7363249 |
2798167 |
1274940 |
436043 |
| |
|
(6.7) |
(12.8) |
(53.2) |
(37.4) |
(23.8) |
(30.7) |
(4.1) |
(4.8) |
Other Scheduled |
2007 |
1892129 |
53121 |
5573185 |
198436 |
1785901 |
59395 |
310081 |
17790 |
Commercial Banks |
|
(15.2) |
(11.5) |
(44.7) |
(43.0) |
(14.3) |
(12.9) |
(2.5) |
(3.9) |
| |
2008 |
592458 |
52617 |
7271910 |
216941 |
3213911 |
213851 |
308081 |
19073 |
| |
|
(4.0) |
(8.4) |
(48.6) |
(34.5) |
(21.5) |
(34.0) |
(2.1) |
(3.0) |
Foreign Banks |
2007 |
103162 |
— |
1208819 |
1000 |
884964 |
7445 |
7001 |
— |
| |
|
(2.3) |
|
(27.4) |
(10.9) |
(20.1) |
(81.5) |
(0.2) |
|
| |
2008 |
1806077 |
— |
1897671 |
— |
672132 |
32 |
29069 |
— |
| |
|
(28.1) |
|
(29.5) |
|
(10.5) |
(19.4) |
(0.5) |
|
All Scheduled |
2007 |
5857262 |
1935216 |
23779065 |
5458335 |
9537958 |
1033206 |
2453756 |
609790 |
Commercial Banks |
|
(10.8) |
(16.6) |
(43.9) |
(46.8) |
(17.6) |
(8.9) |
(4.5) |
(5.2) |
| |
2008 |
5893227 |
1890178 |
31614645 |
6125462 |
14451451 |
4686350 |
1879883 |
565693 |
| |
|
(8.9) |
(12.5) |
(47.8) |
(40.4) |
(21.8) |
(30.9) |
(2.8) |
(3.7) |
— : Nil or Negligible.
@ : Excludes Govt.of India Treasury Bills, Saving Deposits Certificates and other Postal Obligations.
Note : Figures in brackets indicate percentages to ‘Total’. |
Statement 7 : Distribution of Investments of Scheduled Commercial Banks in Central Government@ and State Government Securities by Interest Rate (Concld.) |
(Amount in Rs.lakh) |
Bank Group |
Year (end -March) |
11% to 12 % |
12% to 13% |
13% and above |
Total |
Central Govt. |
State Govt. |
Central Govt. |
State Govt. |
Central Govt. |
State Govt. |
Central Govt. |
State Govt. |
1 |
2 |
11 |
12 |
13 |
14 |
15 |
16 |
17 |
18 |
State Bank of India |
2007 |
24,21,109 |
2,45,611 |
9,18,883 |
2,80,061 |
3,43,420 |
1,86,402 |
1,24,74,498 |
37,77,204 |
and Associates |
|
(19.4) |
(6.5) |
(7.4) |
(7.4) |
(2.8) |
(4.9) |
(100.0) |
(100.0) |
| |
2008 |
20,67,759 |
2,31,934 |
9,16,313 |
2,40,024 |
— |
— |
1,38,56,128 |
54,23,546 |
| |
|
(14.9) |
(4.3) |
(6.6) |
(4.4) |
|
|
(100.0) |
(100.0) |
Nationalised Banks |
2007 |
24,97,129 |
6,22,020 |
11,94,171 |
8,42,897 |
52,953 |
3,15,367 |
2,48,15,966 |
74,14,514 |
| |
|
(10.1) |
(8.4) |
(4.8) |
(11.4) |
(0.2) |
(4.3) |
(100.0) |
(100.0) |
| |
2008 |
25,37,288 |
5,62,673 |
12,58,552 |
7,51,715 |
— |
— |
3,09,71,681 |
91,27,969 |
| |
|
(8.2) |
(6.2) |
(4.1) |
(8.2) |
|
|
(100.0) |
(100.0) |
Other Scheduled |
2007 |
16,87,531 |
30,230 |
10,20,371 |
76,829 |
2,02,636 |
25,520 |
1,24,71,834 |
4,61,321 |
Commercial Banks |
|
(13.5) |
(6.6) |
(8.2) |
(16.7) |
(1.6) |
(5.5) |
(100.0) |
(100.0) |
| |
2008 |
21,05,119 |
54,672 |
14,62,399 |
71,598 |
— |
— |
1,49,53,878 |
6,28,752 |
| |
|
(14.1) |
(8.7) |
(9.8) |
(11.4) |
|
|
(100.0) |
(100.0) |
Foreign Banks |
2007 |
11,75,085 |
693 |
9,06,235 |
1,19,596 |
— |
— |
44,04,862 |
9,138 |
| |
|
(26.7) |
(7.6) |
(20.6) |
(2.7) |
|
|
(100.0) |
(100.0) |
| |
2008 |
10,34,907 |
133 |
9,82,065 |
— |
— |
— |
64,21,921 |
165 |
| |
|
(16.1) |
(80.6) |
(15.3) |
|
|
|
(100.0) |
(100.0) |
All Scheduled |
2007 |
77,80,854 |
8,98,554 |
40,39,660 |
11,99,787 |
7,18,605 |
5,27,289 |
5,41,67,160 |
1,16,62,177 |
Commercial Banks |
|
(14.4) |
(7.7) |
(7.5) |
(10.3) |
(1.3) |
(4.5) |
(100.0) |
(100.0) |
| |
2008 |
77,45,073 |
8,49,412 |
46,19,329 |
10,63,337 |
— |
— |
6,62,03,608 |
1,51,80,432 |
| |
|
(11.7) |
(5.6) |
(7.0) |
(7.0) |
|
|
(100.0) |
(100.0) |
— : Nil or Negligible.
@ : Excluding postal Savings and other obligations.
Note : Figures in brackets indicate percentages to ‘Total’. |
Statement 8 : State-Wise Classification of Scheduled Commercial Banks’ Investments in State Government Securities and State Level Bodies (As at end-March) |
(Amount in Rs. lakh) |
State / Union Territory |
State Government Securities |
Regional Rural Banks |
Co-operative Institutions |
State Electricity Boards |
2007 |
2008 |
2007 |
2008 |
2007 |
2008 |
2007 |
2008 |
1 |
2 |
3 |
4 |
5 |
6 |
7 |
8 |
9 |
Andhra Pradesh |
10,92,208 |
14,74,623 |
6,189 |
9,396 |
1,855 |
929 |
19,399 |
16,759 |
Arunachal Pradesh |
14,903 |
21,949 |
109 |
109 |
- |
- |
- |
- |
Assam |
2,11,956 |
2,29,798 |
631 |
631 |
8 |
- |
17,461 |
17,462 |
Bihar |
4,69,777 |
4,99,355 |
9,106 |
13,681 |
- |
- |
12,253 |
13,793 |
Chhattisgarh |
99,262 |
97,368 |
1,545 |
4,247 |
50 |
- |
2,129 |
- |
Goa |
64,609 |
87,706 |
- |
- |
- |
- |
- |
- |
Gujarat |
6,41,885 |
11,27,689 |
2,899 |
2,899 |
2,193 |
1,553 |
34,279 |
19,402 |
Haryana |
2,79,602 |
2,55,398 |
1,753 |
1,798 |
1,158 |
67 |
7,808 |
5,214 |
Himachal Pradesh |
2,44,431 |
3,61,241 |
968 |
968 |
88 |
88 |
5,863 |
5,463 |
Jammu & Kashmir |
1,52,578 |
2,88,819 |
1,542 |
2,102 |
63 |
63 |
4,666 |
4,782 |
Jharkhand |
1,45,801 |
1,46,705 |
569 |
1,778 |
- |
- |
16 |
- |
Karnataka |
5,75,574 |
6,05,827 |
4,589 |
4,589 |
- |
- |
457 |
391 |
Kerala |
6,20,728 |
8,58,476 |
294 |
294 |
15 |
- |
11,073 |
3,970 |
Madhya Pradesh |
5,59,719 |
5,40,068 |
9,533 |
9,533 |
725 |
310 |
55,313 |
43,096 |
Maharashtra |
9,66,621 |
15,47,410 |
4,528 |
4,528 |
1,659 |
702 |
38,089 |
32,123 |
Manipur |
30,312 |
29,086 |
35 |
35 |
- |
- |
- |
- |
Meghalaya |
38,346 |
40,385 |
91 |
91 |
30 |
- |
4,128 |
3,372 |
Mizoram |
25,153 |
27,249 |
316 |
316 |
- |
- |
- |
- |
Nagaland |
55,281 |
56,466 |
109 |
109 |
- |
- |
- |
- |
Orissa |
3,92,459 |
3,19,629 |
4,479 |
6,635 |
- |
- |
2,370 |
2,345 |
Punjab |
5,04,287 |
7,98,412 |
888 |
2,696 |
60 |
28 |
15,335 |
18,152 |
Rajasthan |
7,57,311 |
9,49,173 |
6,412 |
6,412 |
262 |
17 |
19,929 |
16,318 |
Sikkim |
15,103 |
20,222 |
- |
- |
- |
- |
- |
- |
Tamil Nadu |
7,80,964 |
10,82,542 |
265 |
1,294 |
960 |
901 |
30,086 |
41,673 |
Tripura |
42,136 |
37,522 |
35 |
35 |
- |
- |
- |
- |
Uttar Pradesh |
15,84,815 |
17,64,063 |
13,891 |
14,752 |
- |
- |
22,286 |
14,443 |
Uttaranchal |
2,08,344 |
2,69,279 |
572 |
676 |
- |
- |
- |
- |
West Bengal |
10,88,379 |
16,10,935 |
1,701 |
4,018 |
50 |
50 |
22,853 |
20,047 |
Andaman & Nicobar Islands |
- |
- |
- |
- |
- |
- |
- |
- |
Chandigarh |
- |
- |
- |
- |
- |
- |
- |
- |
Delhi |
- |
- |
- |
- |
- |
- |
- |
- |
Daman & Diu |
- |
- |
- |
- |
- |
- |
- |
- |
Lakshadweep |
- |
- |
- |
- |
- |
- |
- |
- |
Pondicherry |
- |
33,700 |
- |
- |
11 |
- |
- |
- |
Dadra & Nagar Haveli |
- |
- |
- |
- |
- |
11 |
- |
- |
All India |
1,16,62,544 |
1,51,81,095 |
73,049 |
93,622 |
9,187 |
4,719 |
3,25,793 |
2,78,805 |
| |
(93.9) |
(96.0) |
(0.6) |
(0.6) |
(0.1) |
(-) |
(2.6) |
(1.8) |
— : Nil or negligible.
Notes :1. Figures in brackets indicate percentages to total.
2.Figures in this Statement are inclusive of non-guaranteed bonds and unsecured debentures.
3. Data on State Government Securities are exclusive of loans matured but still held by the banks. |
Statement 8 : State-Wise Classification of Scheduled Commercial Banks’ Investments in State Government Securities and State Level Bodies (As at end-March) (Contd.) |
(Amount in Rs. lakh) |
State / Union Territory |
Municipal Corporation Municipality and Port Trusts |
State Financial Corporations |
Housing Boards |
State Industrial Development Corporations |
2007 |
2008 |
2007 |
2008 |
2007 |
2008 |
2007 |
2008 |
1 |
10 |
11 |
12 |
13 |
14 |
15 |
16 |
17 |
Andhra Pradesh |
300 |
5,131 |
10,929 |
7,817 |
554 |
486 |
- |
1,821 |
Arunachal Pradesh |
- |
- |
- |
- |
- |
- |
- |
- |
Assam |
- |
- |
134 |
3 |
- |
- |
- |
- |
Bihar |
- |
7 |
8,505 |
5,275 |
- |
- |
- |
- |
Chhattisgarh |
- |
- |
888 |
547 |
26 |
6 |
- |
- |
Goa |
- |
- |
- |
- |
- |
- |
15 |
1,153 |
Gujarat |
7,365 |
6,344 |
4,134 |
3,546 |
97 |
83 |
1,848 |
2,483 |
Haryana |
- |
- |
1,791 |
1,281 |
110 |
110 |
- |
- |
Himachal Pradesh |
- |
- |
182 |
182 |
- |
- |
200 |
- |
Jammu & Kashmir |
- |
- |
2,790 |
3,013 |
- |
- |
- |
- |
harkhand |
- |
- |
395 |
- |
- |
- |
- |
- |
Karnataka |
165 |
30 |
7,553 |
9,285 |
110 |
110 |
7,086 |
7,080 |
Kerala |
383 |
124 |
11,046 |
6,274 |
1,029 |
875 |
2,033 |
1,201 |
Madhya Pradesh |
- |
164 |
10,302 |
5,218 |
1,379 |
1,089 |
700 |
210 |
Maharashtra |
10,514 |
9,035 |
11,279 |
7,305 |
10 |
1,680 |
4,700 |
2,972 |
Manipur |
- |
- |
- |
- |
- |
- |
- |
421 |
Meghalaya |
- |
- |
- |
- |
- |
- |
- |
|
Mizoram |
- |
- |
- |
- |
- |
- |
- |
428 |
Nagaland |
- |
50 |
- |
- |
- |
- |
- |
473 |
Orissa |
- |
- |
2,172 |
792 |
- |
- |
296 |
110 |
Punjab |
75 |
140 |
1,262 |
1,553 |
- |
27 |
- |
36 |
Rajasthan |
- |
30 |
10,444 |
9,272 |
2,203 |
926 |
1,381 |
1,404 |
Sikkim |
- |
- |
- |
- |
- |
- |
200 |
637 |
Tamil Nadu |
1,331 |
3,639 |
6,281 |
4,816 |
2,031 |
1,606 |
4,950 |
3,859 |
Tripura |
- |
- |
- |
- |
- |
- |
|
164 |
Uttar Pradesh |
- |
- |
26,584 |
15,162 |
- |
- |
25 |
- |
Uttaranchal |
- |
1,101 |
- |
- |
- |
100 |
- |
- |
West Bengal |
3,615 |
2,371 |
908 |
18,255 |
535 |
385 |
8,082 |
8,081 |
Andaman & Nicobar Islands |
- |
- |
- |
- |
- |
- |
- |
- |
Chandigarh |
167 |
- |
- |
- |
- |
- |
- |
- |
Delhi |
- |
- |
49 |
3 |
135 |
75 |
- |
- |
Daman & Diu |
- |
- |
- |
- |
- |
- |
- |
- |
Lakshadweep |
- |
- |
- |
- |
- |
- |
- |
- |
Pondicherry |
- |
- |
- |
- |
- |
- |
- |
854 |
Dadra & Nagar Haveli |
- |
- |
- |
- |
- |
- |
- |
- |
All India |
23,915 |
28,166 |
1,17,628 |
99,599 |
8,219 |
7,558 |
31,516 |
33,387 |
| |
(0.2) |
(0.2) |
(0.9) |
(0.6) |
(0.1) |
(-) |
(0.3) |
(0.2) |
— : Nil or negligible.
Notes : 1. Figures in brackets indicate percentages to total.
2. Figures in this Statement are inclusive of non-guaranteed bonds and unsecured debentures.
3. Data on State Government Securities are exclusive of loans matured but still held by the banks. |
Statement 8 : State-Wise Classification of Scheduled Commercial Banks’ Investments in State Government Securities and State Level Bodies (As at end-March) (Concld.) |
(Amount in Rs. lakh) |
State / Union Territory |
Road Transport Corporations |
Other Government & Quasi Government Bodies |
Total |
2007 |
2008 |
2007 |
2008 |
2007 |
2008 |
1 |
18 |
19 |
20 |
21 |
22 |
23 |
Andhra Pradesh |
500 |
350 |
14,614 |
6,628 |
11,46,548 |
15,23,940 |
Arunachal Pradesh |
- |
- |
- |
- |
15,012 |
22,058 |
Assam |
- |
- |
- |
10 |
2,30,190 |
2,47,904 |
Bihar |
- |
- |
- |
10 |
4,99,641 |
532,121 |
Chhattisgarh |
- |
- |
- |
- |
1,03,900 |
1,02,168 |
Goa |
- |
- |
215 |
215 |
64,839 |
89,074 |
Gujarat |
2,006 |
1,631 |
18,292 |
10,867 |
7,14,998 |
11,76,497 |
Haryana |
- |
- |
10 |
1,001 |
2,92,232 |
264,869 |
Himachal Pradesh |
3,139 |
1,643 |
3,642 |
1,415 |
2,58,513 |
3,71,000 |
Jammu & Kashmir |
- |
- |
2,100 |
2,285 |
1,63,739 |
3,01,064 |
Jharkhand |
- |
- |
30 |
- |
1,46,811 |
1,48,483 |
Karnataka |
75 |
575 |
18,725 |
11,514 |
6,14,334 |
6,39,401 |
Kerala |
2,650 |
1,250 |
6,010 |
8,011 |
6,55,261 |
8,80,475 |
Madhya Pradesh |
- |
- |
565 |
1,211 |
6,38,236 |
6,00,899 |
Maharashtra |
3,750 |
3,250 |
48,060 |
19,155 |
10,89,210 |
16,28,160 |
Manipur |
- |
- |
- |
- |
30,347 |
29,542 |
Meghalaya |
- |
- |
- |
- |
42,595 |
43,848 |
Mizoram |
- |
- |
- |
- |
25,469 |
27,993 |
Nagaland |
- |
- |
- |
- |
55,390 |
57,098 |
Orissa |
- |
- |
5,615 |
10 |
4,07,391 |
3,29,521 |
Punjab |
- |
- |
146 |
99 |
5,22,053 |
8,21,143 |
Rajasthan |
- |
- |
4,019 |
4,982 |
8,01,961 |
9,88,534 |
Sikkim |
- |
- |
- |
- |
15,303 |
20,859 |
Tamil Nadu |
- |
- |
4,964 |
5,305 |
8,31,832 |
11,45,635 |
Tripura |
- |
- |
- |
4 |
42,171 |
37,725 |
Uttar Pradesh |
- |
- |
321 |
7 |
16,47,922 |
18,08,427 |
Uttaranchal |
- |
- |
- |
- |
2,08,916 |
2,71,156 |
West Bengal |
1,021 |
- |
19,677 |
9,473 |
11,46,821 |
16,73,615 |
Andaman & Nicobar Islands |
- |
- |
- |
- |
- |
- |
Chandigarh |
- |
- |
- |
1 |
167 |
1 |
Delhi |
- |
- |
2,108 |
943 |
2,292 |
1,021 |
Daman & Diu |
- |
- |
- |
- |
- |
- |
Lakshadweep |
- |
- |
- |
- |
- |
- |
Pondicherry |
- |
- |
- |
- |
11 |
34,554 |
Dadra & Nagar Haveli |
- |
- |
- |
- |
- |
11 |
All India |
13,141 |
8,699 |
1,49,113 |
83,146 |
1,24,14,105 |
1,58,18,796 |
| |
(0.1) |
(0.1) |
(1.2) |
(0.5) |
(100.0) |
(100.0) |
— : Nil or negligible.
Notes : 1. Figures in brackets indicate percentages to total.
2. Figures in this Statement are inclusive of non-guaranteed bonds and unsecured debentures.
3. Data on State Government Securities are exclusive of loans matured but still held by the banks. |
Statement 9: Scheduled Commercial Banks’ Investments in Interest-bearing State Government Securities Outstanding as on End-march |
(Amount in Rs. lakh) |
State |
2007 |
2008 |
Proportion of Banks’ Investments to Total Securities Outstanding |
Outstanding Securities |
Banks’ Investments |
Outstanding Securities |
Banks’ Investments |
2007 |
2008 |
1 |
2 |
3 |
4 |
5 |
6 |
7 |
Andhra Pradesh |
23,54,323 |
10,92,208 |
29,18,556 |
14,74,623 |
46.4 |
50.5 |
| |
(9.7) |
(9.4) |
(9.8) |
(9.7) |
|
|
Arunachal Pradesh |
42,389 |
14,903 |
59,826 |
21,949 |
35.2 |
36.7 |
| |
(0.2) |
(0.1) |
(0.2) |
(0.1) |
|
|
Assam |
6,52,474 |
2,11,956 |
7,15,501 |
2,29,798 |
32.5 |
32.1 |
| |
(2.7) |
(1.8) |
(2.4) |
(1.5) |
|
|
Bihar |
11,35,186 |
4,69,777 |
11,40,071 |
4,99,355 |
41.4 |
43 8 |
| |
(4.7) |
(4.0) |
(3.8) |
(3.3) |
|
|
Chhatisgarh |
1,83,737 |
99,262 |
1,83,738 |
97,368 |
54.0 |
53.0 |
| |
(0.8) |
(0.9) |
(0.6) |
(0.6) |
|
|
Goa |
1,10,767 |
64,609 |
1,47,701 |
87,706 |
58.3 |
59.4 |
| |
(0.5) |
(0.6) |
(0.5) |
(0.6) |
|
|
Gujarat |
12,72,161 |
6,41,885 |
19,02,135 |
11,27,689 |
50.5 |
59.3 |
| |
(5.2) |
(5.5) |
(6.4) |
(7.4) |
|
|
Haryana |
4,99,443 |
2,79,602 |
4,74,101 |
2,55,398 |
56.0 |
53.9 |
| |
(2.1) |
(2.4) |
(1.6) |
(1.7) |
|
|
Himachal Pradesh |
4,58,304 |
2,44,431 |
5,90,545 |
3,61,241 |
53.3 |
61.2 |
| |
(1.9) |
(2.1) |
(2.0) |
(2.4) |
|
|
Jammu & Kashmir |
3,53,763 |
1,52,578 |
5,64,529 |
2,88,819 |
43.1 |
51.2 |
| |
(1.5) |
(1.3) |
(1.9) |
(1.9) |
|
|
Jharkhand |
2,84,707 |
1,45,801 |
4,03,925 |
1,46,705 |
51.2 |
36.3 |
| |
(1.2) |
(1.3) |
(1.4) |
(1.0) |
|
|
Karnataka |
11,70,041 |
5,75,574 |
11,98,843 |
6,05,827 |
49.2 |
50.5 |
| |
(4.8) |
(4.9) |
(4.0) |
(4.0) |
|
|
Kerala |
12,84,712 |
6,20,728 |
16,48,093 |
8,58,476 |
48.3 |
52.1 |
| |
(5.3) |
(5.3) |
(5.5) |
(5.7) |
|
|
Madhya Pradesh |
12,07,664 |
5,59,719 |
13,25,685 |
5,40,068 |
46.3 |
40.7 |
| |
(5.0) |
(4.8) |
(4.4) |
(3.6) |
|
|
Note : Figures in brackets indicate percentages to total. |
Statement 9: Scheduled Commercial Banks’ Investments in Interest-bearing State Government Securities Outstanding as on End-march (Concld.) |
(Amount in Rs. lakh) |
State |
2007 |
2008 |
Proportion of Banks’ Investments to Total Securities Outstanding |
Outstanding Securities |
Banks’ Investments |
Outstanding Securities |
Banks’ Investments |
2007 |
2008 |
1 |
2 |
3 |
4 |
5 |
6 |
7 |
Maharashtra |
19,96,654 |
9,66,621 |
27,71,086 |
15,47,410 |
48.4 |
55.8 |
| |
(8.2) |
(8.3) |
(9.3) |
(10.2) |
|
|
Manipur |
86,790 |
30,312 |
1,07,795 |
29,086 |
34.9 |
27.0 |
| |
(0.4) |
(0.3) |
(0.4) |
(0.2) |
|
|
Meghalaya |
1,12,011 |
38,346 |
1,26,760 |
40,385 |
34.2 |
31.9 |
| |
(0.5) |
(0.3) |
(0.4) |
(0.3) |
|
|
Mizoram |
70,907 |
25,153 |
83,779 |
27,249 |
35.5 |
32.5 |
| |
(0.3) |
(0.2) |
(0.3) |
(0.2) |
|
|
Nagaland |
1,70,025 |
55,281 |
1,99,793 |
56,466 |
32.5 |
28.3 |
| |
(0.7) |
(0.5) |
(0.7) |
(0.4) |
|
|
Orissa |
9,29,281 |
3,92,459 |
8,02,409 |
3,19,629 |
42.2 |
39.8 |
| |
(3.8) |
(3.4) |
(2.7) |
(2.1) |
|
|
Punjab |
9,43,458 |
5,04,287 |
13,22,834 |
7,98,412 |
53.5 |
60.4 |
| |
(3.9) |
(4.3) |
(4.4) |
(5.3) |
|
|
Rajasthan |
16,07,034 |
7,57,311 |
19,30,335 |
9,49,173 |
47.1 |
49.2 |
| |
(6.6) |
(6.5) |
(6.5) |
(6.3) |
|
|
Sikkim |
51,742 |
15,103 |
74,168 |
20,222 |
29.2 |
27.3 |
| |
(0.2) |
(0.1) |
(0.2) |
(0.1) |
|
|
Tamil Nadu |
16,37,252 |
7,80,964 |
20,50,209 |
10,82,542 |
47.7 |
52.8 |
| |
(6.7) |
(6.7) |
(6.9) |
(7.1) |
|
|
Tripura |
1,15,934 |
42,136 |
1,11,386 |
37,522 |
36.3 |
33.7 |
| |
(0.5) |
(0.4) |
(0.4) |
(0.2) |
|
|
Uttar Pradesh |
31,23,546 |
15,84,815 |
4,61,971 |
17,64,063 |
50.7 |
381.9 |
| |
(12.8) |
(13.6) |
(1.5) |
(11.6) |
|
|
Uttaranchal |
3,78,970 |
2,08,344 |
33,77,106 |
2,69,279 |
55.0 |
8.0 |
| |
(1.6) |
(1.8) |
(11.3) |
(1.8) |
|
|
West Bengal |
20,83,892 |
10,88,379 |
31,57,905 |
16,10,935 |
52.2 |
51.0 |
| |
(8.6) |
(9.3) |
(10.6) |
(10.6) |
|
|
Puducherry |
— |
— |
33,700 |
33,700 |
— |
100.0 |
| |
|
|
(0.1) |
(0.2) |
|
|
All India |
2,43,17,167 |
1,16,62,544 |
2,98,84,494 |
1,51,81,095 |
48.0 |
50.8 |
| |
(100.0) |
(100.0) |
(100.0) |
(100.0) |
|
|
Note : Figures in brackets indicate percentages to total. |
Statement 10: Bank Group-Wise and State-Wise Classification of Scheduled Commercial Banks’ Investments in State Government Securities and State-level Bodies (As at End-march) |
(Amount in Rs. lakh) |
State/ Union Territory |
Bank Group |
All Scheduled Commercial Banks |
State Bank of India and its Associates |
Nationalised Banks |
Other Scheduled Commercial Banks |
Foreign Banks |
2007 |
2008 |
2007 |
2008 |
2007 |
2008 |
2007 |
2008 |
2007 |
2008 |
1 |
2 |
3 |
4 |
5 |
6 |
7 |
8 |
9 |
10 |
11 |
Andhra Pradesh |
2,96,530 |
3,09,393 |
7,59,895 |
10,48,722 |
82,478 |
1,65,825 |
7,645 |
— |
11,46,548 |
15,23,940 |
| |
(25.9) |
(20.3) |
(66.3) |
(68.8) |
(7.2) |
(10.9) |
(0.7) |
|
(100.0) |
(100.0) |
Arunachal Pradesh |
7,664 |
11,101 |
7,151 |
10,759 |
197 |
198 |
— |
— |
15,012 |
22,058 |
| |
(51.1) |
(50.3) |
(47.6) |
(48.8) |
(1.3) |
(0.9) |
|
|
(100.0) |
(100.0) |
Assam |
96,667 |
1,17,314 |
1,29,738 |
1,27,795 |
2,785 |
2,795 |
1,000 |
— |
2,30,190 |
2,47,904 |
| |
(42.0) |
(47.3) |
(56.4) |
(51.6) |
(1.2) |
(1.1) |
(0.4) |
|
(100.0) |
(100.0) |
Bihar |
1,97,831 |
2,41,213 |
2,99,190 |
2,87,718 |
2,620 |
3,190 |
— |
— |
4,99,641 |
5,32,121 |
| |
(39.6) |
(45.3) |
(59.9) |
(54.1) |
(0.5) |
(0.6) |
|
|
(100.0) |
(100.0) |
Chhattisgarh |
32,065 |
31,238 |
71,335 |
70,430 |
500 |
500 |
— |
— |
1,03,900 |
1,02,168 |
| |
(30.9) |
(30.6) |
(68.7) |
(68.9) |
(0.5) |
(0.5) |
|
|
(100.0) |
(100.0) |
Goa |
12,668 |
11,802 |
51,206 |
76,532 |
965 |
740 |
— |
— |
64,839 |
89,074 |
| |
(19.5) |
(13.2) |
(79.0) |
(85.9) |
(1.5) |
(0.8) |
|
|
(100.0) |
(100.0) |
Gujarat |
2,39,622 |
4,59,422 |
4,51,979 |
6,72,380 |
23,397 |
44,695 |
— |
— |
7,14,998 |
11,76,497 |
| |
(33.5) |
(39.0) |
(63.2) |
(57.2) |
(3.3) |
(3.8) |
|
|
(100.0) |
(100.0) |
Haryana |
91,005 |
75,645 |
1,94,206 |
1,81,337 |
7,021 |
7,887 |
— |
— |
2,92,232 |
2,64,869 |
| |
(31.1) |
(28.6) |
(66.5) |
(68.5) |
(2.4) |
(3.0) |
|
|
(100.0) |
(100.0) |
Himachal Pradesh |
67,738 |
1,00,522 |
1,82,784 |
2,65,293 |
7,991 |
5,185 |
— |
— |
2,58,513 |
3,71,000 |
| |
(26.2) |
(27.1) |
(70.7) |
(71.5) |
(3.1) |
(1.4) |
|
|
(100.0) |
(100.0) |
Jammu & Kashmir |
49,534 |
55,881 |
90,300 |
2,24,870 |
23,905 |
20,313 |
— |
— |
1,63,739 |
3,01,064 |
| |
(30.3) |
(18.6) |
(55.1) |
(74.7) |
(14.6) |
(6.7) |
|
|
(100.0) |
(100.0) |
Jharkhand |
42,784 |
40,896 |
1,03,036 |
1,06,597 |
991 |
990 |
— |
— |
1,46,811 |
1,48,483 |
| |
(29.1) |
(27.5) |
(70.2) |
(71.8) |
(0.7) |
(0.7) |
|
|
(100.0) |
(100.0) |
Karnataka |
1,51,186 |
1,36,638 |
4,16,776 |
4,47,084 |
46,372 |
55,609 |
— |
70 |
6,14,334 |
6,39,401 |
| |
(24.6) |
(21.4) |
(67.8) |
(69.9) |
(7.5) |
(8.7) |
|
(-) |
(100.0) |
(100.0) |
Kerala |
1,62,064 |
1,85,367 |
4,43,418 |
6,37,728 |
49,779 |
57,380 |
— |
— |
6,55,261 |
8,80,475 |
| |
(24.7) |
(21.1) |
(67.7) |
(72.4) |
(7.6) |
(6.5) |
|
|
(100.0) |
(100.0) |
Madhya Pradesh |
1,61,622 |
1,53,081 |
4,52,343 |
4,24,996 |
24,271 |
22,822 |
— |
— |
6,38,236 |
6,00,899 |
| |
(25.3) |
(25.5) |
(70.9) |
(70.7) |
(3.8) |
(3.8) |
|
|
(100.0) |
(100.0) |
Maharashtra |
4,17,956 |
8,61,668 |
6,20,585 |
7,14,286 |
50,406 |
52,104 |
263 |
102 |
10,89,210 |
16,28,160 |
| |
(38.4) |
(52.9) |
(57.0) |
(43.9) |
(4.6) |
(3.2) |
(-) |
(-) |
(100.0) |
(100.0) |
Manipur |
17,806 |
15,988 |
12,540 |
13,553 |
1 |
1 |
— |
— |
30,347 |
29,542 |
| |
(58.7) |
(54.1) |
(41.3) |
(45.9) |
(-) |
(-) |
|
|
(100.0) |
(100.0) |
Meghalaya |
16,457 |
16,745 |
26,138 |
27,068 |
— |
35 |
— |
— |
42,595 |
43,848 |
| |
(38.6) |
(38.2) |
(61.4) |
(61.7) |
|
(0.1) |
|
|
(100.0) |
(100.0) |
Mizoram |
14,349 |
15,667 |
10,788 |
11,994 |
332 |
332 |
— |
— |
25,469 |
27,993 |
| |
(56.3) |
(56.0) |
(42.4) |
(42.8) |
(1.3) |
(1.2) |
|
|
(100.0) |
(100.0) |
Statement 10: Bank Group-Wise and State-Wise Classification of Scheduled Commercial Banks’ Investments in State Government Securities and State-level Bodies (As at End-march) (Concld.) |
(Amount in Rs. lakh) |
State/ Union Territory |
Bank Group |
All Scheduled |
State Bank of India and its Associates |
Nationalised Banks |
Other Scheduled Commercial Banks |
Foreign Banks |
Commercial Banks |
2007 |
2008 |
2007 |
2008 |
2007 |
2008 |
2007 |
2008 |
2007 |
2008 |
1 |
2 |
3 |
4 |
5 |
6 |
7 |
8 |
9 |
10 |
11 |
Nagaland |
30,018 |
31,926 |
23,196 |
24,670 |
2,176 |
502 |
— |
— |
55,390 |
57,098 |
| |
(54.2) |
(55.9) |
(41.9) |
(43.2) |
(3.9) |
(0.9) |
|
|
(100.0) |
(100.0) |
Orissa |
1,32,963 |
1,03,544 |
2,61,297 |
2,12,392 |
13,101 |
13,585 |
30 |
— |
4,07,391 |
3,29,521 |
| |
(32.6) |
(31.4) |
(64.1) |
(64.5) |
(3.2) |
(4.1) |
(-) |
|
(100.0) |
(100.0) |
Punjab |
1,44,376 |
2,85,218 |
3,58,572 |
5,16,689 |
19,105 |
19,236 |
— |
— |
5,22,053 |
8,21,143 |
| |
(27.7) |
(34.7) |
(68.7) |
(62.9) |
(3.7) |
(2.3) |
|
|
(100.0) |
(100.0) |
Rajasthan |
2,44,055 |
3,59,365 |
5,24,387 |
5,90,864 |
33,519 |
38,305 |
— |
— |
8,01,961 |
9,88,534 |
| |
(30.4) |
(36.4) |
(65.4) |
(59.8) |
(4.2) |
(3.9) |
|
|
(100.0) |
(100.0) |
Sikkim |
7,852 |
11,332 |
7,234 |
9,310 |
217 |
217 |
— |
— |
15,303 |
20,859 |
| |
(51.3) |
(54.3) |
(47.3) |
(44.6) |
(1.4) |
(1.0) |
|
|
(100.0) |
(100.0) |
Tamil Nadu |
1,87,617 |
3,05,625 |
5,66,838 |
7,39,005 |
77,377 |
1,01,005 |
— |
— |
8,31,832 |
11,45,635 |
| |
(22.6) |
(26.7) |
(68.1) |
(64.5) |
(9.3) |
(8.8) |
|
|
(100.0) |
(100.0) |
Tripura |
21,346 |
18,191 |
20,324 |
19,033 |
501 |
501 |
— |
— |
42,171 |
37,725 |
| |
(50.6) |
(48.2) |
(48.2) |
(50.5) |
(1.2) |
(1.3) |
|
|
(100.0) |
(100.0) |
Uttar Pradesh |
5,66,869 |
7,39,205 |
10,54,909 |
10,35,121 |
26,044 |
34,101 |
100 |
— |
16,47,922 |
18,08,427 |
| |
(34.4) |
(40.9) |
(64.0) |
(57.2) |
(1.6) |
(1.9) |
(-) |
|
(100.0) |
(100.0) |
Uttaranchal |
1,07,122 |
1,41,158 |
1,00,181 |
1,27,542 |
1,613 |
2,456 |
- |
— |
2,08,916 |
2,71,156 |
| |
(51.3) |
(52.1) |
(48.0) |
(47.0) |
(0.8) |
(0.9) |
|
|
(100.0) |
(100.0) |
West Bengal |
4,62,546 |
7,35,289 |
6,52,711 |
8,77,132 |
31,464 |
61,162 |
100 |
32 |
11,46,821 |
16,73,615 |
| |
(40.3) |
(43.9) |
(56.9) |
(52.4) |
(2.7) |
(3.7) |
(-) |
(-) |
(100.0) |
(100.0) |
Andaman & Nicobar |
— |
— |
— |
— |
— |
— |
— |
— |
— |
— |
Islands |
|
|
|
|
|
|
|
|
|
|
Chandigarh |
167 |
— |
— |
1 |
— |
— |
— |
— |
167 |
1 |
| |
(100.0) |
|
|
(100.0) |
|
|
|
|
(100.00) |
(100.0) |
Delhi |
60 |
— |
2,232 |
1,021 |
— |
— |
— |
— |
2292 |
1,021 |
| |
(2.6) |
|
(97.4) |
(100.0) |
|
|
|
|
(100.0) |
(100.0) |
Daman & Diu |
— |
— |
— |
— |
— |
— |
— |
— |
— |
— |
Lakshadweep |
— |
— |
— |
— |
— |
— |
— |
— |
— |
— |
Pondicherry |
— |
15,000 |
11 |
19,554 |
— |
— |
— |
— |
11 |
34,554 |
| |
|
(43.4) |
(100.0) |
(56.6) |
|
|
|
|
(100.0) |
(100.0) |
Dadra & Nagar Haveli |
— |
— |
— |
11 |
— |
— |
— |
— |
— |
11 |
| |
|
|
|
(100.0) |
|
|
|
|
|
(100.0) |
All India |
39,80,539 |
55,85,434 |
78,95,300 |
95,21,487 |
5,29,128 |
7,11,671 |
9,138 |
204 |
1,24,14,105 |
1,58,18,796 |
| |
(32.1) |
(35.3) |
(63.6) |
(60.2) |
(4.3) |
(4.5) |
(0.1) |
(0.0) |
(100.0) |
(100.0) |
* Prepared in the Banking Statistics Division of the Department of Statistics and Information Management. The previous article as at end-March 2007 was published in October 2008 issue of the Reserve Bank of India Bulletin. 1 As per the reported figures of investments of RRBs in Form ‘A’ return under Section 42 (2) of RBI Act, 1934 as on last reporting Friday of March 2008. |