| I. Introduction
The invisibles account in India’s Balance of Payments (BoP) reflects the ongoing structural transformation within the economy as well as its increasing integration with the world economy. The emphasis on reforms and liberalization since the early 1990s has not only unfolded newer opportunities for businesses but also for skilled labour as reflected in the direction of India’s trade in goods and services and nature of labour migration. This transformation is reflected in the growth of receipts under invisibles comprising international trade in services, income from financial assets, labour and property and cross border transfers mainly workers’ remittances, which has kept pace with merchandise exports growth as the principal foreign exchange earners for the country. Apart from these domestic factors, an extended period of high growth and low inflation globally also contributed to the significant growth in India’s invisibles, particularly since the beginning of the current decade. These developments have been reflected in India’s Balance of Payments. Specifically, the current account of BoP has been characterised by two elements: persistence of higher trade deficit on account of strong economic growth and buoyant invisibles surplus, which have provided major support to the current account position on a sustained basis. Given the importance of invisibles, the developments in these areas are published in two stages viz., (i) standard presentation with broad heads on a quarterly basis to meet the IMF’s Special Data Dissemination Standards (SDDS) in the Reserve Bank of India’s website and subsequently in the |
| |
* Prepared in the Division of International Finance, Department of Economic Analysis and Policy, Reserve Bank of India, |
| |
monthly Bulletin of the Reserve Bank of India (RBI), and (ii) detailed presentation with break-up of broad heads in an annual article titled ‘Invisibles in India’s Balance of Payments’ in the RBI’s monthly Bulletin1. The details of compilation, dissemination and definitional aspects are set out in the Annex I and II.
This article seeks to further contribute to the endeavour of providing the disaggregated information on India’s trade in invisibles for the period 2006-07 (revised) and 2007-08 (partially revised) along with the time series data since 1999-2000. The article is organised as follows. Section II presents the magnitude and trends in the invisibles account at the aggregate level along with their relative importance in terms of GDP. An analysis of the various components of invisibles and their dynamics is presented in Section III. This section also provides an international perspective to the invisibles account drawing from cross country experiences. Concluding observations and a short-term outlook against the backdrop of the ongoing global financial crisis are set out in Section IV. A detailed enumeration of concepts and definitions of different heads of invisible accounts are presented in the Annex. |
| |
| II. Magnitude and Trends in Invisibles |
| |
The resurgence of invisible surplus in the 1990s, after a hiatus in the late 1980s, has significantly minimised the risk to the external payments position. Not only in absolute terms but also as a per cent to GDP, India’s invisible balances have witnessed steady increases, particularly since 2002-03 (Table 1 and Chart 1). This, |
| |
Table 1: Trends in Net Invisibles : Major Components |
(US $ million) |
Item |
1990-91 |
1995-96 |
1999-00 |
2000-01 |
2001-02 |
2002-03 |
2003-04 |
2004-05 |
2005-06 |
2006-07 |
2007-
08 |
1 |
2 |
3 |
4 |
5 |
6 |
7 |
8 |
9 |
10 |
11 |
12 |
1. Travel |
1,064 |
1,544 |
897 |
693 |
123 |
-29 |
1,435 |
1,417 |
1,215 |
2,439 |
2,095 |
2. Transportation |
-110 |
-158 |
-703 |
-1,512 |
-1,306 |
-736 |
879 |
144 |
-2,012 |
-94 |
-1,500 |
3. Insurance |
23 |
36 |
109 |
47 |
8 |
19 |
56 |
148 |
-54 |
553 |
595 |
4. Govt. not included elsewhere |
-158 |
-205 |
312 |
332 |
235 |
65 |
28 |
-10 |
-215 |
-150 |
-46 |
5. Transfers |
2,530 |
8,852 |
12,638 |
13,106 |
15,856 |
16,838 |
22,162 |
20,785 |
24,687 |
30,079 |
41,944 |
6. Income |
-3,752 |
-3,205 |
-3,559 |
-5,004 |
-4,206 |
-3,446 |
-4,505 |
-4,979 |
-5,855 |
-7,331 |
-4,917 |
Investment income |
— |
— |
-3,695 |
-4,664 |
-3,844 |
-2,965 |
-3,757 |
-4,095 |
-5,262 |
-6,762 |
-4,281 |
Compensation of Employees |
— |
— |
136 |
-340 |
-362 |
-481 |
-748 |
-884 |
-593 |
-569 |
-636 |
7. Miscellaneous |
161 |
-1,417 |
3,449 |
2,132 |
4,264 |
4,324 |
7,746 |
13,727 |
24,236 |
26,721 |
36,421 |
Total (1 to 7) |
-242 |
5,447 |
13,143 |
9,794 |
14,974 |
17,035 |
27,801 |
31,232 |
42,002 |
52,217 |
74,592 |
|
| |
1 Previous issue of the article was published in RBI Bulletin, February 2008 covering the data 1999-2000 to 2006-07. Such data for the period 1999-2000 to 2005-06 were earlier published in the November 2006 issue of RBI Bulletin, for the period 1997-98 to 1999-2000 in the January 2001 issue of RBI Bulletin and for the period 1989-90 to 1996-97 in the April 1999 issue of the RBI Bulletin. The data for the period 1956-57 to 1989-90 were published in July 1993 in the “Monograph on India’s Balance of Payments”. |
| |
in turn, has been restraining the current account deficit within a narrow corridor, with the surplus in intermittent years, despite the widening trade deficit. This improvement together with significant capital inflows since the beginning of the current decade facilitated further easing of payment restrictions on current and capital account transactions both for individuals and corporates. |
| |
| Another key feature of India’s invisibles account has been the significant rise in gross receipts and payments, particularly since 2002-03. The growth in invisible receipts has been steady, while the growth in invisibles payments has varied from year to year (Table 2). The strong growth in services exports, especially of software and Information Technology (IT) services, and remittances from overseas |
| |
|
|
Table 2: Trends in India’s Invisibles Receipts and Payments |
Year |
Invisibles Receipts |
Invisibles Payments |
Invisibles Net |
Amount
(US $ million) |
Growth (%) |
Amount
(US $ million) |
Growth (%) |
Amount
(US $ million) |
Growth (%) |
1 |
2 |
3 |
4 |
5 |
6 |
7 |
1990-91 |
7,464 |
-0.5 |
7,706 |
12.0 |
-242 |
— |
1995-96 |
17,664 |
13.6 |
12,217 |
23.7 |
5,447 |
— |
1999-00 |
30,312 |
17.6 |
17,169 |
3.7 |
13,143 |
— |
2000-01 |
32,267 |
6.4 |
22,473 |
30.9 |
9,794 |
-25.5 |
2001-02 |
36,737 |
13.9 |
21,763 |
-3.2 |
14,974 |
52.9 |
2002-03 |
41,925 |
14.1 |
24,890 |
14.4 |
17,035 |
13.8 |
2003-04 |
53,508 |
27.6 |
25,707 |
3.3 |
27,801 |
63.2 |
2004-05 |
69,533 |
29.9 |
38,301 |
49.0 |
31,232 |
12.3 |
2005-06 |
89,687 |
29.0 |
47,685 |
24.5 |
42,002 |
34.5 |
2006-07 |
114,558 |
27.7 |
62,341 |
30.7 |
52,217 |
24.3 |
2007-08 |
148,604 |
29.7 |
74,012 |
18.7 |
74,592 |
42.9 |
|
| |
Indians have imparted stability to invisibles receipts. On the other hand, the growth in invisibles payments has been mainly led by interest payments relating to external debt, dividends/profits paid on foreign investment and payments relating to technology related and business services with a growing demand for such services. During 2007-08, while growth in invisibles receipts remained steady, growth in invisibles payments decelerated. As a result, the growth in net invisibles was higher than in the previous year.
The invisibles receipts and payments during 2007-08 constituted a major portion of the current account receipts and payments, respectively. During the period 2000-01 to 2007-08, the invisibles receipts constituted around 45 per cent of current account receipts, while invisibles payments accounted for around 25 per cent of current account payments (Table 3). The lower order of payments vis-à-vis receipts in the invisibles account contributed to the build up of significant surplus, which has witnessed an average growth of almost 35 per cent during 2001-02 to 2007-08 and financed fully the trade deficit over the same period. |
| |
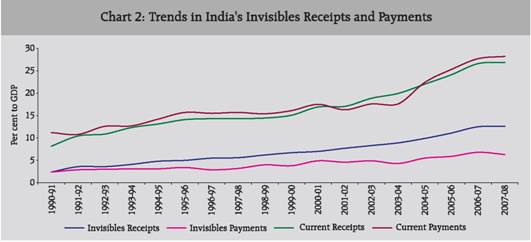
Not only in absolute terms but also as a per cent of GDP, net invisibles (invisibles receipts minus payments) have witnessed significant improvement. The net invisibles surplus expanded from 2.1 per cent of GDP in 2000-01 to 6.3 per cent of GDP in 2007-08 on the back of sharp expansion in gross invisible receipts which rose from 7.0 per cent of GDP in 2000-01 to 12.6 per cent of GDP in 2007-08. As a result, current receipts as a ratio of GDP have witnessed significant improvement from 16.9 per cent in 2000-01 to 26.8 per cent in 2007-08 (Chart 2).
At a disaggregated level, the major contributor to invisibles receipts in India has been services exports followed by transfers and income (Table 4). Services exports accounted for about 60 per cent of the total invisible receipts in 2007-08. Traditionally, while services relating to |
| |
|
|
Table 3: Selected Indicators on Invisibles Including Financing Trade Deficit |
(Per cent) |
Year |
Net Invisibles/ Trade Deficit |
Invisibles Receipts/ Current Receipts |
Invisibles Payments/ Current Payments |
1 |
2 |
3 |
4 |
1990-91 |
-2.6 |
28.8 |
21.6 |
1995-96 |
48.0 |
35.3 |
21.9 |
1999-00 |
73.7 |
44.7 |
23.7 |
2000-01 |
78.6 |
41.5 |
28.0 |
2001-02 |
129.4 |
45.1 |
27.9 |
2002-03 |
159.4 |
43.8 |
27.9 |
2003-04 |
202.7 |
44.7 |
24.3 |
2004-05 |
92.7 |
44.9 |
24.4 |
2005-06 |
80.9 |
46.0 |
23.3 |
2006-07 |
84.5 |
47.1 |
24.6 |
2007-08 |
81.4 |
47.2 |
22.3 |
|
| |
 |
| |
goods trade, such as transportation and financing of trade were the major constituents, the rapid developments in telecommunications and information technology has facilitated the emergence of business and computer services related to trade in investments as the main drivers. Thus, the focus of services trade has shifted from facilitating trade in goods to trade in services as an independent entity in itself with the four modes of supply (cross-border supply, consumption abroad, commercial presence and presence of a natural person) for the delivery of services in cross-border trade opening up new opportunities. Reflecting on these factors, the importance of services exports in India has grown significantly, with the services-GDP ratio rising from 1.4 per cent in 1990-91 to 7.7 per cent in 2007-08 driven by software services, which have grown in terms of both size and destination. Reflecting this, India has emerged as a major software exporting country with a level of US $ 40.3 billion in 2007-08, expanding at an average rate of around 34 per cent in the past eight years |
| |
|
|
| Table 4: Major Components of Invisibles Account in Terms of GDP |
| (Per cent to GDP) |
Year |
Receipts |
Payments |
Net |
Services |
Transfers |
Income |
Total |
Services |
Transfers |
Income |
Total |
Services |
Transfers |
Income |
Total |
1 |
2 |
3 |
4 |
5 |
6 |
7 |
8 |
9 |
10 |
11 |
12 |
13 |
1990-91 |
1.4 |
0.8 |
0.1 |
2.3 |
1.1 |
0.0 |
1.3 |
2.4 |
0.3 |
0.8 |
-1.2 |
-0.1 |
1995-96 |
2.1 |
2.5 |
0.4 |
5.0 |
2.1 |
0.0 |
1.3 |
3.4 |
0.0 |
2.5 |
-0.9 |
1.5 |
1999-00 |
3.5 |
2.8 |
0.4 |
6.7 |
2.6 |
0.0 |
1.2 |
3.8 |
0.9 |
2.8 |
-0.8 |
2.9 |
2000-01 |
3.5 |
2.9 |
0.6 |
7.0 |
3.2 |
0.0 |
1.7 |
4.9 |
0.3 |
2.9 |
-1.1 |
2.1 |
2001-02 |
3.6 |
3.4 |
0.7 |
7.7 |
2.9 |
0.1 |
1.6 |
4.6 |
0.7 |
3.3 |
-0.9 |
3.1 |
2002-03 |
4.1 |
3.5 |
0.7 |
8.3 |
3.4 |
0.2 |
1.4 |
5.0 |
0.7 |
3.3 |
-0.7 |
3.4 |
2003-04 |
4.5 |
3.8 |
0.6 |
8.9 |
2.8 |
0.1 |
1.4 |
4.3 |
1.7 |
3.7 |
-0.8 |
4.6 |
2004-05 |
6.2 |
3.1 |
0.7 |
9.9 |
4.0 |
0.1 |
1.4 |
5.5 |
2.2 |
3.0 |
-0.7 |
4.4 |
2005-06 |
7.1 |
3.2 |
0.8 |
11.1 |
4.3 |
0.1 |
1.5 |
5.9 |
2.9 |
3.1 |
-0.7 |
5.2 |
2006-07 |
8.1 |
3.4 |
1.0 |
12.5 |
4.8 |
0.2 |
1.8 |
6.8 |
3.2 |
3.3 |
-0.8 |
5.7 |
2007-08 |
7.7 |
3.8 |
1.2 |
12.6 |
4.5 |
0.2 |
1.6 |
6.3 |
3.2 |
3.6 |
-0.4 |
6.3 |
|
| |
despite a global IT slowdown. With the continued buoyancy in software exports, they constituted about 44 per cent of total services exports, on an average, during 2000-01 to 2007-08. Apart from software, business services have also grown significantly, reflecting the emergence of India as a preferred investment destination following a greater integration of the domestic economy with the rest of the world and strong macroeconomic fundamentals.
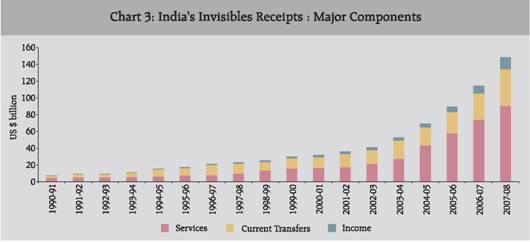
Within invisibles, transfer receipts have hovered around 3 per cent of GDP reflecting a steady increase in inward remittances for family maintenance and higher local withdrawals on the back of better investment opportunities. With private transfers at US $ 43.5 billion in 2007-08, India continued to retain its position among the leading remittance receiving countries in the world with relative stability in such inflows. The sustained expansion in remittances since the 1990s was underpinned by structural reforms, including a market-based exchange rate, current account convertibility as well as shifts in the labour migration pattern to increasingly high skilled categories. Receipts under the income account have also increased substantially since 2003-04, reflecting mainly higher earnings on deployment of foreign currency assets. The reinvested earnings by FDI companies invested abroad have also contributed partly to the higher investment income (Chart 3).
In line with the increase in invisibles receipts, invisibles payments have also increased in recent years mainly due to services related payments, which increased from 3.2 per cent of GDP in 2000-01 to 4.5 per cent of GDP in 2007-08. The services payments have been driven by payments under business, transportation and travel reflecting increased business activities and strong growth in imports. On the other hand, payments under the income account have been broadly stable, moving in a narrow range of 1.4 - 1.8 per cent of GDP over the same period. Thus, higher receipts coupled with lower payments have resulted in a significant improvement in net invisibles, which has increased from 2.1 per cent of GDP in 2000-01 to 6.3 per cent of GDP by 2007-08. |
| |
 |
| |
| |
Latest Developments |
| |
The trend observed in invisibles receipts and payments in the past few years continued during April-September 2008 notwithstanding early signs of some slowdown in the advanced economies following the financial crisis (Table 5). Growth in receipts was higher at 29.8 per cent (28.3 per cent during April-September 2007) despite growth in software, business services and investment income witnessing some slowdown. However, the declining trend in the growth of invisibles payments strengthening further in April-September 2008 on account of the moderation in business and professional services payments that resulted in a higher growth in net invisibles by 45.3 per cent (41.6 per cent growth during April-September 2007). Notwithstanding the better position on the invisibles account during April-September 2008, the global financial and economic crisis is likely to have implications for both invisibles receipts and payments in the coming quarters.
A detailed component-wise analysis of invisibles receipts and payments is discussed below for a better understanding of the dynamics of India’s invisibles account, especially from a cross-country perspective. |
| |
|
|
| Table 5: Invisible Gross Receipts and Payments: Recent Trend |
| (US $ million) |
Items |
Invisible Receipts |
Invisible Payments |
2006-07 |
2007-08 |
2007-08 |
2008-09 |
2006-07 |
2007-08 |
2007-08 |
2008-09 |
April-March (R) |
April-March (PR) |
April-Sept (PR) |
April-Sept (P) |
April-March (R) |
April-March (PR) |
April-Sept (PR) |
April-Sept (P) |
1 |
2 |
3 |
4 |
5 |
6 |
7 |
8 |
9 |
A. Services |
73,780 |
90,077 |
39,477 |
47,946 |
44,311 |
52,512 |
21,505 |
25,070 |
1. Travel |
9,123 |
11,349 |
4,336 |
5,290 |
6,684 |
9,254 |
3,953 |
4,833 |
2. Transportation |
7,974 |
10,014 |
4,044 |
5,571 |
8,068 |
11,514 |
5,085 |
7,072 |
3. Insurance |
1,195 |
1,639 |
714 |
720 |
642 |
1,044 |
469 |
534 |
4. Government not included elsewhere |
253 |
330 |
162 |
211 |
403 |
376 |
238 |
205 |
5. Miscellaneous |
55,235 |
66,745 |
30,221 |
36,154 |
28,514 |
30,324 |
11,760 |
12,426 |
of Which: |
|
|
|
|
|
|
|
|
Software |
31,300 |
40,300 |
17,886 |
21,876 |
2,267 |
3,058 |
1,480 |
1,781 |
B. Transfers |
31,470 |
44,259 |
18,336 |
27,246 |
1,391 |
2,315 |
840 |
1,503 |
C. Income |
9,308 |
14,268 |
6,080 |
7,718 |
16,639 |
19,185 |
9,298 |
9,488 |
1. Investment Income |
8,926 |
13,808 |
5,887 |
7,273 |
15,688 |
18,089 |
8,802 |
8,841 |
2. Compensation of Employees |
382 |
460 |
193 |
445 |
951 |
1,096 |
496 |
647 |
Total (A+B+C) |
114,558 |
148,604 |
63,893 |
82,910 |
62,341 |
74,012 |
31,643 |
36,061 |
R : Revised. PR : Partially Revised. P : Preliminary. |
|
| |
III. Composition of Invisibles
Invisibles receipts have been mainly dominated by software services, business services and private transfers. Invisibles payments were mainly led by interest payments relating to external debt, dividends/profits paid on foreign investment and payments relating to technology related and business services with a growing demand for such services. While both receipts and payments have been large in case of travel, transportation, business services and investment income accounts, the flows are unidirectional towards India in case of software services and private transfers. The details of trade in services, private transfers and incomes are set out below. |
| |
III.1 Trade in Services
The trade in services comprises of commercial services categorised under transportation, travel and other commercial services, and Government services, Not Included Elsewhere (GNIE). Other commercial services comprise of communication, construction, insurance, royalties and licence fees, other business services, personal, cultural, and recreational services and computer and information services.
An important feature of services exports of India has been a structural shift since 2003-04, driven by the emergence of new avenues of services exports attributed to a rapid expansion in international trade and investment facilitated by an increased liberalization and the use of technology. According to the latest data published by the International Monetary Fund (IMF), India’s share in world exports of services has almost doubled between 2003 and 2007 to reach 2.6 per cent (Table 6). |
| |
|
|
Table 6: Trade in Services Exports of India |
Year |
Exports
(US $ billion) |
Share in World Exports (%) |
1 |
2 |
3 |
2001 |
17.3 |
1.1 |
2002 |
19.5 |
1.2 |
2003 |
23.9 |
1.3 |
2004 |
38.3 |
1.7 |
2005 |
55.8 |
2.2 |
2006 |
75.4 |
2.6 |
2007 |
87.0 |
2.6 |
Source: Balance of Payments Statistics Year Book 2008, IMF. |
|
| |
Reflecting the positive developments in terms of the comparative advantage and the continued buoyancy of India’s services exports, India was ranked at 11th position in terms of its market share in the World services exports during 2007 (Table 7).
At a disaggregated level, the trade in services has been dominated mainly by software services and non-software miscellaneous services, which includes business and professional services (Table 8). |
| |
|
|
Table 7: Comparative Position of India among Top Service Exporters, 2007 |
Sr. No. |
Country |
Exports
(US$ billion) |
Share (%) |
1 |
2 |
3 |
4 |
1. |
USA |
493.2 |
14.6 |
2. |
UK |
278.7 |
8.2 |
3. |
Germany |
215.0 |
6.3 |
4. |
France |
145.7 |
4.3 |
5. |
Spain |
129.3 |
3.8 |
6. |
Japan |
129.1 |
3.8 |
7. |
China |
122.2 |
3.6 |
8. |
Italy |
112.0 |
3.3 |
9. |
Netherlands |
90.6 |
2.7 |
10. |
Ireland |
89.0 |
2.6 |
11. |
India |
87.0 |
2.6 |
12. |
Hong Kong |
83.6 |
2.5 |
13. |
Belgium |
79.1 |
2.3 |
Source: Balance of Payments Statistics Year Book 2008, IMF. |
|
| |
|
|
| Table 8: Composition of India’s Services Exports |
| (Per cent) |
Year |
Travel |
Transpor
tation |
Insurance |
G.n.i.e |
Software Services |
Non-software
Miscellaneous
Services* |
Total Services |
1 |
2 |
3 |
4 |
5 |
6 |
7 |
8 |
1990-91 |
32.0 |
21.6 |
2.4 |
0.3 |
— |
43.6 |
100.0 |
1995-96 |
36.9 |
27.4 |
2.4 |
0.2 |
— |
33.1 |
100.0 |
2000-01 |
21.5 |
12.6 |
1.7 |
4.0 |
39.0 |
21.3 |
100.0 |
2001-02 |
18.3 |
12.6 |
1.7 |
3.0 |
44.1 |
20.3 |
100.0 |
2002-03 |
16.0 |
12.2 |
1.8 |
1.4 |
46.2 |
22.4 |
100.0 |
2003-04 |
18.7 |
11.9 |
1.6 |
0.9 |
47.6 |
19.2 |
100.0 |
2004-05 |
15.4 |
10.8 |
2.0 |
0.9 |
40.9 |
29.9 |
100.0 |
2005-06 |
13.6 |
11.0 |
1.8 |
0.5 |
40.9 |
32.1 |
100.0 |
2006-07 (R) |
12.4 |
10.8 |
1.6 |
0.3 |
42.4 |
32.4 |
100.0 |
2007-08 (PR) |
12.6 |
11.1 |
1.8 |
0.4 |
44.7 |
29.4 |
100.0 |
G.n.i.e: Government not included elsewhere.
* : Include business and professional services.
R : Revised. PR : Partially Revised. |
|
| |
Software services continued to be buoyant, with its share in total services exports increasing to 44.7 per cent in 2007-08 from 42.4 percent in 2006-07. Within the services exports, the rising prominence of business services reflects the high skill intensity of the Indian work force. The shares of travel and transport in total services export, after generally declining up to 2006-07, showed a marginal improvement in 2007-08. There has been a revival in international tourist interest in India in recent years. |
| |
III.1.1 Software Services |
| |
Exports of software and IT-enabled services increased to US $ 40.3 billion in 2007-08 as compared to US $ 31.3 billion during 2006-07 (Table 9). The Indian IT-BPO industry is a major contributor to the economy and has a multiplier effect in terms of export earnings, investment, employment and overall economic and social development. Notwithstanding increasing competitive pressures, India remains an attractive source due to its low cost of operations, high quality of product and services and readily available skilled manpower. Furthermore, a favourable time zone difference with North America and Europe helps Indian companies achieve round the clock international operations and customer service. According to National Association of Software and Service Companies (NASSCOM), while the US (61 per cent) and the UK (18 per cent) remained the largest market for IT-BPO export in 2006-07, the industry has also been steadily expanding to other regions - with exports to Continental Europe, in particular, growing at a compound annual rate of more than 55 per cent during 2003-04 to 2006-07. At present, the Indian IT industry has over 400 delivery centres across 52 countries. This strategy of geographical diversification along with a strong focus on productivity, benchmarking, and enhanced operational efficiencies will help the industry to take forward its competitive edge as the global leader in software services exports.
Furthermore, to withstand global competition, Indian companies have started moving up the value chain by exploring untapped potential in IT consulting and system integration, hardware support and installation and processing services. According to NASSCOM, the industry’s vertical market exposure was well diversified across several mature and emerging sectors. Banking, Financial Services and Insurance (BFSI) remained the largest vertical market for Indian IT-BPO exports, followed by high-technology and telecommunications, together accounting for nearly 60 per cent of the Indian IT-BPO exports in 2006-07. Security concerns have also been duly recognised to maintain customer confidence. From a customer’s point of view, the focus has been on consolidation, integration and regulation – all of which are expected to drive newer business opportunities for the Indian IT industry.
Broad-based growth across all the segments of IT services, BPO, product development and engineering services has reinforced India’s leadership as the key sourcing location for a wide range of technology related services. Accordingly, India continued to be ranked first in the exports of computer and information services in the international economy since 2005 (Table 10). As per the latest data of the WTO, India’s share in world exports of computer and information services was around 17 per cent in 2006. According to the NASSCOM, software exports of India is expected to grow by 16-17 per cent, factoring in the impact of the global economic crisis during the second half of the year, to reach US $ 47 billion during 2008-09. Despite an uncertain economic environment, according to the NASSCOM, the Indian IT-BPO industry is expected to experience sustainable growth over the next two years and India’s software services exports is projected to reach US $ 60-62 billion by 2010-11. |
| |
|
|
Table 9: Software Services Exports of India |
(US $ million) |
Year |
IT Services Exports |
ITES-BPO Exports |
Total Software Services Exports |
1 |
2 |
3 |
4 |
1995-96 |
754 |
— |
754 |
1999-00 |
3,397 |
565 |
3,962 |
2000-01 |
5,411 |
930 |
6,341 |
2001-02 |
6,061 |
1,495 |
7,556 |
2002-03 |
7,100 |
2,500 |
9,600 |
2003-04 |
9,200 |
3,600 |
12,800 |
2004-05 |
13,100 |
4,600 |
17,700 |
2005-06 |
17,300 |
6,300 |
23,600 |
2006-07 |
22,900 |
8,400 |
31,300 |
2007-08 |
29,400 |
10,900 |
40,300 |
ITES: IT enabled services. BPO: Business Process Outsourcing.
Source: National Association of Software and Service Companies (NASSCOM). |
|
| |
|
|
| Table 10: Computer and Information Services Exports |
| (US $ billion) |
Sr. No.* |
Country |
2000 |
2004 |
2005 |
2006 |
2007 |
1 |
2 |
3 |
4 |
5 |
6 |
7 |
1. |
India |
6.3 |
16.3 |
22.0 |
29.2 |
37.0 |
2. |
Ireland |
7.5 |
18.8 |
19.6 |
21.0 |
26.1 |
3. |
U.K. |
4.3 |
11.7 |
11.2 |
13.0 |
14.1 |
4. |
U.S.A. |
5.6 |
6.7 |
7.3 |
10.3 |
12.7 |
5. |
Germany |
3.8 |
8.1 |
8.4 |
9.7 |
12.2 |
6. |
Sweden |
1.2 |
2.5 |
2.7 |
3.6 |
6.5 |
7. |
Israel |
4.2 |
4.4 |
4.5 |
5.3 |
5.8 |
8. |
Spain |
2.0 |
3.0 |
3.6 |
4.0 |
5.3 |
9. |
Canada |
2.4 |
3.0 |
3.6 |
4.3 |
4.4 |
10. |
China |
0.4 |
1.6 |
1.8 |
3.0 |
4.3 |
*: Ranking is for the year 2007.
Source: Balance of Payments Statistics Year Book 2008, IMF and Reserve Bank of India. |
|
| |
III.1.2 Business and Professional Services |
| |
Business, professional and technical services are among the most thriving services sectors in developed countries as well as in some developing countries like Brazil and India. These services range from legal to management services, and from architectural to advertising services. India’s non-software miscellaneous services constituted almost 30 per cent of total services exports in 2007-08, which in turn, have supported steady growth in invisibles receipts. Within non-software miscellaneous services exports, the share of business and professional services have grown significantly in recent years and constituted around 63 per cent in 2007-08 (Table 11). |
| |
|
|
| Table 11: Break-up of Non-Software Miscellaneous Receipts and Payments |
| (US $ million) |
Item |
Receipts |
Payments |
2006-07 |
2007-08 |
2007-08 |
2008-09 |
2006-07 |
2007-08 |
2007-08 |
2008-09 |
April-March (R) |
April-March (PR) |
April-
Sept (PR) |
April-Sept (P) |
April-March (R) |
April-
March (PR) |
April-
Sept (PR) |
April-
Sept (P) |
1 |
2 |
3 |
4 |
5 |
6 |
7 |
8 |
9 |
1. Communication |
2,262 |
2,408 |
1,126 |
1,250 |
796 |
859 |
411 |
522 |
2. Construction |
700 |
763 |
256 |
371 |
737 |
758 |
328 |
344 |
3. Financial Services |
3,106 |
3,217 |
1,444 |
1,763 |
2,991 |
3,138 |
1,151 |
1,593 |
4. News Agency |
334 |
503 |
306 |
397 |
226 |
326 |
211 |
165 |
5. Royalties, Copyrights & License Fees |
97 |
157 |
69 |
70 |
1,030 |
1,088 |
459 |
804 |
6. Business Services |
14,544 |
16,771 |
7,652 |
8,702 |
15,866 |
16,715 |
6,700 |
6,629 |
7. Personal, Cultural & Recreational Services |
243 |
562 |
196 |
297 |
117 |
199 |
88 |
158 |
8. Others |
2,649 |
2,064 |
1,286 |
1,428 |
4,484 |
4,183 |
932 |
430 |
Total (1 to 8) |
23,935 |
26,445 |
12,335 |
14,278 |
26,247 |
27,266 |
10,280 |
10,645 |
R : Revised. PR : Partially Revised. P : Preliminary.
Note: Break-up of Business Services (item 6) is given in Table 12. |
|
| |
The business services payments have also increased sharply in recent years, reflecting the ongoing technological transformation of the economy and modernisation of the Indian industry with a great deal of focus on technological up-gradation on a sustained basis.
The major constituents of business services have been management consultancy, architectural engineering and other technical services, maintenance of offices abroad and trade-related services (Table 12). Amongst these components, trade related services have grown sharply by almost 69 per cent and maintenance of offices abroad services increased by around 8 per cent, while most other services exports decelerated during 2007-08. Amongst business services payments, maintenance of offices abroad and advertising have decelerated, while there was a general increase in most other categories. With the rising demand for infrastructure and as a favourable destination for international companies for meeting the IT needs, India is emerging as an important country for trade in engineering services. Engineering services mainly includes consultancy in designing and detailed designing services. |
| |
III.1.3 Travel |
| |
Receipts under travel represent expenditure by foreign tourists towards hotel expenses and goods and services purchased including domestic travel. Travel receipts continued to benefit from the robust growth in tourist arrivals (Table 13). Tourism earnings continued with their buoyancy witnessed since 2003-04, reflecting business, healthcare and leisure travel. Liberalization of the payments system, growing globalization, rising services exports and associated business travel as well as the preference for higher studies abroad have led to sustained growth in outbound tourism from India since the 1990s. Concomitantly, |
| |
|
|
Table 12: Business Services |
( US $ million) |
Item |
Receipts |
Payments |
2006-07 |
2007-08 |
2007-08 |
2008-09 |
2006-07 |
2007-08 |
2007-08 |
2008-09 |
April-March (R) |
April-March (PR) |
April-
Sept (PR) |
April-Sept (P) |
April-March (R) |
April-March (PR) |
April-
Sept (PR) |
April-Sept (P) |
1 |
2 |
3 |
4 |
5 |
6 |
7 |
8 |
9 |
1. Trade Related |
1,325 |
2,233 |
890 |
1,154 |
1,801 |
2,285 |
1,004 |
826 |
2. Business & Management Consultancy |
4,476 |
4,433 |
2,166 |
2,662 |
3,486 |
3,653 |
1,541 |
1,084 |
3. Architectural, Engineering and other Technical |
3,457 |
3,144 |
1,763 |
1,071 |
3,025 |
3,173 |
1,160 |
1,380 |
4. Maintenance of Offices |
2,638 |
2,861 |
1,239 |
1,266 |
4,032 |
3,496 |
940 |
951 |
5. Others |
2,648 |
4,100 |
1,594 |
2,549 |
3,522 |
4,108 |
2,055 |
2,388 |
Total (1 to 5) |
14,544 |
16,771 |
7,652 |
8,702 |
15,866 |
16,715 |
6,700 |
6,629 |
P : Preliminary. PR : Partially Revised. R : Revised. |
|
| |
| |
|
|
Table 13: Foreign Tourist Arrivals In India |
Year |
Arrivals (millions) |
1 |
2 |
1991 |
1.68 |
1995 |
2.12 |
2000 |
2.65 |
2001 |
2.54 |
2002 |
2.38 |
2003 |
2.73 |
2004 |
3.46 |
2005 |
3.90 |
2006 |
4.45 |
2007 |
5.08 |
2008 |
5.37 * |
* : Provisional Estimate.
Source: Ministry of Tourism and Culture, Government of India. |
|
| |
travel payments also increased, reflecting rising business and leisure travel in consonance with (i) growing merchandise and services trade and (ii) growing disposable incomes of residents in an environment of liberalized payments regime. The potential for greater leisure tourism and business travel indicate the continuation of a sustained growth in this segment in the near future. Travel receipts as a percentage of total services exports, after declining during 2004-05 to 2006-07, increased marginally to 12.6 per cent during 2007-08 from 12.4 per cent a year ago. The gradual hike in the amount residents are permitted to remit per financial year for any permitted current or capital account transaction under the liberalized remittance scheme operative since February 2004 (from US $ 25,000 per calendar year in February 2004 to US $ 2,00,000 effective September 26, 2007) along with the general appreciation of domestic currency against major foreign currencies during 2007-08 made outbound tourism attractive. This was reflected in the sharp increase in outward remittances under the category ‘others’, which includes education, tours and travels,from US $ 16.4 million in 2006-07 to US $ 160.4 million during 2007-08. Notwithstanding this, the surplus on travel account stood at US $ 2.1 billion during 2007-08 (US $ 2.4 billion in 2006-07).
India’s position in the world’s tourist earnings has improved significantly in recent years. India’s share in world travel earnings showed a marginal improvement to 1.3 per cent in 2007 as against 1.2 per cent in 2006. Accordingly, India ranked 18th in the world tourist earnings in 2007 as against 23rd in 1990 (Table 14). |
| |
|
|
Table 14: Comparative Position of India among Top Travel Earnings Countries, 2007 |
Sr. No |
Country |
US $ billion |
Share in World
Travel
Earnings (%) |
1 |
2 |
3 |
4 |
1. |
USA |
119.2 |
14.0 |
2. |
Spain |
57.9 |
6.8 |
3. |
France |
54.2 |
6.4 |
4. |
Italy |
42.7 |
5.0 |
5. |
U.K. |
37.7 |
4.4 |
6. |
China |
37.2 |
4.4 |
7. |
Germany |
36.1 |
4.2 |
8. |
Australia |
22.3 |
2.6 |
9. |
Austria |
18.8 |
2.2 |
10. |
Turkey |
18.5 |
2.2 |
11. |
Thailand |
16.7 |
2.0 |
12. |
Canada |
15.6 |
1.8 |
13. |
Netherlands |
13.4 |
1.6 |
14. |
Malaysia |
12.9 |
1.5 |
15. |
Mexico |
12.9 |
1.5 |
16. |
Switzerland |
12.2 |
1.4 |
17. |
Sweden |
12.0 |
1.4 |
18. |
India |
10.7 |
1.3 |
19. |
Poland |
10.6 |
1.2 |
20. |
Portugal |
10.2 |
1.2 |
21. |
Russia |
9.6 |
1.1 |
22. |
Japan |
9.3 |
1.1 |
23. |
Egypt |
9.3 |
1.1 |
24. |
Croatia |
9.2 |
1.1 |
25. |
Singapore |
8.7 |
1.0 |
Source: Balance of Payments Statistics Year Book 2008, IMF. |
|
| |
III.1.4 Transportation |
| |
| In view of the rising merchandise trade over the years, the receipts and payments towards transportation, which mainly represents carriage of goods and people as well as other distributive services (such as port charges, bunker fuel, stevedoring, cabotage, warehousing), have also increased over the years. Receipts under transportation increased to US $ 10.0 billion during 2007-08 from US $ 8.0 billion in 2006-07, while payments were higher at US $ 11.5 billion as compared with US $ 8.1 billion during the same period. At this level, the transportation receipts constituted 11.1 per cent of total services exports during 2007-08 as compared with 10.8 per cent in the previous year. The sharp increase in fuel prices, higher freight charges as well as the inability of some major shipping routes to meet demand continued to have a significant effect on transportation costs. |
| |
III.1.5 Insurance |
| |
| Insurance consists of insurance on exports/imports, premium on life and non-life policies and reinsurance premium from foreign insurance companies. Insurance receipts and payments are generally associated with the movement in India’s merchandise trade. The share of insurance receipts in total services receipts remained around 2 per cent of total services exports since the early 1990s. |
| |
III.1.6 ‘Other’ Component in Services |
| |
In addition to the software services, business services, travel, transportation and insurance, the other component under trade in services includes a host of other commercial services such as financial, communication, construction and personal, cultural and recreational services. However, financial and communication services are the two major components (see Table 11). Under financial services, both receipts and payments have witnessed a significant increase in recent years reflecting greater merger and acquisition activities by domestic companies abroad as well as increasing access by Indian corporates and banks to international financial markets. Financial services covers financial intermediation and auxiliary services provided by banks, stock exchanges, factoring enterprises, credit card enterprises and other enterprises. Both financial services exports and imports were around US $ 3.2 billion in 2007-08. India ranked at 8th position in terms of financial services exports and 7th position in terms of importer of financial services in 2006 (Table 15).
Communication services exports have also increased significantly in recent years, reflecting technological transformation of the domestic economy as well as significant liberalization of the telecom sector. India ranked 4th position amongst the world’s top 15 telecommunication exporters in 2006 (Table 16). |
| |
III.2 Transfers |
| |
Transfers comprise of official transfers and private transfers. Private transfers, mainly workers’ remittances, have remained buoyant in recent years on the back of robust global output growth, amidst constant improvement in remittance infrastructure domestically. The details of private transfers are set out below. |
| |
|
|
Table 15: Comparative Position of India among Top Financial Services Providers, 2006 |
Rank |
Exporters |
Value
(US $million) |
Share in 15
Economies |
Rank |
Importers |
Value
(US $ illion) |
Share in 15
Economies |
1 |
2 |
3 |
4 |
5 |
6 |
7 |
8 |
1. |
European Union (27) |
120,752 |
58.6 |
1. |
European Union (27) |
56,766 |
64.1 |
2. |
United States |
42,814 |
20.8 |
2. |
United States |
14,297 |
16.2 |
3. |
Switzerland |
11,696 |
5.7 |
3. |
Japan |
2,986 |
3.4 |
4. |
Hong Kong |
9,268 |
4.5 |
4. |
Canada |
2,864 |
3.2 |
5. |
Japan |
6,151 |
3.0 |
5. |
Hong Kong |
2,017 |
2.3 |
6. |
Singapore |
4,064 |
2.0 |
6. |
Taipei |
1,390 |
1.6 |
7. |
Korea |
2,543 |
1.2 |
7. |
India |
1,316 |
1.5 |
8. |
India |
2,071 |
1.0 |
8. |
Switzerland |
1,281 |
1.4 |
9. |
Canada |
1,897 |
0.9 |
9. |
Singapore |
972 |
1.1 |
10. |
Taipei |
1,232 |
0.6 |
10. |
Russia |
904 |
1.0 |
11. |
Norway |
820 |
0.4 |
11. |
China |
891 |
1.0 |
12. |
Australia |
756 |
0.4 |
12. |
Norway |
879 |
1.0 |
13. |
Brazil |
738 |
0.4 |
13. |
Brazil |
861 |
1.0 |
14. |
South Africa |
706 |
0.3 |
14. |
Korea |
547 |
0.6 |
15. |
Russia |
589 |
0.3 |
15. |
Turkey |
524 |
0.6 |
|
Above 15 |
206,095 |
100.0 |
|
Above 15 |
88,495 |
100.0 |
Source: International Trade Statistics 2008, WTO. |
|
| |
| |
|
|
Table 16: Comparative Position of India among Top Telecommunication Exporters, 2006 |
Country/Region |
Value
(US $ million) |
Share in 15 Economies |
1 |
2 |
3 |
1. European Union (27) |
30,161 |
65.5 |
2. United States |
6,257 |
13.6 |
3. Kuwait |
3,398 |
7.4 |
4. India |
1,096 |
2.4 |
5. Russia |
739 |
1.6 |
6. Malaysia |
641 |
1.4 |
7. Philippines |
572 |
1.2 |
8. Hong Kong |
566 |
1.2 |
9. Mexico |
466 |
1.0 |
10. Korea |
423 |
0.9 |
11. Turkey |
416 |
0.9 |
12. Morocco |
387 |
0.8 |
13. Croatia |
325 |
0.7 |
14. Norway |
320 |
0.7 |
15. Lebanon |
305 |
0.7 |
Above 15 |
46,070 |
100.0 |
Source: International Trade Statistics 2008, WTO. |
|
| |
| III.2.1 Private Transfers: Remittances for Family Maintenance and Local Withdrawals from NRI Deposits |
| |
Inflows from overseas Indians are mainly in the form of: (i) inward remittances towards family maintenance, and (ii) deposits in the Non-Resident Indian (NRI) deposit schemes with the banks in India. However, remittances from overseas Indians include the inflows towards family maintenance and the funds domestically withdrawn from the NRI rupee deposits accounts (NR(E)RA and NRO deposit schemes). Such remittances from overseas Indians are treated as private transfers, which are included in the current account of the balance of payments. As against this, the inflows from overseas Indians for deposits in the NRI deposit schemes are treated as capital account transactions.
According to the IMF’s Balance of Payments Manual, 5th Edition (1993), ‘transfers’ represent one-sided transactions, i.e., transactions that do not have any quid pro quo, such as grants, gifts, and migrants’ transfers by way of remittances for family maintenance, repatriation of savings and transfer of financial and real resources linked to change in the resident status of migrants. |
| |
| III.2.1.1 Trends in Private Transfers (Workers’ Remittances) |
| |
Workers’ remittances have remained buoyant in recent years reflecting the favourable impact of macroeconomic outcomes, both domestically and globally. The surge in workers’ remittances to India, responding to oil boom in the Middle East during the 1980s, and the information technology revolution in the 1990s, has placed India among the highest remittancereceiving countries in the World. The demand for semi-skilled/unskilled labour from the Middle East started in the mid-1970s and peaked in the early 1980s, which was followed by the second wave since the mid-1990s, led by the information technology boom. Thus, the labour migration pattern shifted from unskilled/ semi-skilled labour to increasingly high skilled categories, mostly to America and Europe. Remittance inflows from overseas Indians increased to US $ 43.5 billion during 2007-08 as compared to US $ 30.8 billion in 2006-07 (Table 17). The share of private transfers in the current receipts rose to 13.8 per cent as against 12.7 per cent during 2006-07.
Private transfers continued to be around three per cent of India’s GDP since 1999-2000 and helped in offsetting India’s merchandise trade deficit to a large extent. |
| |
|
|
Table 17: Select Indicators of Private Transfers to India |
Year |
Amount
(US $ billion) |
Share in Current
Receipts
(Per cent) |
Private
Transfers
(Per cent to GDP) |
1 |
2 |
3 |
4 |
1990-91 |
2.1 |
8.0 |
0.7 |
1995-96 |
8.5 |
17.1 |
2.4 |
1999-00 |
12.3 |
18.3 |
2.7 |
2000-01 |
13.1 |
16.8 |
2.8 |
2001-02 |
15.8 |
19.4 |
3.3 |
2002-03 |
17.2 |
18.0 |
3.4 |
2003-04 |
22.2 |
18.5 |
3.7 |
2004-05 |
21.1 |
13.6 |
3.0 |
2005-06 |
25.0 |
12.8 |
3.1 |
2006-07 (R) |
30.8 |
12.7 |
3.4 |
2007-08 (PR) |
43.5 |
13.8 |
3.7 |
R: Revised. PR : Partially Revised. |
|
| |
The relative stability in such transfers, compared to other capital account items such as NRI deposits, foreign direct investment and portfolio investment, has also enabled the containment of the current account deficit at modest levels through the 1990s. The relative stability in private transfers reflected the steady increase in inward remittances for family maintenance and higher local withdrawals on the back of better domestic investment opportunities. From the sources side, a significant share of remittances to India continued to be from the oil exporting countries of the Middle East. Another important source of remittance inflows to India is the US. In the Indian context, a major part of funds remitted by expatriate workers is channelised through inflows to nonresident deposits in the form of local withdrawals.
Several factors account for the remarkable increase in workers’ remittances. First, in the 1990s, migration to Australia, Canada, and the United States, increased significantly, particularly among information technology (IT) workers on temporary work permits. Second, the swelling of migrants’ ranks coincided with better incentives to send and invest money regulations and controls, more flexible exchange rates, and gradual opening of the capital account. The convenient remittance services provided by Indian and international banks have also shifted such remittance flows from informal hawala channels to formal channels. Third, nonresident Indians have also responded to several attractive deposit schemes and the policy initiatives on this front.
However, with oil prices falling significantly and the advanced economies such as the US, Europe and Japan already into recession following the global financial crisis, the outlook for remittances remain uncertain at the current juncture (Box I). |
| |
| III.2.1.2 Composition of Remittances |
| |
The details of private transfers comprising those of remittances for Family Maintenance, Local Withdrawals from Non-Resident Rupee Account, Gold and Silver brought through Passenger Baggage, and Personal gifts/donations to charitable/ religious institutions are set out below. |
| |
III.2.1.2.1 Remittances for Family
Maintenance |
| |
The share of remittances repatriated by the overseas Indians for family maintenance, which contributed a significant share of remittance flows to India at about 60 per cent in 1999-2000 declined to around 42 per cent in 2005-06. Subsequently, however, its share increased and reached 50.4 per cent during 2007-08 (Table 18). |
| |
| III.2.1.2.2 Local Withdrawals from Non
Resident Rupee Deposit Schemes |
| |
Local withdrawals from non-resident rupee deposit schemes, as part of workers’ remittances, are the withdrawals from Non-Resident (External) Rupee Account [NR(E)RA] and Non-Resident Ordinary (NRO) Rupee Account by the non-resident or his dependent for local use. Such local withdrawals/redemptions from NRI |
| |
| |
Box I : Impact of Global Financial Crisis on Remittances |
| |
The impact of the financial crisis that originated in the US has been visible across countries, both directly and indirectly. While the advanced countries including the US are already into recession due to the credit crunch, developing countries, including India, have been impacted through both trade and capital flows. There are also apprehensions about workers’ remittances and NRI flows to India slowing down as a consequence of global financial crisis and the recession in major advanced economies. There is a perception that the recession induced rising job losses in the US and Europe could fall more on migrants workers. Even if there is no lay-off, workers would often have to accept lower wages as employers worldwide are seeking to cut costs in an attempt to cope better with the financial crisis. Fears have also been expressed in several quarters about the reverse migration of Indian labourers working in the Gulf countries, which could result in a decline in remittances and NRI deposits in India. The construction industry in the Gulf region, especially in the UAE, is facing a tough time due to the global meltdown and has left millions of construction workers with an uncertain future. Furthermore, declining oil prices, by reducing incomes of workers in the Gulf countries, could also lead to reduced remittances flows to India. A study was conducted by the Reserve Bank of India with the help of its Regional Offices to analyse whether there has been any reverse migration and consequent slowdown in remittances.
Although there is no official data/information available on the job losses suffered by migrants residing in the Gulf countries, the findings of the study revealed that there are no indications about workers from the Gulf region returning to India. Further, informal discussions with some of the bankers in different states/region indicate that the Banks do not have any authentic information on the issue and have not noted any trend in reverse migration. However, based on informal discussions with select Non-Resident Indians (NRIs), it was gathered that a lot of Indians as well as people from other nations are losing jobs in UAE, mainly in the construction industry, where companies are attempting to reduce their expenses. It was understood that companies are re-tendering for many projects as the rate of all construction materials has come down. As the construction sector has also been affected, workers, sub-contractors, manufacturers of all related goods have been affected. However, most of the lay-offs have affected people who were working at the entry level or lower level executives.
Based on the information collected from regional offices of the Reserve Bank, it was observed that so far there were no slowdown in the inward remittances. This could be attributed to a number of factors as noted below.
- As inward remittances depend upon the interest differential and the exchange rate movement, due to the rupee depreciation in the recent period, there has been a significant rise in inflows, particularly through the rupee denominated NRI accounts such as NRO and NR(E)RA schemes.
- Furthermore, the hikes in the interest rate ceilings on NRI deposits since September 2008 to LIBOR/ Swap rate plus 100 basis points in case of FCNR(B) and LIBOR/Swap rate plus 175 basis points in case of NRE deposits have increased the interest differential in favour of India. This along with the weakness of the rupee vis-à-vis the US dollar, some of the remittances might have been attracted towards India which probably might have masked the adverse impact on inward remittances to India.
- The variation in the NRI deposits from the Gulf is generally in response to the cyclical movement in international oil-prices.
|
However, while advanced countries are officially into recession due to the ongoing global financial crisis, increasing fears are being raised about its impact on
the growth prospects of Emerging Market Economies (EMEs). Against this backdrop, a quick recovery is not in sight. In fact, the latest IMF forecast in January 2009 suggests global growth to reach 0.5 per cent in 2009,
its lowest rate since World War II (it was 3.4 per cent
in 2008). Simultaneously, the main stimulus to global growth is excepted to come from India and China,
which are expected to grow by 5.1 per cent and 6.7 per cent, respectively in 2009 (7.3 per cent and 9.0 per cent, respectively in 2008). With North America accounting for nearly 44 per cent of the total remittances to India, followed by the Middle East (24 per cent) and Europe (13 per cent), some slowdown in remittances due to
the global financial crisis and the associated contraction in economic activity cannot be ruled out. According to the World Bank estimates (November 2008),
remittances from the Gulf region, the livelihood for millions in South Asia and the developing world, could decline by 9 per cent in nominal dollar terms during 2009 as compared to a rise of 38 per cent witnessed in 2008, while global remittances to developing countries
is estimated to fall by 0.9 per cent (against an increase
of 6.7 percent to US $ 283 billion in 2008). |
| |
|
|
Table 18: Trend and Composition of Private Transfers to India |
(US $ million) |
Year |
Inward
remittances
for family
maintenance |
Local
withdrawals/
redemptions
from NRI
Deposits |
Gold and silver
brought
through
passenger
baggage |
Personal
gifts/donations
to charitable/
religious
institutions
in India |
Total |
1 |
2 |
3 |
4 |
5 |
6 |
1999-00 |
7,423 |
4,120 |
13 |
734 |
12,290 |
2000-01 |
7,747 |
4,727 |
10 |
581 |
13,065 |
2001-02 |
6,578 |
8,546 |
13 |
623 |
15,760 |
2002-03 |
9,914 |
6,644 |
18 |
613 |
17,189 |
2003-04 |
10,379 |
10,585 |
19 |
1,199 |
22,182 |
2004-05 |
9,973 |
8,907 |
27 |
2,168 |
21,075 |
2005-06 |
10,455 |
12,454 |
16 |
2,026 |
24,951 |
2006-07 (R) |
14,740 |
13,208 |
27 |
2,860 |
30,835 |
2007-08 (PR) |
21,920 |
18,919 |
26 |
2,641 |
43,506 |
2008-09(Apr-Sep) (P) |
14,288 |
11,217 |
12 |
1,525 |
27,042 |
2007-08(Apr-Sep) (PR) |
9,054 |
7,891 |
17 |
1,063 |
18,025 |
R: Revised. PR: Partially Revised. P: Preliminary. |
|
| |
deposits cease to exist as liability in the capital account of the balance of payments and assume the form of private transfers, which is included in the current account of the balance of payments.
Although the average contribution of local withdrawals to total private transfers declined from 50 per cent in the first half of the 1990s to only 29 per cent in the latter half, a reversal in this trend has been witnessed in the recent period. Since 2003-04, there has been relatively rising significance of the local withdrawal route as a conduit to remittance inflows to India (Table 19). The share of local withdrawals in the total private transfers increased to 43.5 per cent during 2007-08 as compared to 42.8 per cent during 2006-07. The rising trend in local withdrawals could be attributed to higher income levels of migrants in the recent past as well as better domestic investment opportunities on the back of robust growth and relatively benign inflation conditions. Even under the current global financial and economic crisis, the gross inflows to NRI deposits and the steady trend in local withdrawals indicate that remittance inflows may be sustainable over the medium term. It may be noted that a major part of outflows from NRI deposits (constituting about 85 per cent, on an average) is in the form of local withdrawals from NRI deposits. However, during 2007-08, the share declined significantly to around 65 per cent reflecting higher outflows under the FCNR (B) accounts. |
| |
|
|
Table 19: Inflows and Outflows from NRI Deposits, Local Withdrawals and Remittances |
(US $ million) |
Year |
Inflows |
Outflows |
Local
Withdrawals/
Redemption
from NRI
Deposits |
Private
Transfers
(included in current Accountof BoP) |
Local
Withdrawal
as % of Private
Transfers(4)/(5)
(Per cent) |
1 |
2 |
3 |
4 |
5 |
|
1999-00 |
7,405 |
5,865 |
4,120 |
12,290 |
33.5 |
2000-01 |
8,988 |
6,672 |
4,727 |
13,065 |
36.2 |
2001-02 |
11,435 |
8,681 |
8,546 |
15,760 |
54.2 |
2002-03 |
10,214 |
7,236 |
6,644 |
17,189 |
38.6 |
2003-04 |
14,281 |
10,639 |
10,585 |
22,182 |
47.7 |
2004-05 |
8,071 |
9,035 |
8,907 |
21,075 |
42.3 |
2005-06 |
17,835 |
15,046 |
12,454 |
24,951 |
49.9 |
2006-07 (R) |
19,914 |
15,593 |
13,208 |
30,835 |
42.8 |
2007-08 (PR) |
29,401 |
29,222 |
18,919 |
43,506 |
43.5 |
2008-09(Apr-Sep) (P) |
18,237 |
17,164 |
11,217 |
27,042 |
41.5 |
2007-08(Apr-Sep) (PR) |
12,227 |
12,305 |
7,891 |
18,025 |
43.8 |
P : Provisional. PR : Partially Revised. P : Preliminary |
|
| |
III.2.1.2.3 Gold and Silver brought
through Passenger Baggage |
| |
| Under the liberalised policy for imports, the Government of India permitted import of gold by certain nominated agencies for sale to jewellery manufacturers, exporters, NRIs, holders of special import licences and domestic users. Nominated agencies/banks were permitted to import gold under different arrangements such as suppliers/buyers credit basis, consignment basis and outright purchase. Thus, after 1997-98 gold imports through passenger baggage by the returning Indians lost its importance as a conduit of remittance flows. |
| |
| III.2.1.2.4 Personal gifts/donations to
charitable/religious institutions |
| |
In recent years, the inflows under this channel have also increased, albeit with some moderation in 2007-08. The money repatriated is predominantly donations to charitable/religious institutions/NGOs. |
| |
III.2.1.3 Comparative Position on Remittances |
| |
In recent years, there has been a significant increase in workers’ remittances particularly in developing countries. Remittances provide a safety net to migrant households in times of hardship and these flows typically do not suffer from the governance problems that may be associated with official aid flows. According to available estimates of the World Bank, officially recorded remittance flows to developing countries are expected to increase by 6.7 per cent to reach US $ 283 billion in 2008 in nominal terms. In real terms, however, remittances as a share of GDP of the recipient countries are expected to fall to 1.8 per cent in 2008 from 2.0 per cent in 2007. Given the uncertain outlook for global growth, commodity prices and exchange rates, the outlook for remittances remains uncertain. According to the World Bank (2008), although remittances are expected |
| |
|
|
Table 20: Workers’ Remittances - Top Ten Receiving Countries# |
(US $ million) |
Sr. No. |
Country |
2001 |
2002 |
2003 |
2004 |
2005 |
2006 |
2007 |
1 |
2 |
3 |
4 |
5 |
6 |
7 |
8 |
9 |
1. |
India* |
14,816 |
16,285 |
21,885 |
20,012 |
23,909 |
29,247 |
38,219 |
2. |
Mexico |
8,895 |
9,814 |
13,650 |
16,730 |
20,284 |
23,742 |
23,970 |
3. |
Nigeria |
1,167 |
1,209 |
1,063 |
2,273 |
3,329 |
— |
17,946 |
4. |
Phillipines |
6,328 |
7,167 |
7,681 |
8,617 |
10,668 |
12,481 |
13,266 |
5. |
China |
912 |
1,679 |
3,343 |
4,627 |
5,495 |
6,830 |
10,679 |
6. |
Egypt |
2,911 |
2,893 |
2,961 |
3,341 |
5,017 |
5,330 |
7,656 |
7. |
Spain |
3,665 |
3,959 |
4,718 |
5,196 |
5,343 |
6,068 |
7,281 |
8. |
Romania |
4 |
7 |
14 |
18 |
3,754 |
5,509 |
6,834 |
9. |
Morocco |
3,261 |
2,877 |
3,614 |
4,221 |
4,589 |
5,451 |
6,730 |
10. |
Bangladesh |
2,094 |
2,848 |
3,180 |
3,572 |
4,302 |
5,418 |
6,553 |
* : Sourced from data on India’s balance of payments published in RBI Monthly Bulletin.
# : Ranking is based on the data for 2007.
Source: Balance of Payments Statistics Yearbook, IMF. |
|
to fall in 2009, they are unlikely to fall as much as private flows and official aid to developing countries. Remittances are the largest source of external financing in many poor countries. Also, remittances have been less volatile than other sources of foreign exchange earnings in developing countries (World Bank, 2006). A cross country comparison of the recent flow of remittances to developing countries reveals that at US $ 38.2 billion, India is the leading remittance receiving country in the world during 2007 with relative stability in such inflows (Table 20).
The macroeconomic consequences of remittance flows, however, needs to be examined in view of significant costs and benefits associated with such flows as indicated by a recent study by the IMF (2008). In view of India being a major recipient of remittances, an informal assessment of the impact of remittance flows on the Kerala economy was undertaken in accordance with the key findings of the IMF study (Box II). |
| |
| II.3 Investment Income |
| |
Investment income receipts are mainly driven by the interest and discount earnings on the RBI investment of foreign exchange reserves and reinvested earnings of the Indian direct investment enterprises abroad. Investment income receipts rose significantly since the late 1990s due to the build up of foreign exchange reserves. The rise in reinvested earnings reflects the upward trend in Indian overseas investment by the Indian companies to take advantage of their access to international markets, natural resources, distribution networks, foreign technologies and other strategic assets such as brand names.
Investment income payments mainly include payment of interest on commercial borrowings, external assistance, NRI deposits and other short-term liabilities. In addition, and more importantly, it includes reinvested earnings of the FDI enterprises operating in India as well as dividend and profit payments on liabilities such as FDI |
| |
| |
Box II : Macroeconomic Consequences of Remittances |
| |
Remittances represent one of the largest international flows of financial resources. For many remittance-receiving developing economies, remittances exceed foreign direct investment, portfolio flows from financial markets and official development assistance received from abroad. In some countries, total remittance receipts amount to a substantial portion of their imports and a significant fraction of GDP. Given the large size of aggregate remittance flows, they should be expected to have significant macroeconomic effects on the economies that receive them. In addition, remittances have been identified as a potential source of funding for economic development. Due to the large size of these flows relative to the recipient economies, the likelihood about the sustenance of these flows on account of continued globalization, and the distinctive features of these flows from those of official aid or private capital, understanding the unique characteristics of remittances and their potential economic impact have attracted the attention of policymakers and researchers in recent years.
In this context, a recent study by the IMF on ‘Macroeconomic Consequences of Remittances (2008)’ (IMF Occasional Paper No.259) has directly addressed two questions – how to manage the macroeconomic effects of remittances; and ii) how to harness their development potential, by reporting the results of the first global study of the comprehensive macroeconomic effects of remittances on the economies that receive them to draw summary policy implications. While it is generally agreed that remittances improve households’ welfare by lifting families out of poverty and insuring them against income shocks, the IMF study, through a systematic macroeconomic analysis, yields a number of important caveats and policy considerations that have largely been overlooked in the literature. The specific findings of the study can be summarized under three main points: a) The proper measurement of remittances is essential to estimating their impact on the macroeconomy, and hence for making sound policy; b) Remittances carry a number of potential benefits, but each is matched with a potential cost; and c) The challenge is to design policies that allow these benefits to flow to households and the economy while limiting or offsetting any counterproductive side effects.
In this backdrop, an internal study was undertaken to understand the macroeconomic effects of remittances on one of the Indian States - Kerala and was compared with the findings of the IMF Study to understand their policy implications for India. The broad findings of the internal study on Kerala highlight the following issues of relevance to India. First, there are indications that the potential benefits match costs of remittances in the (Kerala) State. According to many studies on remittances to Kerala, the improvement in the welfare of households is observable as direct potential benefits of remittances. However, the effects of the remittances on the capital accumulation in the State as well as on the fiscal capacity of the state is yet to be examined in detail in order to understand whether the State is able to extract maximum benefits of remittances. Second, available studies on remittances and its effects on Kerala also underline the presence of potential costs of remittances, at least in the form of educated unemployment. However, further exploration in this area would be required to identify the existence of other potential costs which in turn may help to design policies to ward off negative externalities of remittances, if any. Third, it was found that the remittances by stimulating consumption demand plays an active role in boosting the services sector which is the main driver of the State economy. Further, the construction sector which is also driven by remittances makes a significant contribution to the secondary sector in the State. The construction sector is responsible for generating employment in the economy. A reality check of the IMF’s findings on the macroeconomic impact of remittances with respect to the internal findings from the State of Kerala suggested broad similarities (Table). |
| |
|
|
Box II : Macroeconomic Consequences of Remittances (Concld.) |
Table: Macroeconomic Consequences of Remittances: IMF Study and Evidence from Kerala |
Findings of IMF study - Macroeconomic Consequences of Remittances |
Reality Check on Kerala Economy |
Measuring the remittances flow |
|
(i) The proper measurement of remittances is essential to estimating their impact on the macroeconomy, and hence for making sound
policy. |
(i) At the national level, the data on remittances are properly captured as part of the balance of payments data. However, in Kerala there is no official estimate on the remittances flows to Kerala or the system is not yet in place to estimate remittances state-wise. |
Potential benefits |
|
(i) Remittances improve the welfare of individual households. |
(i) Remittances increased households’ consumption on durables and non-durables. |
(ii) Remittances provide financing for current account deficits and facilitate domestic consumption. |
(ii) Increased inter-State trade is an indication of increased consumption. |
(iii) Effects of remittances on the efficiency of investment depend on their impact on financial development and the marginal cost of financial intermediation. |
(iii) Acceleration in remittances to the State is not matched with the corresponding increased trend in credit deposit ratio in the State reflecting inefficiency in financial intermediation. |
Potential costs |
|
(i) Remittances may increase the labor-leisure trade off which, in turn, can negatively affect capital accumulation. |
(i) High level of educated unemployment prevalent in Kerala could be inferred as the existence of strong labor – leisure trade off. |
(ii) The governments may take advantage of the fiscal space afforded by remittances by consuming and borrowing more. |
(ii) The increasing liabilities of the Government of Kerala are reflective of such a trend. |
(iii) Evidence of remittance-driven Dutch disease effects in remittance-receiving countries. |
(iii) Though not exactly the Dutch disease effects, poor performance of trade goods sectors is visible. |
(iv) Remittance Trap- An Extreme case: Many a country persist in a state characterized by low growth, poor economic policy and high remittances. |
(iv) Migration as a solution to unemployment continues in the State puzzles on the existence of a vicious cycle of high remittances and high unemployment. |
Inference on Growth |
|
(i) Since remittances are compensatory in nature altering of work and investments may weaken their potential to increase economic growth. |
(i) Remittances stimulated consumption demand which, in turn, boosted the services sectors that turned out to be the major driver of growth of the State economy. |
|
| |
| |
|
|
Table 21: Investment Income |
(US $ million) |
Year |
Receipts |
Payments |
Net |
1 |
2 |
3 |
4 |
1990-91 |
368 |
4,120 |
-3,752 |
1995-96 |
1,429 |
4,634 |
-3,205 |
1999-00 |
1,783 |
5,478 |
-3,695 |
2000-01 |
2,554 |
7,218 |
-4,664 |
2001-02 |
3,254 |
7,098 |
-3,844 |
2002-03 |
3,405 |
6,370 |
-2,965 |
2003-04 |
3,774 |
7,531 |
-3,757 |
2004-05 |
4,124 |
8,219 |
-4,095 |
2005-06 |
6,229 |
11,491* |
-5,262 |
2006-07 (R) |
8,926 |
15,688 |
-6,762 |
2007-08 (PR) |
13,808 |
18,089 |
-4,281 |
2008-09(Apr-Sep) (P) |
7,273 |
8,841 |
-1,568 |
2007-08(Apr-Sep) (PR) |
5,887 |
8,802 |
-2,915 |
* Includes, inter alia, interest payments
(US$ 1,718 million) of India Millennium Deposits.
R : Revised.
PR: Partially Revised.
P : Preliminary. |
|
| |
and portfolio investments. While both receipts and payments under the investment account have increased in
recent years, the higher payments relative to receipts have resulted in net deficits (Table 21).
While the interest payments depend on the level of debt and the interest rate environment, the reinvested earning payments are influenced by the profitability, and reinvestment decisions of FDI enterprises operating in India. A shift in the level of investment income payments since 2000-01 partly reflects the inclusion of reinvested earnings of FDI enterprises as per the revised procedure of recording FDI in India in line with the international best practices. The growth in investment income payments, especially since 2004-05, has been mainly led by reinvested earnings and dividends and profits reflecting higher returns in the Indian capital market and improved corporate profitability (Table 22). |
| |
|
|
Table 22: Details of Receipts and Payments of Investment Income |
(US $ million) |
Item |
2000-01 |
2001-02 |
2002-03 |
2003-04 |
2004-05 |
2005-06 |
2006-07
(R) |
2007-08 (PR) |
1 |
2 |
3 |
4 |
5 |
6 |
7 |
8 |
9 |
A. Total Receipts (1 to 5) |
2,554 |
3,254 |
3,405 |
3,774 |
4,124 |
6,229 |
8,926 |
13,808 |
1. Interest Receipts on loans to Non-residents |
84 |
201 |
154 |
198 |
65 |
101 |
163 |
1,466 |
2. Dividend and Profits |
11 |
57 |
34 |
40 |
92 |
225 |
450 |
476 |
3. Reinvested Earnings |
340 |
700 |
1,104 |
552 |
248 |
1,092 |
1,076 |
1,084 |
4. Interest/Discount Earnings on Foreign Exchange Reserves |
1,950 |
1,757 |
1,835 |
2,115 |
3,014 |
4,519 |
6,641 |
10,124 |
5. Others |
169 |
539 |
278 |
869 |
705 |
292 |
596 |
658 |
B. Total Payments (1 to7) |
7,218 |
7,098 |
6,370 |
7,531 |
8,219 |
11,491 |
15,688 |
18,089 |
1. Interest Payment on NRI Deposits |
1,811 |
1,808 |
1,413 |
1,642 |
1,353 |
1,497 |
1,969 |
1,813 |
2. Interest Payment on ECBs |
2,020 |
1,945 |
1,486 |
2,584 |
1,283 |
3,148 |
1,709 |
2,655 |
3. Interest Payments on External Assistance |
827 |
792 |
1,111 |
822 |
710 |
825 |
982 |
1,143 |
4. Interest on others (ST) Loans/Bonds |
80 |
80 |
22 |
80 |
400 |
347 |
200 |
415 |
5. Dividends and Profits |
1,047 |
711 |
462 |
878 |
1,991 |
2,502 |
3,486 |
3,576 |
6. Reinvested Earnings |
1,350 |
1,645 |
1,832 |
1,459 |
1,903 |
2,760 |
5,828 |
7,167 |
7. Others |
83 |
117 |
44 |
66 |
579 |
412 |
1,514 |
1,320 |
C. Net Investment Income (A-B) |
-4,664 |
-3,844 |
-2,965 |
-3,757 |
-4,095 |
-5,262 |
-6,762 |
-4,281 |
R : Revised. PR : Partially Revised. |
|
| |
IV. Concluding Remarks and Outlook
The resurgence of invisibles surplus since the 1990s has helped contain the current account deficit within a narrow corridor with surplus in intermittent years, despite the widening trade deficit. The persistence of current account surplus together with significant capital inflows, in turn, enabled further easing of payment restrictions on current and capital account transactions both for individuals and corporates. Another key feature of India’s invisibles account has been a significant rise in gross receipts and payments, particularly since 2002-03. The growth in invisibles receipt has been steady, while the growth in invisibles payment has varied from year to year. The strong growth in services exports, especially of software and information technology services, and remittances from overseas Indians has imparted stability to invisibles receipts. On the other hand, the growth in invisibles payment has been mainly led by interest payments relating to external debt, dividends/profits paid on foreign investment, and payments relating to technology related and business services with a growing demand for such services. Not only in absolute terms but also as a per cent of GDP, net invisibles have witnessed a significant improvement in recent years. Overall, a marked feature of India’s invisibles is the buoyant services exports particularly software services and business services, and private transfers which are characterised by a shift in the level as well as reduced volatility, providing stability to current receipts. The significanttechnological transformation of the Indian economy as well as the growth in skilled manpower has enabled this process. The continued leading position of India in software exports as well as transfer receipts during 2007 suggests that they are likely to remain important and stable sources of financial inflows during 2008, although the deepening of the global financial crisis will have some impact.
The deepening of the global financial crisis since mid-September 2008 already pushing many advanced economies – the US, Europe and Japan - officially into recession, many EMEs, including India, started experiencing the adverse impact through various channels. The impact is visible in terms of slowdown in both trade and capital flows with consequences for related services. Furthermore, the contraction in demand, both external and domestic, could lead to a moderation in the demand for other services. Apart from services, the decline in income of the migrant workers due to reduction in wages or job losses following recession could have implications for remittances flows. Furthermore, declining oil prices by reducing incomes of workers in the Gulf countries could also lead to reduced remittances flows to India. The fall in global interest rates, capital market crash and poor corporate performance may lead to a contraction in receipts and payments of investment income. Thus, the global financial and economic crisis will have some implications for India’s invisibles balance, which have historically helped in the containment of the current account deficit. |
| |
References
-
Apostolos Gkoutzinis (2005), “International Trade in Banking Services and the Role of the WTO: Discussing the Legal Framework and Policy Objectives of the General Agreement on Trade in Services and the Current State of Play in the Doha Round of Trade Negotiations” International Lawyer, Volume 39, No,4.
-
International Monetary Fund (1993), ‘Manual on Balance of Payments Statistics’, 5th edition.
-
Chami, R., A. Barajas, T. Cosimano, C. Fullenkamp, M. Gapen and P. Montiel (2008), ‘Macroeconomic Consequences of Remittances’, IMF Occasional Paper No.259.
-
NASSCOM (2009), ‘Strategic Review 2009- The IT-BPO Sector in India’.
-
Reserve Bank of India (2007), ‘Report of the Technical Group on Statistics for International Trade in Banking Services’.
-
Ratha, D., S. Mohapatra and Z. Xu (2008), “Outlook for Remittances 2008-10”, Development Prospects Group, Migration and Remittances Team, The World Bank, November.
-
United Nations (2002), ‘Manual on Statistics of International Trade in Services’.
-
World Bank (2007), ‘Global Development Finance – The Globalisation of Corporate Finance in Developing Countries’.
|
Statement 1: Invisibles by Category |
(US $ million) |
Items |
1999-00 |
2000-01 |
2001-02 |
2002-03 |
2003-04 |
2004-05 |
2005-06 |
2006-07 R |
2007-08 PR |
1 |
2 |
3 |
4 |
5 |
6 |
7 |
8 |
9 |
10 |
I. Invisibles Receipts (A+B+C) |
30,312 |
32,267 |
36,737 |
41,925 |
53,508 |
69,533 |
89,687 |
114,558 |
148,604 |
A. Services |
15,709 |
16,268 |
17,140 |
20,763 |
26,868 |
43,249 |
57,659 |
73,780 |
90,077 |
1) Travel |
3,036 |
3,497 |
3,137 |
3,312 |
5,037 |
6,666 |
7,853 |
9,123 |
11,349 |
2) Transportation |
1,707 |
2,046 |
2,161 |
2,536 |
3,207 |
4,683 |
6,325 |
7,974 |
10,014 |
3) Insurance |
231 |
270 |
288 |
369 |
419 |
870 |
1,062 |
1,195 |
1,639 |
4) GNIE |
582 |
651 |
518 |
293 |
240 |
401 |
314 |
253 |
330 |
5) Miscellaneous |
10,153 |
9,804 |
11,036 |
14,253 |
17,965 |
30,629 |
42,105 |
55,235 |
66,745 |
Of which: |
|
|
|
|
|
|
|
|
|
Software Services |
3,962 |
6,341 |
7,556 |
9,600 |
12,800 |
17,700 |
23,600 |
31,300 |
40,300 |
B. Transfers |
12,672 |
13,317 |
16,218 |
17,640 |
22,736 |
21,691 |
25,620 |
31,470 |
44,259 |
1) Official Transfers |
382 |
252 |
458 |
451 |
554 |
616 |
669 |
635 |
753 |
2)Private Transfers |
12,290 |
13,065 |
15,760 |
17,189 |
22,182 |
21,075 |
24,951 |
30,835 |
43,506 |
C. Income |
1,931 |
2,682 |
3,379 |
3,522 |
3,904 |
4,593 |
6,408 |
9,308 |
14,268 |
1) Investment Income |
1,783 |
2,554 |
3,254 |
3,405 |
3,774 |
4,124 |
6,229 |
8,926 |
13,808 |
2)Compensation of Employees |
148 |
128 |
125 |
117 |
130 |
469 |
179 |
382 |
460 |
II.Invisibles Payments (A+B+C ) |
17,169 |
22,473 |
21,763 |
24,890 |
25,707 |
38,301 |
47,685 |
62,341 |
74,012 |
A. Services |
11,645 |
14,576 |
13,816 |
17,120 |
16,724 |
27,823 |
34,489 |
44,311 |
52,512 |
1) Travel |
2,139 |
2,804 |
3,014 |
3,341 |
3,602 |
5,249 |
6,638 |
6,684 |
9,254 |
2) Transportation |
2,410 |
3,558 |
3,467 |
3,272 |
2,328 |
4,539 |
8,337 |
8,068 |
11,514 |
3) Insurance |
122 |
223 |
280 |
350 |
363 |
722 |
1,116 |
642 |
1,044 |
4) GNIE |
270 |
319 |
283 |
228 |
212 |
411 |
529 |
403 |
376 |
5) Miscellaneous |
6,704 |
7,672 |
6,772 |
9,929 |
10,219 |
16,902 |
17,869 |
28,514 |
30,324 |
Of which: |
|
|
|
|
|
|
|
|
|
Software Services |
138 |
591 |
672 |
737 |
476 |
800 |
1,338 |
2,267 |
3,058 |
B. Transfers |
34 |
211 |
362 |
802 |
574 |
906 |
933 |
1,391 |
2,315 |
1)Official Transfers |
0 |
0 |
0 |
0 |
0 |
356 |
475 |
381 |
514 |
2)Private Transfers |
34 |
211 |
362 |
802 |
574 |
550 |
458 |
1,010 |
1,801 |
C. Income |
5,490 |
7,686 |
7,585 |
6,968 |
8,409 |
9,572 |
12,263 |
16,639 |
19,185 |
1) Investment Income |
5,478 |
7,218 |
7,098 |
6,370 |
7,531 |
8,219 |
11,491 |
15,688 |
18,089 |
2) Compensation of Employees |
12 |
468 |
487 |
598 |
878 |
1,353 |
772 |
951 |
1,096 |
Net Invisibles (I-II) |
13,143 |
9,794 |
14,974 |
17,035 |
27,801 |
31,232 |
42,002 |
52,217 |
74,592 |
R : Revised PR : Partially Revised |
|
| |
Statement 2: Invisibles Receipts by Category of Transactions |
(US $ million) |
Items |
1999-00 |
2000-01 |
2001-02 |
2002-03 |
2003-04 |
2004-05 |
2005-06 |
2006-07 R |
2007-08 PR |
1 |
2 |
3 |
4 |
5 |
6 |
7 |
8 |
9 |
10 |
Invisibles Receipts (A+B+C) |
30,312 |
32,267 |
36,737 |
41,925 |
53,508 |
69,533 |
89,687 |
114,558 |
148,604 |
A) Services |
15,709 |
16,268 |
17,140 |
20,763 |
26,868 |
43,249 |
57,659 |
73,780 |
90,077 |
1) Travel Account |
|
|
|
|
|
|
|
|
|
i)Tourist Expenses in India |
3,036 |
3,497 |
3,137 |
3,312 |
5,037 |
6,666 |
7,853 |
9,123 |
11,349 |
Total |
3,036 |
3,497 |
3,137 |
3,312 |
5,037 |
6,666 |
7,853 |
9,123 |
11,349 |
2) Transportation Account |
|
|
|
|
|
|
|
|
|
a ) Sea Transport |
|
|
|
|
|
|
|
|
|
i) Surplus remitted by Indian companies operating abroad |
61 |
34 |
71 |
50 |
36 |
208 |
451 |
452 |
508 |
ii)Operating expenses of foreign companies in India |
161 |
87 |
103 |
145 |
289 |
462 |
638 |
924 |
773 |
iii)Charter hire charges |
42 |
99 |
85 |
83 |
94 |
48 |
144 |
97 |
207 |
b) Air Transport |
|
|
|
|
|
|
|
|
|
i)Surplus remitted by Indian companies operating abroad |
180 |
185 |
154 |
170 |
97 |
130 |
200 |
307 |
690 |
ii)Operating expenses of foreign companies in India |
20 |
22 |
10 |
5 |
18 |
107 |
37 |
83 |
155 |
iii)Charter hire charges |
24 |
4 |
18 |
5 |
18 |
20 |
21 |
35 |
42 |
c)Freight on exports |
1,065 |
1,458 |
1,476 |
1,815 |
2,470 |
3,660 |
4,407 |
5,481 |
6,921 |
d) Others |
154 |
157 |
244 |
263 |
185 |
48 |
427 |
595 |
718 |
Total (a to d) |
1,707 |
2,046 |
2,161 |
2,536 |
3,207 |
4,683 |
6,325 |
7,974 |
10,014 |
3) Insurance Account |
|
|
|
|
|
|
|
|
|
a)Insurance on export |
192 |
243 |
247 |
303 |
373 |
478 |
575 |
717 |
964 |
b)Premium |
|
|
|
|
|
|
|
|
|
i)Life |
1 |
1 |
5 |
21 |
0 |
25 |
37 |
64 |
98 |
ii)Non-life |
7 |
5 |
8 |
6 |
12 |
289 |
78 |
113 |
132 |
iii)Reinsurance from foreign companies |
10 |
4 |
8 |
16 |
9 |
19 |
200 |
82 |
184 |
c)Commission on Business received from foreign companies |
0 |
2 |
4 |
4 |
5 |
29 |
85 |
79 |
124 |
d)Others |
21 |
15 |
16 |
19 |
20 |
30 |
87 |
140 |
137 |
Total (a to d) |
231 |
270 |
288 |
369 |
419 |
870 |
1,062 |
1,195 |
1,639 |
4) Government Not Included Elsewhere |
|
|
|
|
|
|
|
|
|
a) Maintenance of foreign embassies and diplomatic missions in India |
205 |
222 |
195 |
178 |
185 |
229 |
208 |
139 |
197 |
b) Maintenance of international and regional institutions in India |
377 |
429 |
323 |
115 |
55 |
172 |
106 |
114 |
133 |
Total (a to b) |
582 |
651 |
518 |
293 |
240 |
401 |
314 |
253 |
330 |
5) Miscellaneous Account |
|
|
|
|
|
|
|
|
|
a) Communication services |
1,064 |
1,138 |
752 |
812 |
990 |
1,384 |
1,575 |
2,262 |
2,408 |
b) Construction services |
389 |
536 |
144 |
178 |
458 |
491 |
242 |
700 |
763 |
c) Financial services |
361 |
347 |
292 |
676 |
299 |
512 |
1,209 |
3,106 |
3,217 |
d) Software services |
3,962 |
6,341 |
7,556 |
9,600 |
12,800 |
17,700 |
23,600 |
31,300 |
40,300 |
of which: IT Services |
3,397 |
5,411 |
6,061 |
7,100 |
9,200 |
13,100 |
17,300 |
22,900 |
29,400 |
ITES-BPO |
565 |
930 |
1,495 |
2,500 |
3,600 |
4,600 |
6,300 |
8,400 |
10,900 |
e) News agency services |
342 |
114 |
9 |
59 |
69 |
171 |
185 |
334 |
503 |
f) Royalties, copyright and license fees |
54 |
60 |
22 |
23 |
32 |
71 |
191 |
97 |
157 |
|
| |
Statement 2: Invisibles Receipts by Category of Transactions (Contd.) |
(US $ million) |
Items |
1999-00 |
2000-01 |
2001-02 |
2002-03 |
2003-04 |
2004-05 |
2005-06 |
2006-07 R |
2007-08 PR |
1 |
2 |
3 |
4 |
5 |
6 |
7 |
8 |
9 |
10 |
g) Business services (i to xii)$ |
643 |
334 |
519 |
807 |
1,296 |
5,167 |
9,307 |
14,544 |
16,771 |
i) Merchanting services |
|
|
|
|
|
278 |
389 |
239 |
417 |
ii)Trade related services |
|
|
|
|
|
429 |
521 |
1,325 |
2,233 |
iii)Operational Leasing Services |
|
|
|
|
|
28 |
107 |
101 |
475 |
iv) Legal services |
|
|
|
|
|
257 |
277 |
605 |
702 |
v)Accounting / Auditing services |
|
|
|
|
|
38 |
68 |
176 |
228 |
vi)Business Management & Consultancy services |
643 |
334 |
519 |
807 |
1,296 |
1,556 |
2,320 |
4,476 |
4,433 |
vii)Advertising/ trade fair |
|
|
|
|
|
162 |
342 |
694 |
712 |
viii)Research & Development services |
|
|
|
|
|
221 |
395 |
760 |
1,335 |
ix)Architectural Engineering & other technical services |
|
|
|
|
|
1,417 |
3,193 |
3,457 |
3,144 |
x)Agricultural Mining &
on-site processing services |
|
|
|
|
|
52 |
32 |
46 |
57 |
xi)Maintenance of offices abroad services |
|
|
|
|
|
724 |
1,577 |
2,638 |
2,861 |
xii) Environmental services |
|
|
|
|
|
5 |
86 |
27 |
174 |
h)Personal, Cultural & Recreational services |
|
|
|
|
|
105 |
189 |
243 |
562 |
i)Refunds/rebates |
53 |
52 |
54 |
44 |
51 |
380 |
75 |
293 |
337 |
j)Other services$$ |
3,285 |
882 |
1,688 |
2,054 |
1,970 |
4,648 |
5,532 |
2,357 |
1,726 |
Total (a to j) |
10,153 |
9,804 |
11,036 |
14,253 |
17,965 |
30,629 |
42,105 |
55,235 |
66,745 |
B) Transfers |
12,672 |
13,317 |
16,218 |
17,640 |
22,736 |
21,691 |
25,620 |
31,470 |
44,259 |
1) Official Transfers |
|
|
|
|
|
|
|
|
|
i)Donations received from Non-residents |
40 |
85 |
44 |
32 |
90 |
63 |
53 |
61 |
67 |
ii)Grant under PL 480 II |
96 |
97 |
68 |
58 |
33 |
30 |
38 |
31 |
28 |
iii) Grants from other Governments |
246 |
70 |
346 |
361 |
431 |
523 |
578 |
543 |
658 |
Total (i to iii) |
382 |
252 |
458 |
451 |
554 |
616 |
669 |
635 |
753 |
2) Private Transfers |
|
|
|
|
|
|
|
|
|
i)Inward remittance from Indian workers abroad for family maintenance etc. |
7,423 |
7,747 |
6,578 |
9,914 |
10,379 |
9,973 |
10,455 |
14,740 |
21,920 |
ii)Local withdrawals/ redemptions from non-resident deposits |
4,120 |
4,727 |
8,546 |
6,644 |
10,585 |
8,907 |
12,454 |
13,208 |
18,919 |
iii)Gold and silver brought through passenger baggage |
13 |
10 |
13 |
18 |
19 |
27 |
16 |
27 |
26 |
iv)Personal gifts/donations to charitable/religious institutions in India. |
734 |
581 |
623 |
613 |
1,199 |
2,168 |
2,026 |
2,860 |
2,641 |
Total (i to iv) |
12,290 |
13,065 |
15,760 |
17,189 |
22,182 |
21,075 |
24,951 |
30,835 |
43,506 |
C) Income Account |
1,931 |
2,682 |
3,379 |
3,522 |
3,904 |
4,593 |
6,408 |
9,308 |
14,268 |
1) Compensation of Employees |
|
|
|
|
|
|
|
|
|
i)Wages received by Indians working on foreign contracts |
148 |
128 |
125 |
117 |
130 |
469 |
179 |
382 |
460 |
|
| |
Statement 2: Invisibles Receipts by Category of Transactions (Concld.) |
(US $ million) |
Items |
1999-00 |
2000-01 |
2001-02 |
2002-03 |
2003-04 |
2004-05 |
2005-06 |
2006-07 R |
2007-08 PR |
1 |
2 |
3 |
4 |
5 |
6 |
7 |
8 |
9 |
10 |
2) Investment Income |
|
|
|
|
|
|
|
|
|
i)Interest received on loans to Non-residents |
59 |
84 |
201 |
154 |
198 |
65 |
101 |
163 |
1,466 |
ii)Dividend/profit received by Indians on foreign investment |
16 |
11 |
57 |
34 |
40 |
92 |
225 |
450 |
476 |
Of which: |
|
|
|
|
|
|
|
|
|
Dividend received by Indians on foreign investment |
# |
# |
# |
# |
# |
44 |
28 |
137 |
131 |
Profit received by Indians on foreign investment |
# |
# |
# |
# |
# |
48 |
197 |
313 |
345 |
iii)Reinvested Earning |
0 |
340 |
700 |
1,104 |
552 |
248 |
1,092 |
1,076 |
1,084 |
iv)Interest received on debentures, FRNs, CPs, fixed deposits and funds held abroad by ADs out of foreign currency loans/ export proceeds |
11 |
18 |
13 |
14 |
31 |
182 |
104 |
64 |
106 |
v)Interest received on overdraft of VOSTRO accounts of foreign correspondents/ branches by the ADs |
10 |
6 |
30 |
40 |
95 |
333 |
110 |
262 |
227 |
vi)Payment of taxes by the Non-residents/refund of taxes by foreign governments to Indians |
195 |
70 |
131 |
21 |
157 |
173 |
58 |
257 |
321 |
vii)Interest/discount earnings etc. earnings on RBI investment |
1,383 |
1,950 |
1,757 |
1,835 |
2,115 |
3,014 |
4,519 |
6,641 |
10,124 |
viii)Interest/remuneration on SDR holdings |
9 |
8 |
7 |
13 |
10 |
17 |
20 |
13 |
4 |
ix)Others |
100 |
67 |
358 |
190 |
576 |
0 |
0 |
0 |
0 |
Total ( i to ix) |
1,783 |
2,554 |
3,254 |
3,405 |
3,774 |
4,124 |
6,229 |
8,926 |
13,808 |
|
| |
Statement 3: Invisibles Payments by Category of Transactions |
| (US $ million) |
Items |
1999-00 |
2000-01 |
2001-02 |
2002-03 |
2003-04 |
2004-05 |
2005-06 |
2006-07 R |
2007-08 PR |
1 |
2 |
3 |
4 |
5 |
6 |
7 |
8 |
9 |
10 |
Invisibles Payments (A+B+C ) |
17,169 |
22,473 |
21,763 |
24,890 |
25,707 |
38,301 |
47,685 |
62,341 |
74,012 |
A) Services |
11,645 |
14,576 |
13,816 |
17,120 |
16,724 |
27,823 |
34,489 |
44,311 |
52,512 |
1) Travel Account |
|
|
|
|
|
|
|
|
|
i)Business |
1,268 |
1,586 |
1,471 |
1,987 |
2,712 |
3,222 |
3,452 |
2,822 |
3,297 |
ii)Health Related |
3 |
4 |
4 |
4 |
6 |
14 |
38 |
13 |
17 |
iii)Education Related |
61 |
95 |
249 |
169 |
237 |
642 |
1,114 |
1,105 |
2,827 |
iv)Basic Travel Quota ( BTQ) |
379 |
381 |
518 |
796 |
449 |
1,164 |
1,240 |
1,800 |
1,967 |
v)Pilgrimage |
137 |
187 |
113 |
125 |
16 |
31 |
27 |
117 |
88 |
vi)Others |
291 |
551 |
659 |
260 |
182 |
176 |
767 |
827 |
1,058 |
Total (i to vi) |
2,139 |
2,804 |
3,014 |
3,341 |
3,602 |
5,249 |
6,638 |
6,684 |
9,254 |
2)Transportation Account |
|
|
|
|
|
|
|
|
|
a)Sea Transport |
|
|
|
|
|
|
|
|
|
i)Surplus remitted by Foreign companies operating in India |
387 |
408 |
474 |
330 |
148 |
1,009 |
1,636 |
1,913 |
1,663 |
ii)Operating expenses of Indian companies abroad |
406 |
831 |
446 |
505 |
364 |
333 |
1,005 |
551 |
901 |
iii)Charter hire charges |
116 |
157 |
112 |
111 |
100 |
87 |
83 |
84 |
148 |
iv)Freight on imports |
@ |
@ |
@ |
@ |
@ |
876 |
1,504 |
1,347 |
2,952 |
v)Freight on exports |
.. |
.. |
.. |
.. |
.. |
519 |
581 |
710 |
779 |
vi)Remittance of passage booking abroad |
# |
# |
# |
# |
# |
26 |
12 |
5 |
4 |
b)Air Transport |
|
|
|
|
|
|
|
|
|
i)Surplus remitted by Foreign companies operating in India |
821 |
1,236 |
1,362 |
1,410 |
652 |
1,147 |
2,194 |
1,835 |
2,637 |
ii)Operating expenses of Indian companies abroad |
134 |
98 |
111 |
112 |
132 |
102 |
286 |
240 |
565 |
iii)Charter hire charges |
75 |
73 |
70 |
82 |
60 |
48 |
141 |
239 |
513 |
iv)Freight on imports |
@ |
@ |
@ |
@ |
@ |
118 |
125 |
176 |
555 |
v) Freight on exports |
.. |
.. |
.. |
.. |
.. |
59 |
41 |
32 |
27 |
vi)Remittance of passage booking abroad |
# |
# |
# |
# |
# |
31 |
8 |
13 |
25 |
c.Freight on imports |
304 |
647 |
732 |
600 |
763 |
@@ |
@@ |
@@ |
@@ |
d.Remittance of passage booking abroad |
24 |
12 |
29 |
17 |
11 |
## |
## |
## |
## |
e.Others |
143 |
96 |
131 |
105 |
98 |
184 |
721 |
923 |
745 |
Total (a to e) |
2,410 |
3,558 |
3,467 |
3,272 |
2,328 |
4,539 |
8,337 |
8,068 |
11,514 |
3) Insurance Account |
|
|
|
|
|
|
|
|
|
a.Premium |
|
|
|
|
|
|
|
|
|
i)Life |
1 |
0 |
0 |
0 |
1 |
10 |
15 |
28 |
102 |
ii)Non-life |
10 |
9 |
25 |
5 |
10 |
336 |
243 |
82 |
128 |
iii)Reinsurance |
76 |
180 |
178 |
295 |
266 |
299 |
581 |
382 |
567 |
b.Commission on Business |
6 |
0 |
3 |
0 |
0 |
12 |
28 |
23 |
27 |
c.Others |
29 |
34 |
74 |
50 |
86 |
65 |
249 |
127 |
220 |
Total (a to c) |
122 |
223 |
280 |
350 |
363 |
722 |
1,116 |
642 |
1,044 |
4)Government Not Included Elsewhere |
|
|
|
|
|
|
|
|
|
a. Maintenance of Indian embassies and diplomatic missions abroad |
237 |
262 |
209 |
195 |
186 |
339 |
445 |
285 |
273 |
b.Remittances by foreign embassies and missions in India |
33 |
57 |
74 |
33 |
26 |
72 |
84 |
118 |
103 |
Total (a to b) |
270 |
319 |
283 |
228 |
212 |
411 |
529 |
403 |
376 |
|
| |
Statement 3: Invisibles Payments by Category of Transactions (Contd.) |
| (US $ million) |
Items |
1999-00 |
2000-01 |
2001-02 |
2002-03 |
2003-04 |
2004-05 |
2005-06 |
2006-07 R |
2007-08 PR |
1 |
2 |
3 |
4 |
5 |
6 |
7 |
8 |
9 |
10 |
5)Miscellaneous Account |
|
|
|
|
|
|
|
|
|
a)Communication services |
190 |
127 |
370 |
965 |
772 |
738 |
289 |
796 |
859 |
b)Construction services |
51 |
166 |
517 |
1,326 |
655 |
716 |
723 |
737 |
758 |
c)Financial services |
1,632 |
1,973 |
1,264 |
1,388 |
700 |
832 |
965 |
2,991 |
3,138 |
d)Software services |
138 |
591 |
672 |
737 |
476 |
800 |
1,338 |
2,267 |
3,058 |
e)News agency services |
90 |
256 |
163 |
232 |
235 |
281 |
130 |
226 |
326 |
f)Royalties, copyright and license fees |
311 |
235 |
361 |
352 |
444 |
712 |
594 |
1,030 |
1,088 |
g)Business services (i to xii)$ |
1,152 |
1,022 |
1,501 |
1,812 |
2,550 |
7,318 |
7,748 |
15,866 |
16,715 |
i) Merchanting services |
|
|
|
|
|
235 |
123 |
295 |
716 |
ii)Trade related services |
|
|
|
|
|
1,052 |
1,207 |
1,801 |
2,285 |
iii)Operational Leasing Services |
|
|
|
|
|
355 |
462 |
941 |
1,154 |
iv) Legal services |
|
|
|
|
|
73 |
82 |
161 |
402 |
v) Accounting / Auditing services |
|
|
|
|
|
13 |
20 |
58 |
69 |
vi)Business management & Consultancy services |
795 |
546 |
533 |
648 |
814 |
1,279 |
1,806 |
3,486 |
3,653 |
vii) Advertising/ trade fair |
|
|
|
|
|
514 |
420 |
1,786 |
1,302 |
viii)Research& Development services |
|
|
|
|
|
57 |
116 |
201 |
405 |
ix)Architectural Engineering & other technical services |
|
|
|
|
|
1,111 |
1,414 |
3,025 |
3,173 |
x) Agricultural Mining & on-site processing services |
|
|
|
|
|
7 |
15 |
74 |
50 |
xi) Maintenance of offices abroad services |
357 |
476 |
968 |
1,164 |
1,736 |
2,618 |
2,074 |
4,032 |
3,496 |
xii) Environmental services |
|
|
|
|
|
4 |
9 |
6 |
9 |
h) Personal, Cultural & Recreational services |
|
|
|
|
|
102 |
84 |
117 |
199 |
i) Refunds/rebates |
89 |
64 |
150 |
152 |
365 |
762 |
45 |
365 |
525 |
j) Other services$$ |
3,051 |
3,238 |
1,774 |
2,965 |
4,022 |
4,641 |
5,953 |
4,119 |
3,658 |
Total (a to j) |
6,704 |
7,672 |
6,772 |
9,929 |
10,219 |
16,902 |
17,869 |
28,514 |
30,324 |
B) Transfers |
34 |
211 |
362 |
802 |
574 |
906 |
933 |
1,391 |
2,315 |
1) Official Transfers |
|
|
|
|
|
|
|
|
|
i) Grants/donations from official sector |
0 |
0 |
0 |
0 |
0 |
356 |
475 |
381 |
514 |
Total |
0 |
0 |
0 |
0 |
0 |
356 |
475 |
381 |
514 |
2) Private Transfers |
|
|
|
|
|
|
|
|
|
i) Remittance by Non-residents towards family maintenance and savings |
29 |
124 |
292 |
757 |
522 |
421 |
354 |
823 |
1,585 |
ii) Personal gifts/donations to charitable/religious institutions |
5 |
87 |
70 |
45 |
52 |
129 |
104 |
187 |
216 |
Of which: |
|
|
|
|
|
|
|
|
|
iii) Remittance towards personal gifts and donations |
|
|
|
|
|
108 |
96 |
157 |
182 |
iv) Remittance towards donations to religious & charitable institutions abroad |
|
|
|
|
|
17 |
7 |
18 |
24 |
v) Remittance towards grants and donations to other governments & charitable institutions established by the governments |
|
|
|
|
|
4 |
1 |
12 |
10 |
Total (i to v) |
34 |
211 |
362 |
802 |
574 |
550 |
458 |
1,010 |
1,801 |
|
| |
Statement 3: Invisibles Payments by Category of Transactions (Concld.) |
(US $ million) |
Items |
1999-00 |
2000-01 |
2001-02 |
2002-03 |
2003-04 |
2004-05 |
2005-06 |
2006-07 R |
2007-08 PR |
1 |
2 |
3 |
4 |
5 |
6 |
7 |
8 |
9 |
10 |
C) Income |
5,490 |
7,686 |
7,585 |
6,968 |
8,409 |
9,572 |
12,263 |
16,639 |
19,185 |
a) Compensation of Employees |
|
|
|
|
|
|
|
|
|
i)Payment of wages/ salary to Non-residents working in India |
12 |
468 |
487 |
598 |
878 |
1,353 |
772 |
951 |
1,096 |
Total |
12 |
468 |
487 |
598 |
878 |
1,353 |
772 |
951 |
1,096 |
b)Investment Income |
|
|
|
|
|
|
|
|
|
i)Payment of interest on NRI deposits |
1,742 |
1,811 |
1,808 |
1,413 |
1,642 |
1,353 |
1,497 |
1,969 |
1,815 |
ii)Payment of interest on loans from Non-residents |
3,037 |
2,930 |
2,855 |
2,594 |
3,469 |
2,450 |
4,320 |
3,792 |
5,070 |
iii)Payment of dividend/profit to Non-resident share holders |
537 |
1,047 |
712 |
462 |
878 |
1,991 |
2,502 |
3,486 |
3,576 |
Of which: |
|
|
|
|
|
|
|
|
|
Payment of dividend to Non-resident share holder |
|
|
|
|
|
1,578 |
2,400 |
3,235 |
3,348 |
Payment of profit to Non-resident share holder |
|
|
|
|
|
413 |
102 |
251 |
228 |
iv) Reinvested Earning |
0 |
1,352 |
1,644 |
1,832 |
1,460 |
1,904 |
2,760 |
5,828 |
7,168 |
v)Payment of interest on
debentures, FRNs, CPs, fixed deposits, Government securities etc. |
119 |
60 |
23 |
43 |
42 |
170 |
100 |
35 |
57 |
vi)Charges on SDRs |
30 |
16 |
52 |
20 |
16 |
19 |
17 |
30 |
21 |
vii) Interest paid on overdraft on VOSTRO a/c Holders/ OD on NOSTRO a/c |
0 |
0 |
0 |
4 |
20 |
255 |
212 |
406 |
236 |
ix)Payment of taxes by the Indians/refund of taxes by government to Non-residents |
13 |
2 |
4 |
2 |
4 |
77 |
83 |
142 |
146 |
Total (i to ix) |
5,478 |
7,218 |
7,098 |
6,370 |
7,531 |
8,219 |
11,491 |
15,688 |
18,089 |
PR : Partially Revised.
@ : For the period prior to 2004-05, the break up of ‘freight on imports’ between the sea transport and the air transport is not
separately available. Therefore, these have been included under the head ‘freight on imports’.
+ : The category ‘freight on exports’ was introduced in 2004-05 with a view to improve the data coverage.
# : For the period prior to 2004-05, the break up between the sea transport and the air transport is not separately available.
Therefore, these have been included under the head ‘remittance on passage booking abroad’.
@@ : Included under the heads ‘sea transport’ and ‘air transport’.
## : Included under the heads ‘sea transport’ and ‘air transport’.
$ : These new categories of services are available since 2004-05 as the reporting system was put in place to record such
transactions.
$$ : Till 2003-04, others included advertising, rentals, office maintenance, prizes, exhibitions & other services not included
elsewhere. |
|
| |
Statement 4: Invisibles by Category |
| (Rs. crore) |
Items |
1999-00 |
2000-01 |
2001-02 |
2002-03 |
2003-04 |
2004-05 |
2005-06 |
2006-07 R |
2007-08 PR |
1 |
2 |
3 |
4 |
5 |
6 |
7 |
8 |
9 |
10 |
I.Invisibles Receipts (A+B+C) |
1,31,449 |
1,47,778 |
1,75,108 |
2,02,757 |
2,45,413 |
3,11,550 |
3,97,660 |
5,17,146 |
5,96,954 |
A.Services |
68,137 |
74,555 |
81,739 |
1,00,419 |
1,23,175 |
1,93,711 |
2,55,668 |
3,33,093 |
3,61,932 |
1)Travel |
13,166 |
16,064 |
14,975 |
15,991 |
23,054 |
29,858 |
34,871 |
41,127 |
45,524 |
2)Transportation |
7,400 |
9,364 |
10,326 |
12,261 |
14,714 |
21,021 |
28,023 |
36,049 |
40,200 |
3)Insurance |
1,004 |
1,234 |
1,374 |
1,783 |
1,922 |
3,913 |
4,694 |
5,403 |
6,587 |
4)GNIE |
2,523 |
2,986 |
2,467 |
1,417 |
1,105 |
1,797 |
1,396 |
1,143 |
1,330 |
5)Miscellaneous |
44,044 |
44,907 |
52,597 |
68,967 |
82,380 |
1,37,122 |
1,86,684 |
2,49,371 |
2,68,291 |
Of which: |
|
|
|
|
|
|
|
|
|
Software Services |
17,412 |
29,013 |
36,038 |
46,424 |
58,781 |
79,404 |
1,04,632 |
1,41,356 |
1,62,020 |
B.Transfers |
54,939 |
60,948 |
77,289 |
85,289 |
1,04,329 |
97,201 |
1,13,566 |
1,42,037 |
1,77,737 |
1)Official Transfers |
1,659 |
1,156 |
2,197 |
2,174 |
2,531 |
2,762 |
2,970 |
2,864 |
3,025 |
2)Private Transfers |
53,280 |
59,792 |
75,092 |
83,115 |
1,01,798 |
94,439 |
1,10,596 |
1,39,173 |
1,74,712 |
C.Income |
8,373 |
12,275 |
16,080 |
17,049 |
17,909 |
20,638 |
28,426 |
42,016 |
57,285 |
1)Investment Income |
7,727 |
11,690 |
15,487 |
16,484 |
17,314 |
18,538 |
27,633 |
40,297 |
55,438 |
2)Compensation of Employees |
646 |
585 |
593 |
565 |
595 |
2,100 |
793 |
1,719 |
1,847 |
II.Invisibles Payments (A+B+C ) |
74,421 |
1,02,639 |
1,03,727 |
1,20,400 |
1,18,044 |
1,71,959 |
2,11,733 |
2,81,567 |
2,97,336 |
A.Services |
50,467 |
66,650 |
65,850 |
82,775 |
76,794 |
1,24,880 |
1,53,057 |
2,00,029 |
2,10,873 |
1)Travel |
9,268 |
12,741 |
14,336 |
16,155 |
16,534 |
23,571 |
29,432 |
30,249 |
37,173 |
2)Transportation |
10,450 |
16,172 |
16,486 |
15,828 |
10,688 |
20,363 |
36,928 |
36,504 |
46,277 |
3)Insurance |
525 |
1,004 |
1,339 |
1,687 |
1,672 |
3,249 |
4,965 |
2,903 |
4,194 |
4)GNIE |
1,167 |
1,460 |
1,349 |
1,105 |
976 |
1,843 |
2,343 |
1,825 |
1,520 |
5)Miscellaneous |
29,057 |
35,273 |
32,340 |
48,000 |
46,924 |
75,854 |
79,389 |
1,28,548 |
1,21,709 |
Of which: |
|
|
|
|
|
|
|
|
|
Software Services |
1,600 |
2,705 |
3,202 |
3,565 |
2,175 |
3,579 |
5,954 |
10,212 |
12,299 |
B.Transfers |
150 |
981 |
1,729 |
3,886 |
2,633 |
4,066 |
4,134 |
6,288 |
9,290 |
1)Official Transfers |
2 |
0 |
0 |
0 |
0 |
1,598 |
2,103 |
1,723 |
2,073 |
2) Private Transfers |
148 |
981 |
1,729 |
3,886 |
2,633 |
2,468 |
2,031 |
4,565 |
7,217 |
C. Income |
23,804 |
35,008 |
36,148 |
33,739 |
38,617 |
43,013 |
54,542 |
75,250 |
77,173 |
1)Investment Income |
23,747 |
32,885 |
33,830 |
30,847 |
34,586 |
36,947 |
51,112 |
70,955 |
72,769 |
2)Compensation of Employees |
57 |
2,123 |
2,318 |
2,892 |
4,031 |
6,066 |
3,430 |
4,295 |
4,404 |
Net Invisibles (I-II) |
57,028 |
45,139 |
71,381 |
82,357 |
1,27,369 |
1,39,591 |
1,85,927 |
2,35,579 |
2,99,618 |
R : Revised. PR : Partially Revised. |
|
| |
Statement 5: Invisibles Receipts by Category of Transactions |
| (Rs. crore) |
Items |
1999-00 |
2000-01 |
2001-02 |
2002-03 |
2003-04 |
2004-05 |
2005-06 |
2006-07 R |
2007-08 PR |
1 |
2 |
3 |
4 |
5 |
6 |
7 |
8 |
9 |
10 |
Invisibles Receipts (A+B+C) |
1,31,449 |
1,47,778 |
1,75,108 |
2,02,757 |
2,45,413 |
3,11,550 |
3,97,660 |
5,17,146 |
5,96,954 |
A)Services |
68,137 |
74,555 |
81,739 |
1,00,419 |
1,23,175 |
1,93,711 |
2,55,668 |
3,33,093 |
3,61,932 |
1)Travel Account |
|
|
|
|
|
|
|
|
|
i)Tourist Expenses in India |
13,166 |
16,064 |
14,975 |
15,991 |
23,054 |
29,858 |
34,871 |
41,127 |
45,524 |
Total |
13,166 |
16,064 |
14,975 |
15,991 |
23,054 |
29,858 |
34,871 |
41,127 |
45,524 |
2) Transportation Account |
|
|
|
|
|
|
|
|
|
a) Sea Transport |
|
|
|
|
|
|
|
|
|
i)Surplus remitted by Indian companies operating abroad |
262 |
157 |
344 |
241 |
170 |
932 |
2,000 |
2,038 |
2,040 |
ii)Operating expenses of foreign companies in India |
696 |
398 |
495 |
695 |
1,325 |
2,075 |
2,824 |
4,181 |
3,105 |
iii)Charter hire charges |
181 |
453 |
407 |
401 |
433 |
217 |
637 |
435 |
833 |
b)Air Transport |
|
|
|
|
|
|
|
|
|
i)Surplus remitted by Indian companies operating abroad |
781 |
851 |
739 |
820 |
444 |
589 |
885 |
1,389 |
2,751 |
ii)Operating expenses of foreign companies in India |
87 |
94 |
44 |
21 |
84 |
479 |
165 |
375 |
625 |
iii)Charter hire charges |
103 |
19 |
85 |
21 |
81 |
82 |
93 |
156 |
167 |
c)Freight on exports |
4,617 |
6,670 |
7,053 |
8,775 |
11,329 |
16,445 |
19,524 |
24,791 |
27,796 |
d)Others |
673 |
722 |
1,159 |
1,287 |
848 |
202 |
1,895 |
2,684 |
2,883 |
Total (a to d) |
7,400 |
9,364 |
10,326 |
12,261 |
14,714 |
21,021 |
28,023 |
36,049 |
40,200 |
3) Insurance Account |
|
|
|
|
|
|
|
|
|
a)Insurance on export |
832 |
1,111 |
1,179 |
1,466 |
1,711 |
2,148 |
2,548 |
3,243 |
3,874 |
b)Premium |
|
|
|
|
|
|
|
|
|
i)Life |
3 |
4 |
26 |
101 |
3 |
114 |
166 |
294 |
393 |
ii)Non-life |
31 |
24 |
32 |
28 |
54 |
1,302 |
346 |
514 |
534 |
iii) Reinsurance from foreign companies |
43 |
18 |
40 |
76 |
40 |
87 |
876 |
366 |
737 |
c)Commission on Business received from foreign companies |
2 |
7 |
15 |
18 |
23 |
131 |
375 |
358 |
501 |
d)Others |
93 |
70 |
82 |
94 |
91 |
131 |
383 |
628 |
548 |
Total (a to d) |
1,004 |
1,234 |
1,374 |
1,783 |
1,922 |
3,913 |
4,694 |
5,403 |
6,587 |
4) Government Not Included Elsewhere |
|
|
|
|
|
|
|
|
|
a)Maintenance of foreign embassies and diplomatic missions in India |
887 |
1,019 |
935 |
860 |
850 |
1,025 |
923 |
625 |
795 |
b) Maintenance of international and regional institutions in India |
1,636 |
1,967 |
1,532 |
557 |
255 |
772 |
473 |
518 |
535 |
Total (a to b) |
2,523 |
2,986 |
2,467 |
1,417 |
1,105 |
1,797 |
1,396 |
1,143 |
1,330 |
5) Miscellaneous Account |
|
|
|
|
|
|
|
|
|
a) Communication services |
4,601 |
5,262 |
3,585 |
3,931 |
4,535 |
6,191 |
7,000 |
10,227 |
9,683 |
b) Construction services |
1,691 |
2,430 |
696 |
863 |
2,097 |
2,184 |
1,074 |
3,156 |
3,071 |
c) Financial services |
1,569 |
1,577 |
1,387 |
3,276 |
1,372 |
2,279 |
5,355 |
14,010 |
12,918 |
d)Software services |
17,412 |
29,013 |
36,038 |
46,424 |
58,781 |
79,404 |
1,04,632 |
1,41,356 |
1,62,020 |
of which: IT Services |
14,929 |
24,758 |
28,908 |
34,334 |
42,249 |
58,768 |
76,667 |
1,03,484 |
1,18,198 |
ITES-BPO |
2,483 |
4,255 |
7,130 |
12,090 |
16,532 |
20,636 |
27,965 |
37,872 |
43,822 |
e) News agency services |
1,485 |
511 |
43 |
284 |
321 |
769 |
818 |
1,509 |
2,035 |
f) Royalties, copyright and license fees |
237 |
272 |
104 |
111 |
146 |
316 |
862 |
435 |
631 |
|
| |
Statement 5: Invisibles Receipts by Category of Transactions (Contd.) |
| (Rs. crore) |
Items |
1999-00 |
2000-01 |
2001-02 |
2002-03 |
2003-04 |
2004-05 |
2005-06 |
2006-07
R |
2007-08 PR |
1 |
2 |
3 |
4 |
5 |
6 |
7 |
8 |
9 |
10 |
g) Business services (1 to 12)$ |
2,790 |
1,522 |
2,464 |
3,890 |
5,937 |
23,067 |
41,356 |
65,738 |
67,424 |
i) Merchanting services |
|
|
|
|
|
1,248 |
1,725 |
1,071 |
1,676 |
ii) Trade related services |
|
|
|
|
|
1,923 |
2,310 |
5,960 |
8,976 |
iii)Operational Leasing Services |
|
|
|
|
|
123 |
476 |
451 |
1,909 |
iv) Legal services |
|
|
|
|
|
1,126 |
1,230 |
2,736 |
2,822 |
v) Accounting / Auditing services |
|
|
|
|
|
170 |
302 |
795 |
918 |
vi)Business Management & Consultancy services |
2,790 |
1,522 |
2,464 |
3,890 |
5,937 |
6,955 |
10,285 |
20,231 |
17,819 |
vii)Advertising/ trade fair |
|
|
|
|
|
726 |
1,528 |
3,122 |
2,862 |
viii) Research & Development services |
|
|
|
|
|
985 |
1,754 |
3,430 |
5,364 |
ix)Architectural Engineering & other technical services |
|
|
|
|
|
6,325 |
14,163 |
15,678 |
12,649 |
x)Agricultural Mining &
on-site processing services |
|
|
|
|
|
236 |
143 |
217 |
229 |
xi) Maintenance of offices abroad services |
|
|
|
|
|
3,227 |
7,051 |
11,924 |
11,500 |
xii) Environmental services |
|
|
|
|
|
23 |
389 |
125 |
700 |
h)Personal, Cultural & Recreational services |
|
|
|
|
|
466 |
838 |
1,094 |
2,259 |
i) Refunds/rebates |
231 |
238 |
258 |
213 |
234 |
1,716 |
332 |
1,312 |
1,354 |
j)Other services$$ |
14,028 |
4,082 |
8,022 |
9,975 |
8,957 |
20,730 |
24,417 |
10,532 |
6,896 |
Total (a to j) |
44,044 |
44,907 |
52,597 |
68,967 |
82,380 |
1,37,122 |
1,86,684 |
2,49,371 |
2,68,291 |
B) Transfers |
54,939 |
60,948 |
77,289 |
85,289 |
1,04,329 |
97,201 |
1,13,566 |
1,42,037 |
1,77,737 |
1) Official Transfers |
|
|
|
|
|
|
|
|
|
i) Donations received from Non-residents |
174 |
393 |
211 |
156 |
413 |
256 |
236 |
281 |
271 |
ii) Grant under PL 480 II |
414 |
439 |
323 |
280 |
153 |
135 |
169 |
142 |
113 |
iii) Grants from other Governments |
1,071 |
324 |
1,663 |
1,738 |
1,965 |
2,371 |
2,565 |
2,441 |
2,641 |
Total (i to iii) |
1,659 |
1,156 |
2,197 |
2,174 |
2,531 |
2,762 |
2,970 |
2,864 |
3,025 |
2) Private Transfers |
|
|
|
|
|
|
|
|
|
i) Inward remittance from Indian workers abroad for family maintenance etc. |
32,192 |
35,507 |
31,361 |
47,915 |
47,648 |
44,559 |
46,290 |
73,518 |
93,358 |
ii) Local withdrawals/ redemptions from non-resident deposits |
17,849 |
21,577 |
40,654 |
32,147 |
48,565 |
40,105 |
55,269 |
59,594 |
75,968 |
iii) Gold and silver brought through passenger baggage |
57 |
44 |
61 |
89 |
86 |
118 |
69 |
121 |
106 |
iv) Personal gifts/donations to charitable/religious institutions in India. |
3,182 |
2,664 |
3,016 |
2,964 |
5,499 |
9,657 |
8,968 |
5,940 |
5,280 |
Total (i to iv) |
53,280 |
59,792 |
75,092 |
83,115 |
101,798 |
94,439 |
1,10,596 |
1,39,173 |
1,74,712 |
C) Income Account |
8,373 |
12,275 |
16,080 |
17,049 |
17,909 |
20,638 |
28,426 |
42,016 |
57,285 |
1) Compensation of Employees |
|
|
|
|
|
|
|
|
|
i)Wages received by Indians working on foreign contracts |
646 |
585 |
593 |
565 |
595 |
2,100 |
793 |
1,719 |
1,847 |
|
| |
|
Statement 5: Invisibles Receipts by Category of Transactions (Concld.) |
| (Rs. crore) |
Items |
1999-00 |
2000-01 |
2001-02 |
2002-03 |
2003-04 |
2004-05 |
2005-06 |
2006-07 R |
2007-08 PR |
1 |
2 |
3 |
4 |
5 |
6 |
7 |
8 |
9 |
10 |
2) Investment Income |
|
|
|
|
|
|
|
|
|
i)Interest received on loans to Non-residents |
256 |
384 |
959 |
745 |
910 |
293 |
449 |
739 |
5,882 |
ii)Dividend/profit received by Indians on foreign investment |
68 |
54 |
273 |
64 |
184 |
407 |
992 |
2,036 |
1,908 |
Of which: |
|
|
|
|
|
|
|
|
|
Dividend received by Indians on foreign investment |
# |
# |
# |
# |
# |
194 |
122 |
618 |
526 |
Profit received by Indians on foreign investment |
# |
# |
# |
# |
# |
213 |
870 |
1,418 |
1,382 |
iii)Reinvested Earning |
0 |
1,553 |
3,339 |
5,342 |
2,536 |
1,114 |
4,835 |
4,869 |
4,364 |
iv)Interest received on debentures, FRNs, CPs, fixed deposits and funds held abroad by ADs out of foreign currency loans/ export proceeds |
50 |
86 |
63 |
69 |
137 |
813 |
453 |
289 |
422 |
v)Interest received on overdraft of VOSTRO accounts of foreign correspondents/ branches by the ADs |
38 |
26 |
3 |
5 |
1 |
1,518 |
488 |
1,177 |
907 |
vi)Payment of taxes by the Non-residents/refund of taxes by foreign governments to Indians |
854 |
313 |
626 |
100 |
720 |
774 |
256 |
1,148 |
1,291 |
vii) Interest/discount earnings etc. earnings on RBI investment |
5,992 |
8,927 |
8,344 |
8,885 |
9,708 |
13,543 |
20,070 |
29,980 |
40,648 |
viii) Interest/remuneration on SDR holdings |
37 |
35 |
37 |
64 |
46 |
76 |
90 |
59 |
16 |
ix)Others |
432 |
312 |
1,843 |
1,210 |
3,072 |
0 |
0 |
0 |
0 |
Total ( i to ix) |
7,727 |
11,690 |
15,487 |
16,484 |
17,314 |
18,538 |
27,633 |
40,297 |
55,438 |
|
| |
| Statement 6: Invisibles Payments by Category of Transactions |
| (Rs. crore) |
Items |
1999-00 |
2000-01 |
2001-02 |
2002-03 |
2003-04 |
2004-05 |
2005-06 |
2006-07 R |
2007-08 PR |
1 |
2 |
3 |
4 |
5 |
6 |
7 |
8 |
9 |
10 |
Invisibles Payments (A+B+C ) |
74,421 |
1,02,639 |
1,03,727 |
1,20,400 |
1,18,044 |
1,71,959 |
2,11,733 |
2,81,567 |
2,97,336 |
A) Services |
50,467 |
66,650 |
65,850 |
82,775 |
76,794 |
1,24,880 |
1,53,057 |
2,00,029 |
2,10,873 |
1) Travel Account |
|
|
|
|
|
|
|
|
|
i) Business |
5,490 |
7,200 |
7,001 |
9,617 |
12,449 |
14,451 |
15,296 |
12,758 |
13,255 |
ii)Health Related |
13 |
18 |
18 |
18 |
26 |
59 |
167 |
61 |
71 |
iii)Education Related |
263 |
435 |
1,182 |
818 |
1,082 |
2,892 |
4,921 |
5,009 |
11,302 |
iv)Basic Travel Quota ( BTQ) |
1,638 |
1,738 |
2,465 |
3,830 |
2,063 |
5,226 |
5,473 |
8,154 |
7,924 |
v)Pilgrimage |
602 |
867 |
541 |
604 |
72 |
144 |
122 |
527 |
352 |
vi)Others |
1,262 |
2,483 |
3,129 |
1,268 |
842 |
799 |
3,453 |
3,740 |
4,269 |
Total (i to vi) |
9,268 |
12,741 |
14,336 |
16,155 |
16,534 |
23,571 |
29,432 |
30,249 |
37,173 |
2) Transportation Account |
|
|
|
|
|
|
|
|
|
a)Sea Transport |
|
|
|
|
|
|
|
|
|
i)Surplus remitted by Foreign companies operating in India |
1,681 |
1,872 |
2,245 |
1,603 |
683 |
4,529 |
7,274 |
8,640 |
6,685 |
ii)Operating expenses of Indian companies abroad |
1,757 |
3,736 |
2,125 |
2,439 |
1,670 |
1,493 |
4,455 |
2,486 |
3,627 |
iii) Charter hire charges |
501 |
700 |
534 |
540 |
459 |
389 |
369 |
383 |
595 |
iv) Freight on imports |
@ |
@ |
@ |
@ |
@ |
3,924 |
6,659 |
6,076 |
11,851 |
v) Freight on exports |
.. |
.. |
.. |
.. |
.. |
2,328 |
2,573 |
3,210 |
3,128 |
vi)Remittance of passage booking abroad |
# |
# |
# |
# |
# |
114 |
53 |
25 |
17 |
b)Air Transport |
|
|
|
|
|
|
|
|
|
i)Surplus remitted by Foreign companies operating in India |
3,561 |
5,632 |
6,477 |
6,827 |
2,999 |
5,156 |
9,683 |
8,320 |
10,632 |
ii)Operating expenses of Indian companies abroad |
580 |
444 |
529 |
539 |
611 |
459 |
1,268 |
1,086 |
2,267 |
iii)Charter hire charges |
324 |
336 |
333 |
391 |
280 |
217 |
626 |
1,077 |
2,063 |
iv)Freight on imports |
@ |
@ |
@ |
@ |
@ |
528 |
557 |
792 |
2,222 |
v) Freight on exports |
.. |
.. |
.. |
.. |
.. |
264 |
180 |
144 |
110 |
vi) Remittance of passage booking abroad |
# |
# |
# |
# |
# |
138 |
37 |
58 |
102 |
c.Freight on imports |
1,317 |
2,970 |
3,482 |
2,895 |
3,503 |
@@ |
@@ |
@@ |
@@ |
d.Remittance of passage booking abroad |
104 |
52 |
136 |
80 |
48 |
## |
## |
## |
## |
e.Others |
625 |
430 |
625 |
514 |
435 |
824 |
3,192 |
4,207 |
2,978 |
Total (a to e) |
10,450 |
16,172 |
16,486 |
15,828 |
10,688 |
20,363 |
36,928 |
36,504 |
46,277 |
3) Insurance Account |
|
|
|
|
|
|
|
|
|
a.Premium |
|
|
|
|
|
|
|
|
|
i) Life |
3 |
1 |
3 |
2 |
4 |
42 |
64 |
128 |
409 |
ii)Non-life |
45 |
37 |
123 |
22 |
47 |
1,511 |
1,076 |
372 |
513 |
iii)Reinsurance |
328 |
805 |
850 |
1,421 |
1,224 |
1,350 |
2,588 |
1,729 |
2,278 |
b.Commission on Business |
24 |
1 |
15 |
3 |
2 |
54 |
124 |
103 |
109 |
c.Others |
125 |
160 |
348 |
239 |
395 |
292 |
1,113 |
571 |
885 |
Total ( a to c) |
525 |
1,004 |
1,339 |
1,687 |
1,672 |
3,249 |
4,965 |
2,903 |
4,194 |
4) Government Not Included Elsewhere |
|
|
|
|
|
|
|
|
|
a.Maintenance of Indian embassies and diplomatic missions abroad |
1,023 |
1,199 |
1,002 |
938 |
855 |
1,516 |
1,971 |
1,284 |
1,100 |
b.Remittances by foreign embassies and missions in India |
144 |
261 |
347 |
167 |
121 |
327 |
372 |
541 |
421 |
Total (a to b) |
1,167 |
1,460 |
1,349 |
1,105 |
976 |
1,843 |
2,343 |
1,825 |
1,520 |
|
| |
| Statement 6: Invisibles Payments by Category of Transactions (Contd.) |
| (Rs. crore) |
Items |
1999-00 |
2000-01 |
2001-02 |
2002-03 |
2003-04 |
2004-05 |
2005-06 |
2006-07 R |
2007-08 PR |
1 |
2 |
3 |
4 |
5 |
6 |
7 |
8 |
9 |
10 |
5) Miscellaneous Account |
|
|
|
|
|
|
|
|
|
a)Communication services |
826 |
583 |
1,767 |
4,704 |
3,547 |
3,298 |
1,285 |
3,589 |
3,459 |
b)Construction services |
220 |
757 |
2,446 |
6,391 |
2,995 |
3,217 |
3,209 |
3,337 |
3,047 |
c)Financial services |
5,785 |
8,991 |
6,046 |
6,765 |
3,217 |
3,735 |
4,265 |
13,460 |
12,581 |
d)Software services |
1,600 |
2,705 |
3,202 |
3,565 |
2,175 |
3,579 |
5,954 |
10,212 |
12,299 |
e)News agency services |
693 |
1,167 |
777 |
1,122 |
1,080 |
1,251 |
576 |
1,015 |
1,322 |
f)Royalties, copyright and license fees |
1,351 |
1,073 |
1,723 |
1,703 |
2,039 |
3,185 |
2,640 |
4,632 |
4,370 |
g)Business services (i to xii)$ |
5,003 |
4,674 |
7,154 |
8,768 |
11,711 |
32,807 |
34,428 |
71,500 |
67,105 |
i)Merchanting services |
|
|
|
|
|
1,055 |
547 |
1,324 |
2,885 |
ii)Trade related services |
|
|
|
|
|
4,741 |
5,352 |
8,118 |
9,189 |
iii)Operational Leasing Services |
|
|
|
|
|
1,584 |
2,052 |
4,249 |
4,626 |
iv)Legal services |
|
|
|
|
|
327 |
363 |
724 |
1,619 |
v)Accounting / Auditing services |
|
|
|
|
|
58 |
89 |
263 |
276 |
vi)Business Management & Consultancy services |
3,456 |
2,499 |
2,537 |
3,135 |
3,734 |
5,708 |
10,769 |
15,739 |
14,674 |
vii) Advertising/ trade fair |
|
|
|
|
|
2,298 |
1,860 |
7,974 |
5,236 |
viii) Research & Development services |
|
|
|
|
|
254 |
515 |
906 |
1,628 |
ix)Architectural Engineering & other technical services |
|
|
|
|
|
4,987 |
6,293 |
13,630 |
12,730 |
x)Agricultural Mining & on-site processing services |
|
|
|
|
|
30 |
67 |
333 |
202 |
xi)Maintenance of offices abroad services |
1,547 |
2,175 |
4,617 |
5,633 |
7,977 |
11,746 |
6,480 |
18,215 |
14,002 |
xii) Environmental services |
|
|
|
|
|
19 |
41 |
27 |
38 |
h)Personal, Cultural & Recreational services |
|
|
|
|
|
461 |
371 |
525 |
800 |
i)Refunds/rebates |
387 |
292 |
715 |
736 |
1,677 |
3,437 |
201 |
1,655 |
2,107 |
j)Other services$$ |
13,192 |
15,031 |
8,510 |
14,246 |
18,483 |
20,884 |
26,460 |
18,621 |
14,618 |
Total (a to j) |
29,057 |
35,273 |
32,340 |
48,000 |
46,924 |
75,854 |
79,389 |
1,28,548 |
1,21,709 |
B) Transfers |
150 |
981 |
1,729 |
3,886 |
2,633 |
4,066 |
4,134 |
6,288 |
9,290 |
1) Official Transfers |
|
|
|
|
|
|
|
|
|
i)Grants/donations from official sector |
2 |
0 |
0 |
0 |
0 |
1,598 |
2,103 |
1,723 |
2,073 |
Total |
2 |
0 |
0 |
0 |
0 |
1,598 |
2,103 |
1,723 |
2,073 |
2) Private Transfers |
|
|
|
|
|
|
|
|
|
i)Remittance by Non-residents towards family maintenance and savings |
125 |
581 |
1,392 |
3,668 |
2,387 |
1,887 |
1,569 |
3,719 |
6,348 |
ii)Personal gifts/donations to charitable/religious institutions |
23 |
400 |
337 |
218 |
246 |
581 |
462 |
846 |
869 |
Of which: |
|
|
|
|
|
|
|
|
|
iii)Remittance towards personal gifts and donations |
|
|
|
|
|
488 |
426 |
714 |
731 |
iv) Remittance towards donations to religious & charitable institutions abroad |
|
|
|
|
|
75 |
32 |
79 |
97 |
v)Remittance towards grants and donations to other governments & charitable institutions established by the governments |
|
|
|
|
|
18 |
4 |
53 |
41 |
Total (i to v) |
148 |
981 |
1,729 |
3,886 |
2,633 |
2,468 |
2,031 |
4,565 |
7,217 |
|
| |
| Statement 6: Invisibles Payments by Category of Transactions (Concld.) |
| (Rs. crore) |
Items |
1999-00 |
2000-01 |
2001-02 |
2002-03 |
2003-04 |
2004-05 |
2005-06 |
2006-07 R |
2007-08 PR |
1 |
2 |
3 |
4 |
5 |
6 |
7 |
8 |
9 |
10 |
C) Income |
23,804 |
35,008 |
36,148 |
33,739 |
38,617 |
43,013 |
54,542 |
75,250 |
77,173 |
a) Compensation of Employees |
|
|
|
|
|
|
|
|
|
i)Payment of wages/ salary to Non-residents working in India |
57 |
2,123 |
2,318 |
2,892 |
4,031 |
6,066 |
3,430 |
4,295 |
4,404 |
Total |
57 |
2,123 |
2,318 |
2,892 |
4,031 |
6,066 |
3,430 |
4,295 |
4,404 |
b)Investment Income |
|
|
|
|
|
|
|
|
|
i)Payment of interest on NRI deposits |
7,549 |
8,276 |
8,621 |
6,845 |
7,536 |
6,071 |
6,634 |
8,909 |
7,317 |
ii)Payment of interest on loans from Non-residents |
13,167 |
13,401 |
13,599 |
12,565 |
15,920 |
11,001 |
19,215 |
17,136 |
20,387 |
iii)Payment of dividend/profit to Non-resident share holders |
2,333 |
4,676 |
3,397 |
2,237 |
4,041 |
8,969 |
11,123 |
15,774 |
14,355 |
Of which: |
|
|
|
|
|
|
|
|
|
Payment of dividend to Non-resident share holders |
|
|
|
|
|
7,120 |
10,674 |
14,634 |
13,442 |
Payment of profit to Non-resident share holders |
|
|
|
|
|
1,849 |
449 |
1,140 |
913 |
iv)Reinvested Earning |
0 |
6,177 |
7,841 |
8,866 |
6,710 |
8,555 |
12,219 |
26,371 |
28,859 |
v)Payment of interest on
debentures, FRNs, CPs fixed deposits, Government securities etc. |
512 |
271 |
103 |
207 |
192 |
766 |
532 |
158 |
225 |
vi)Charges on SDRs |
132 |
73 |
248 |
96 |
73 |
86 |
75 |
135 |
85 |
vii) Interest paid on overdraft on VOSTRO a/c Holders/ OD on NOSTRO a/c |
2 |
2 |
2 |
22 |
92 |
1,154 |
945 |
1,829 |
954 |
ix)Payment of taxes by the Indians/refund of taxes by government to Non-residents |
52 |
9 |
19 |
9 |
22 |
345 |
369 |
643 |
587 |
Total (i to ix) |
23,747 |
32,885 |
33,830 |
30,847 |
34,586 |
36,947 |
51,112 |
70,955 |
72,769 |
PR : Partially Revised.
@ : For the period prior to 2004-05, the break up of ‘freight on imports’ between the sea transport and the air transport is not
separately available. Therefore, these have been included under the head ‘freight on imports’.
+ : The category ‘freight on exports’ was introduced in 2004-05 with a view to improve the data coverage.
# : For the period prior to 2004-05, the break up between the sea transport and the air transport is not separately available.
Therefore, these have been included under the head ‘remittance on passage booking abroad’.
@@: Included under the heads ‘sea transport’ and ‘air transport’.
## : Included under the heads ‘sea transport’ and ‘air transport’.
$ : These new categories of services are available since 2004-05 as the reporting system was put in place to record such
transactions.
$$ : Till 2003-04, others included advertising, rentals, office maintenance, prizes, exhibitions & other services not included
elsewhere. |
|
| |
Annex I : Compilation and Dissemination of India’s Invisibles |
| |
India’s invisibles details form part of India’s Balance of Payments (BoP) and are released in two stages viz., (i) standard presentation with broad heads, and (ii) detailed presentation with breakup of broad heads. In the first stage, major components of invisibles are released as part of BoP on a quarterly basis to meet the IMF’s Special Data Dissemination Standards (SDDS). These quarterly details are released through the Reserve Bank of India (RBI) website and also published in the RBI Bulletin. In the first stage, the coverage is limited under broad heads of services (travel, transportation, insurance, government not included elsewhere and miscellaneous services including those of software services, business services, financial services and communication services), transfers (private and official transfers) and income (investment income and compensation of employees). In the second stage, when the data firm up and more details are available, the disaggregated details on invisibles are compiled and provided on an annual basis. These disaggregated data are published in an article titled “Invisibles in India’s Balance of Payments” in the RBI Bulletin.
The details on invisibles are extracted from India’s balance of payments records and the balance of payments details are compiled in accordance with the guidelines in the IMF’s Balance of Payments Manual, 5th Edition (BPM5), 1993, with minor modifications to adapt to the specifics of the Indian situation. The Manual defines BoP as a statistical statement that systematically summarises, for a specific time period, the economic transactions of an economy with the rest of the world. Transactions between residents and non-residents consist of those involving goods, services and income; involving financial claims on and liabilities to the rest of the world; and those classified as transfers, involving offsetting entries to balance one-sided transactions.
In recognition to the growing importance of services and in order to meet the requirements of compilation under extended balance of payments statistics, the Reserve Bank based on the recommendations of a Technical Group on Statistics of International Trade in Services, which submitted its report in 2002, took the lead in putting in place an arrangement to collect comprehensive information on India’s trade in services in the context of the ongoing negotiations on international trade in services under the GATS framework, The details regarding new reporting arrangements which were put in place in 2004-05, wherein a number of new purpose codes were introduced with a view to collect data separately for a number of emerging business services including those of merchanting services, trade related services, operational leasing services, legal services, accounting services, business and management services, advertising services, research and development services, architectural and engineering services, agricultural services, office maintenance services, environmental services and personal and cultural services, were first published in the November 2006 issue of the RBI Bulletin. |
| |
Annex II: Details on Definitional Aspect of Components of Invisibles |
Item |
Description |
1. Services |
|
(i) Travel |
‘Travel’represents all expenditure by foreign tourists in India on the receipts
side and all expenditure by Indian tourists abroad on payments side. Travel receipts largely depend on the arrival of foreign tourists in India during a given time period. |
(ii) Transportation |
‘Transportation’ records receipts and payments on account of the carriage of goods and people as well as other distributive services (such as port charges, bunker fuel, stevedoring, cabotage, warehousing) performed on merchandise trade. |
(iii) Insurance |
‘Insurance’ consists of insurance on exports/imports, premium on life and
non-life policies and reinsurance premium from foreign insurance companies. |
(iv) Government Not Included Elsewhere (GNIE) |
‘Government not included elsewhere (GNIE)’ represents remittances towards maintenance of foreign embassies, diplomatic missions and international/ regional institutions, while payments record the remittances on account of maintenance of embassies and diplomatic missions abroad. |
(v) Miscellaneous Services |
‘Miscellaneous services’ encompass communication services, construction services, financial services, software services, news agency services, royalties, copyright and license fees, personal, cultural and recreational services, management services and business services.
Business services comprise merchanting services, trade related services, operational leasing services, legal services, accounting services, business and management consultancy services, advertising services, research and development services, architectural and engineering services, agricultural services, mining and on-site processing services, office maintenance services, environmental services and distribution services. |
2. Investment Income |
‘Investment income’ represents the servicing of capital transactions (both debt and non-debt). These transactions are in the form of interest, dividend, profit
and others for servicing of capital transactions. Interest payments represent servicing of debt liabilities, while the dividend and profit payments reflect the servicing of non-debt (foreign direct investment and portfolio investment) liabilities. Investment income payments move in tandem with India’s external liabilities, while investment income receipts get linked to India’s external assets including foreign exchange reserves. In accordance with the BPM5, ‘compensation of employees’ has been shown under the heading, “income” with effect from 1997-98. |
3. Transfers |
‘Transfers’ represent one-sided transactions, i.e., transactions that do not have any quid pro quo, such as grants, gifts, and migrants’ transfers by way of remittances for family maintenance, repatriation of savings and transfer of financial and real resources linked to change in resident status of migrants. Official transfer receipts record grants, donations and other assistance received by the Government from bilateral and multilateral institutions. Similar transfers by the Indian Government to other countries are recorded under official transfer payments. |
|
 IST,
IST,


