North-East Monsoon 2007: An Overview* (October 1 to December 31, 2007) Introduction The performance of monsoon assumes a crucial role in influencing agricultural production. There are two monsoon seasons in India viz., South-West, covering the period from June to September and North-East (or post-monsoon period) from October to December. The North-East monsoon season is the major period of rainfall activity over the South Peninsula, particularly, in the eastern half comprising of the meteorological sub-divisions of Coastal Andhra Pradesh, Rayalaseema, Tamil Nadu and Pondicherry. North-East Monsoon 2007 -Highlights
- The North-East monsoon rains commenced over Tamil Nadu and adjoining States of South Peninsula on October 22, 2007.
- Cumulative rainfall recorded during the period from October 1 to December 31, 2007 was 32 per cent below normal (Long-Period Average) as compared with 21 per cent below normal during the corresponding period of the previous year. During the months under review (i.e., October, November and December), large rainfall deficiency in the range of 16.0 per cent to 49.0 per cent from the Long-Period Average (LPA) was witnessed. The rainfall deficiency was especially acute during the months of October and November.
- In terms of spatial distribution, South Peninsular India received normal1 rainfall, while the North-East India received deficient rainfall. The NorthWest India and the Central India received scanty rainfall.
- The seasonal rainfall from October 1, 2007 to December 31, 2007 was excess/ normal in 9 (25 per cent) meteorological
 sub-divisions while it was deficient/ scanty/no rains in the remaining 27 sub-divisions (75 per cent).
- As per the available data for 513 meteorological districts, 24 per cent of these received excess/normal rainfall, while the rest received deficient/scanty/no rain.
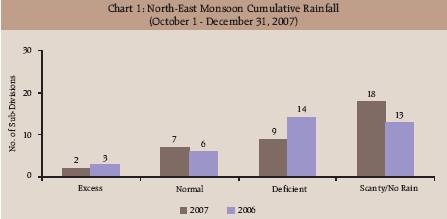
North-East Monsoon 2007 Cumulative Rainfall Cumulative rainfall recorded during the period from October 1 to December 31, 2007 was 32 per cent below normal as compared with 21 per cent below normal during the corresponding period of the previous year. The rainfall during the North-East monsoon 2007 was distributed unevenly across space. Of the 36 meteorological subdivisions, cumulative rainfall was excess/ normal in 9 sub-divisions (same as in the corresponding period of the previous year) and deficient/scanty/no rains in 27 subdivisions (same as previous year) (Chart 1, Table 1 and Statement 1). Barring 2002,
|
Category of Rainfall
|
Table 1: Distribution of Sub-divisions Accroding to Category of Rainfall
Sub-divisions
|
| Excess +20% or more |
Nagaland, Manipur, Mizoram & Tripura, Tamil Nadu & Pondicherry. |
| Normal +19% to -19% |
Assam & Meghalaya, Chhattisgarh, Rayalaseema, Coastal Karnataka, South Interior Karnataka, Kerala, Lakshadweep. |
| Deficient -20% to -59% |
Andaman & Nicobar Islands, Arunachal Pradesh, Sub-Himalayan West Bengal and Sikkim, Gangetic West Bengal, Orissa, Bihar, Vidarbha, Coastal Andhra Pradesh, Telangana. |
| Scanty -60% to -99% |
Jharkhand, East Uttar Pradesh, West Uttar Pradesh, Uttaranchal, Haryana, Chandigarh & Delhi, Punjab, Himachal Pradesh, Jammu & Kashmir, West Rajasthan, East Rajasthan, West Madhya Pradesh, East Madhya Pradesh, Gujarat Region, Daman, Dadra & Nagar Haveli, Saurashtra & Kutch, Konkan and Goa, Madhya Maharashtra, Marathwada, North Interior Karnataka. |
| Source: India Meteorological Department. |
| Table 2: North-East Monsoon |
| Year |
Cumulative Rainfall Above (+)/
Below (-)
Normal
(per cent) |
Rainfall |
| Excess |
Normal |
Deficient |
Scanty/ No Rain |
| Number of Sub-Divisions
(Total = 36) |
| 1 |
2 |
3 |
4 |
5 |
6 |
| 2002 |
-33 |
3 |
7 |
12 |
14 |
| 2003 |
8 |
9 |
9 |
6 |
12 |
| 2004 |
-11 |
8 |
10 |
17 |
1 |
| 2005 |
10 |
11 |
6 |
5 |
14 |
| 2006 |
-21 |
3 |
6 |
14 |
13 |
| 2007 |
-32 |
2 |
7 |
9 |
18 |
| Source : IMD |
the North-East monsoon 2007 witnessed the lowest cumulative rainfall in the last six years (Table 2). Temporal Distribution Temporally, the North-East monsoon witnessed deficient rainfall during the first half of October, entire November and the first half of December (Chart 2). The rainfall over the country as a whole was deficient (32 per cent below Long Period Average), particularly, in the months of October (30 per cent below LPA) and November (49 per cent below LPA) (Table 3). Region-wise Rainfall during the North-East Monsoon 2007 Among the four regions2, the rainfall was normal only in the South Peninsular Region. It was deficient in the NorthEast India, while it was scanty in the  North-West India and the Central India (Table 4). District level cumulative rainfall during the North-East monsoon 2007 There are 533 meteorological districts of which data is available for 513 districts. Of these 513 meteorological districts, 24 per cent received excess/normal rainfall, while the rest received deficient/scanty/ no rain (Statement 2).
Table 3: Month-wise Rainfall during |
North-East Monsoon 2007 |
Month |
Absolute Rainfall (in mm ) |
Percentage Departure from Normal |
|
Actual |
Normal |
|
|
|
|
|
1 |
2 |
3 |
4 |
October |
54.9 |
78.4 |
-30 |
November |
14.4 |
28.4 |
-49 |
December |
16.1 |
19.1 |
-16 |
Overall |
85.4 |
125.9 |
-32 |
Source: IMD |
| Table 4: Region-wise Rainfall during the |
| North-East Monsoon 2007 |
| Region |
Actual |
Normal |
Deviation |
Category |
|
(in mm) |
(in mm) |
(%) |
|
| 1 |
2 |
3 |
4 |
5 |
| North-West India |
15.3 |
66.7 |
-77 |
Scanty |
| Central India |
31.6 |
79.9 |
-60 |
Scanty |
| South Peninsular |
|
|
|
|
| India |
254.9 |
268.4 |
-5 |
Normal |
| North-East India |
125.3 |
161.5 |
-22 |
Deficient |
| Country as a whole |
85.4 |
125.9 |
-32 |
Deficient |
| Source : IMD |
Reservoir Status The Central Water Commission monitors the total live water storage in the 81 major reservoirs accounting for 72 per cent of the total reservoir capacity in the country. As on January 3, 2008, water stock in the major reservoirs was 61 per cent of the Full Reservoir Level (FRL) as compared with 65 per cent a year ago (Table 5). Progress of Sowing The area sown under rabi crops so far (up to January 4, 2008) has been about 3.8 per cent lower than a year ago. The sowing under rabi was lower in the case of wheat, pulses and oilseeds, while that in case of rice and coarse cereals was higher as compared with the previous year (Table 6).
| Table 5: Reservoir Status |
| Status As on January 3, |
2005 |
2006 |
2007 |
2008 |
| 1 |
2 |
3 |
4 |
5 |
| Total Live Storage (BCM) |
60.343 |
89.433 |
97.939 |
92.274 |
| Percentage to Live Capacity |
|
|
|
|
| at FRL |
40 |
59 |
65 |
61 |
| Source: Central Water Commission. |
| Table 6: Progress of Area |
| under Rabi Crops - 2007-08 |
| (Million hectares) (As reported on January 4, 2008) |
| Crop |
Normal |
Area Coverage |
|
Area |
2006 |
2007 |
Absolute |
|
|
|
|
Variation |
|
|
|
|
2007 over 2006 |
| 1 |
2 |
3 |
4 |
5 |
| Rice |
3.7 |
0.4 |
0.4 |
0.0 |
| Wheat |
26.2 |
27.5 |
26.6 |
-0.9 |
| Coarse Cereals |
6.4 |
6.4 |
6.5 |
0.1 |
| Of which |
|
|
|
|
| Jowar |
5.0 |
4.7 |
4.6 |
-0.1 |
| Maize |
0.7 |
0.8 |
0.9 |
0.1 |
| Total Pulses |
11.4 |
13.0 |
12.6 |
-0.3 |
| Total Rabi Oilseeds |
8.8 |
9.3 |
8.2 |
-1.1 |
| Of which |
|
|
|
|
| Rapeseed and Mustard |
5.9 |
6.6 |
5.9 |
-0.8 |
| Groundnut |
0.8 |
0.6 |
0.5 |
-0.1 |
| Sunflower |
1.2 |
1.1 |
0.9 |
-0.2 |
| All Crops |
56.5 |
56.5 |
54.3 |
-2.2 |
| Source : Ministry of Agriculture, Government of India. |
| Statement - 1 : Basic Rainfall Data (Cumulative) |
| S u b - D i v i s i o n s |
Rainfall for the period from |
Rainfall for the period from |
|
|
October 1 to December 31, 2007. |
October 1 to December 31 , 2006. |
|
|
Actual |
Normal |
% deviation from |
Actual |
Normal |
% deviation from |
|
|
(mm) |
(mm) |
Normal |
(mm) |
(mm) |
Normal |
| 1. |
Andaman & Nicobar Islands |
519.0 |
700.0 |
-26 |
D |
530.0 |
700.0 |
-24 |
D |
| 2. |
Arunachal Pradesh |
146.0 |
244.0 |
-40 |
D |
219.0 |
244.0 |
-10 |
N |
| 3. |
Assam & Meghalaya |
187.0 |
191.0 |
-2 |
N |
111.0 |
191.0 |
-42 |
D |
| 4. |
Nagaland, Manipur, |
272.0 |
195.0 |
39 |
E |
109.0 |
195.0 |
-44 |
D |
| |
Mizoram & Tripura |
|
|
|
|
|
|
|
|
| 5. |
Sub-Himalayan West |
86.0 |
183.0 |
-53 |
D |
145.0 |
183.0 |
-21 |
D |
| |
Bengal and Sikkim |
|
|
|
|
|
|
|
|
| 6. |
Gangetic West Bengal |
97.0 |
159.0 |
-39 |
D |
57.0 |
159.0 |
-64 |
S |
| 7. |
Orissa |
89.0 |
155.0 |
-43 |
D |
60.0 |
155.0 |
-61 |
S |
| 8. |
Jharkhand |
34.0 |
100.0 |
-66 |
S |
16.0 |
100.0 |
-84 |
S |
| 9. |
Bihar |
39.5 |
78.6 |
-50 |
D |
24.0 |
79.0 |
-70 |
S |
| 10. |
East Uttar Pradesh |
8.0 |
62.0 |
-87 |
S |
15.0 |
62.0 |
-76 |
S |
| 11. |
West Uttar Pradesh |
2.4 |
50.9 |
-95 |
S |
19.0 |
51.0 |
-63 |
S |
| 12. |
Uttaranchal |
13.0 |
87.0 |
-85 |
S |
18.0 |
87.0 |
-79 |
S |
| 13. |
Haryana, Chandigarh & Delhi |
2.3 |
27.4 |
-92 |
S |
9.2 |
27.0 |
-66 |
S |
| 14. |
Punjab |
10.0 |
41.0 |
-76 |
S |
29.0 |
41.0 |
-29 |
D |
| 15. |
Himachal Pradesh |
25.0 |
111.0 |
-77 |
S |
61.0 |
111.0 |
-45 |
D |
| 16. |
Jammu & Kashmir |
50.0 |
153.0 |
-67 |
S |
253.0 |
153.0 |
65 |
E |
| 17. |
West Rajasthan |
0.6 |
8.9 |
-93 |
S |
7.4 |
9.0 |
-18 |
N |
| 18. |
East Rajasthan |
0.7 |
26.0 |
-97 |
S |
1.9 |
26.0 |
-93 |
S |
| 19. |
West Madhya Pradesh |
1.7 |
52.0 |
-97 |
S |
12.0 |
52.0 |
-77 |
S |
| 20. |
East Madhya Pradesh |
14.4 |
59.1 |
-76 |
S |
10.9 |
59.0 |
-82 |
S |
| 21. |
Gujarat Region, Daman, |
1.3 |
34.7 |
-96 |
S |
8.9 |
35.0 |
-75 |
S |
| |
Dadra & Nagar Haveli |
|
|
|
|
|
|
|
|
| 22. |
Saurashtra & Kutch |
0.9 |
25.9 |
-96 |
S |
1.2 |
26.0 |
-95 |
S |
| 23. |
Konkan and Goa |
53.2 |
135.4 |
-61 |
S |
203.0 |
135.0 |
50 |
E |
| 24. |
Madhya Maharashtra |
10.8 |
105.4 |
-90 |
S |
62.0 |
105.0 |
-41 |
D |
| 25. |
Marathwada |
5.3 |
96.0 |
-95 |
S |
58.0 |
96.0 |
-40 |
D |
| 26. |
Vidarbha |
34.4 |
75.3 |
-54 |
D |
49.0 |
75.0 |
-35 |
D |
| 27. |
Chhattisgarh |
88.5 |
82.0 |
8 |
N |
33.3 |
82.0 |
-59 |
D |
| 28. |
Coastal Andhra Pradesh |
260.0 |
326.2 |
-20 |
D |
335.0 |
325.5 |
3 |
N |
| 29. |
Telangana |
69.5 |
109.6 |
-37 |
D |
70.0 |
110.0 |
-36 |
D |
| 30. |
Rayalaseema |
210.4 |
212.1 |
-1 |
N |
164.0 |
212.0 |
-23 |
D |
| 31. |
Tamil Nadu & Pondicherry |
521.0 |
431.8 |
21 |
E |
496.0 |
432.0 |
15 |
N |
| 32. |
Coastal Karnataka |
214.6 |
258.0 |
-17 |
N |
343.0 |
258.0 |
33 |
E |
| 33. |
North Interior Karnataka |
52.3 |
136.7 |
-62 |
S |
76.1 |
137.0 |
-44 |
D |
| 34. |
South Interior Karnataka |
205.7 |
199.7 |
3 |
N |
149.0 |
200.0 |
-26 |
D |
| 35. |
Kerala |
472.6 |
498.5 |
-5 |
N |
590.0 |
499.0 |
18 |
N |
| 36. |
Lakshadweep |
392.1 |
328.9 |
19 |
N |
289.0 |
329.0 |
-12 |
N |
| E : |
Excess, i.e.,+20% or more |
|
|
2 |
|
|
|
3 |
|
| N : |
Normal, i.e.,+19% to -19% |
|
|
7 |
|
|
|
6 |
|
| D : |
Deficient, i.e.,-20% to -59% |
|
|
9 |
|
|
|
14 |
|
| S : |
Scanty, i.e.,-60% to -99% |
|
|
18 |
|
|
|
13 |
|
| NR : |
No Rain, i.e. -100% |
|
|
0 |
|
|
|
0 |
|
|
|
TOTAL |
|
|
36 |
|
|
|
36 |
|
| Source : India Meteorological Department. |
| Statement - 2 : Statewise Distribution of No. of Districts |
| with Excess, Normal, Deficient, Scanty and No Rainfall |
| 01.10.2007 to 31.12.2007 |
| S. NO. |
STATE/UT |
E |
N |
D |
S |
NR |
ND |
TOTAL |
| 1 |
A & N ISLAND (UT) |
0 |
0 |
2 |
0 |
0 |
0 |
2 |
| 2 |
ARUNACHAL PRADESH |
1 |
3 |
4 |
5 |
0 |
0 |
13 |
| 3 |
ASSAM |
3 |
9 |
8 |
1 |
0 |
1 |
22 |
| 4 |
MEGHALAYA |
2 |
0 |
0 |
0 |
0 |
1 |
3 |
| 5 |
NAGALAND |
2 |
1 |
0 |
0 |
0 |
1 |
4 |
| 6 |
MANIPUR |
1 |
1 |
0 |
0 |
0 |
1 |
3 |
| 7 |
MIZORAM |
1 |
1 |
0 |
0 |
0 |
0 |
2 |
| 8 |
TRIPURA |
2 |
1 |
0 |
0 |
0 |
0 |
3 |
| 9 |
SIKKIM |
0 |
0 |
1 |
0 |
0 |
0 |
1 |
| 10 |
WEST BENGAL |
0 |
4 |
9 |
3 |
0 |
1 |
17 |
| 11 |
ORISSA |
1 |
6 |
9 |
14 |
0 |
0 |
30 |
| 12 |
JHARKHAND |
1 |
1 |
4 |
6 |
0 |
3 |
15 |
| 13 |
BIHAR |
2 |
3 |
5 |
11 |
5 |
6 |
32 |
| 14 |
UTTAR PRADESH |
0 |
0 |
4 |
30 |
27 |
3 |
64 |
| 15 |
UTTARANCHAL |
0 |
0 |
0 |
9 |
2 |
1 |
12 |
| 16 |
HARYANA |
0 |
0 |
1 |
6 |
12 |
0 |
19 |
| 17 |
CHANDIGARH (UT) |
0 |
0 |
0 |
1 |
0 |
0 |
1 |
| 18 |
DELHI (UT) |
0 |
0 |
0 |
1 |
0 |
0 |
1 |
| 19 |
PUNJAB |
0 |
0 |
3 |
11 |
2 |
0 |
16 |
| 20 |
HIMACHAL PRADESH |
0 |
0 |
4 |
6 |
2 |
0 |
12 |
| 21 |
JAMMU & KASHMIR |
0 |
0 |
3 |
6 |
1 |
1 |
11 |
| 22 |
RAJASTHAN |
0 |
0 |
0 |
16 |
16 |
0 |
32 |
| 23 |
MADHYA PRADESH |
1 |
1 |
0 |
20 |
23 |
0 |
45 |
| 24 |
CHHATTISGARH |
1 |
3 |
8 |
4 |
0 |
0 |
16 |
| 25 |
GUJARAT |
0 |
0 |
1 |
12 |
12 |
0 |
25 |
| 26 |
DNH & DAMAN (UTs) |
0 |
0 |
0 |
1 |
0 |
0 |
1 |
| 27 |
DIU (UT) |
0 |
0 |
0 |
0 |
0 |
1 |
1 |
| 28 |
GOA |
0 |
1 |
0 |
0 |
0 |
0 |
1 |
| 29 |
MAHARASHTRA |
0 |
4 |
1 |
20 |
8 |
0 |
33 |
| 30 |
ANDHRA PRADESH |
2 |
4 |
15 |
2 |
0 |
0 |
23 |
| 31 |
TAMILNADU |
14 |
15 |
1 |
0 |
0 |
0 |
30 |
| 32 |
PONDICHERRY (UT) |
0 |
1 |
0 |
0 |
0 |
0 |
1 |
| 33 |
KARNATAKA |
5 |
9 |
8 |
5 |
0 |
0 |
27 |
| 34 |
KERALA |
0 |
11 |
3 |
0 |
0 |
0 |
14 |
| 35 |
LAKSHADWEEP (UT) |
0 |
1 |
0 |
0 |
0 |
0 |
1 |
| |
TOTAL |
39 |
80 |
94 |
190 |
110 |
20 |
533 |
| E: Excess N: Normal D: Deficient S: Scanty NR: No Rain ND: No Data Source : India Meteorological Department. |
*Prepared in the Division of Rural Economics, Department of Economic Analysis and Policy. 1 Based on the percentage deviation of the quantum of rainfall from the Long-Period Average, the India Meteorological Department defines five categories of rainfall: Excess: + 20 per cent or more; Normal: + 19 per cent to -19 per cent; Deficient: -20 per cent to - 59 per cent; Scanty: -60 per cent to -99 per cent; and No Rain: -100 per cent. 21. North-West India: Uttar Pradesh, Rajasthan, Haryana, Chandigarh and Delhi, Punjab, Uttaranchal, Himachal Pradesh and Jammu and Kashmir. 2. Central India: Madhya Pradesh, Chhattisgarh, Maharashtra and Gujarat. 3. South Peninsula: Andhra Pradesh, Karnataka, Tamil Nadu & Pondicherry, Kerala and Lakshdweep. 4. North-East India: Bihar, Jharkhand, Orissa, West Bengal, Sikkim, Assam, Arunachal Pradesh, Meghalaya, Nagaland, Manipur, Mizoram, Tripura and Andaman & Nicobar Islands. |


