North-East Monsoon 2010: An Overview* (October 1 to December 31, 2010) Satisfactory North-East monsoon on the backdrop of normal South-West monsoon has immensely improved the prospects of agricultural production during 2010- 11. Cumulative rainfall for the country as a whole during October-December 2010 was 21 per cent above long period average (LPA). Area sown under foodgrains, namely, wheat and pulses have surpassed their respective normal areas sown and levels achieved last year. As per the latest data available, Rabi sowing of all crops as on February 11, 2011 was 104.9 per cent of normal area sown and 2.4 per cent higher than the level achieved last year. As on February 10, 2011, live storage to total storage capacity at 55 per cent for all the major 81 reservoirs in the country against 40 per cent last year also augurs well for Rabi crops. Accordingly, production of major Rabi crops is estimated to register significant increases. Introduction North-East monsoon is the source of around 20 per cent of total precipitation in the country. The satisfactory progress of North-East monsoon during October-December, which coincides with Rabi sowing period, is an important determinant for good Rabi crop production. The significance of North-East monsoon can be gauged from the fact that around 70 per cent of all pulses and around 40 per cent of oilseeds are produced during Rabi season every year. In the backdrop of these factors, the article reviews the performance of North-East monsoon during October- December 2010. North-East Monsoon 2010: Highlights • During the year 2010, the North-East monsoon arrived over Tamil Nadu, Kerala and adjoining area of Andhra Pradesh and Karnataka on October 29, 2010. • The cumulative rainfall during North-East monsoon 2010 over the country as a whole averaged at about 153.2 mm as against the normal level of 126.3 mm. At this level, rainfall was 21 per cent above LPA as compared with 8 per cent above LPA in the corresponding period last year. • Monthly rainfall over the country as a whole was 13 per cent below LPA in October, 95 per cent above LPA in November and 26 per cent above LPA in December. • The core regions receiving North-East monsoon, viz., Tamil Nadu, Rayalaseema, coastal Andhra Pradesh, south interior Karnataka and Kerala received excess rainfall to the extent of 55 per cent over LPA during the period. • The seasonal rainfall from October l, 2010 to December 31, 2010 was normal/excess in 25 (69 per cent) meteorological sub-divisions and deficient/scanty/no rain in the remaining 11 sub-divisions (31 per cent). • District-wise, of the 597 meteorological districts for which data are available, 60 per cent received excess/normal rainfall, while the rest received deficient/scanty/no rain. An Overview: North-East Monsoon 2010 During 2009-10, normal North-East monsoon resulted in better than expected Rabi foodgrains production which was able to make up to a significant extent for the loss in Kharif foodgrains which was the result of deficient South-West monsoon. The performance of Rabi pulses and oilseeds during the past one decade, in the years in which North-East Monsoon fell short of its normal level, are furnished in Table 1. Cumulative Rainfall
Cumulative rainfall recorded during the period October 1 to December 31, 2010 was 21 per cent abovenormal as compared to 8 per cent above normal during the corresponding period of the previous year.
Table 1: Performance of Rabi Crops During Years of Deficit North-East Monsoon |
Years |
North-East Monsoon Above (+)/ Below (-) Normal (per cent) |
Growth in Rabi Pulses (per cent) |
Growth in Rabi Foodgrains (per cent) |
Growth in Rabi Oilseeds (per cent) |
1 |
2 |
3 |
4 |
5 |
2008-09 |
-31 |
18.2 |
5.9 |
9.6 |
2007-08 |
-32 |
-11.1 |
2.9 |
-12.0 |
2006-07 |
-21 |
10.3 |
8.1 |
-8.3 |
2004-05 |
-11 |
-3.8 |
-1.2 |
19.9 |
2002-03 |
-33 |
-18.2 |
-13.1 |
-21.2 |
Source: India Meteorological Department and Ministry of Agriculture. |
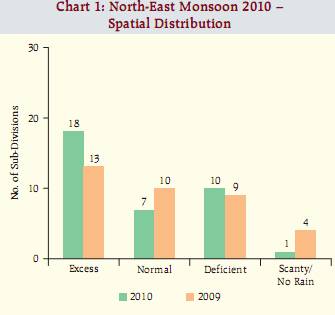
In terms of spatial distribution, rainfall during October-December 2010 remained uneven. Of the 36 meteorological sub-divisions, cumulative rainfall was excess/normal1 in 25 sub-divisions (23 sub-divisions in the corresponding period, last year) and deficient/ scanty/no rains in 11 sub-divisions (13 sub-divisions last year) (Chart 1, Table 2 & 3, and Statement I). All five sub-divisions which constitute the core region receiving North-East monsoon rainfall, viz. Tamil Nadu, Rayalaseema, coastal Andhra Pradesh, south interior Karnataka and Kerala received excess rainfall. Seasonal rainfall over these sub-divisions was 155 per cent of LPA. The remaining parts of south India as well as parts of west and east India also received excess to normal rainfall.
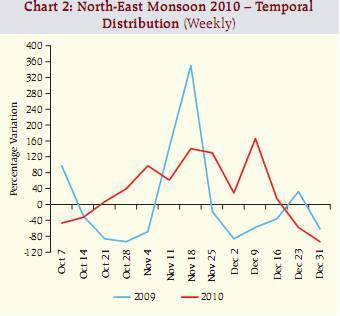
Temporal Distribution The weekly rainfall was below LPA till the third week of October 2010. It remained above LPA for a period of eight weeks till mid-December 2010 from where it progressively receded below LPA. Compared with the previous year, temporal distribution of rainfall was much more even during 2010. Due to late arrival of North-East monsoon in October 2010, rainfall for the month was 13 per cent below LPA. However, rainfall during November and December 2010 was 95 per cent and 26 per cent above LPA, respectively (Chart 2 and Table 4).
Table 2: North-East Monsoon – Cumulative Rainfall |
Year |
Cumulative Rainfall: Above |
Rainfall |
(+)/Below (-) Normal (per cent) |
Excess |
Normal |
Deficient |
Scanty/No Rain |
Number of Sub-Divisions (Total=36) |
(1) |
(2) |
(3) |
(4) |
(5) |
(6) |
2002 |
-33 |
3 |
7 |
12 |
14 |
2003 |
8 |
9 |
9 |
6 |
12 |
2004 |
-11 |
8 |
10 |
17 |
1 |
2005 |
10 |
11 |
6 |
5 |
14 |
2006 |
-21 |
3 |
6 |
14 |
13 |
2007 |
-32 |
2 |
7 |
9 |
18 |
2008 |
-31 |
2 |
4 |
15 |
15 |
2009 |
8 |
13 |
10 |
9 |
4 |
2010 |
21 |
18 |
7 |
10 |
1 |
Source: India Meteorological Department. |
Table 3: Distribution of Sub-divisions According to Category of Rainfall |
Category of Rainfall |
Sub-divisions |
(1) |
(2) |
Excess |
Andaman and Nicobar Islands, Orissa, West Rajasthan, East Rajasthan, Gujarat Region, Daman, Dadra and Nagar Haveli, Saurashtra & Kutch, Konkan and Goa, Madhya Maharashtra, Vidarbha, Coastal Andhra Pradesh, Telangana, Rayalaseema, Tamil Nadu & Puducherry, Coastal Karnataka, North Interior Karnataka, South Interior Karnataka, Kerala and Lakshadweep. |
Normal |
Nagaland, Manipur, Mizoram and Tripura, Gangetic West Bengal, Jharkhand, Himachal Pradesh, West Madhya Pradesh, Marathwada and Chhattisgarh. |
Deficient |
Arunachal Pradesh, Assam and Meghalaya, Sub-Himalayan West Bengal and Sikkim, Bihar, West Uttar Pradesh, Uttarakhand, Haryana, Chandigarh & Delhi, Punjab, Jammu and Kashmir and East Madhya Pradesh. |
Scanty |
East Uttar Pradesh. |
Source: India Meteorological Department. |
District-Level Cumulative Rainfall District-wise, out of 597 meteorological districts for which data are available, 60 per cent of the meteorological districts received excess/normal rainfall and the remaining 40 per cent received deficient/scanty rainfall during the season (Statement II). The corresponding figures for the previous year were 58 per cent and 42 per cent, respectively. Reservoir Status The Central Water Commission monitors total live water storage in 81 major reservoirs of the country, having full reservoir level of 151.77 billion cubic metres (BCM) that accounts for around 67 per cent of the total reservoir capacity of the country. Due to good monsoon, reservoir positions at the beginning and end of Rabi season during 2010 were much higher than that during the previous year (Table 5). As on February 10, 2011 total live storage in these 81 major reservoirs was 55 per cent of the full reservoir level (FRL) as compared with 40 per cent a year ago.
Progress of Rabi Sowing: 2010-11 Area coverage under rabi crops in 2010-11 was higher reflecting the impact of satisfactory North-East monsoon conditions during October-December 2010. Sowing of all crops during Rabi (as on February 11, 2011) was 104.9 per cent of normal level and 2.4 per cent higher than the previous year (Table 6). Estimates of Agricultural Production: 2010-11 Production of foodgrains during 2010-11, as per the Second Advance Estimates, is estimated at 232.1 million tonnes, 6.4 per cent higher over the previous year's production of 218.1 million tonnes. Increased production has been estimated across all sub-categories of foodgrains, i.e., rice (5.5 per cent), wheat (0.8 per cent), pulses (12.6 per cent), and coarse cereals (19.5 per cent). Production of oilseeds is estimated to increase from 24.9 million tonnes during 2009-10 to 27.9 million tonnes during 2010-11, showing increase of 11.9 per cent. Production of other commercial crops, namely, cotton and sugarcane are estimated to increase significantly, while that of jute and mesta is estimated to decline during 2010-11 (Table 7).
Table 4: Month-wise Rainfall during North-East Monsoon 2010 |
Month |
Absolute Rainfall (in mm) |
Percentage Departure from Normal |
Actual |
Normal |
(1) |
(2) |
(3) |
(4) |
October 2010 |
69.0 |
78.9 |
-13 |
November 2010 |
58.0 |
29.8 |
95 |
December 2010 |
22.4 |
17.8 |
26 |
Overall |
153.2 |
126.3 |
21 |
Note: mm: Millimeters
Source: India Meteorological Department. |
Table 5: Reservoir Status |
Status |
September 30 |
December 30 |
2009 |
2010 |
2009 |
2010 |
1 |
2 |
3 |
4 |
5 |
Total Live Storage (BCM) |
91.06 |
114.45 |
78.92 |
104.68 |
Percentage to Live Capacity at FRL |
60 |
75 |
52 |
69 |
Note: BCM – Billion Cubic Meters; FRL – Full Reservoir Level
Source: Central Water Commission. |
Table 6: Rabi Sowing – 2010-11 |
(Area in Million hectares) |
Crop |
Rabi Sowing^ |
% of 2009-10 |
% of Normal 2010-11 |
Normal |
2009-10 |
2010-11 |
1 |
2 |
3 |
4 |
5 |
6 |
| Total Foodgrains |
49.93 |
52.19 |
53.25 |
102.04 |
106.66 |
Rice |
4.25 |
3.36 |
2.81 |
83.70 |
66.15 |
Wheat |
27.33 |
28.36 |
29.28 |
103.25 |
107.14 |
Coarse Cereals |
6.32 |
6.50 |
6.00 |
92.32 |
94.86 |
Total Pulses |
12.02 |
13.97 |
15.16 |
108.51 |
126.11 |
Total Oilseeds |
9.98 |
9.19 |
9.57 |
104.18 |
95.89 |
All Crops |
59.91 |
61.38 |
62.83 |
102.36 |
104.87 |
^ Rabi sowing is as on February 11.
Source: Ministry of Agriculture, Government of India. |
Table 7: Agricultural Production – 2010-11 |
(Production in Million Tonnes) |
Crop |
2008-09 Final |
2009-10 Final |
2010-11 2nd Advance |
Percentage
Variations |
Estimates |
Estimates |
2010-11 |
1 |
2 |
3 |
4 |
5 |
Total Foodgrains |
234.47 |
218.11 |
232.07 |
6. 4 |
Rice |
99.18 |
89.09 |
94.01 |
5.5 |
Wheat |
80.68 |
80.80 |
81.47 |
0.8 |
Coarse Cereals |
40.03 |
33.55 |
40.08 |
19.5 |
Total Pulses |
14.57 |
14.66 |
16.51 |
12.6 |
Total Oilseeds |
27.72 |
24.88 |
27.85 |
11.9 |
Cotton # |
22.28 |
24.23 |
33.93 |
40.0 |
Jute # # |
9.63 |
11.23 |
9.49 |
-15.5 |
Mesta # # |
0.73 |
0.59 |
0.58 |
-1.7 |
Sugarcane (Cane) |
285.03 |
292.30 |
336.70 |
15.2 |
# Million bales of 170 kgs. each
## Million bales of 180 kgs. each.
Source: Ministry of Agriculture, Government of India. |
Statement I: Basic Rainfall Data (Cumulative) |
Sub-Divisions |
Rainfall for the period from October 1 to December 31, 2010. |
Rainfall for the period from October 1 to December 31, 2009. |
Actual (mm) |
Normal (mm) |
% deviation from Normal |
Actual (mm) |
Normal (mm) |
% deviationfrom Normal |
1. Andaman & Nicobar Islands |
951.0 |
723.5 |
31 |
E |
428.1 |
700.4 |
-39 |
D |
2. Arunachal Pradesh |
145.2 |
240.7 |
-40 |
D |
140.1 |
243.7 |
-43 |
D |
3. Assam & Meghalaya |
121.0 |
205.7 |
-41 |
D |
148.6 |
190.5 |
-22 |
D |
4. Nagaland, Manipur, Mizoram & Tripura |
254.6 |
225.7 |
13 |
N |
147.9 |
195.3 |
-24 |
D |
5. Sub-Himalayan West Bengal and Sikkim |
116.4 |
188.4 |
-38 |
D |
264.6 |
183.1 |
44 |
E |
6. Gangetic West Bengal |
137.2 |
155.1 |
-12 |
N |
95.7 |
159.3 |
-40 |
D |
7. Orissa |
220.6 |
156.0 |
41 |
E |
147.4 |
155.2 |
-5 |
N |
8. Jharkhand |
81.5 |
97.6 |
-16 |
N |
127.5 |
100.4 |
27 |
E |
9. Bihar |
54.6 |
78.9 |
-31 |
D |
76.9 |
78.6 |
-2 |
N |
10. East Uttar Pradesh |
22.1 |
60.8 |
-64 |
S |
103.9 |
61.9 |
68 |
E |
11. West Uttar Pradesh |
21.1 |
50.2 |
-58 |
D |
77.7 |
50.8 |
53 |
E |
12. Uttarakhand |
40.4 |
85.9 |
-53 |
D |
97.1 |
86.7 |
12 |
N |
13. Haryana, Chandigarh & Delhi |
14.2 |
27.2 |
-48 |
D |
3.3 |
27.4 |
-88 |
S |
14. Punjab |
22.9 |
41.1 |
-44 |
D |
8.8 |
41.5 |
-79 |
S |
15. Himachal Pradesh |
92.5 |
111.1 |
-17 |
N |
71.6 |
111.5 |
-36 |
D |
16. Jammu & Kashmir |
101.3 |
146.3 |
-31 |
D |
73.8 |
152.6 |
-52 |
D |
17. West Rajasthan |
31.2 |
8.3 |
276 |
E |
0.5 |
8.9 |
-95 |
S |
18. East Rajasthan |
77.6 |
26.0 |
198 |
E |
31.8 |
26.0 |
22 |
E |
19. West Madhya Pradesh |
60.2 |
52.7 |
14 |
N |
121.5 |
52.0 |
134 |
E |
20. East Madhya Pradesh |
31.0 |
60.3 |
-49 |
D |
139.0 |
59.1 |
135 |
E |
21. Gujarat Region, Daman, Dadra & Nagar Haveli |
48.4 |
33.8 |
43 |
E |
36.0 |
34.7 |
4 |
N |
22. Saurashtra & Kutch |
67.8 |
26.0 |
161 |
E |
4.1 |
26.0 |
-84 |
S |
23. Konkan and Goa |
299.1 |
135.5 |
121 |
E |
417.9 |
135.4 |
209 |
E |
24. Madhya Maharashtra |
152.5 |
104.4 |
46 |
E |
222.8 |
105.4 |
111 |
E |
25. Marathwada |
105.3 |
95.7 |
10 |
N |
139.5 |
96.0 |
45 |
E |
26. Vidarbha |
94.7 |
75.5 |
25 |
E |
113.2 |
75.3 |
50 |
E |
27. Chhattisgarh |
92.7 |
81.1 |
14 |
N |
50.5 |
82.0 |
-38 |
D |
28. Coastal Andhra Pradesh |
574.1 |
326.6 |
76 |
E |
261.6 |
326.2 |
-20 |
D |
29. Telangana |
165.1 |
109.1 |
51 |
E |
128.2 |
109.6 |
17 |
N |
30. Rayalaseema |
275.1 |
212.2 |
30 |
E |
210.3 |
212.1 |
-1 |
N |
31. Tamil Nadu & Puducherry |
607.5 |
429.6 |
41 |
E |
482.7 |
431.8 |
12 |
N |
32. Coastal Karnataka |
590.3 |
257.9 |
129 |
E |
430.5 |
258.0 |
67 |
E |
33. North Interior Karnataka |
165.8 |
136.8 |
21 |
E |
286.4 |
136.7 |
109 |
E |
34. South Interior Karnataka |
332.4 |
200.6 |
66 |
E |
202.8 |
199.7 |
2 |
N |
35. Kerala |
830.3 |
498.1 |
67 |
E |
529.3 |
498.5 |
6 |
N |
36. Lakshadweep |
436.1 |
328.9 |
33 |
E |
388.3 |
328.9 |
18 |
N |
E: Excess, i.e.,+20% or more |
|
|
18 |
|
|
|
13 |
|
N: Normal, i.e.,+19% to -19% |
|
|
7 |
|
|
|
10 |
|
D: Deficient, i.e.,-20% to -59% |
|
|
10 |
|
|
|
9 |
|
S: Scanty, i.e.,-60% or less |
|
|
1 |
|
|
|
4 |
|
NR No Rain, i.e. -100% |
|
|
0 |
|
|
|
0 |
|
TOTAL |
|
|
36 |
|
|
|
36 |
|
Source: India Meteorological Department. |
Statement II: State-wise Distribution of No. of Districts with Excess, Normal, Deficient, Scanty and No Rainfall |
01.10.2010 to 31.12.2010 |
S. No. |
STATES/UT |
E |
N |
D |
S |
NR |
ND |
TOTAL |
1 |
2 |
3 |
4 |
5 |
6 |
7 |
8 |
9 |
1 |
A & N Island (UT) |
3 |
0 |
0 |
0 |
0 |
0 |
3 |
2 |
Arunachal Pradesh |
1 |
2 |
5 |
4 |
0 |
4 |
16 |
3 |
Assam |
0 |
4 |
10 |
10 |
0 |
3 |
27 |
4 |
Meghalaya |
1 |
2 |
0 |
1 |
0 |
3 |
7 |
5 |
Nagaland |
1 |
0 |
1 |
0 |
0 |
9 |
11 |
6 |
Manipur |
1 |
0 |
0 |
0 |
0 |
8 |
9 |
7 |
Mizoram |
1 |
0 |
0 |
0 |
0 |
8 |
9 |
8 |
Tripura |
3 |
1 |
0 |
0 |
0 |
0 |
4 |
9 |
Sikkim |
0 |
0 |
3 |
0 |
0 |
1 |
4 |
10 |
West Bengal |
2 |
9 |
7 |
1 |
0 |
0 |
19 |
11 |
Orissa |
21 |
7 |
2 |
0 |
0 |
0 |
30 |
12 |
Jharkhand |
2 |
10 |
9 |
3 |
0 |
0 |
24 |
13 |
Bihar |
7 |
10 |
10 |
11 |
0 |
0 |
38 |
14 |
Uttar Pradesh |
4 |
10 |
14 |
41 |
2 |
0 |
71 |
15 |
Uttarakhand |
0 |
0 |
7 |
6 |
0 |
0 |
13 |
16 |
Haryana |
0 |
4 |
9 |
5 |
3 |
0 |
21 |
17 |
Chandigarh (UT) |
0 |
1 |
0 |
0 |
0 |
0 |
1 |
18 |
Delhi |
1 |
2 |
5 |
0 |
0 |
1 |
9 |
19 |
Punjab |
2 |
4 |
4 |
7 |
3 |
0 |
20 |
20 |
Himachal Pradesh |
3 |
5 |
4 |
0 |
0 |
0 |
12 |
21 |
Jammu & Kashmir |
4 |
8 |
3 |
4 |
0 |
3 |
22 |
22 |
Rajasthan |
24 |
5 |
2 |
1 |
1 |
0 |
33 |
23 |
Madhya Pradesh |
15 |
11 |
15 |
8 |
1 |
0 |
50 |
24 |
Gujarat |
17 |
6 |
1 |
2 |
0 |
0 |
26 |
25 |
Dadra and Nagar Haweli & Daman (UTs) |
1 |
1 |
0 |
0 |
0 |
0 |
2 |
26 |
Diu (UT) |
0 |
0 |
0 |
0 |
0 |
1 |
1 |
27 |
Goa |
2 |
0 |
0 |
0 |
0 |
0 |
2 |
28 |
Maharashtra |
23 |
10 |
2 |
0 |
0 |
0 |
35 |
29 |
Chhattisgarh |
7 |
4 |
6 |
1 |
0 |
0 |
18 |
30 |
Andhra Pradesh |
19 |
3 |
1 |
0 |
0 |
0 |
23 |
31 |
Tamil Nadu |
27 |
5 |
0 |
0 |
0 |
0 |
32 |
32 |
Puducherry (UT) |
0 |
2 |
0 |
0 |
0 |
2 |
4 |
33 |
Karnataka |
21 |
7 |
1 |
0 |
0 |
0 |
29 |
34 |
Kerala |
12 |
2 |
0 |
0 |
0 |
0 |
14 |
35 |
Lakshadweep (UT) |
1 |
0 |
0 |
0 |
0 |
0 |
1 |
|
Total |
226 |
135 |
121 |
105 |
10 |
43 |
640 |
E: Excess N: Normal D: Deficient
S: Scanty NR: No Rain ND: No Data
Source: India Meteorological Department. |
* Prepared in the Structural Issues Division, Department of Economic and Policy Research, Reserve Bank of India. 1 Excess: + 20 per cent or more; Normal: + 19 per cent to –19 per cent; Deficient: –20 per cent to – 59 per cent; Scanty: –60 per cent to –99 per cent; No Rain: –100 per cent (All with respect to the Long Period Average). |