Performance of Financial and Investment Companies, 2007-08* This article analyses the performance of select non-Government financial and investment companies (other than banking, insurance and chit-fund companies) during the year 2007-08, based on their audited annual accounts. The data are presented at the aggregate level for all select companies and also for major activity groups. The consolidated results of the select companies revealed an overall improved performance during 2007-08, as observed from impressive growth in income, profits and net savings. Profitability ratios like profit margin, return on assets and return on shareholders’ equity also increased during the year under review.
Financial and investment companies provide credit to businesses and households and also help in developing an efficient capital market in the country through investment holding, share trading and merchant banking activities. These companies originate loans and extend lease finance for purchase of consumer goods such as automobiles, electrical equipments and other appliances to the household sector. They supply short and medium-term credit (including leases) to businesses for acquiring fixed assets (land and building, plant and machinery, motor vehicles, etc.), working capital requirements, etc.
This article analyses the performance of non-Government financial and investment companies (other than banking, insurance and chit-fund companies) during the year 2007-08. The study is based on the audited annual accounts of 1175 companies, which closed their accounts during the period April 2007 to March 20081.
The segment of financial and investment companies in the private corporate sector is highly skewed. The presence of a large sized company, viz., Housing Development Finance Corporation (HDFC) Limited in the study would exert considerable influence on the various quantitative measures of overall performance of the companies in this group. In view of such marked skewness in the size structure, the analysis presented in the article excludes HDFC. Further, it is observed that the results of 13 other companies are in large variance with rest of the companies and accordingly these companies are also kept outside. Thus, the present analysis is confined to 1161 companies. The study also presents comparable data for the preceding two years, viz., 2005-06 and 2006-07 for the same set of companies, based on the analysis of their accounts for the respective years. The data on all the select 1175 companies including the outlier companies are separately presented in Annex 1 to 3.
In the case of companies, which either extended or shortened their accounting year, income, expenditure and appropriation account figures have been annualised. The balance sheet data, however, have been retained as presented in the annual accounts of the companies with the result that the consolidated data reported in the article refer to the aggregation of the balance sheets for varying periods. The analysis of the financial performance for the year, discussed below, is subject to this limitation.
I. Composition of the Select Companies
The select 1161 financial and investment companies were classified into five major groups, according to their activities, viz., (1) Share trading and investment holding, (2) Loan finance, (3) Hire purchase and Leasing finance, (4) Diversified and (5) Miscellaneous. A company was placed in one of these major activity groups if more than half of its annual income during the study year 2007-08 was derived from that activity consistent with the income yielding assets. In case no single activity was predominant, the company was classified under ‘Diversified’ group. Companies not fitting into any of these categories but conducting financial activities were classified as ‘Miscellaneous’. The composition of the select companies according to their total number, paid-up capital, main income and total net assets across the above mentioned activities are presented in Table 1.
The ‘Share trading and investment holding’ companies, which accounted for 45.5 per cent of the select 1161 companies, had a share of 38.4 per cent of the total paid-up capital in 2007-08; but accounted for only 21.5 per cent of the total net assets and 24.5 per cent of the total main income. ‘Loan finance’ and ‘Hire purchase & Leasing finance’ companies (36.3 per cent and 4.3 per cent, respectively, in terms of number) together accounted for 49.6 per cent of paid up capital, 62.6 per cent of total net assets and 54.1 per cent of main income of the select companies.
Table 1: Composition of the Select 1161 Companies by Activity, 2007-08 |
(Amount in Rs. crore) |
Activity |
Number of Companies |
Paid-up Capital |
Main Income |
Total Net Assets |
1 |
2 |
3 |
4 |
5 |
1. |
Share trading and |
528 |
6601 |
4017 |
32488 |
| |
investment holding |
(45.5) |
(38.4) |
(24.5) |
(21.5) |
2. |
Loan finance |
421 |
8113 |
6547 |
73456 |
| |
|
(36.3) |
(47.2) |
(40.0) |
(48.7) |
3. |
Hire purchase and |
50 |
408 |
2314 |
21049 |
| |
Leasing finance |
(4.3) |
(2.4) |
(14.1) |
(13.9) |
4. |
Diversified |
32 |
475 |
425 |
2585 |
| |
|
(2.8) |
(2.8) |
(2.6) |
(1.7) |
5. |
Miscellaneous |
130 |
1591 |
3068 |
21377 |
| |
|
(11.2) |
(9.3) |
(18.7) |
(14.2) |
All Activities |
1161 |
17188 |
16371 |
150955 |
| |
(100.0) |
(100.0) |
(100.0) |
(100.0) |
Note: Figures in parentheses represent percentages to total. |
II. Overall performance
The consolidated results of the select 1161 non-Government financial and investment companies indicated improved performance during 2007-08, as observed from growth in income, profits, and net saving, assets formation and increase in profitability ratios (Statements 1 & 2). The operating profits of the select companies registered a high growth of 69.2 per cent during 2007-08. Besides steep increase in income from main activities (47.7 per cent), income from other activities (76.7 per cent) contributed significantly to the growth in profits during the year. The profit margin (operating profits to main income) and the return on shareholders’ equity (profits after tax to net worth) further improved to 42.4 per cent and 10.5 per cent, respectively, in 2007-08 from 37.0 per cent and 10.1 per cent during 2006-07, respectively (Table 3). There was an overall increase in business activities of the select companies. Their total net assets increased by 39.8 per cent in 2007-08, compared to 19.6 per cent rise in 2006-07. Loans and advances went up by 45.0 per cent in 2007-08 as compared to 23.4 per cent in the previous year. Similarly investments increased by 47.5 per cent, as against an increase of 14.6 per cent in 2006-07 (Statement 1).
External sources continued to be the major source of finance during 2007-08, as only one-fifth of the total funds were raised internally. A substantial portion (56.6 per cent) of the funds raised during the year was deployed as loans and advances. The share of investments (incremental) in total uses of funds increased to 32.8 per cent during 2007-08 (21.1 per cent in 2006-07) (Table 4). III. Operational Results
The combined main income of the select 1161 financial and investment companies increased by 47.7 per cent during 2007-08 to Rs. 16,372 crore as against 19.0 per cent increase recorded in 2006-07 (Statements 1 & 3). Interest income increased by 43.8 per cent during the year, compared with 49.6 per cent in the previous year. While dividend income of select companies decreased by 21.8 per cent, brokerage and net profits from share dealings went up sharply by 77.5 per cent (from Rs. 1,475 to Rs. 2,617 crore) and 93.6 per cent (from Rs. 1,880 to Rs. 3,639 crore), respectively. Other income also went up by 76.7 per cent. The total income of the select companies increased by 52.6 per cent (21.1 per cent in the previous year), commensurate with the overall increase in business activities during the year. The total expenditure went up by 45.4 per cent in 2007-08 as against an increase of 27.6 per cent in the previous year. Employees’ remuneration witnessed a growth of 46.3 per cent in 2007-08 as against 37.4 per cent in 2006-07. Interest payments increased by 45.9 per cent during 2007-08 as against an increase of 42.4 per cent in the previous year. Depreciation provision increased by 30.0 per cent during the year.
The operating profits, pre-tax profits and post-tax profits recorded a steep growth of 69.2 per cent, 59.8 per cent and 55.6 per cent, respectively during the period under review.
Bad debts written off and provisions made for NPAs together accounted for about 4.2 per cent of the total income in 2007-08 as against 3.7 per cent in the previous year.
Among activity groups, ‘Share trading & investment holding’ companies performed better than other groups in terms of increase in their main income, operating profits and post-tax profits during 2007-08 (Table 2).
The profit margin (operating profits to main income) of the select companies improved to 42.4 per cent in 2007-08 from 37.0 per cent in 2006-07 (Table 3). The return on shareholders’ equity (post-tax profits to net worth) increased marginally to 10.5 per cent for the year 2007-08 from 10.1 per cent in 2006-07. The select companies ploughed back a higher share of their profits to reserves (profits retained to profits after tax) at 86.2 per cent in 2007-08 as against 82.0 per cent in 2006-07) (Statement 2). This was a prudent measure considering the high volatility of trading profits. The dividend rate decreased to 4.3 per cent in 2007-08 from 4.9 per cent in 2006-07.
Table 2: Growth Rates of Select items, 2006-07 and 2007-08 |
(Per cent) |
Item |
All Activities |
Share Trading and Investment Holding |
Loan Finance |
Hire Purchase and Leasing Finance |
Diversified |
2006-07 |
2007-08 |
2006-07 |
2007-08 |
2006-07 |
2007-08 |
2006-07 |
2007-08 |
2006-07 |
2007-08 |
1 |
2 |
3 |
4 |
5 |
6 |
7 |
8 |
9 |
10 |
11 |
1. |
Main income |
19.0 |
47.7 |
-7.7 |
58.3 |
33.6 |
44.8 |
27.3 |
34.2 |
-15.3 |
50.0 |
2. |
Total expenditure |
27.6 |
45.4 |
-9.1 |
35.1 |
30.9 |
40.4 |
27.3 |
35.5 |
-20.3 |
121.9 |
3. |
Operating profits |
8.5 |
69.2 |
-5.7 |
75.9 |
35.3 |
46.3 |
28.4 |
65.7 |
-21.0 |
4.1 |
4. |
Profits after tax |
4.2 |
55.6 |
-4.1 |
79.5 |
9.1 |
-4.6 |
42.7 |
53.4 |
-12.1 |
-1.6 |
Table 3: Select Profitability Ratios, 2006-07 and 2007-08 |
(Per cent) |
Ratio |
All Activities |
Share Trading and Investment Holding |
Loan Finance |
Hire Purchase and Leasing Finance |
Diversified |
2006-07 |
2007-08 |
2006-07 |
2007-08 |
2006-07 |
2007-08 |
2006-07 |
2007-08 |
2006-07 |
2007-08 |
1 |
2 |
3 |
4 |
5 |
6 |
7 |
8 |
9 |
10 |
11 |
1. |
Profit Margin |
37.0 |
42.4 |
65.1 |
72.4 |
21.5 |
21.7 |
20.4 |
25.2 |
41.8 |
29.0 |
2. |
Effective Tax Rate |
25.7 |
27.6 |
12.4 |
13.1 |
32.1 |
45.3 |
32.6 |
37.5 |
30.9 |
34.6 |
3. |
Return on Share- holders’ Equity |
10.1 |
10.5 |
9.3 |
11.4 |
9.0 |
5.7 |
8.5 |
11.3 |
8.7 |
8.1 |
4. |
Dividend Rate |
4.9 |
4.3 |
3.4 |
3.1 |
4.8 |
3.6 |
18.3 |
16.0 |
5.5 |
8.8 |
5. |
Return on Assets |
4.3 |
4.9 |
17.7 |
22.9 |
9.2 |
10.1 |
2.1 |
2.9 |
6.7 |
6.3 |
The profit margin was the highest for ‘Share trading & investment holding’ companies followed by ‘Diversified’ companies in 2007-08. The Dividend rate was the highest for ‘Hire purchase & Leasing finance’ companies.
IV. Sources and Uses of funds Sources of funds
The select companies raised their funds (net) to the tune of Rs. 42,485 crore in 2007-08 as against Rs. 17,771 crore raised in the previous year (Table 4). The companies continued to rely mostly on external sources of funds for their fund requirements. Their sources of finances, however, varied marginally from that of the previous year. External sources constituted 78.5 per cent of the total sources of funds as against 82.4 per cent in 2006-07. The share of ‘Borrowings’ declined to 52.8 per cent during 2007-08 from 71.1 per cent in 2006-07. The share of ‘Borrowings from banks’ in total sources of funds declined to 15.4 per cent from 26.2 per cent in the previous year. The share of funds mobilised from capital market through issue of fresh capital (including premium on shares) in total sources of funds decreased to 19.4 per cent from 23.2 per cent in 2006-07. The share of ‘Trade dues and other current liabilities’ increased to 5.9 per cent during 2007-08 (it had declined to the tune of 12.2 per cent during previous year).
Uses of Funds
The pattern of uses of funds of the select companies also showed some variation during 2007-08 when compared with that of the previous year. The share of receivables increased to 63.1 per cent in 2007-08, as compared to 43.0 per cent in 2006-07. About 56.6 per cent of the funds raised during the year were deployed as loans and advances (57.0 per cent in 2006-07). The share of sundry debtors in total uses of funds increased to 4.9 per cent. The share of investments in total uses of funds increased to 32.8 per cent during 2007-08. The select companies brought down their inventories (mainly industrial securities). The share of cash and bank balances (mostly deposits with banks) showed a decline during the year. Its share in total uses of funds decreased to 8.1 per cent from 14.1 per cent in 2006-07.
Table 4: Sources and Uses of Funds, 2006-07 and 2007-08 |
Sources and Uses of Funds |
Amount in Rs. crore |
Per cent Share in Total |
2006-07 |
2007-08 |
2006-07 |
2007-08 |
1 |
2 |
3 |
4 |
5 |
Sources of Funds |
|
|
|
|
Internal Sources |
3135 |
9134 |
17.6 |
21.5 |
A. |
Paid-up Capital |
51 |
749 |
0.3 |
1.8 |
B. |
Reserves and Surplus |
2842 |
8154 |
16.0 |
19.2 |
C. |
Provisions |
242 |
231 |
1.4 |
0.5 |
| |
of which: |
|
|
|
|
| |
Depreciation Provision |
66 |
-41 |
0.4 |
-0.1 |
External Sources |
14637 |
33350 |
82.4 |
78.5 |
D. |
Paid-up Capital |
4115 |
8242 |
23.2 |
19.4 |
| |
of which: |
|
|
|
|
| |
Premium on Shares |
3301 |
4590 |
18.6 |
10.8 |
E. |
Borrowings |
12631 |
22445 |
71.1 |
52.8 |
| |
of which: |
|
|
|
|
| |
from Banks |
4658 |
6554 |
26.2 |
15.4 |
F. |
Trade Dues and Other Current Liabilities |
-2165 |
2515 |
-12.2 |
5.9 |
| |
of which: |
|
|
|
|
| |
Sundry Creditors |
-3234 |
1292 |
-18.2 |
3.0 |
G. |
Others |
56 |
148 |
0.3 |
0.3 |
Total Sources/Uses of Funds |
17771 |
42485 |
100.0 |
100.0 |
Uses of Funds |
|
|
|
|
H. |
Cash and Bank Balances |
2498 |
3441 |
14.1 |
8.1 |
| |
of which: |
|
|
|
|
| |
Deposits with Banks |
2409 |
3447 |
13.6 |
8.1 |
I. |
Investments |
3741 |
13914 |
21.0 |
32.8 |
| |
of which: |
|
|
|
|
| |
Government and Semi-Government Securities |
-360 |
-9 |
-2.0 |
0.0 |
J. |
Receivables |
7642 |
26789 |
43.0 |
63.1 |
| |
of which: |
|
|
|
|
| |
Loans and Advances |
10131 |
24042 |
57.0 |
56.6 |
| |
Sundry Debtors |
-2361 |
2061 |
-13.3 |
4.9 |
K. |
Inventories |
3435 |
-1770 |
19.3 |
-4.2 |
L. |
Gross Fixed Assets |
460 |
-152 |
2.6 |
-0.4 |
M. |
Other Assets |
5 |
264 |
0.0 |
0.6 |
Total Sources/Uses of Funds |
17771 |
42485 |
100.0 |
100.0 |
‘Loan finance’ and ‘Hire purchase finance’ companies relied mainly on borrowings for enhancing their credit activities. While a major part of fresh borrowings for ‘Loan finance’ companies were from banks, for ‘Hire purchase finance’ companies, the major part was from Debentures. The ‘Share trading & investment holding’ companies relied more on internal sources of funds. They reported net repayment of borrowings thereby reducing dependence on external sources of funds. ‘Share trading & investment holding’ and ‘Loan finance’ companies recorded marked increase in their assets base. The loans and advances extended by these companies to their borrowers increased substantially. Overall, the Companies registered a decline in Gross Fixed Assets during the year. The Gross Fixed Assets of ‘Loan Finance’ and ‘Diversified’ companies, however, showed an increase during the year.
V. Capital and Assets Structure Capital Structure
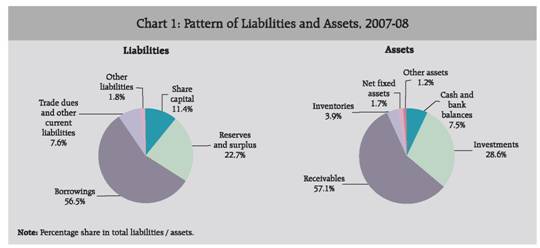
The total liabilities of the select companies increased by 39.8 per cent to Rs. 1,50,954 crore in 2007-08 (Statement 4). ‘Borrowings’ (outstanding) continued to be the major component, constituting 56.5 per cent of total liabilities in 2007-08. The share of bank borrowings in total borrowings decreased to 20.1 per cent from 22.0 per cent in the previous year. The debt-equity ratio decreased to 83.5 per cent from 97.6 per cent in 2007-08. The composition of total liabilities of the select companies across the major activities is given in Table 5. ‘Borrowings’ was the major constituent of liabilities in most of the activity groups except for ‘Share trading & Investment holding’ and ‘Diversified’ companies. For ‘Share trading & Investment holding’ companies, Reserve and Surplus was the major constituent (52.1 per cent) followed by ‘Borrowings’ (21.5 per cent).
Assets Structure
The assets pattern of the select companies showed marginal variation in 2007-08 from that of the previous year. While the share of loans and advances in total net assets increased to 51.4 per cent from 49.5 per cent in 2006-07, the share of investments increased to 28.6 per cent from 27.1 per cent in the previous year. The shares of inventories and net fixed assets decreased to 3.9 per cent and 1.7 per cent from 7.1 per cent and 2.5 per cent, respectively. The share of cash and bank balances increased marginally to 7.5 per cent from 7.2 per cent. The composition of assets across different activities, in 2006-07 and 2007-08, is given in Table 6.
Table 5: Capital Structure of Select Financial and Investment Companies, 2006-07 and 2007-08 |
(Per cent) |
Capital and Liabilities |
All Activities |
Share Trading and Investment Holding |
Loan Finance |
Hire Purchase and Leasing Finance |
Diversified |
2006-07 |
2007-08 |
2006-07 |
2007-08 |
2006-07 |
2007-08 |
2006-07 |
2007-08 |
2006-07 |
2007-08 |
1 |
2 |
3 |
4 |
5 |
6 |
7 |
8 |
9 |
10 |
11 |
A. |
Share Capital |
11.9 |
11.4 |
23.4 |
20.3 |
9.2 |
11.0 |
2.2 |
1.9 |
20.5 |
18.4 |
B |
Reserves and Surplus |
19.8 |
22.7 |
37.7 |
52.1 |
11.2 |
10.3 |
14.4 |
14.2 |
32.8 |
32.4 |
C |
Borrowings |
58.2 |
56.5 |
32.1 |
21.5 |
72.1 |
72.1 |
71.4 |
71.1 |
28.8 |
29.3 |
| |
of which: |
|
|
|
|
|
|
|
|
|
|
| |
Loans and Advances |
33.4 |
34.9 |
25.5 |
17.3 |
37.6 |
43.7 |
35.6 |
30.3 |
26.6 |
28.2 |
| |
From Banks |
22.0 |
20.1 |
9.9 |
3.7 |
26.9 |
25.0 |
28.5 |
22.4 |
16.6 |
21.6 |
D. |
Trade Dues and Other Current |
|
|
|
|
|
|
|
|
|
|
| |
Liabilities |
8.3 |
7.6 |
5.1 |
4.6 |
5.8 |
4.8 |
10.4 |
11.2 |
14.8 |
16.8 |
| |
of which: |
|
|
|
|
|
|
|
|
|
|
| |
Sundry Creditors |
3.5 |
3.3 |
1.3 |
1.4 |
1.8 |
1.3 |
2.5 |
2.9 |
8.0 |
10.9 |
E |
Other Liabilities |
1.8 |
1.8 |
1.7 |
1.5 |
1.7 |
1.9 |
1.6 |
1.6 |
3.2 |
3.1 |
Total |
100.0 |
100.0 |
100.0 |
100.0 |
100.0 |
100.0 |
100.0 |
100.0 |
100.0 |
100.0 |
Activity-wise, the assets structure of these companies was more or less in congruence with the major activity undertaken by them. While ‘Investments’ accounted for about 64.7 per cent of total net assets for ‘Share trading & investment holding’ companies; ‘Receivables’ formed 88.1 per cent and 67.7 per cent of total net assets, respectively, in the case of ‘Hire purchase & Leasing finance’ and ‘Loan finance’ companies.
Table 6: Assets Structure of the Select Financial and Investment Companies, 2006-07 and 2007-08 |
(Per cent) |
Assets |
All Activities |
Share Trading and investment Holding |
Loan Finance |
Hire Purchase and Leasing Finance |
Diversified |
2006-07 |
2007-08 |
2006-07 |
2007-08 |
2006-07 |
2007-08 |
2006-07 |
2007-08 |
2006-07 |
2007-08 |
1 |
2 |
3 |
4 |
5 |
6 |
7 |
8 |
9 |
10 |
11 |
A. |
Cash and Bank |
|
|
|
|
|
|
|
|
|
|
| |
Balances |
7.2 |
7.5 |
4.2 |
3.3 |
4.5 |
4.6 |
7.8 |
3.6 |
19.2 |
14.3 |
| |
of which: |
|
|
|
|
|
|
|
|
|
|
| |
Deposits with Banks |
7.0 |
7.3 |
4.2 |
3.2 |
4.4 |
4.5 |
7.5 |
3.4 |
18.8 |
13.8 |
B. |
Investments |
27.1 |
28.6 |
56.4 |
64.7 |
22.4 |
20.4 |
4.4 |
5.3 |
30.3 |
31.7 |
C. |
Receivables |
55.0 |
57.1 |
15.5 |
23.4 |
66.3 |
67.7 |
84.6 |
88.1 |
35.6 |
34.8 |
| |
of which: |
|
|
|
|
|
|
|
|
|
|
| |
Loans and Advances |
49.5 |
51.4 |
13.3 |
20.7 |
63.6 |
65.6 |
83.7 |
87.1 |
27.4 |
25.4 |
| |
Sundry Debtors |
4.2 |
4.4 |
1.4 |
1.4 |
1.6 |
0.8 |
0.2 |
0.3 |
5.3 |
6.0 |
D. |
Inventories |
7.1 |
3.9 |
19.5 |
6.1 |
4.4 |
4.9 |
0.2 |
0.2 |
4.0 |
5.2 |
| |
of which: |
|
|
|
|
|
|
|
|
|
|
| |
Industrial Securities |
6.0 |
2.5 |
19.4 |
6.1 |
2.2 |
2.1 |
0.1 |
0.1 |
3.8 |
5.0 |
E. |
Net Fixed Assets |
2.5 |
1.7 |
3.9 |
1.9 |
1.0 |
0.8 |
2.6 |
2.4 |
8.9 |
12.5 |
F. |
Other Assets |
1.0 |
1.2 |
0.5 |
0.6 |
1.4 |
1.6 |
0.4 |
0.5 |
2.0 |
1.5 |
Total |
100.0 |
100.0 |
100.0 |
100.0 |
100.0 |
100.0 |
100.0 |
100.0 |
100.0 |
100.0 |
Statement 1: Annual Growth Rates of Select Items - Select Financial and Investment Companies - Activity-wise, 2006-07 and 2007-08 |
(Per cent) |
Items |
All Activities (1161) |
Share Trading and Investment Holding (528) |
Loan Finance (421) |
2006-07 |
2007-08 |
2006-07 |
2007-08 |
2006-07 |
2007-08 |
1 |
2 |
3 |
4 |
5 |
6 |
7 |
1. |
Main income |
19.0 |
47.7 |
-7.7 |
58.3 |
33.6 |
44.8 |
| |
of which: Interest received |
49.6 |
43.8 |
23.7 |
33.8 |
45.5 |
54.5 |
| |
Dividend received |
48.1 |
-21.8 |
33.0 |
-1.1 |
70.1 |
-63.5 |
2. |
Other income |
32.2 |
76.7 |
13.4 |
111.5 |
17.7 |
13.5 |
3. |
Total income |
21.1 |
52.6 |
-3.5 |
64.0 |
28.5 |
34.9 |
4. |
Total expenditure |
27.6 |
45.4 |
-9.1 |
35.1 |
30.9 |
40.4 |
5. |
Interest payment |
42.4 |
45.9 |
33.7 |
37.4 |
42.3 |
43.2 |
6. |
Depreciation provision |
14.7 |
30.0 |
31.0 |
13.3 |
-22.7 |
44.1 |
7. |
Employees’ remuneration |
37.4 |
46.3 |
32.3 |
13.0 |
37.6 |
41.9 |
8. |
Operating profits |
8.5 |
69.2 |
-5.7 |
75.9 |
35.3 |
46.3 |
9. |
Non-operating surplus/ deficit |
32.8 |
-10.6 |
-209.5 |
237.5 |
-2.1 |
-49.7 |
10. |
Profits before tax |
10.9 |
59.8 |
0.0 |
80.9 |
21.8 |
18.4 |
11. |
Tax provision |
36.5 |
71.9 |
43.8 |
90.7 |
61.3 |
67.1 |
12. |
Profits after tax |
4.2 |
55.6 |
-4.1 |
79.5 |
9.1 |
-4.6 |
13. |
Dividend paid |
18.7 |
19.2 |
27.3 |
-3.9 |
23.9 |
28.8 |
14. |
Profits retained |
1.5 |
63.6 |
-7.8 |
93.2 |
5.2 |
-15.2 |
15. |
Investments @ |
14.6 |
47.5 |
20.1 |
41.5 |
2.0 |
32.0 |
16. |
Loans and advances @ |
23.4 |
45.0 |
-22.8 |
93.1 |
30.4 |
50.1 |
17. |
Total net assets @ |
19.6 |
39.8 |
22.3 |
23.5 |
20.5 |
45.6 |
18. |
Borrowings @ |
25.1 |
35.7 |
20.7 |
-17.3 |
20.3 |
45.5 |
| |
of which: from banks@ |
24.4 |
27.6 |
19.7 |
-53.5 |
21.6 |
26.3 |
19. |
Net worth @ |
26.1 |
50.7 |
23.7 |
46.3 |
23.3 |
51.5 |
@ : Adjusted for revaluation etc., if any.
* : Numerator is negative or nil or negligible as compared to denominator.
# : Denominator is negative or nil or negligible as compared to numerator.
$ : Both numerator and denominator are negative or nil.
– : Nil or negligible.
Note : Figures in brackets in column headings denote the number of companies. |
Statement 1: Annual Growth Rates of Select Items - Select Financial and Investment Companies - Activity-wise, 2006-07 and 2007-08 (Concld.) |
(Per cent) |
Items |
Hire Purchase and Leasing Finance (50) |
Diversified (32) |
Miscellaneous (130) |
2006-07 |
2007-08 |
2006-07 |
2007-08 |
2006-07 |
2007-08 |
1 |
8 |
9 |
10 |
11 |
12 |
13 |
1. |
Main income |
27.3 |
34.2 |
-15.3 |
50.0 |
35.4 |
52.0 |
| |
of which: Interest received |
56.3 |
39.5 |
113.6 |
-9.9 |
87.2 |
-19.9 |
| |
Dividend received |
92.0 |
-38.6 |
37.4 |
-69.2 |
139.7 |
-37.1 |
2. |
Other income |
29.9 |
119.9 |
-29.1 |
167.6 |
55.4 |
83.8 |
3. |
Total income |
27.6 |
41.4 |
-17.3 |
82.0 |
43.8 |
64.3 |
4. |
Total expenditure |
27.3 |
35.5 |
-20.3 |
121.9 |
60.1 |
54.8 |
5. |
Interest payment |
41.0 |
40.0 |
9.9 |
27.2 |
72.0 |
95.9 |
6. |
Depreciation provision |
15.6 |
25.4 |
24.0 |
56.3 |
34.8 |
30.7 |
7. |
Employees’ remuneration |
29.1 |
44.9 |
-7.8 |
24.2 |
47.5 |
57.2 |
8. |
Operating profits |
28.4 |
65.7 |
-21.0 |
4.1 |
13.8 |
89.0 |
9. |
Non-operating surplus/ deficit |
34.8 |
61.8 |
48.8 |
3.8 |
226.9 |
5.4 |
10. |
Profits before tax |
28.7 |
65.5 |
-11.0 |
4.0 |
16.5 |
86.1 |
11. |
Tax provision |
7.0 |
90.5 |
-8.4 |
16.5 |
29.0 |
68.1 |
12. |
Profits after tax |
42.7 |
53.4 |
-12.1 |
-1.6 |
10.6 |
96.0 |
13. |
Dividend paid |
-2.6 |
-8.6 |
-9.2 |
60.5 |
18.6 |
59.9 |
14. |
Profits retained |
75.4 |
78.2 |
-13.0 |
-21.3 |
9.5 |
101.5 |
15. |
Investments @ |
-12.7 |
41.5 |
221.9 |
16.0 |
67.3 |
224.6 |
16. |
Loans and advances @ |
23.3 |
23.3 |
11.6 |
3.0 |
49.5 |
50.8 |
17. |
Total net assets @ |
26.4 |
18.5 |
12.7 |
11.0 |
2.8 |
92.9 |
18. |
Borrowings @ |
27.1 |
17.9 |
38.9 |
13.4 |
83.9 |
105.5 |
| |
of which: from banks@ |
9.2 |
-6.8 |
77.6 |
30.8 |
138.1 |
155.9 |
19. |
Net worth @ |
26.4 |
14.7 |
32.1 |
5.3 |
46.7 |
114.9 |
Statement 2: Select Financial Ratios - Select Financial and Investment Companies - Activity-wise, 2005-06 to 2007-08 |
(Per cent) |
Items |
All Activities (1161) |
Share Trading and Investment Holding (528) |
Loan Finance (421) |
2005-06 |
2006-07 |
2007-08 |
2005-06 |
2006-07 |
2007-08 |
2005-06 |
2006-07 |
2007-08 |
1 |
2 |
3 |
4 |
5 |
6 |
7 |
8 |
9 |
10 |
Profit Allocation Ratios |
|
|
|
|
|
|
|
|
|
1. |
Tax provision to profits before tax |
20.9 |
25.7 |
27.6 |
8.6 |
12.4 |
13.1 |
24.2 |
32.1 |
45.3 |
2. |
Dividends to profits before tax |
12.5 |
13.4 |
10.0 |
9.7 |
12.3 |
6.5 |
16.1 |
16.4 |
17.8 |
3. |
Profits retained to profits before tax |
66.6 |
61.0 |
62.4 |
81.7 |
75.3 |
80.4 |
59.7 |
51.5 |
36.9 |
4. |
Dividends to profits after tax |
15.8 |
18.0 |
13.8 |
10.6 |
14.1 |
7.5 |
21.3 |
24.1 |
32.6 |
5. |
Profits retained to profits after tax |
84.2 |
82.0 |
86.2 |
89.4 |
85.9 |
92.5 |
78.7 |
75.9 |
67.4 |
Profitability Ratios |
|
|
|
|
|
|
|
|
|
1. |
Operating profits to main income |
40.6 |
37.0 |
42.4 |
63.7 |
65.1 |
72.4 |
21.2 |
21.5 |
21.7 |
2. |
Operating profits to total net assets |
4.2 |
3.8 |
4.6 |
8.1 |
6.3 |
9.0 |
1.7 |
1.9 |
1.9 |
3. |
Profit after tax to total net assets |
4.6 |
4.3 |
4.9 |
19.5 |
17.7 |
22.9 |
10.0 |
9.2 |
10.1 |
4. |
Profits after tax to net worth |
12.3 |
10.1 |
10.5 |
12.0 |
9.3 |
11.4 |
10.2 |
9.0 |
5.7 |
5. |
Dividends to total paid-up capital |
4.4 |
4.9 |
4.3 |
2.8 |
3.4 |
3.1 |
4.4 |
4.8 |
3.6 |
6. |
Dividends to net worth |
1.9 |
1.8 |
1.4 |
1.3 |
1.3 |
0.9 |
2.2 |
2.2 |
1.9 |
Capital Structure Ratios |
|
|
|
|
|
|
|
|
|
1. |
Net worth to total net assets |
23.7 |
25.0 |
28.0 |
60.4 |
61.1 |
72.4 |
20.0 |
20.5 |
21.3 |
2. |
Debt to equity |
91.1 |
97.6 |
83.5 |
15.4 |
20.9 |
10.3 |
196.2 |
203.1 |
177.3 |
3. |
Total outside liabilities to networth |
233.8 |
216.4 |
193.6 |
65.4 |
63.6 |
38.1 |
399.7 |
388.3 |
369.3 |
4. |
Borrowing to total assets |
55.6 |
58.2 |
56.5 |
32.5 |
32.1 |
21.5 |
72.2 |
72.1 |
72.1 |
5. |
Bank borrowing to total borrowing |
38.0 |
37.7 |
35.5 |
31.3 |
31.0 |
17.5 |
36.9 |
37.3 |
34.7 |
* : Numerator is negative or nil or negligible as compared to denominator.
# : Denominator is negative or nil or negligible as compared to numerator.
$ : Both numerator and denominator are negative or nil.
Note : Figures in brackets denote the number of companies. |
Statement 2: Select Financial Ratios - Select Financial and Investment Companies - Activity-wise, 2005-06 to 2007-08 (Concld.) |
(Per cent) |
Items |
Hire Purchase and Leasing Finance (50) |
Diversified (32) |
Miscellaneous (130) |
2005-06 |
2006-07 |
2007-08 |
2005-06 |
2006-07 |
2007-08 |
2005-06 |
2006-07 |
2007-08 |
1 |
11 |
12 |
13 |
14 |
15 |
16 |
17 |
18 |
19 |
Profit Allocation Ratios |
|
|
|
|
|
|
|
|
|
1. |
Tax provision to profits before tax |
39.2 |
32.6 |
37.5 |
30.0 |
30.9 |
34.6 |
32.2 |
35.7 |
32.2 |
2. |
Dividends to profits before tax |
25.4 |
19.2 |
10.6 |
16.4 |
16.7 |
25.7 |
8.3 |
8.5 |
7.3 |
3. |
Profits retained to profits before tax |
35.3 |
48.2 |
51.9 |
53.6 |
52.4 |
39.7 |
59.4 |
55.8 |
60.5 |
4. |
Dividends to profits after tax |
41.9 |
28.6 |
17.0 |
23.4 |
24.1 |
39.4 |
12.3 |
13.2 |
10.8 |
5. |
Profits retained to profits after tax |
58.1 |
71.4 |
83.0 |
76.6 |
75.9 |
60.6 |
87.7 |
86.8 |
89.2 |
Profitability Ratios |
|
|
|
|
|
|
|
|
|
1. |
Operating profits to main income |
20.2 |
20.4 |
25.2 |
44.8 |
41.8 |
29.0 |
59.5 |
50.0 |
62.2 |
2. |
Operating profits to total net assets |
2.0 |
2.0 |
2.8 |
7.3 |
5.1 |
4.8 |
8.2 |
9.1 |
8.9 |
3. |
Profit after tax to total net assets |
2.1 |
2.1 |
2.9 |
8.5 |
6.7 |
6.3 |
5.6 |
6.1 |
6.2 |
4. |
Profits after tax to net worth |
7.5 |
8.5 |
11.3 |
13.1 |
8.7 |
8.1 |
25.5 |
19.2 |
17.5 |
5. |
Dividends to total paid-up capital |
20.9 |
18.3 |
16.0 |
6.6 |
5.5 |
8.8 |
7.4 |
8.0 |
8.9 |
6. |
Dividends to net worth |
3.1 |
2.4 |
1.9 |
3.1 |
2.1 |
3.2 |
3.1 |
2.5 |
1.9 |
Capital Structure Ratios |
|
|
|
|
|
|
|
|
|
1. |
Net worth to total net assets |
16.6 |
16.6 |
16.1 |
45.5 |
53.3 |
50.8 |
22.2 |
31.6 |
35.2 |
2. |
Debt to equity |
198.9 |
231.9 |
268.0 |
11.9 |
30.9 |
39.1 |
60.5 |
48.5 |
41.9 |
3. |
Total outside liabilities to networth |
500.6 |
500.8 |
520.3 |
119.9 |
87.7 |
97.0 |
351.4 |
216.2 |
183.9 |
4. |
Borrowing to total assets |
71.0 |
71.4 |
71.1 |
23.3 |
28.8 |
29.3 |
23.8 |
42.6 |
45.4 |
5. |
Bank borrowing to total borrowing |
46.5 |
39.9 |
31.5 |
45.2 |
57.8 |
73.7 |
34.5 |
44.7 |
55.7 |
Statement 3: Combined Income, Expenditure and Appropriation Accounts -Select Financial and Investment Companies - Activity-wise, 2005-06 to 2007-08 |
(Rs. lakh) |
Items |
All Activities (1161) |
Share Trading and Investment Holding (528) |
Loan Finance (421) |
2005-06 |
2006-07 |
2007-08 |
2005-06 |
2006-07 |
2007-08 |
2005-06 |
2006-07 |
2007-08 |
1 |
2 |
3 |
4 |
5 |
6 |
7 |
8 |
9 |
10 |
Income |
|
|
|
|
|
|
|
|
|
1. |
Main Income |
931472 |
1108477 |
1637172 |
275086 |
253808 |
401757 |
338504 |
452135 |
654675 |
| |
(a) |
Interest |
308081 |
460809 |
662445 |
13453 |
16641 |
22274 |
252228 |
367091 |
567122 |
| |
|
(i) On loans and advances |
222145 |
328488 |
447971 |
4255 |
4917 |
8246 |
190533 |
275151 |
417854 |
| |
|
(ii) Others |
85936 |
132321 |
214474 |
9198 |
11724 |
14028 |
61695 |
91940 |
149269 |
| |
(b) |
Dividends |
82596 |
122348 |
95691 |
57153 |
76000 |
75190 |
17417 |
29623 |
10811 |
| |
(c) |
Brokerage |
128901 |
147480 |
261730 |
3096 |
3205 |
3511 |
1596 |
505 |
1847 |
| |
(d) |
Net profit/ loss in share dealings |
263889 |
188014 |
363906 |
193588 |
148925 |
293725 |
42086 |
25950 |
40705 |
| |
(e) |
Net earnings from hire purchase financing |
12800 |
16990 |
21519 |
361 |
91 |
55 |
1863 |
2608 |
3112 |
| |
(f) |
Lease rentals |
19999 |
19924 |
38206 |
4179 |
8124 |
6506 |
6546 |
2882 |
3066 |
2. |
Other income |
175132 |
231469 |
409008 |
9997 |
11337 |
23983 |
44479 |
52356 |
59420 |
| |
of which: rent |
2881 |
3405 |
5120 |
1091 |
1391 |
1876 |
696 |
713 |
884 |
3. |
Non-operating surplus(+)/ deficit(-) |
41091 |
54566 |
48768 |
-4793 |
5247 |
17709 |
40770 |
39901 |
20074 |
4. |
Total (1+2+3) |
1147695 |
1394511 |
2094948 |
280290 |
270392 |
443449 |
423753 |
544392 |
734170 |
Expenditure and Appropriations |
|
|
|
|
|
|
|
|
|
5. |
Interest |
277015 |
394379 |
575237 |
33795 |
45169 |
62062 |
161186 |
229309 |
328281 |
6. |
Salaries, wages and bonus |
86801 |
120115 |
179319 |
7525 |
8878 |
11263 |
26299 |
36843 |
52504 |
7. |
Provident fund |
5004 |
5820 |
9184 |
404 |
424 |
607 |
2155 |
2171 |
3561 |
8. |
Employees’ welfare expenses |
9032 |
12612 |
14166 |
502 |
1855 |
739 |
1620 |
2368 |
2636 |
9. |
Managerial remuneration |
6798 |
8314 |
10756 |
1256 |
1261 |
1490 |
1505 |
1485 |
1938 |
10. |
Bad debts # |
73762 |
51942 |
88452 |
28028 |
2604 |
3128 |
25643 |
32380 |
54767 |
11. |
Other expenses |
237669 |
292499 |
417218 |
30835 |
31311 |
41167 |
83064 |
95879 |
110359 |
| |
of which: (a) Rent |
14144 |
19258 |
30292 |
847 |
1134 |
1440 |
4756 |
7033 |
11568 |
| |
(b) Insurance |
2857 |
2590 |
3969 |
655 |
545 |
702 |
1321 |
601 |
1364 |
| |
(c) Advertisement |
9204 |
9825 |
15751 |
333 |
430 |
849 |
3974 |
3865 |
3999 |
12. |
Depreciation provision |
24592 |
28202 |
36661 |
4651 |
6091 |
6904 |
6278 |
4855 |
6997 |
13. |
Other provisions (other than tax and depreciation) |
7710 |
15507 |
20566 |
2824 |
2248 |
7573 |
3396 |
1978 |
10782 |
14. |
Operating profits |
378221 |
410557 |
694620 |
175262 |
165303 |
290807 |
71838 |
97222 |
142271 |
15. |
Non-operating surplus(+)/deficit(-) |
41091 |
54566 |
48768 |
-4793 |
5247 |
17709 |
40770 |
39901 |
20074 |
16. |
Profits before tax |
419312 |
465123 |
743388 |
170469 |
170550 |
308516 |
112607 |
137123 |
162345 |
17. |
Less: tax provision |
87530 |
119440 |
205340 |
14734 |
21183 |
40393 |
27258 |
43972 |
73473 |
18. |
Profits after tax |
331782 |
345683 |
538048 |
155735 |
149367 |
268123 |
85349 |
93151 |
88872 |
| |
(a) |
Dividends |
52366 |
62144 |
74096 |
16510 |
21014 |
20201 |
18155 |
22494 |
28978 |
| |
|
(i) Ordinary |
50624 |
61000 |
71594 |
16258 |
20750 |
18743 |
17564 |
22167 |
28785 |
| |
|
(ii) Preference |
1742 |
1144 |
2502 |
252 |
264 |
1457 |
591 |
327 |
192 |
| |
(b) |
Profits retained |
279416 |
283539 |
463952 |
139225 |
128353 |
247922 |
67194 |
70657 |
59894 |
19. |
Total (5 to 15) |
1147695 |
1394511 |
2094948 |
280290 |
270392 |
443448 |
423753 |
544392 |
734170 |
# : Incuding provision for bad debts.
– : Nil or negligible .
Note : Figures in brackets in column headings denote the number of companies. |
Statement 3: Combined Income, Expenditure and Appropriation Accounts -Select Financial and Investment Companies - Activity-wise, 2005-06 to 2007-08 (Concld.) |
(Rs. lakh) |
Items |
Hire Purchase and Leasing Finance (50) |
Diversified (32) |
Miscellaneous (130) |
2005-06 |
2006-07 |
2007-08 |
2005-06 |
2006-07 |
2007-08 |
2005-06 |
2006-07 |
2007-08 |
1 |
11 |
12 |
13 |
14 |
15 |
16 |
17 |
18 |
19 |
Income |
|
|
|
|
|
|
|
|
|
1. |
Main Income |
135397 |
172379 |
231400 |
33448 |
28316 |
42480 |
149037 |
201839 |
306860 |
| |
(a) |
Interest |
11173 |
17462 |
24367 |
4384 |
9364 |
8436 |
26843 |
50251 |
40246 |
| |
|
(i) On loans and advances |
6885 |
11541 |
15784 |
2021 |
4384 |
3070 |
18451 |
32495 |
3017 |
| |
|
(ii) Others |
4288 |
5921 |
8583 |
2363 |
4981 |
5366 |
8392 |
17755 |
37228 |
| |
(b) |
Dividends |
1402 |
2691 |
1653 |
1802 |
2476 |
763 |
4822 |
11558 |
7274 |
| |
(c) |
Brokerage |
10 |
18 |
1225 |
18362 |
12160 |
16472 |
105837 |
131592 |
238675 |
| |
(d) |
Net profit/ loss in share dealings |
14745 |
8014 |
8116 |
5044 |
-801 |
831 |
8426 |
5926 |
20529 |
| |
(e) |
Net earnings from hire purchase financing |
10253 |
13893 |
18247 |
90 |
155 |
95 |
233 |
243 |
10 |
| |
(f) |
Lease rentals |
5531 |
5260 |
13568 |
2948 |
3563 |
15019 |
795 |
95 |
47 |
2. |
Other income |
11719 |
15222 |
33469 |
19779 |
14017 |
37513 |
89158 |
138537 |
254623 |
| |
of which: rent |
546 |
657 |
1065 |
151 |
208 |
470 |
397 |
436 |
825 |
3. |
Non-operating surplus(+)/ deficit(-) |
1471 |
1984 |
3210 |
2513 |
3740 |
3882 |
1130 |
3694 |
3893 |
4. |
Total (1+2+3) |
148587 |
189585 |
268079 |
55740 |
46074 |
83874 |
239325 |
344068 |
565376 |
Expenditure and Appropriations |
|
|
|
|
|
|
|
|
|
5. |
Interest |
58765 |
82877 |
116022 |
4827 |
5305 |
6749 |
18442 |
31719 |
62123 |
6. |
Salaries, wages and bonus |
8869 |
11506 |
16737 |
5207 |
4900 |
7581 |
38901 |
57988 |
91234 |
7. |
Provident fund |
619 |
785 |
1215 |
372 |
352 |
319 |
1454 |
2088 |
3482 |
8. |
Employees’ welfare expenses |
568 |
688 |
859 |
1771 |
1522 |
516 |
4571 |
6179 |
9416 |
9. |
Managerial remuneration |
537 |
725 |
603 |
363 |
580 |
656 |
3137 |
4263 |
6069 |
10. |
Bad debts # |
15208 |
10339 |
14952 |
713 |
1439 |
1416 |
4170 |
5180 |
14189 |
11. |
Other expenses |
29226 |
39492 |
47102 |
22770 |
14066 |
47229 |
71774 |
111751 |
171361 |
| |
of which: (a) Rent |
852 |
1057 |
1664 |
1660 |
786 |
1046 |
6029 |
9248 |
14574 |
| |
(b) Insurance |
205 |
190 |
197 |
241 |
308 |
539 |
435 |
946 |
1167 |
| |
(c) Advertisement |
850 |
782 |
798 |
729 |
387 |
513 |
3318 |
4361 |
9592 |
12. |
Depreciation provision |
5102 |
5896 |
7391 |
1643 |
2037 |
3183 |
6918 |
9323 |
12186 |
13. |
Other provisions (other than tax and depreciation) |
808 |
98 |
1671 |
562 |
283 |
7 |
120 |
10900 |
533 |
14. |
Operating profits |
27413 |
35196 |
58318 |
15001 |
11850 |
12335 |
88707 |
100986 |
190889 |
15. |
Non-operating surplus(+)/ deficit(-) |
1471 |
1984 |
3210 |
2513 |
3740 |
3882 |
1130 |
3694 |
3893 |
16. |
Profits before tax |
28884 |
37179 |
61528 |
17514 |
15590 |
16217 |
89838 |
104681 |
194782 |
17. |
Less: tax provision |
11328 |
12119 |
23080 |
5254 |
4815 |
5610 |
28956 |
37351 |
62784 |
18. |
Profits after tax |
17556 |
25060 |
38447 |
12260 |
10775 |
10608 |
60882 |
67330 |
131998 |
| |
(a) |
Dividends |
7349 |
7156 |
6543 |
2865 |
2600 |
4174 |
7487 |
8880 |
14200 |
| |
|
(i) Ordinary |
7349 |
7143 |
6536 |
2865 |
2600 |
4173 |
6588 |
8340 |
13357 |
| |
|
(ii) Preference |
- |
13 |
7 |
- |
- |
1 |
899 |
540 |
845 |
| |
(b) |
Profits retained |
10207 |
17904 |
31904 |
9395 |
8175 |
6434 |
53395 |
58450 |
117798 |
19. |
Total (5 to 15) |
148587 |
189585 |
268079 |
55740 |
46074 |
83874 |
239325 |
344068 |
565377 |
Statement 4: Combined Balance Sheet - Select Financial and Investment Companies-activity-wise, 2005-06 To 2007-08 |
(Rs. lakh) |
Capital and Liabilities |
All Activities (1161) |
Share Trading and Investment Holding (528) |
Loan Finance (421) |
2005-06 |
2006-07 |
2007-08 |
2005-06 |
2006-07 |
2007-08 |
2005-06 |
2006-07 |
2007-08 |
1 |
2 |
3 |
4 |
5 |
6 |
7 |
8 |
9 |
10 |
A. |
Share Capital |
1192954 |
1279273 |
1719414 |
595853 |
615763 |
660608 |
417017 |
465998 |
811273 |
| |
1. |
Paid-up capital |
1192489 |
1278794 |
1718861 |
595481 |
615391 |
660154 |
416959 |
465926 |
811209 |
| |
|
(a) Ordinary |
1122972 |
1203511 |
1456659 |
572283 |
589241 |
626017 |
393458 |
441945 |
628965 |
| |
|
of which: bonus |
34035 |
39087 |
113968 |
18051 |
18611 |
42696 |
6478 |
6478 |
55978 |
| |
|
(b) Preference |
69517 |
75284 |
262202 |
23199 |
26149 |
34137 |
23501 |
23981 |
182244 |
| |
2. |
Forfeited shares |
465 |
479 |
553 |
372 |
372 |
454 |
58 |
72 |
64 |
B. |
Reserves and Surplus |
1512415 |
2132687 |
3422675 |
704941 |
992988 |
1692623 |
421082 |
567432 |
753928 |
| |
3. |
Capital reserve |
874009 |
1211423 |
1648796 |
391025 |
551282 |
610781 |
279302 |
359112 |
484734 |
| |
|
of which: premium on shares |
687972 |
1013718 |
1435363 |
272716 |
431613 |
489812 |
242781 |
314688 |
438870 |
| |
4. |
Investment allowance reserve |
160 |
165 |
152 |
120 |
125 |
120 |
26 |
26 |
26 |
| |
5. |
Sinking funds |
21939 |
24869 |
429028 |
11210 |
9313 |
394710 |
1971 |
2209 |
1922 |
| |
6. |
Other reserves |
616306 |
896232 |
1344700 |
302586 |
432268 |
687013 |
139784 |
206085 |
267245 |
C. |
Borrowings |
5023762 |
6286872 |
8531335 |
698911 |
843457 |
697575 |
3022762 |
3636686 |
5292663 |
| |
7. |
Debentures @ |
1349036 |
2012156 |
2614254 |
109535 |
146364 |
109674 |
809250 |
1217817 |
1573006 |
| |
8. |
Loans and advances |
3012842 |
3606387 |
5264227 |
566482 |
670340 |
561505 |
1695327 |
1895353 |
3213459 |
| |
|
(a) From banks |
1907250 |
2373030 |
3028455 |
218629 |
261782 |
121767 |
1114523 |
1355428 |
1839189 |
| |
|
of which: short-term borrowings |
1701396 |
2060039 |
2393634 |
217514 |
260386 |
120177 |
952361 |
1144576 |
1399674 |
| |
|
(b) From other Indian Financial Institutions |
114675 |
146825 |
263485 |
13367 |
42310 |
47611 |
94806 |
98105 |
206363 |
| |
|
(c) From Foreign Institutional agencies |
73028 |
138954 |
81833 |
52192 |
118142 |
58029 |
- |
- |
2940 |
| |
|
(d) From Government and semi-Government bodies |
28394 |
45305 |
47644 |
82 |
82 |
82 |
- |
- |
- |
| |
|
(e) From companies |
480699 |
417518 |
824567 |
213695 |
209795 |
261110 |
232668 |
166391 |
498404 |
| |
|
(f) From others |
408796 |
484755 |
1018243 |
68517 |
38229 |
72906 |
225017 |
230205 |
619001 |
| |
9. |
Deferred payments |
426 |
36 |
36 |
405 |
9 |
5 |
4 |
15 |
24 |
| |
10 |
Public deposits |
661457 |
668294 |
652818 |
22491 |
26744 |
26392 |
518181 |
523502 |
506174 |
| |
|
(Of total borrowings, debt) |
2464892 |
3328599 |
4294921 |
199756 |
335571 |
243389 |
1643945 |
2099017 |
2775595 |
D. |
Trade Dues and Other Current Liabilities |
1117487 |
900991 |
1152520 |
108851 |
134691 |
149801 |
242547 |
291682 |
350084 |
| |
11. |
Sundry creditors |
697969 |
374499 |
503657 |
29134 |
33258 |
44786 |
76744 |
92034 |
97258 |
| |
12. |
Acceptances |
17 |
- |
- |
17 |
- |
- |
- |
- |
- |
| |
13. |
Liabilities to subsidiaries and holding companies |
1159 |
5861 |
892 |
836 |
5838 |
846 |
- |
- |
- |
| |
14. |
Advances and deposits from customers, agents , etc. |
71895 |
87729 |
118742 |
12988 |
11739 |
29410 |
17834 |
21197 |
22781 |
| |
15. |
Interest accrued on loans |
106621 |
144602 |
190003 |
21435 |
29725 |
19691 |
41254 |
56389 |
88612 |
| |
16. |
Others |
239826 |
288300 |
339228 |
44442 |
54132 |
55068 |
106472 |
122039 |
141386 |
E. |
Provisions |
182868 |
195655 |
269479 |
43303 |
44792 |
48164 |
84556 |
84916 |
137630 |
| |
17. |
Taxation (net of advance of income-tax) |
- |
- |
- |
- |
- |
- |
- |
- |
- |
| |
18. |
Dividends |
35851 |
34294 |
54600 |
13993 |
13137 |
15797 |
8696 |
10675 |
15929 |
| |
19. |
Other current provisions |
142597 |
153353 |
204824 |
28617 |
30964 |
30854 |
75538 |
70135 |
119148 |
| |
20. |
Non-current provisions |
4419 |
8008 |
10055 |
693 |
691 |
1513 |
322 |
4106 |
2553 |
F. |
21. |
Miscellaneous Non-current Liabilities |
- |
- |
- |
- |
- |
- |
- |
- |
- |
| |
22. |
Total |
9029485 |
10795478 |
15095424 |
2151858 |
2631690 |
3248771 |
4187964 |
5046713 |
7345578 |
@ : Includes privately placed debentures.
– : Nil or negligible.
Note : Figures in brackets in column headings denote the number of companies. |
Statement 4: Combined Balance Sheet - Select Financial and Investment Companies-activity-wise, 2005-06 To 2007-08 (Contd.) |
(Rs. lakh) |
Assets |
All Activities (1161) |
Share Trading and Investment Holding (528) |
Loan Finance (421) |
2005-06 |
2006-07 |
2007-08 |
2005-06 |
2006-07 |
2007-08 |
2005-06 |
2006-07 |
2007-08 |
1 |
2 |
3 |
4 |
5 |
6 |
7 |
8 |
9 |
10 |
G. |
Cash and Bank Balances |
532179 |
781962 |
1126097 |
88015 |
111727 |
106278 |
190599 |
228991 |
338654 |
| |
23. |
Deposits with banks |
519449 |
760370 |
1105071 |
85820 |
109874 |
103355 |
184688 |
220749 |
328430 |
| |
24. |
Cash in hand |
12730 |
21593 |
21027 |
2195 |
1854 |
2923 |
5912 |
8242 |
10225 |
H. |
Investments |
2556259 |
2930366 |
4321659 |
1236124 |
1485087 |
2101555 |
1110031 |
1132714 |
1495277 |
| |
of which: quoted investments |
743224 |
693662 |
735051 |
604231 |
593221 |
571351 |
99338 |
52274 |
108058 |
| |
25. |
Foreign securities |
1118 |
402 |
254 |
671 |
- |
62 |
59 |
59 |
- |
| |
26. |
Indian securities |
2555141 |
2929964 |
4321405 |
1235453 |
1485087 |
2101493 |
1109972 |
1132655 |
1495277 |
| |
|
(a) |
Government and semi- Government securities |
83035 |
47009 |
46145 |
2557 |
3287 |
4451 |
65148 |
29349 |
26906 |
| |
|
(b) |
Public sector undertakings |
18729 |
18582 |
19249 |
574 |
1103 |
1891 |
9837 |
9265 |
9116 |
| |
|
(c) |
Securities of financial institutions |
31463 |
30787 |
23884 |
4660 |
5102 |
3153 |
25909 |
22618 |
20528 |
| |
|
(d) |
Mutual funds |
145751 |
184800 |
700766 |
60891 |
92228 |
454908 |
41165 |
18137 |
60863 |
| |
|
(e) |
Shares and debentures of subsidiaries/holding companies and companies in the same group |
494142 |
1003397 |
952453 |
196708 |
250398 |
291829 |
240412 |
647764 |
330884 |
| |
|
(f) |
Shares and debentures of other Indian companies |
1730109 |
1615606 |
2491862 |
954624 |
1115682 |
1308209 |
691655 |
394023 |
1010438 |
| |
|
(g) |
Others |
51913 |
29704 |
87045 |
15439 |
17206 |
37053 |
35846 |
11500 |
36542 |
I. |
Receivables |
5172359 |
5936545 |
8615396 |
545824 |
407868 |
759611 |
2571496 |
3343927 |
4975242 |
| |
27. |
Loans and advances |
4335053 |
5348154 |
7752312 |
451675 |
348809 |
673525 |
2461427 |
3210107 |
4818910 |
| |
|
(a) |
Subsidiary companies |
40432 |
44314 |
195392 |
23622 |
21815 |
170909 |
11827 |
12288 |
15721 |
| |
|
(b) |
Holding companies and companies in the same group |
2649 |
2256 |
6132 |
912 |
1073 |
1322 |
256 |
1125 |
2839 |
| |
|
(c) |
Against hire purchase |
564132 |
649646 |
710562 |
9781 |
6628 |
5790 |
175471 |
175072 |
209052 |
| |
|
(d) |
Others |
3727840 |
4651938 |
6840226 |
417360 |
319293 |
495504 |
2273873 |
3021622 |
4591298 |
| |
28. |
Book debts |
837306 |
588391 |
863084 |
94149 |
59059 |
86086 |
110069 |
133820 |
156332 |
| |
|
(a) |
Sundry debtors |
689926 |
453838 |
659904 |
65058 |
35726 |
46729 |
72165 |
80951 |
60368 |
| |
|
(b) |
Dividend/ Interest accrued |
35394 |
44864 |
57529 |
8979 |
3795 |
4044 |
23627 |
35930 |
42784 |
| |
|
(c) |
Deposits with Government/ others |
81158 |
49487 |
76335 |
12520 |
12227 |
28726 |
6525 |
5021 |
8982 |
| |
|
(d) |
Others |
30828 |
40202 |
69316 |
7592 |
7311 |
6587 |
7752 |
11918 |
44198 |
J. |
Inventories |
426644 |
770184 |
593138 |
189405 |
512480 |
198828 |
193233 |
224332 |
360096 |
| |
29. |
Government and semi- |
|
|
|
|
|
|
|
|
|
| |
|
Government securities |
88050 |
97835 |
187097 |
- |
- |
- |
- |
- |
- |
| |
30. |
Industrial securities |
319238 |
650952 |
378329 |
188780 |
511390 |
197181 |
89630 |
109018 |
151182 |
| |
31. |
Repossessed goods on hire purchase |
3416 |
2735 |
6281 |
154 |
- |
410 |
2085 |
1378 |
3928 |
| |
32. |
Other goods, stores and others |
15939 |
18662 |
21431 |
470 |
1090 |
1237 |
13468 |
16102 |
17890 |
K. |
33. |
Advance of Income-tax (net of tax provision) |
60149 |
55374 |
101980 |
859 |
2413 |
13435 |
50858 |
41302 |
64617 |
L. |
34. |
Gross Fixed Assets |
461613 |
507130 |
493397 |
117476 |
135431 |
89526 |
89691 |
93056 |
102439 |
| |
|
of which: |
|
|
|
|
|
|
|
|
|
| |
|
(a) |
Plant and machinery leased |
130256 |
102766 |
86529 |
36705 |
12596 |
8247 |
18325 |
18318 |
14436 |
| |
|
(b) |
Equipments leased |
6618 |
5855 |
4230 |
1021 |
310 |
234 |
1354 |
1597 |
1166 |
| |
|
(c) |
Vehicles leased |
42037 |
34267 |
25899 |
5262 |
1446 |
1616 |
3411 |
3091 |
3083 |
| |
|
(d) |
Other assets leased |
26713 |
24571 |
15027 |
295 |
373 |
197 |
2517 |
376 |
2918 |
M |
35. |
Less: Depreciation Provision |
229677 |
236494 |
233030 |
32930 |
33780 |
28536 |
41802 |
42699 |
45988 |
N. |
36. |
Net Fixed Assets |
231936 |
270636 |
260367 |
84546 |
101651 |
60990 |
47889 |
50357 |
56451 |
| |
|
of which: assets leased |
65558 |
36254 |
46382 |
28935 |
4329 |
2303 |
8125 |
8428 |
3698 |
O. |
37. |
Other Assets |
49960 |
50411 |
76786 |
7085 |
10465 |
8074 |
23855 |
25089 |
55239 |
| |
38. |
Total |
9029485 |
10795478 |
15095424 |
2151858 |
2631690 |
3248771 |
4187964 |
5046713 |
7345578 |
Statement 4: Combined Balance Sheet - Select Financial and Investment Companies-activity-wise, 2005-06 to 2007-08 (Contd.) |
(Rs. lakh) |
Capital and Liabilities |
Hire Purchase and Leasing Finance (50) |
Diversified (32) |
Miscellaneous (130) |
2005-06 |
2006-07 |
2007-08 |
2005-06 |
2006-07 |
2007-08 |
2005-06 |
2006-07 |
2007-08 |
1 |
11 |
12 |
13 |
14 |
15 |
16 |
17 |
18 |
19 |
A. |
Share Capital |
35226 |
39053 |
40843 |
43286 |
47514 |
47537 |
101572 |
110945 |
159153 |
| |
1. |
Paid-up capital |
35201 |
39028 |
40818 |
43286 |
47514 |
47537 |
101562 |
110935 |
159143 |
| |
|
(a) Ordinary |
31658 |
35330 |
37110 |
40222 |
44418 |
44435 |
85351 |
92577 |
120132 |
| |
|
of which: bonus |
2465 |
3715 |
4025 |
2451 |
2451 |
2451 |
4590 |
7832 |
8818 |
| |
|
(b) Preference |
3543 |
3699 |
3708 |
3065 |
3097 |
3103 |
16209 |
18358 |
39010 |
| |
2. |
Forfeited shares |
25 |
25 |
25 |
- |
- |
- |
10 |
10 |
10 |
B. |
Reserves And Surplus |
198775 |
256723 |
298498 |
50264 |
76031 |
83688 |
137353 |
239513 |
593938 |
| |
3. |
Capital reserve |
95856 |
142747 |
153240 |
66898 |
84695 |
85656 |
40928 |
73587 |
314385 |
| |
|
of which: premium on shares |
84617 |
131142 |
140932 |
59934 |
77753 |
77977 |
27924 |
58522 |
287772 |
| |
4. |
Investment allowance reserve |
- |
- |
- |
6 |
6 |
6 |
8 |
8 |
- |
| |
5. |
Sinking funds |
287 |
2362 |
3271 |
3 |
3 |
3 |
8468 |
10982 |
29122 |
| |
6. |
Other reserves |
102632 |
111613 |
141987 |
-16645 |
-8673 |
-1977 |
87949 |
154939 |
250432 |
C. |
Borrowings |
997606 |
1268261 |
1495727 |
47997 |
66676 |
75637 |
256486 |
471792 |
969733 |
| |
7. |
Debentures @ |
316702 |
536756 |
752218 |
1067 |
948 |
1435 |
112482 |
110271 |
177921 |
| |
8. |
Loans and advances |
583676 |
631721 |
638287 |
38756 |
61716 |
72828 |
128601 |
347257 |
778148 |
| |
|
(a) From banks |
463792 |
506299 |
471895 |
21708 |
38564 |
55760 |
88598 |
210957 |
539844 |
| |
|
of which: short-term borrowings |
437014 |
480601 |
445463 |
20028 |
5525 |
7856 |
74479 |
168951 |
420464 |
| |
|
(b) From other Indian Financial Institutions |
3921 |
2780 |
4673 |
177 |
169 |
661 |
2404 |
3461 |
4177 |
| |
|
(c) From Foreign Institutional agencies |
20837 |
20812 |
20747 |
- |
- |
- |
-1 |
0 |
117 |
| |
|
(d) From Government and semi-Government bodies |
28313 |
45224 |
47562 |
- |
- |
- |
-1 |
-1 |
- |
| |
|
(e) From companies |
10878 |
15534 |
13469 |
2025 |
3133 |
3374 |
21433 |
22665 |
48210 |
| |
|
(f) From others |
84248 |
86296 |
127503 |
14846 |
19850 |
13033 |
16168 |
110175 |
185800 |
| |
9. |
Deferred payments |
- |
- |
7 |
- |
- |
- |
17 |
12 |
- |
| |
10. |
Public deposits |
97229 |
99784 |
105213 |
8175 |
4012 |
1374 |
15381 |
14252 |
13665 |
| |
|
(Of total borrowings, debt) |
465466 |
685839 |
909303 |
11099 |
38168 |
51374 |
144626 |
170004 |
315260 |
D. |
Trade Dues And Other |
|
|
|
|
|
|
|
|
|
| |
Current Liabilities |
144930 |
184605 |
236353 |
54238 |
34337 |
43522 |
566921 |
255676 |
372760 |
| |
11. |
Sundry creditors |
33269 |
44767 |
60994 |
39398 |
18613 |
28186 |
519424 |
185827 |
272433 |
| |
12. |
Acceptances |
- |
- |
- |
- |
- |
- |
- |
- |
- |
| |
13. |
Liabilities to subsidiaries and holding companies |
243 |
23 |
46 |
- |
- |
- |
80 |
- |
- |
| |
14. |
Advances and deposits from customers, agents , etc. |
24158 |
39152 |
42813 |
4659 |
4246 |
5834 |
12256 |
11395 |
17904 |
| |
15. |
Interest accrued on loans |
23948 |
37362 |
60140 |
2276 |
2345 |
2171 |
17708 |
18781 |
19389 |
| |
16. |
Others |
63555 |
63325 |
72405 |
7905 |
9132 |
7332 |
17452 |
39672 |
63037 |
E. |
Provisions |
28898 |
28330 |
33490 |
9932 |
7346 |
8119 |
16179 |
30271 |
42076 |
| |
17. |
Taxation (net of advance of income-tax) |
- |
- |
- |
- |
- |
- |
- |
- |
- |
| |
18. |
Dividends |
6421 |
3675 |
6517 |
2599 |
1968 |
4167 |
4142 |
4839 |
12190 |
| |
19. |
Other current provisions |
22418 |
24636 |
26699 |
7266 |
5318 |
3878 |
8758 |
22300 |
24245 |
| |
20. |
Non-current provisions |
59 |
20 |
274 |
67 |
60 |
74 |
3278 |
3131 |
5641 |
F. |
21. |
Miscellaneous Non-current Liabilities |
- |
- |
- |
- |
- |
- |
- |
- |
- |
| |
22. |
Total |
1405435 |
1776973 |
2104911 |
205717 |
231905 |
258504 |
1078511 |
1108197 |
2137660 |
Statement 4: Combined Balance Sheet - Select Financial and Investment Companies-activity-wise, 2005-06 to 2007-08 (Concld.) |
(Rs. lakh) |
Assets |
Hire Purchase and Leasing Finance (50) |
Diversified (32) |
Miscellaneous (130) |
2005-06 |
2006-07 |
2007-08 |
2005-06 |
2006-07 |
2007-08 |
2005-06 |
2006-07 |
2007-08 |
1 |
11 |
12 |
13 |
14 |
15 |
16 |
17 |
18 |
19 |
G. |
Cash and bank balances |
42458 |
138747 |
74730 |
54914 |
43913 |
36390 |
156193 |
258584 |
570045 |
| |
23 |
Deposits with banks |
40484 |
133538 |
71903 |
54697 |
43044 |
35147 |
153760 |
253165 |
566236 |
| |
24 |
Cash in hand |
1974 |
5209 |
2826 |
217 |
869 |
1244 |
2432 |
5419 |
3809 |
H. |
Investments |
90478 |
78981 |
111793 |
21616 |
69583 |
80730 |
98010 |
164001 |
532304 |
| |
Of which, quoted investments |
13554 |
13115 |
16132 |
1668 |
1333 |
1694 |
24433 |
33719 |
37816 |
| |
25 |
Foreign securities |
1 |
- |
- |
237 |
143 |
143 |
150 |
200 |
49 |
| |
26 |
Indian securities |
90477 |
78981 |
111793 |
21379 |
69440 |
80587 |
97860 |
163801 |
532255 |
| |
|
(a) |
Government and semi- Government securities |
13858 |
13418 |
14110 |
- |
- |
- |
721 |
720 |
471 |
| |
|
(b) |
Public sector undertakings |
8028 |
8117 |
8050 |
- |
- |
- |
290 |
97 |
192 |
| |
|
(c) |
Securities of financial institutions |
234 |
97 |
88 |
327 |
- |
42 |
333 |
2970 |
73 |
| |
|
(d) |
Mutual funds |
22449 |
12719 |
7531 |
1152 |
6197 |
15069 |
20094 |
55519 |
162395 |
| |
|
(e) |
Shares and debentures of subsidiaries/holding companies and companies in the same group |
22432 |
20659 |
10151 |
11293 |
51114 |
53288 |
23297 |
33462 |
266301 |
| |
|
(f) |
Shares and debentures of other Indian companies |
23025 |
23714 |
71700 |
7853 |
11888 |
11907 |
52952 |
70299 |
89608 |
| |
|
(g) |
Others |
452 |
257 |
164 |
2 |
7 |
75 |
174 |
734 |
13211 |
I. |
Receivables |
1218965 |
1502454 |
1854023 |
105019 |
81682 |
88729 |
731055 |
600614 |
937791 |
| |
27 |
Loans and advances |
1205438 |
1486811 |
1833823 |
56295 |
62822 |
64733 |
160218 |
239605 |
361321 |
| |
|
(a) |
Subsidiary companies |
489 |
2737 |
3854 |
918 |
1673 |
433 |
3576 |
5801 |
4475 |
| |
|
(b) |
Holding companies and companies in the same group |
- |
- |
- |
- |
- |
129 |
1481 |
58 |
1842 |
| |
|
(c) |
Against hire purchase |
343910 |
443984 |
474154 |
22042 |
17291 |
20053 |
12928 |
6671 |
1513 |
| |
|
(d) |
Others |
861039 |
1040090 |
1355686 |
33335 |
43858 |
44247 |
142233 |
227075 |
353491 |
| |
28 |
Book debts |
13527 |
15643 |
20200 |
48724 |
18860 |
23996 |
570837 |
361009 |
576470 |
| |
|
(a) |
Sundry debtors |
5959 |
4352 |
5370 |
30631 |
12172 |
15405 |
516113 |
320637 |
532032 |
| |
|
(b) |
Dividend/ Interest accrued |
628 |
1854 |
2474 |
958 |
523 |
410 |
1202 |
2762 |
7817 |
| |
|
(c) |
Deposits with Government/ others |
463 |
412 |
1887 |
16706 |
5950 |
8052 |
44944 |
25877 |
28688 |
| |
|
(d) |
Others |
6477 |
9025 |
10469 |
429 |
215 |
129 |
8578 |
11733 |
7933 |
J. |
Inventories |
2824 |
3446 |
4534 |
4102 |
9186 |
13211 |
37080 |
20740 |
16469 |
| |
29. |
Government and semi- Government securities |
88050 |
97835 |
187097 |
- |
- |
- |
- |
- |
- |
| |
30. |
Industrial securities |
1859 |
2144 |
2570 |
3699 |
8802 |
12712 |
35270 |
19598 |
14684 |
| |
31. |
Repossessed goods on hire purchase |
943 |
1282 |
1863 |
235 |
70 |
- |
-1 |
5 |
80 |
| |
32. |
Other goods, stores and others |
22 |
20 |
102 |
168 |
314 |
500 |
1811 |
1136 |
1702 |
K. |
33. |
Advance of Income-tax (Net of Tax Provision) |
6389 |
6606 |
9272 |
1391 |
2919 |
4205 |
652 |
2134 |
10451 |
L. |
34. |
Gross Fixed Assets |
135612 |
139975 |
136767 |
46256 |
50954 |
60682 |
72578 |
87714 |
103983 |
| |
|
of which, |
|
|
|
|
|
|
|
|
|
| |
|
(a) |
Plant and machinery leased |
50018 |
48179 |
48718 |
21174 |
20486 |
12826 |
4034 |
3187 |
2302 |
| |
|
(b) |
Equipments leased |
2505 |
2708 |
1996 |
810 |
380 |
44 |
928 |
860 |
790 |
| |
|
(c) |
Vehicles leased |
28075 |
27240 |
18757 |
3899 |
1327 |
1779 |
1390 |
1163 |
664 |
| |
|
(d) |
Other assets leased |
13075 |
13030 |
1006 |
3715 |
3663 |
3716 |
7111 |
7129 |
7190 |
M |
35. |
Less: Depreciation Provision |
91523 |
93553 |
86619 |
31767 |
30559 |
28724 |
31655 |
35903 |
43163 |
N. |
36. |
Net Fixed Assets |
44089 |
46422 |
50148 |
14490 |
20395 |
31958 |
40922 |
51811 |
60820 |
| |
|
of which, assets leased |
20887 |
18398 |
26386 |
5874 |
3768 |
13106 |
1737 |
1331 |
889 |
O |
37. |
Other Assets |
232 |
316 |
412 |
4186 |
4228 |
3281 |
14602 |
10313 |
9780 |
| |
38. |
Total |
1405435 |
1776973 |
2104911 |
205717 |
231905 |
258504 |
1078511 |
1108197 |
2137660 |
Statement 5: Sources and Uses of Funds - Select Financial and Investment Companies-activity-wise, 2006-07 and 2007-08 |
(Rs. lakh) |
Sources of Funds |
All Activities (1161) |
Share Trading and Investment Holding (528) |
Loan Finance (421) |
2006-07 |
2007-08 |
2006-07 |
2007-08 |
2006-07 |
2007-08 |
1 |
2 |
3 |
4 |
5 |
6 |
7 |
Internal Sources |
313474 |
913451 |
128860 |
623372 |
80925 |
131473 |
A. |
1. |
Paid-up Capital |
5057 |
74961 |
566 |
24084 |
- |
49580 |
B. |
Reserves And Surplus |
284235 |
815399 |
127508 |
612188 |
70273 |
49372 |
| |
2. |
Capital reserve |
1375 |
-37215 |
-283 |
-27949 |
3733 |
-11501 |
| |
3. |
Investment allowance reserve |
5 |
-13 |
5 |
-5 |
|
- |
| |
4. |
Sinking funds |
2930 |
404159 |
-1896 |
385396 |
239 |
-287 |
| |
5. |
Other reserves |
279925 |
448468 |
129682 |
254745 |
66301 |
61160 |
C. |
Provisions |
24182 |
23091 |
786 |
-12900 |
10652 |
32521 |
| |
6. |
Depreciation provision |
6619 |
-4127 |
851 |
-5251 |
737 |
3121 |
| |
7. |
Taxation (net of advance of income-tax) |
4776 |
-46606 |
-1554 |
-11022 |
9555 |
-23314 |
| |
8. |
Dividends |
-1558 |
20306 |
-856 |
2660 |
1978 |
5255 |
| |
9. |
Other current provisions |
10756 |
51471 |
2347 |
-110 |
-5402 |
49013 |
| |
10. |
Non-current provisions |
3589 |
2047 |
-2 |
822 |
3785 |
-1553 |
External Sources |
1463671 |
3335013 |
350236 |
-22748 |
788029 |
2147372 |
D. |
Paid-up Capital |
411507 |
824224 |
178869 |
104299 |
122209 |
431425 |
| |
11. |
Net issues |
81358 |
365180 |
19343 |
20761 |
48981 |
295695 |
| |
12. |
Premium on shares |
330149 |
459044 |
159526 |
83538 |
73228 |
135730 |
E. |
13. |
Capital Receipts |
5550 |
14796 |
981 |
3724 |
2761 |
1567 |
F. |
Borrowings |
1263110 |
2244463 |
144545 |
-145882 |
613924 |
1655978 |
| |
14. |
Debentures @ |
663120 |
602097 |
36829 |
-36690 |
408567 |
355189 |
| |
15. |
Loans and advances |
593544 |
1657841 |
103859 |
-108835 |
200025 |
1318108 |
| |
|
(a) From banks |
465780 |
655425 |
43153 |
-140015 |
240905 |
483761 |
| |
|
(b) From other Indian Financial Institutions |
32149 |
116661 |
28943 |
5302 |
3299 |
108258 |
| |
|
(c) From Foreign Institutional agencies |
65925 |
-57121 |
65950 |
-60113 |
- |
2940 |
| |
|
(d) From Government and semi-Government bodies |
16911 |
2339 |
- |
- |
16911 |
2339 |
| |
|
(e) From companies |
-63181 |
407049 |
-3900 |
51315 |
-66277 |
332013 |
| |
|
(f) From others |
75959 |
533488 |
-30288 |
34676 |
5187 |
388797 |
| |
16. |
Deferred payments |
-391 |
- |
-396 |
-4 |
11 |
9 |
| |
17. |
Public deposits |
6837 |
-15476 |
4253 |
-352 |
5321 |
-17328 |
G. |
Trade Dues And Other Current Liabilities |
-216496 |
251529 |
25841 |
15110 |
49135 |
58402 |
| |
18. |
Sundry creditors |
-323470 |
129159 |
4124 |
11528 |
15290 |
5224 |
| |
19. |
Acceptances |
-17 |
- |
-17 |
|
- |
|
| |
20. |
Liabilities to subsidiaries and holding companies |
4702 |
-4969 |
5002 |
-4993 |
-220 |
24 |
| |
21. |
Advances and deposits from customers, agents, etc. |
15834 |
31012 |
-1248 |
17670 |
3363 |
1584 |
| |
22. |
Interest accrued on loans |
37981 |
45401 |
8290 |
-10033 |
15136 |
32223 |
| |
23. |
Others |
48474 |
50927 |
9689 |
937 |
15567 |
19347 |
H. |
24. |
Miscellaneous Non-current Liabilities |
- |
- |
- |
- |
- |
- |
| |
25. |
Total |
1777145 |
4248464 |
479096 |
600624 |
868954 |
2278845 |
@ : Includes privately placed debentures.
– : Nil or negligible
Note : This statement is derived from Statement 4. The figures have been adjusted for revaluation, etc., wherever necessary. Figures in brackets in column headings denote the number of companies. Item A(1) represents capitalised reserves and forfeited shares. |
Statement 5: Sources and Uses of Funds - Select Financial and Investment Companies-activity-wise, 2006-07 and 2007-08 (Contd.) |
(Rs. lakh) |
Uses of Funds |
All Activities (1161) |
Share Trading and Investment Holding (528) |
Loan Finance (421) |
2006-07 |
2007-08 |
2006-07 |
2007-08 |
2006-07 |
2007-08 |
1 |
2 |
3 |
4 |
5 |
6 |
7 |
I. |
Cash and Bank Balances |
249783 |
344135 |
23712 |
-5449 |
38392 |
109663 |
| |
26. |
Deposits with banks |
240920 |
344701 |
24053 |
-6518 |
36062 |
107680 |
| |
27. |
Cash in hand |
8863 |
-566 |
-341 |
1069 |
2330 |
1983 |
J. |
Investments |
374075 |
1391358 |
248931 |
616533 |
22683 |
362563 |
| |
of which: quoted investments |
-49562 |
41389 |
-11011 |
-21870 |
-47064 |
55783 |
| |
28. |
Foreign securities |
-716 |
-147 |
-671 |
62 |
- |
-59 |
| |
29. |
Indian securities |
374791 |
1391506 |
249602 |
616471 |
22683 |
362622 |
| |
|
(a) |
Government and semi-Government securities |
-36026 |
-863 |
730 |
1164 |
-35800 |
-2443 |
| |
|
(b) |
Public sector undertakings |
-147 |
667 |
529 |
788 |
-572 |
-149 |
| |
|
(c) |
Securities of financial institutions |
-676 |
-6902 |
442 |
-1949 |
-3292 |
-2090 |
| |
|
(d) |
Mutual funds |
39049 |
515965 |
31337 |
362681 |
-23027 |
42726 |
| |
|
(e) |
Shares and debentures of subsidiaries/ holding companies |
509256 |
-50944 |
53691 |
41430 |
407352 |
-316879 |
| |
|
(f) |
Shares and debentures of other Indian companies |
-114503 |
876256 |
161058 |
192528 |
-297632 |
616415 |
| |
|
(g) |
Others |
-22241 |
57406 |
1736 |
19910 |
-24347 |
25042 |
K. |
Receivables |
764187 |
2678851 |
-137957 |
351745 |
772429 |
1631316 |
| |
30. |
Loans and advances |
1013102 |
2404158 |
-102866 |
324717 |
748678 |
1608804 |
| |
|
(a) |
Subsidiary companies |
3882 |
151078 |
-1807 |
149094 |
461 |
3433 |
| |
|
(b) |
Holding companies and companies in the same group |
-392 |
3876 |
161 |
250 |
86 |
171 |
| |
|
(c) |
Against hire purchase |
85514 |
60916 |
-3153 |
-838 |
-399 |
33980 |
| |
|
(d) |
Bills discounted |
15003 |
-3195 |
8849 |
2633 |
-511 |
-478 |
| |
|
(e) |
Others |
909095 |
2191484 |
-106916 |
173578 |
748258 |
1570154 |
| |
31. |
Book debts |
-248915 |
274693 |
-35091 |
27027 |
23751 |
22512 |
| |
|
(a) |
Sundry debtors |
-236088 |
206067 |
-29332 |
11003 |
8786 |
-20584 |
| |
|
(b) |
Dividend/ Interest accrued |
9470 |
12665 |
-5184 |
249 |
12303 |
6854 |
| |
|
(c) |
Others |
-22296 |
55961 |
-574 |
15775 |
2662 |
36241 |
L. |
Inventories |
343541 |
-177046 |
323075 |
-313652 |
31099 |
135764 |
| |
32. |
Government and semi-Government securities |
9785 |
89262 |
- |
- |
9785 |
89262 |
| |
33. |
Industrial securities |
331714 |
-272623 |
322609 |
-314208 |
19387 |
42164 |
| |
34. |
Repossessed goods on hire purchase |
-681 |
3546 |
-154 |
410 |
-707 |
2550 |
| |
35. |
Other goods, stores and others |
2723 |
2769 |
620 |
146 |
2634 |
1788 |
M. |
36. |
Gross Fixed Assets |
45959 |
-15155 |
17955 |
-46097 |
3114 |
9378 |
| |
|
of which: |
|
|
|
|
|
|
| |
|
(a) |
Plant and machinery leased |
-27489 |
-16238 |
-24109 |
-4349 |
-8 |
-3882 |
| |
|
(b) |
Equipments leased |
-763 |
-1624 |
-710 |
-77 |
243 |
-431 |
| |
|
(c) |
Vehicles leased |
-7770 |
-8368 |
-3816 |
170 |
-320 |
-8 |
| |
|
(d) |
Other assets leased |
-2142 |
-9544 |
78 |
-175 |
-2142 |
2542 |
N. |
37. |
Other Assets |
451 |
26375 |
3380 |
-2391 |
1234 |
30150 |
| |
38. |
Total |
1777145 |
4248464 |
479096 |
600624 |
868954 |
2278845 |
Statement 5: Sources and Uses of Funds - Select Financial and Investment Companies-activity-wise, 2006-07 and 2007-08 (Contd.) |
(Rs. lakh) |
Sources of Funds |
Hire Purchase and Leasing Finance (50) |
Diversified (32) |
Miscellaneous (130) |
2006-07 |
2007-08 |
2006-07 |
2007-08 |
2006-07 |
2007-08 |
1 |
8 |
9 |
10 |
11 |
12 |
13 |
Internal Sources |
13627 |
27357 |
2627 |
3859 |
87435 |
127390 |
A. |
1. |
Paid-up Capital |
1250 |
310 |
- |
- |
3241 |
987 |
B. |
Reserves and Surplus |
11134 |
31488 |
7971 |
6276 |
67349 |
116075 |
| |
2. |
Capital reserve |
78 |
206 |
- |
-420 |
-2153 |
2449 |
| |
3. |
Investment allowance reserve |
- |
- |
- |
- |
- |
-8 |
| |
4. |
Sinking funds |
2075 |
909 |
- |
- |
2512 |
18141 |
| |
5. |
Other reserves |
8981 |
30374 |
7971 |
6696 |
66990 |
95493 |
C. |
Provisions |
1243 |
-4441 |
-5344 |
-2417 |
16845 |
10328 |
| |
6. |
Depreciation provision |
2028 |
-6936 |
-1230 |
-1904 |
4233 |
6843 |
| |
7. |
Taxation (net of advance of income-tax) |
-218 |
-2666 |
-1528 |
-1286 |
-1479 |
-8318 |
| |
8. |
Dividends |
-2746 |
2843 |
-630 |
2198 |
696 |
7350 |
| |
9. |
Other current provisions |
2218 |
2063 |
-1948 |
-1440 |
13541 |
1945 |
| |
10. |
Non-current provisions |
-39 |
255 |
-7 |
14 |
-148 |
2509 |
External Sources |
359723 |
290982 |
20825 |
18394 |
-55142 |
901013 |
D. |
Paid-up Capital |
49102 |
11447 |
22046 |
247 |
39281 |
276806 |
| |
11. |
Net issues |
2577 |
1479 |
4228 |
22 |
6229 |
47223 |
| |
12. |
Premium on shares |
46525 |
9967 |
17818 |
224 |
33052 |
229585 |
E. |
13. |
Capital Receipts |
291 |
321 |
- |
- |
1517 |
9184 |
F. |
Borrowings |
270655 |
227466 |
18679 |
8961 |
215307 |
497940 |
| |
14. |
Debentures @ |
220053 |
215463 |
-119 |
487 |
-2210 |
67648 |
| |
15. |
Loans and advances |
48047 |
6566 |
22962 |
11111 |
218651 |
430891 |
| |
|
(a) From banks |
42507 |
-34404 |
16857 |
17195 |
122358 |
328888 |
| |
|
(b) From other Indian Financial Institutions |
-1141 |
1893 |
-8 |
492 |
1056 |
716 |
| |
|
(c) From Foreign Institutional agencies |
-25 |
-65 |
- |
- |
- |
117 |
| |
|
(d) From Government and semi-Government bodies |
- |
- |
- |
- |
- |
- |
| |
|
(e) From companies |
4657 |
-2065 |
1108 |
241 |
1231 |
25545 |
| |
|
(f) From others |
2048 |
41207 |
5005 |
-6817 |
94007 |
75625 |
| |
16. |
Deferred payments |
- |
7 |
- |
- |
-6 |
-12 |
| |
17. |
Public deposits |
2555 |
5430 |
-4163 |
-2638 |
-1129 |
-588 |
G. |
Trade Dues And Other Current Liabilities |
39675 |
51748 |
-19901 |
9186 |
-311246 |
117083 |
| |
18. |
Sundry creditors |
11498 |
16228 |
-20785 |
9573 |
-333597 |
86606 |
| |
19. |
Acceptances |
- |
- |
- |
- |
- |
- |
| |
20. |
Liabilities to subsidiaries and holding companies |
- |
- |
- |
- |
-80 |
- |
| |
21. |
Advances and deposits from customers, agents, etc. |
14994 |
3661 |
-413 |
1587 |
-862 |
6510 |
| |
22. |
Interest accrued on loans |
13413 |
22778 |
69 |
-174 |
1073 |
607 |
| |
23. |
Others |
-229 |
9081 |
1228 |
-1801 |
22219 |
23363 |
H. |
24. |
Miscellaneous Non-current Liabilities |
- |
- |
- |
- |
- |
- |
| |
25. |
Total |
373350 |
318339 |
23452 |
22253 |
32293 |
1028403 |
Statement 5: Sources and Uses of Funds - Select Financial and Investment Companies-activity-wise, 2006-07 and 2007-08 (Concld.) |
(Rs. lakh) |
Uses of Funds |
Hire Purchase and Leasing Finance (50) |
Diversified (32) |
Miscellaneous (130) |
2006-07 |
2007-08 |
2006-07 |
2007-08 |
2006-07 |
2007-08 |
1 |
8 |
9 |
10 |
11 |
12 |
13 |
I. |
Cash And Bank Balances |
96289 |
-64018 |
-11002 |
-7523 |
102392 |
311462 |
| |
26. |
Deposits with banks |
93054 |
-61634 |
-11654 |
-7898 |
99405 |
313071 |
| |
27. |
Cash in hand |
3235 |
-2383 |
652 |
375 |
2987 |
-1610 |
J. |
Investments |
-11497 |
32812 |
47967 |
11147 |
65991 |
368303 |
| |
of which, quoted investments |
-438 |
3017 |
-335 |
361 |
9286 |
4098 |
| |
28. |
Foreign securities |
-1 |
- |
-95 |
- |
51 |
-150 |
| |
29. |
Indian securities |
-11497 |
32812 |
48061 |
11147 |
65942 |
368454 |
| |
|
(a) |
Government and semi- Government securities |
-440 |
692 |
-517 |
-28 |
1 |
-248 |
| |
|
(b) |
Public sector undertakings |
89 |
-67 |
- |
- |
-193 |
95 |
| |
|
(c) |
Securities of financial institutions |
-137 |
-10 |
-327 |
42 |
2638 |
-2895 |
| |
|
(d) |
Mutual funds |
-9730 |
-5189 |
5044 |
8872 |
35425 |
106875 |
| |
|
(e) |
Shares and debentures of subsidiaries/ holding companies |
-1774 |
-10508 |
39821 |
2174 |
10166 |
232839 |
| |
|
(f) |
Shares and debentures of other Indian companies |
689 |
47986 |
4035 |
19 |
17347 |
19308 |
| |
|
(g) |
Others |
-195 |
-93 |
5 |
68 |
560 |
12479 |
K. |
Receivables |
283491 |
351567 |
-23338 |
7048 |
-130438 |
337175 |
| |
30. |
Loans and advances |
281374 |
347011 |
6528 |
1911 |
79388 |
121715 |
| |
|
(a) |
Subsidiary companies |
2249 |
1116 |
755 |
-1240 |
2224 |
-1325 |
| |
|
(b) |
Holding companies and companies in the same group |
868 |
1825 |
- |
129 |
-1421 |
1782 |
| |
|
(c) |
Against hire purchase |
100074 |
30169 |
-4751 |
2761 |
-6257 |
-5156 |
| |
|
(d) |
Bills discounted |
7292 |
-5525 |
-384 |
-4 |
-243 |
179 |
| |
|
(e) |
Others |
171760 |
321122 |
10907 |
393 |
85086 |
126237 |
| |
31. |
Book debts |
2116 |
4557 |
-29865 |
5137 |
-209826 |
215460 |
| |
|
(a) |
Sundry debtors |
-1607 |
1018 |
-18459 |
3233 |
-195476 |
211397 |
| |
|
(b) |
Dividend/ Interest accrued |
1226 |
620 |
-435 |
-113 |
1560 |
5055 |
| |
|
(c) |
Others |
2497 |
2918 |
-10971 |
2017 |
-15910 |
-990 |
L. |
Inventories |
621 |
1089 |
5084 |
4025 |
-16338 |
-4272 |
| |
32. |
Government and semi-Government securities |
- |
- |
- |
- |
- |
- |
| |
33. |
Industrial securities |
285 |
425 |
5103 |
3910 |
-15670 |
-4914 |
| |
34. |
Repossessed goods on hire purchase |
339 |
581 |
-164 |
-70 |
5 |
75 |
| |
35. |
Other goods, stores and others |
-2 |
82 |
146 |
186 |
-675 |
567 |
M. |
36. |
Gross Fixed Assets |
4363 |
-3207 |
4698 |
8502 |
15829 |
16269 |
| |
|
of which, |
|
|
|
|
|
|
| |
|
(a) |
Plant and machinery leased |
-1840 |
539 |
-688 |
-7660 |
-844 |
-886 |
| |
|
(b) |
Equipments leased |
203 |
-712 |
-430 |
-336 |
-69 |
-68 |
| |
|
(c) |
Vehicles leased |
-835 |
-8483 |
-2572 |
452 |
-227 |
-499 |
| |
|
(d) |
Other assets leased |
-45 |
-12024 |
-52 |
53 |
19 |
60 |
N. |
37. |
Other Assets |
84 |
96 |
42 |
-947 |
-4289 |
-533 |
| |
38. |
Total |
373350 |
318339 |
23452 |
22253 |
32293 |
1028403 |
Annex 1: Combined Income, Expenditure and Appropriation Accounts -Select Financial and Investment Companies-activity-wise, 2005-06 to 2007-08 |
(Rs. lakh) |
Items |
All Activities (1175) |
2005-06 |
2006-07 |
2007-08 |
1 |
2 |
3 |
4 |
Income |
|
|
|
1. |
Main Income |
1682489 |
1991582 |
2937731 |
| |
(a) |
Interest |
901088 |
1273881 |
1813754 |
| |
|
(i) On loans and advances |
697165 |
977110 |
1397445 |
| |
|
(ii) Others |
203923 |
296771 |
416309 |
| |
(b) |
Dividends |
100402 |
137726 |
105848 |
| |
(c) |
Brokerage |
143145 |
159917 |
279641 |
| |
(d) |
Net profit/ loss in share dealings |
383089 |
230233 |
483542 |
| |
(e) |
Net earnings from hire purchase financing |
12800 |
16990 |
21519 |
| |
(f) |
Lease rentals |
26760 |
19924 |
39752 |
2. |
Other income |
234075 |
280064 |
477027 |
| |
of which: rent |
14419 |
14166 |
9590 |
3. |
Non-operating surplus(+)/ deficit(-) |
50548 |
42089 |
66161 |
4. |
Total (1+2+3) |
1967112 |
2313735 |
3480918 |
Expenditure And Appropriations |
|
|
|
5. |
Interest |
677859 |
941044 |
1321212 |
6. |
Salaries, wages and bonus |
106788 |
148283 |
218657 |
7. |
Provident fund |
6766 |
9371 |
12472 |
8. |
Employees’ welfare expenses |
10722 |
15850 |
17446 |
9. |
Managerial remuneration |
8256 |
9380 |
12541 |
10. |
Bad debts # |
77533 |
57147 |
102972 |
11. |
Other expenses |
310139 |
378265 |
507513 |
| |
of which: |
|
|
|
| |
(a) |
Rent |
17182 |
25387 |
37355 |
| |
(b) |
Insurance |
3194 |
2969 |
4282 |
| |
(c) |
Advertisement |
14814 |
16031 |
24540 |
12. |
Depreciation provision |
31078 |
34683 |
42034 |
13. |
Other provisions (other than tax and depreciation) |
14036 |
20806 |
26627 |
14. |
Operating profits |
673388 |
656816 |
1153283 |
15. |
Non-operating surplus(+)/ deficit(-) |
50548 |
42089 |
66161 |
16. |
Profits before tax |
723936 |
698905 |
1219443 |
17. |
Less: tax provision |
141009 |
183159 |
354253 |
18. |
Profits after tax |
582926 |
515746 |
865190 |
| |
(a) |
Dividends |
110558 |
125142 |
156024 |
| |
|
(i) Ordinary |
107122 |
123957 |
151663 |
| |
|
(ii) Preference |
3436 |
1184 |
4361 |
| |
(b) |
Profits retained |
472368 |
390604 |
709165 |
19. |
Total (5 to 15) |
1967112 |
2313735 |
3480918 |
# : Incuding provision for bad debts.
– : Nil or negligible.
Note : Figures in brackets in column headings denote the number of companies. |
Annex 2: Combined Balance Sheet - Select Financial And Investment Companies-activity-wise, 2005-06 to 2007-08 |
(Rs. lakh) |
Capital and Liabilities |
All Activities (1175) |
2005-06 |
2006-07 |
2007-08 |
1 |
2 |
3 |
4 |
A. |
Share Capital |
1296366 |
1383622 |
1802932 |
| |
1. |
Paid-up capital |
1295895 |
1383137 |
1802372 |
| |
|
(a) |
Ordinary |
1196077 |
1277553 |
1540170 |
| |
|
|
of which: bonus |
51782 |
56834 |
131716 |
| |
|
(b) |
Preference |
99817 |
105584 |
262202 |
| |
2. |
Forfeited shares |
471 |
485 |
560 |
B. |
Reserves And Surplus |
2346672 |
3090661 |
5167758 |
| |
3. |
Capital reserve |
1118418 |
1478193 |
2459839 |
| |
|
of which: premium on shares |
822554 |
1167270 |
2130720 |
| |
4. |
Investment allowance reserve |
160 |
165 |
152 |
| |
5. |
Sinking funds |
21939 |
24869 |
429028 |
| |
6. |
Other reserves |
1206156 |
1587436 |
2278739 |
C. |
Borrowings |
12640041 |
15425725 |
19270317 |
| |
7. |
Debentures @ |
3518258 |
4913821 |
6950655 |
| |
8. |
Loans and advances |
6105227 |
7100719 |
8844029 |
| |
|
(a) |
From banks |
4118144 |
4980678 |
5846013 |
| |
|
|
of which: short-term borrowings |
3418583 |
4062040 |
4142396 |
| |
|
(b) |
From other Indian Financial Institutions |
638148 |
602581 |
606294 |
| |
|
(c) |
From Foreign Institutional agencies |
286529 |
303861 |
258387 |
| |
|
(d) |
From Government and semi- Government bodies |
28394 |
45305 |
47644 |
| |
|
(e) |
From companies |
509183 |
438867 |
856924 |
| |
|
(f) |
From others |
524829 |
729427 |
1228767 |
| |
9. |
Deferred payments |
426 |
72 |
36 |
| |
10. |
Public deposits |
3016131 |
3411112 |
3475598 |
| |
|
(Of total borrowings, debt) |
8219468 |
10199429 |
13042261 |
D. |
Trade Dues and Other Current Liabilities |
1424311 |
1275030 |
1560676 |
| |
11. |
Sundry creditors |
792884 |
466911 |
569488 |
| |
12. |
Acceptances |
17 |
- |
- |
| |
13. |
Liabilities to subsidiaries and holding companies |
1575 |
5861 |
1297 |
| |
14. |
Advances and deposits from customers, agents, etc. |
77660 |
100969 |
154675 |
| |
15. |
Interest accrued on loans |
284247 |
366683 |
450149 |
| |
16. |
Others |
267929 |
334605 |
385068 |
E. |
Provisions |
345545 |
377507 |
449581 |
| |
17. |
Taxation (net of advance of income-tax) |
- |
- |
- |
| |
18. |
Dividends |
93715 |
90414 |
134552 |
| |
19. |
Other current provisions |
244194 |
272329 |
304899 |
| |
20. |
Non-current provisions |
7637 |
14764 |
10129 |
F. |
21. |
Miscellaneous Non-current Liabilities |
|
- |
|
| |
22. |
Total |
18052936 |
21552545 |
28251264 |
@ : Includes privately placed debentures.
– : Nil or negligible.
Note: Figures in brackets in column headings denote the number of companies. |
Annex 2: Combined Balance Sheet - Select Financial And Investment Companies-activity-wise, 2005-06 to 2007-08 (Concld.) |
(Rs. lakh) |
Assets |
All Activities (1175) |
2005-06 |
2006-07 |
2007-08 |
1 |
2 |
3 |
4 |
G. |
Cash And Bank Balances |
800462 |
1074730 |
1604068 |
| |
23. |
Deposits with banks |
775547 |
1032796 |
1561795 |
| |
24. |
Cash in hand |
24914 |
41933 |
42273 |
H. |
Investments |
4391090 |
4946554 |
6454320 |
| |
of which: quoted investments |
874674 |
712954 |
976389 |
| |
25. |
Foreign securities |
1118 |
402 |
254 |
| |
26. |
Indian securities |
4389972 |
4946152 |
6454066 |
| |
|
(a) |
Government and semi-Government securities |
746501 |
669866 |
600231 |
| |
|
(b) |
Public sector undertakings |
126096 |
67879 |
43366 |
| |
|
(c) |
Securities of financial institutions |
105801 |
150187 |
50955 |
| |
|
(d) |
Mutual funds |
354815 |
321307 |
1054685 |
| |
|
(e) |
Shares and debentures of subsidiaries/holding companies and companies in the same group |
628248 |
1184355 |
1263788 |
| |
|
(f) |
Shares and debentures of other Indian companies |
1898410 |
2108225 |
3346378 |
| |
|
(g) |
Others |
530102 |
444254 |
94663 |
I. |
Receivables |
11906879 |
14232124 |
18879728 |
| |
27. |
Loans and advances |
10779164 |
13343999 |
17886864 |
| |
|
(a) |
Subsidiary companies |
51175 |
72287 |
253649 |
| |
|
(b) |
Holding companies and companies in the same group |
7607 |
2506 |
6242 |
| |
|
(c) |
Against hire purchase |
564132 |
649646 |
710562 |
| |
|
(d) |
Others |
10156250 |
12619560 |
16916411 |
| |
28. |
Book debts |
1127715 |
888125 |
992864 |
| |
|
(a) |
Sundry debtors |
747020 |
477240 |
681475 |
| |
|
(b) |
Dividend/ Interest accrued |
101662 |
149468 |
162142 |
| |
|
(c) |
Deposits with Government/ others |
139471 |
51331 |
79252 |
| |
|
(d) |
Others |
139562 |
210086 |
69995 |
J. |
Inventories |
485465 |
803795 |
629280 |
| |
29. |
Government and semi- Government securities |
106886 |
110358 |
196197 |
| |
30. |
Industrial securities |
359120 |
672026 |
405372 |
| |
31. |
Repossessed goods on hire purchase |
3416 |
2735 |
6281 |
| |
32. |
Other goods, stores and others |
16042 |
18676 |
21431 |
K. |
33. |
Advance Of Income-tax (Net of Tax Provision) |
76725 |
64531 |
273861 |
L. |
34. |
Gross Fixed Assets |
592216 |
640295 |
598797 |
| |
|
of which: |
|
|
|
| |
|
(a) |
Plant and machinery leased |
144281 |
116605 |
100150 |
| |
|
(b) |
Equipments leased |
6618 |
5855 |
4230 |
| |
|
(c) |
Vehicles leased |
44513 |
36743 |
27537 |
| |
|
(d) |
Other assets leased |
26713 |
26344 |
15027 |
M. |
35. |
Less: Depreciation Provision |
275581 |
286438 |
280022 |
N. |
36. |
Net Fixed Assets |
316634 |
353857 |
318775 |
| |
|
of which: assets leased |
66547 |
38020 |
46382 |
O. |
37. |
Other Assets |
75681 |
76954 |
91232 |
| |
38. |
Total |
18052936 |
21552545 |
28251264 |
Annex 3: Sources and Uses of Funds - Select Financial and Investment Companies - Activity-wise, 2006-07 and 2007-08 |
(Rs. lakh) |
Sources of Funds |
All Activities (1175) |
2006-07 |
2007-08 |
1 |
2 |
3 |
Internal Sources |
445348 |
988410 |
A. |
1. |
Paid-up Capital |
5057 |
74961 |
B. |
Reserves and Surplus |
385589 |
1057784 |
| |
2. |
Capital reserve |
1375 |
-37666 |
| |
3. |
Investment allowance reserve |
5 |
-13 |
| |
4. |
Sinking funds |
2930 |
404159 |
| |
5. |
Other reserves |
381280 |
691303 |
C. |
Provisions |
54701 |
-144335 |
| |
6. |
Depreciation provision |
10546 |
-7080 |
| |
7. |
Taxation (net of advance of income-tax) |
12194 |
-209329 |
| |
8. |
Dividends |
-3300 |
44138 |
| |
9. |
Other current provisions |
28135 |
32571 |
| |
10. |
Non-current provisions |
7127 |
-4634 |
External Sources |
3076871 |
5493152 |
D. |
Paid-up Capital |
431414 |
1345198 |
| |
11. |
Net issues |
82295 |
344348 |
| |
12. |
Premium on shares |
349119 |
1000850 |
E. |
13. |
Capital Receipts |
9054 |
17715 |
F. |
Borrowings |
2785684 |
3844592 |
| |
14. |
Debentures @ |
1395563 |
2036834 |
| |
15. |
Loans and advances |
995494 |
1743309 |
| |
|
(a) |
From banks |
862534 |
865335 |
| |
|
(b) |
From other Indian Financial Institutions |
-35567 |
3713 |
| |
|
(c) |
From Foreign Institutional agencies |
17332 |
-45474 |
| |
|
(d) |
From Government and semi-Government bodies |
16911 |
2339 |
| |
|
(e) |
From companies |
-70316 |
418056 |
| |
|
(f) |
From others |
204599 |
499340 |
| |
16. |
Deferred payments |
-354 |
-37 |
| |
17. |
Public deposits |
394981 |
64486 |
G. |
Trade Dues and Other Current Liabilities |
-149281 |
285646 |
| |
18. |
Sundry creditors |
-325972 |
102577 |
| |
19. |
Acceptances |
-17 |
- |
| |
20. |
Liabilities to subsidiaries and holding companies |
4286 |
-4564 |
| |
21. |
Advances and deposits from customers, agents, etc. |
23309 |
53705 |
| |
22. |
Interest accrued on loans |
82435 |
83467 |
| |
23. |
Others |
66677 |
50462 |
H. |
24. |
Miscellaneous Non-current Liabilities |
|
- |
| |
25. |
Total |
3522219 |
6481562 |
@ : Includes privately placed debentures.
— : Nil or negligible.
Note : This statement is derived from Annex 2. The figures have been adjusted for revaluation, etc., wherever necessary.
Figures in bracket in column headings denote the number of companies. Item A(1) represents capitalised reserves and forfeited shares. |
Annex 3: Sources and Uses of Funds - Select Financial and Investment Companies-activity-wise, 2006-07 and 2007-08 (Concld.) |
(Rs. lakh) |
Uses of Funds |
All Activities (1175) |
2006-07 |
2007-08 |
1 |
2 |
3 |
I. |
Cash and Bank Balances |
274268 |
529339 |
| |
26. |
Deposits with banks |
257249 |
528999 |
| |
27. |
Cash in hand |
17018 |
340 |
J. |
Investments |
555432 |
1507830 |
| |
of which : quoted investments |
-161720 |
263435 |
| |
28. |
Foreign securities |
-716 |
-147 |
| |
29. |
Indian securities |
556149 |
1507978 |
| |
|
(a) |
Government and semi-Government securities |
-76635 |
-69635 |
| |
|
(b) |
Public sector undertakings |
-58216 |
-24513 |
| |
|
(c) |
Securities of financial institutions |
44386 |
-99231 |
| |
|
(d) |
Mutual funds |
-33508 |
733378 |
| |
|
(e) |
Shares and debentures of subsidiaries/ holding companies |
556107 |
79432 |
| |
|
(f) |
Shares and debentures of other Indian companies |
209815 |
1238153 |
| |
|
(g) |
Others |
-85879 |
-349527 |
K. |
Receivables |
2325244 |
4647604 |
| |
30. |
Loans and advances |
2564834 |
4542865 |
| |
|
(a) |
Subsidiary companies |
21112 |
181362 |
| |
|
(b) |
Holding companies and companies in the same group |
-5100 |
3736 |
| |
|
(c) |
Against hire purchase |
85514 |
60916 |
| |
|
(d) |
Bills discounted |
15003 |
-3195 |
| |
|
(e) |
Others |
2448306 |
4300047 |
| |
31. |
Book debts |
-239590 |
104739 |
| |
|
(a) |
Sundry debtors |
-269779 |
204235 |
| |
|
(b) |
Dividend/ Interest accrued |
47806 |
12674 |
| |
|
(c) |
Others |
-17616 |
-112169 |
L. |
Inventories |
318330 |
-174514 |
| |
32. |
Government and semi-Government securities |
3472 |
85839 |
| |
33. |
Industrial securities |
312906 |
-266654 |
| |
34. |
Repossessed goods on hire purchase |
-681 |
3546 |
| |
35. |
Other goods, stores and others |
2634 |
2755 |
M. |
36. |
Gross Fixed Assets |
48522 |
-42922 |
| |
|
of which: |
|
|
| |
|
(a) |
Plant and machinery leased |
-27676 |
-16455 |
| |
|
(b) |
Equipments leased |
-763 |
-1624 |
| |
|
(c) |
Vehicles leased |
-7770 |
-9206 |
| |
|
(d) |
Other assets leased |
-369 |
-11317 |
N. |
37. |
Other Assets |
1273 |
14277 |
| |
38. |
Total |
3522219 |
6481561 |
Appendix
Explanatory notes to various statements Due to rounding off of figures, the constituent items may not add up exactly to the totals.
The growth rates of all the items and data on sources and uses of funds are adjusted for changes due to amalgamation of companies and revaluation, etc., wherever necessary.
Main Income comprises of income received by way of (a) interest, (b) dividends, (c) brokerage, (d) net profit/loss in share dealings, (e) net earning from hire purchase financing and (f) lease rental.
Income includes non-operating surplus/ deficit but excludes transfers from reserves outstanding at the end of the previous year and amount carried forward at the end of the previous year.
Non-operating surplus/ deficit comprises (a) profit/ loss on account of (i) sale of fixed assets, etc., and (ii) revaluation/ devaluation of assets/ foreign currencies, (b) provisions no longer required written back, (c) insurance claims realised and (d) income/ expenditure relating to the previous years and such other items of non-current nature.
Profit/ loss on sale of financial investments is included in net profit/ loss in share dealings.
Total expenditure comprises interest payments, remuneration to employees, managerial remuneration, bad debts, other expenses, depreciation provision and other provisions.
Remuneration to employees comprises (a) salaries, wages and bonus, (b) provident fund and (c) employees’ welfare expenses (including gratuity, etc.).
Tax provision includes tax deducted at source in respect of interest/ dividend received by the companies. Operating profits are net of depreciation provision and interest payments.
Ordinary dividend payment includes deferred dividends.
Retained profits comprises transfers to reserves and profit/ loss carried to balance sheet.
Ordinary paid-up capital includes deferred shares.
Capital reserves include profit on sale of investments and fixed assets.
Other reserves include profits retained in the form of various specific reserves and profit/ loss carried to balance sheet.
Equity or Net worth comprises (a) paid-up capital, (b) forfeited shares and (c) all reserves and surplus.
Debentures include privately placed debentures with financial institutions.
Debt comprises (a) all borrowings from Government and semi-Government bodies, financial institutions other than banks and from foreign institutional agencies, (b) borrowings from banks against mortgages and other long term securities, (c) borrowings from companies and others against mortgages and other long term securities, (d) debentures, deferred payment liabilities and public deposits.
Trade dues and other current liabilities-others include share application money.
Internal Sources: These are own sources comprising capitalized reserves, retained profits, depreciation provision and other provisions.
External Sources: These are other than own sources comprising funds raised from capital markets, borrowed funds, trade dues and other current liabilities and miscellaneous non-current liabilities.
*Prepared in the Company Finances Division of Department of Statistics and Information Management.
1 Reference may be made to the August 2008 issue of the Reserve Bank of India Bulletin for the study relating to 2006-07, which covered the financial performance of 1187 non-Government financial and investment companies. In the present study, 332 new companies have been included in addition to the 843 companies common with the previous study. |


