Performance of Private Corporate Business Sector, 2008-09* The article reviews the performance of the private corporate business sector during 2008-09 based on abridged financial results of 2549 nongovernment public limited companies. Operating margins contracted as expenditure outpaced the growth in sales. Increase in interest payments particularly during first three quarters exerted pressure on net profit margin. Companies also suffered mark-to-market losses and rise in foreign interest liabilities. Although notional, this resulted in depressed profits. Reflecting limited pricing power against the faster rise in expenditure in relation to sales, profitability in terms of operating, gross and net margins weakened across all paid-up capital and sales size classes. Net profits declined for most of the industries primarily on account of high input costs and rising interest expenses. Quarter-wise analysis shows that the aggregate net profits started falling from second quarter. It fell sharply during the third quarter largely on account of high interest outgo, inventories pile-ups and several one off non-operating expenditures. However, the decline in profitability was arrested to a large extent during the March quarter. This was possible, in part, owing to a deceleration in interest payments and input costs. Also to some extent, the deferment of the implementation of Accounting Standard (AS-11) helped many companies in avoiding forex losses. The article analyses the performance of the private corporate business sector for the year 2008-09 based on data relating to 2549 non-government non-financial public limited companies and provides, inter alia, a brief analysis by size and industry for the set of 2306 companies common with last year’s data set. A review of performance of private corporate sector over the quarters of 2008-09 is also presented based on abridged financial results of 2500, 2386, 2486, 2561 companies in first (Q1), second (Q2), third (Q3), fourth (Q4) quarters of 2008-09. In addition, a common set of 2306 companies over the four quarters is analysed. The article also briefly touches upon the performance of 210 non-government financial listed public limited companies during 2008-09.
Table 1: Performance of Non-Government Non-Financial Companies, 2008-09 |
Item |
All companies |
Common 2306 companies |
AN:2008-09 |
Growth 2007-08* |
Growth 2008-09 |
AN:2008-09 |
Growth 2007-08 |
Growth 2008-09 |
No. of Companies |
2549 |
2306 |
| |
Rs. crore |
Per cent |
Per cent |
Rs. crore |
Per cent |
Per cent |
1 |
2 |
3 |
4 |
5 |
6 |
7 |
Sales |
1538,706 |
18.3 |
17.2 |
15,15,931 |
21.7 |
17.6 |
Change in stock |
5,586 |
23.4 |
-71.6 |
5,145 |
59.5 |
-72.9 |
Expenditure |
13,11,607 |
18.4 |
19.5 |
12,91,438 |
21.7 |
20.0 |
of which |
|
|
|
|
|
|
Consumption of raw materials |
6,71,113 |
16.8 |
18.5 |
6,61,012 |
19.1 |
19.4 |
Staff Cost |
1,10,873 |
19.4 |
19.5 |
1,09,479 |
21.7 |
19.6 |
Power & fuel |
56,894 |
19.9 |
25.8 |
56,705 |
25.3 |
26.5 |
Operating Profits (PBDIT) |
2,32,684 |
18.1 |
-1.0 |
2,29,639 |
24.3 |
-0.7 |
Other income |
26,381 |
46.2 |
6.6 |
25,680 |
35.1 |
7.3 |
Depreciation |
54,909 |
14.8 |
17.4 |
54,279 |
16.9 |
17.8 |
Gross profits (PBIT) |
2,04,156 |
22.8 |
-4.2 |
2,01,039 |
27.3 |
-3.8 |
Interest |
48,158 |
28.8 |
57.3 |
47,206 |
34.3 |
59.1 |
Profits before tax (PBT) |
1,55,998 |
21.9 |
-14.5 |
1,53,833 |
26.3 |
-14.2 |
Tax provision |
31,602 |
24.1 |
-17.7 |
30,936 |
28.0 |
-17.8 |
Profits after tax@ (PAT) |
1,24,375 |
26.2 |
-18.4 |
1,23,474 |
31.3 |
-18.0 |
Paid-up capital |
74,001 |
7.6 |
4.0 |
69,343 |
7.2 |
4.0 |
* : For the 2359 companies published in September 2008 issue of RBI Bulletin.
@ : Adjusted for non-operating surplus/deficit. |
Performance of Non-Financial Non-Government Companies
Overall Performance, 2008-09
In comparison to the last year’s good performance, sales of non-government non-financial companies representing broadly the private corporate sector continued to grow by around 18 per cent, however, net profits declined by 18 per cent vis-à-vis 26.2 per cent growth in previous year (Table 1). Spending on raw materials increased as global commodity prices registered a sharp surge mainly during the first half of 2008-09. Operating margins contracted as growth in expenditure outpaced the growth in sales. The other income, that had earlier risen primarily due to buoyant capital markets and contributed significantly to the net profits in the past couple of years, showed a modest increase during the year. Increase in interest payments particularly during first three quarters, inventories pile-ups and several one off non-operating expenditures exerted pressure on net profit margin. Companies also suffered mark-to-market losses and rise in foreign interest liabilities. This resulted in depressed profits. Indicating adjustment of inventory level to the changes in business demand, aggregate trade-in-stocks were sharply depleted during the year.
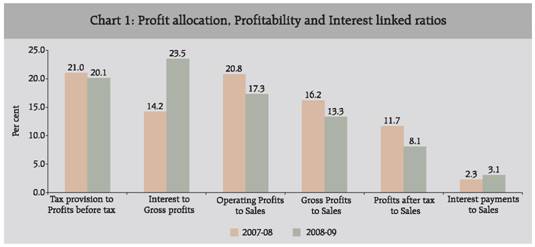
Reflecting limited pricing power against faster rise in expenditure in relation to sales, profitability measured in terms of operating, gross and net margins weakened in comparison to those observed last year (Chart 1). Consequent to the high interest outgo coupled with falling gross profits, interest burden measured as a ratio of interest to gross profits increased to 23.5 per cent from 14.2 registered in 2007-08.
Table 2: Performance of the Select Companies according to the Size of Paid-up capital, 2008-09 |
PUC Size class (Rs. crore) |
No. of companies |
Paid-up capital |
Per cent change over the previous year |
Amount (Rs.crore) |
Per cent share |
Sales |
Other income |
Expenditure |
Operating Profits (PBDIT) |
Depreciation |
Gross profits (PBIT) |
Interest |
Tax provision |
Profits after tax (PAT) |
1 |
2 |
3 |
4 |
5 |
6 |
7 |
8 |
9 |
10 |
11 |
12 |
13 |
Below 5 |
534 |
1,662 |
2.4 |
8.9 |
-3.6 |
7.3 |
4.2 |
9.8 |
0.8 |
24.3 |
-0.1 |
-11.3 |
5 - 10 |
575 |
4,060 |
5.9 |
13.8 |
-9.8 |
13.1 |
7.7 |
15.1 |
3.2 |
33.6 |
-11.3 |
-28.7 |
10 - 15 |
402 |
4,852 |
7.0 |
12.3 |
6.6 |
13.5 |
0.8 |
25.4 |
-4.1 |
42.7 |
-16.1 |
-17.1 |
15 -25 |
304 |
5,831 |
8.4 |
13.9 |
-7.9 |
12.8 |
4.2 |
20.3 |
-1.1 |
48.1 |
-2.1 |
-16.4 |
25 and above |
491 |
52,938 |
76.3 |
19.1 |
9.8 |
22.5 |
-1.7 |
17.3 |
-4.4 |
66.3 |
-19.9 |
-17.9 |
All Companies |
2306 |
69,343 |
100.0 |
17.6 |
7.3 |
20.0 |
-0.7 |
17.8 |
-3.8 |
59.1 |
-17.8 |
-18.0 |
Performance according to Size of Paid-up Capital
The size-wise analysis with paid-up-capital (PUC) as size variable is presented in Table 2 and 3. Though the aggregate sales rose for each size group, aggregate net profits fell reflecting poor profit performance across the board. Each size class recorded rise in interest payments while showing sizeable growth in depreciation charges as well. In particular, 491 large companies, each with paid-up capital of more than Rs.25 crore accounting as much as 76 per cent of the total PUC of the select companies, had a healthy growth in sales but could not record the similar upward momentum in net profits. Net profits fell 18 per cent as expenditure could not be contained with high raw material costs and their interest forming 3.0 per cent of sales as against 2.2 per cent posted in 2007-08. Higher interest payment, weak support from other income and high depreciation provision could be the main factors impacting net profit adversely.
Table 3: Profit Allocation, Interest-linked and Profitability Ratios according to Size of Paid-up capital, 2008-09 |
(Per cent) |
PUC Size class (Rs. crore) |
Profit allocation Ratios |
Interest linked Ratios |
Profitability Ratios |
Tax provision to Profits before tax |
Interest to Gross profits |
Interest coverage (Times) |
Interest to Sales |
Gross profits to Sales |
Profits after tax to Sales |
2007-08 |
2008-09 |
2007-08 |
2008-09 |
2007-08 |
2008-09 |
2007-08 |
2008-09 |
2007-08 |
2008-09 |
2007-08 |
2008-09 |
1 |
2 |
3 |
4 |
5 |
6 |
7 |
8 |
9 |
10 |
11 |
12 |
13 |
Below 5 |
31.5 |
35.5 |
34.4 |
42.4 |
2.9 |
2.4 |
2.7 |
3.1 |
7.8 |
7.3 |
3.7 |
3.0 |
5 - 10 |
34.0 |
32.9 |
27.6 |
35.8 |
3.6 |
2.8 |
2.7 |
3.1 |
9.7 |
8.8 |
6.8 |
4.3 |
10 - 15 |
24.5 |
24.9 |
21.8 |
32.5 |
4.6 |
3.1 |
2.8 |
3.5 |
12.6 |
10.8 |
7.5 |
5.5 |
15 - 25 |
21.8 |
25.0 |
21.4 |
32.1 |
4.7 |
3.1 |
2.7 |
3.5 |
12.6 |
11.0 |
8.0 |
5.9 |
25 and above |
20.2 |
18.8 |
12.2 |
21.3 |
8.2 |
4.7 |
2.2 |
3.0 |
17.7 |
14.2 |
13.1 |
9.1 |
All companies |
21.0 |
20.1 |
14.2 |
23.5 |
7.0 |
4.3 |
2.3 |
3.1 |
16.2 |
13.3 |
11.7 |
8.1 |
Indicating increase in interest burden, interest as a ratio of gross profits increased for every size class under study, most particularly for the smallest size group. Profitability measured in terms of gross and net profit margins also dipped for each class indicating lack of pricing power. Among the size classes, the slide in the interest cover and the profitability was the most for the group of companies in the highest PUC class.
Performance according to Size of Sales, 2008-09 Table 4 and 5 show the comparative performance of companies in various size classes of sales. While aggregate sales of classes comprising small companies with sales of less than Rs. 100 crore showed either a decline or a modest increase, other groups recorded more than 10 per cent increase in sales. In particular, large companies, each with sales of more than Rs.1,000 crore posted 20 per cent rise in sales. However, the rise in sales could not be translated into increase in profits as reflected in decline in operating as well as in net profits in each of the size class under study.
The higher growth in expenditure as compared to sales and high increases in interest payments adversely impacted the profit margins. The decline in profits corresponded with the size of the sales; the bigger the size, the less is the decline. The group of companies in the top three size classes viz., with sales of Rs.100 crore or more made noticeable provision towards depreciation that grew in the range of 17 to 20 per cent over the year. The companies in classes with sales below 100 crore recorded decline of more than 20 per cent in their operating profits.
Table 4: Performance of Select Companies according to the Size of Sales, 2008-09 |
Sales Size class (Rs. crore) |
No. of companies |
Sales (Rs. crore) |
Per cent share in Sales |
Per cent change (YoY) |
Sales |
Other income |
Expenditure |
Operating Profits (PBDIT) |
Depreciation |
Gross profits (PBIT) |
Interest |
Tax provision |
Profits after tax (PAT) |
1 |
2 |
3 |
4 |
5 |
6 |
7 |
8 |
9 |
10 |
11 |
12 |
13 |
Less than Rs. 25 |
576 |
5,253 |
0.3 |
-14.2 |
9.4 |
-10.6 |
$ |
5.1 |
$ |
5.5 |
-32.0 |
$ |
25 - 50 |
261 |
9,558 |
0.6 |
2.4 |
-2.0 |
4.6 |
-22.9 |
10.1 |
-26.7 |
37.8 |
-51.9 |
-87.4 |
50 - 100 |
303 |
21,746 |
1.4 |
-2.0 |
9.7 |
1.0 |
-25.7 |
9.1 |
-29.2 |
15.7 |
-33.0 |
-58.3 |
100 - 500 |
691 |
1,62,455 |
10.7 |
10.5 |
-8.2 |
11.5 |
-5.0 |
19.4 |
-12.5 |
33.0 |
-15.6 |
-49.8 |
500 - 1000 |
210 |
1,46,660 |
9.7 |
10.3 |
7.8 |
12.2 |
-10.6 |
19.7 |
-16.2 |
45.2 |
-16.3 |
-29.1 |
1000 and above |
265 |
11,70,259 |
77.2 |
20.5 |
10.0 |
23.3 |
1.6 |
17.7 |
-0.8 |
72.8 |
-17.4 |
-12.5 |
All companies |
2306 |
15,15,931 |
100.0 |
17.6 |
7.3 |
20.0 |
-0.7 |
17.8 |
-3.8 |
59.1 |
-17.8 |
-18.0 |
$: Numerator or denominator or both negative |
Table 5: Profit allocation, Interest-linked and Profitability Ratios according to Size of Sales, 2008-09 |
(Per cent) |
Sales Size Class (Rs. crore) |
Profit allocation Ratios |
Interest linked Ratios |
Profitability Ratios |
Tax provision to Profits before tax |
Interest to Gross profits |
Interest coverage (Times) |
Interest to Sales |
Gross profits to Sales |
Profits after tax to Sales |
2007-08 |
2008-09 |
2007-08 |
2008-09 |
2007-08 |
2008-09 |
2007-08 |
2008-09 |
2007-08 |
2008-09 |
2007-08 |
2008-09 |
1 |
2 |
3 |
4 |
5 |
6 |
7 |
8 |
9 |
10 |
11 |
12 |
13 |
Less than 25 |
$ |
$ |
109.6 |
$ |
0.9 |
-0.2 |
5.9 |
7.3 |
5.4 |
$ |
$ |
$ |
25 - 50 |
51.2 |
80.9 |
39.9 |
75.0 |
2.5 |
1.3 |
4.6 |
6.2 |
11.6 |
8.3 |
9.3 |
1.1 |
50 - 100 |
29.8 |
39.4 |
30.9 |
50.6 |
3.2 |
2.0 |
3.9 |
4.6 |
12.7 |
9.2 |
9.5 |
4.0 |
100 - 500 |
26.3 |
32.3 |
29.2 |
44.4 |
3.4 |
2.3 |
3.6 |
4.3 |
12.2 |
9.7 |
8.1 |
3.7 |
500 - 1000 |
22.3 |
28.3 |
22.5 |
39.1 |
4.4 |
2.6 |
2.9 |
3.8 |
12.9 |
9.8 |
8.1 |
5.2 |
1000 and above |
20.1 |
18.4 |
11.1 |
19.4 |
9.0 |
5.2 |
1.9 |
2.8 |
17.5 |
14.4 |
12.9 |
9.3 |
All companies |
21.0 |
20.1 |
14.2 |
23.5 |
7.0 |
4.3 |
2.3 |
3.1 |
16.2 |
13.3 |
11.7 |
8.1 |
$: Numerator or denominator or both negative. |
Industry-wise Performance during 2008-09
Though sales grew between 17 to 20 per cent for manufacturing and services industries, profit performance of the private corporate sector across manufacturing and services industries varied considerably (Table 6). Companies engaged in IT services posted 18.0 and 2.7 per cent growth in operating and net profits, respectively. Aggregate net profits of companies engaged in other than IT and manufacturing activity declined by 11.5 per cent and 24.3 per cent, respectively despite being helped by decent growth in other income, which formed 16 per cent and 23 per cent of their pre-tax profits, respectively. For the manufacturing companies, while expenditure on raw material grew faster than sales, staff cost rose at a slower rate. Interest formed 3.0 per cent of sales for manufacturing group vis-à-vis 4.3 per cent for companies engaged in other than IT services and 1.3 per cent in the case of computer and related services.
Table 6: Sector-wise Performance of 2306 selected companies, 2008-09 |
Item |
Manufacturing 1727 |
Services |
Services (other than IT) 400 |
Computer and related activities (IT) 179 |
Amount (Rs.crore) |
Per cent change (yoy) |
Amount (Rs.crore) |
Percent change (yoy) |
Amount (Rs.crore) |
Percent change (yoy) |
1 |
2 |
3 |
4 |
5 |
6 |
7 |
Sales |
10,83,874 |
17.0 |
3,08,524 |
19.8 |
1,23,534 |
18.1 |
Other income |
15,724 |
6.5 |
7,733 |
28.4 |
2,223 |
-29.0 |
Expenditure |
9,37,378 |
19.5 |
2,55,974 |
22.7 |
98,086 |
17.8 |
of which |
|
|
|
|
|
|
Consumption of raw materials |
5,96,613 |
18.7 |
57,851 |
28.5 |
6,548 |
8.4 |
Staff cost |
50,092 |
14.7 |
19,815 |
23.1 |
39,572 |
24.7 |
Power & fuel |
34,604 |
22.5 |
22,102 |
33.2 |
# |
# |
Operating Profits (PBDIT) |
1,49,054 |
-3.3 |
55,059 |
-0.7 |
25,525 |
18.0 |
Depreciation |
34,876 |
16.6 |
15,478 |
20.5 |
3,925 |
18.0 |
Gross profits (PBIT) |
1,29,903 |
-6.5 |
47,314 |
-2.7 |
23,823 |
11.2 |
Interest |
32,180 |
55.8 |
13,392 |
63.3 |
1,633 |
102.8 |
Profits before tax (PBT) |
97,723 |
-17.4 |
33,922 |
-16.1 |
22,189 |
7.6 |
Tax provision |
21,533 |
-20.9 |
6,419 |
-16.0 |
2,984 |
8.4 |
Profits after tax (PAT) |
74,114 |
-24.3 |
30,168 |
-11.5 |
19,193 |
2.7 |
Paid-up capital |
41,062 |
3.2 |
22,760 |
5.3 |
5,521 |
4.1 |
# : Negligible. |
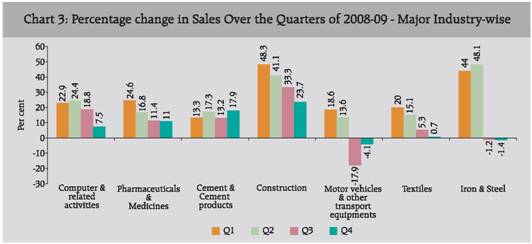
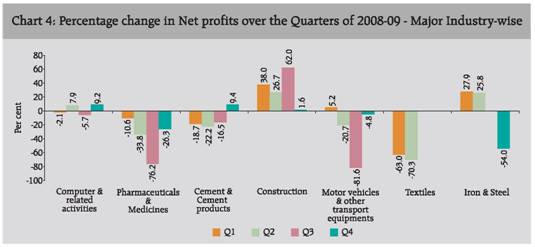
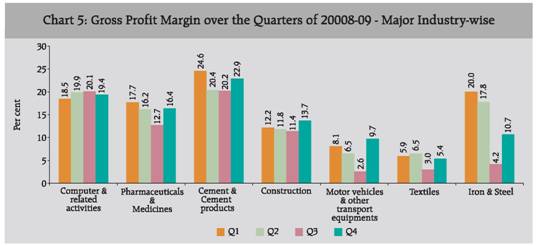
Detail industry-wise data presented in Statements 1 and 2 revealed that during 2008-09, many industries such as tea, fertilizers and petroleum refineries posted good growth in sales but failed to perform in terms of profits. The reasons varied like expenditure outpacing sales, increasing interest burden, one off non-operating expenditures, etc. Almost all industries under study recorded high increase in interest outgo, which would have impacted the net profit margin and the profits, in turn resulting in decline in tax provision. During 2008-09, construction companies fared well with 34.3 per cent growth in aggregate sales accompanied by 25.8 per cent rise in net profits despite high provisioning towards depreciation made by some large construction companies. Higher growth in interest payments was reflected in the increase in interest costs measured as interest to sales. For the cement and iron and steel industries, where the sales surged by more than 15 per cent, high commodity prices and high interest costs resulted in fall in their net profits by 12.2 per cent and 38 per cent. On the other hand, companies in machinery and machine tools and motor vehicles and other transport equipment industries reported growth in aggregate sales at a rate less than 10 per cent coupled with a fall in net profits. The net profit margin, as measured by net profits to sales, was the highest for mining and quarrying industry at 21.0 per cent followed by computer and related activities (15.5 per cent), hotel and restaurant (15.3 per cent) and cement (14.3 per cent) industries. Of the 30 industry groups under study, only sugar, paints and varnishes and medical precision and other scientific instruments industries recorded improved net margins. While the highest gain in margin was observed by sugar industry, fabricated metal products industry (other than machinery and equipment) posted the largest fall in margin followed by pharmaceutical industry.
Table 7: Consumption of Raw Materials, 2008-09 |
(Amount in Rs. crore) |
Item |
Ql |
Q2 |
Q3 |
Q4 |
Year |
2007-08 |
2008-09 |
2007-08 |
2008-09 |
2007-08 |
2008-09 |
2007-08 |
2008-09 |
2007-08 |
2008-09 |
1 |
2 |
3 |
4 |
5 |
6 |
7 |
8 |
9 |
10 |
11 |
No. of companies |
1776 |
1762 |
1763 |
1746 |
1785 |
Consumption of raw materials |
1,23,154 |
1,63,813 |
1,30,420 |
1,78,755 |
1,39,302 |
1,41,171 |
1,59,121 |
1,43,488 |
5,53,459 |
6,28,391 |
|
|
(33.0) |
|
(37.1) |
|
(1.3) |
|
(-9.8) |
|
(13.5) |
Expenditure |
1,96,661 |
2,59,824 |
2,12,193 |
2,85,347 |
2,25,508 |
2,43,272 |
2,55,865 |
2,48,728 |
8,92,297 |
10,36,163 |
| |
(32.1) |
|
(34.5) |
|
(7.9) |
|
(-2.8) |
|
(16.1) |
CRM as percentage of expenditure |
62.6 |
63.0 |
61.5 |
62.6 |
61.8 |
58.0 |
62.2 |
57.7 |
62.0 |
60.6 |
Note: Figures in brackets denote percent change over the corresponding period of the previous year. |
Major Components of Expenditure, 2008-09
The section analyses the trends in major components of expenditure viz., consumption of raw materials, staff cost and change in stock-in-trade1. Consumption of Raw Materials, 2008-09 Expenditure on raw material consumption (CRM) grew substantially at around 35 per cent on the back of high global commodity prices specifically during April-September 2008 (Table 7). However, post September, as demand conditions weakened amidst low confidence, commodity prices started falling. The companies under study recorded around 35 per cent year-on-year growth in their spending on raw materials during first two quarters, which decelerated to 1.3 per cent in Q3. The spending on raw material in Q4 was less by 9.8 per cent over the level recorded in the quarter year ago. Reflecting the same growth path, the total expenditure grew notably in first two quarters followed by a sharp deceleration to 7.9 per cent in Q3 and a fall of 2.8 per cent in Q4. Also, raw materials formed larger share in total expenditure in the first half of 2008-09 than in second half. During 2008-09 as a whole, the share dropped by 1.4 percentage points to 60.6 per cent. Staff Cost in 2008-09
Staff costs that rose by around 20 per cent in each of the first three quarters increased by 11.2 per cent in the last quarter of 2008-09 (Table 8). The share of staff cost in total expenditure remained at 8.5 per cent during 2008-09. Over the quarters, however, the share increased from 7.5 per cent in the first quarter to 9.1 per cent in the third quarter before falling marginally to 8.9 per cent in quarter ending March, reflecting lower growth in expenditure relative to staff costs. Change in Stock-in-trade in 2008-09
Reflecting the slowing demand over the quarters of 2008-09, stock-in-trade, which was seen to be accumulating during the first two quarters, started depleting during third and fourth quarters of 2008-09. This was also reflected in deceleration in sales growth. Overall during 2008-09, stock-in-trade declined by 72.7 per cent and stood at Rs. 5,177 crore as compared to Rs. 18,995 crore during 2007-08.
Performance over the Quarters of 2008-09
Aggregate sales of selected companies grew strongly on the back of high selling prices and continuing demand during first two quarters. However, expenditure outpaced sales that resulted in lower increase in operating profits. Several factors such as increase in raw material costs, high fuel and power expenses, spurt in interest rates, higher provisioning towards depreciation most importantly, the decline in other income contributed to the depressed profits.
Table 8: Staff Cost, 2008-09 |
(Amount in Rs. crore) |
Item |
Q1 |
Q2 |
Q3 |
Q4 |
Year |
2007-08 |
2008-09 |
2007-08 |
2008-09 |
2007-08 |
2008-09 |
2007-08 |
2008-09 |
2007-08 |
2008-09 |
1 |
2 |
3 |
4 |
5 |
6 |
7 |
8 |
9 |
10 |
11 |
No. of companies |
2160 |
2180 |
2187 |
2170 |
2216 |
Staff cost |
19,180 |
23,651 |
20,675 |
25,201 |
23,198 |
27,819 |
24,840 |
27,612 |
91,505 |
1,08,929 |
| |
|
(23.2) |
|
(21.9) |
|
(19.9) |
|
(11.2) |
|
(19.0) |
Expenditure |
2,31,675 |
3,15,161 |
2,49,574 |
3,47,317 |
2,70,645 |
3,04,628 |
3,12,131 |
3,10,631 |
10,70,564 |
12,84,464 |
| |
|
(36.0) |
|
(39.2) |
|
(12.6) |
|
(-0.5) |
|
(20.0) |
Staff cost as percentage of Expenditure |
8.3 |
7.5 |
8.3 |
7.3 |
8.6 |
9.1 |
8.0 |
8.9 |
8.5 |
8.5 |
Note: Figures in brackets denote percent change over the corresponding period of the previous year. |
Table 9: Change in Stock-in-trade, 2008-09 |
(Amount in Rs. crore) |
Item |
Q1 |
Q2 |
Q3 |
Q4 |
Year |
2007-08 |
2008-09 |
2007-08 |
2008-09 |
2007-08 |
2008-09 |
2007-08 |
2008-09 |
2007-08 |
2008-09 |
1 |
2 |
3 |
4 |
5 |
6 |
7 |
8 |
9 |
10 |
11 |
No. of companies |
1739 |
1741 |
1745 |
1760 |
1806 |
Stock-in-trade |
4,992 |
10,220 |
3,344 |
7,824 |
3,113 |
-5,648 |
6,809 |
-6,880 |
18,995 |
5,177 |
| |
|
(104.7) |
|
(134.0) |
|
($) |
|
($) |
|
(-72.7) |
Sales |
2,34,197 |
3,07,785 |
2,54,082 |
3,40,621 |
2,71,032 |
2,92,309 |
3,08,395 |
3,11,662 |
10,76,543 |
12,60,185 |
| |
|
(31.4) |
|
(34.1) |
|
(7.9) |
|
(1.1) |
|
(17.1) |
Stock-in -trade as percentage of sales |
2.1 |
3.3 |
1.3 |
2.3 |
1.1 |
-1.9 |
2.2 |
-2.2 |
1.8 |
0.4 |
$ : Numerator negative .
Note : Figures in brackets denote per cent change over the corresponding period of the previous year. |
Reflecting the impact of financial market turmoil, economic activity post-September weakened substantially. Sales growth, which started moderating from third quarter, was almost flat in the fourth quarter. As against the accumulation of stocks in trade during the first half, sales were partly made through depletion of inventories in the second half. However, after a sharp decline in performance in the third quarter, private corporate business sector registered some improvement as year-on-year rate of decline in net profits reduced in the quarter ended March-2009. The softening of pressure on interest expenses and decline in input expenses helped corporates to limit the year-on-year fall in aggregate profits in Q4.

Table 10: Performance of the Select Companies over the Quarters of 2008-09 |
No. of companies |
2007-08 |
2008-09 |
Q1 |
Q2 |
Q3 |
Q4 |
Q1 |
Q2 |
Q3 |
Q4 |
2342 |
2228 |
2329 |
2357 |
2500 |
2386 |
2486 |
2561 |
1 |
2 |
3 |
4 |
5 |
6 |
7 |
8 |
9 |
Year-on-year Growth rate in Per cent: |
Sales |
19.2 |
16.0 |
18.0 |
20.6 |
29.3 |
31.8 |
9.5 |
1.9 |
| |
|
|
|
|
(31.5) |
(33.3) |
(9.6) |
(1.9) |
Other Income |
106.7 |
45.2 |
70.2 |
28.5 |
-8.4 |
-0.6 |
-4.8 |
394 |
| |
|
|
|
|
(-8.4) |
(1.9) |
(-6.6) |
(42.2) |
Expenditure |
18.0 |
15.3 |
18.9 |
23.3 |
33.5 |
37.5 |
12.6 |
-0.5 |
| |
|
|
|
|
(35.9) |
(39.0) |
(12.6) |
(-0.3) |
Operating Profits (PDBIT) |
20.5 |
18.1 |
13.9 |
14.6 |
16.1 |
11.8 |
-20.9 |
-8.1 |
| |
|
|
|
|
(17.8) |
(12.3) |
(-20.3) |
(-8.9) |
Depreciation |
18.1 |
15.8 |
17.9 |
15.4 |
15.3 |
16.5 |
16.8 |
19.6 |
| |
|
|
|
|
(17.2) |
(18.5) |
(15.9) |
(20.0) |
Gross Profits (PBIT) |
31.9 |
22.5 |
20.4 |
16.8 |
11.9 |
8.7 |
-26.7 |
-8.8 |
| |
|
|
|
|
(13.4) |
(9.4) |
(-26.1) |
(-9.4) |
Interest |
4.4 |
18.4 |
45.7 |
35.8 |
58.1 |
85.3 |
62.9 |
36.5 |
| |
|
|
|
|
(71.6) |
(93.6) |
(60.6) |
(34.7) |
Profits after tax (PAT) |
33.9 |
22.7 |
29.4 |
14.1 |
6.9 |
-2.6 |
-53.4 |
-19.9 |
| |
|
|
|
|
(6.5) |
(-3.6) |
(-48.9) |
(-20.2) |
Ratios in Per cent: |
Gross profits to sales |
16.7 |
16.3 |
16.5 |
15.7 |
14.5 |
13.5 |
11.0 |
13.7 |
Profits after tax to sales |
11.7 |
11.6 |
12.5 |
10.9 |
9.7 |
8.6 |
5.3 |
8.1 |
Interest to Sales |
2.0 |
2.1 |
2.6 |
2.1 |
2.4 |
2.9 |
3.8 |
3.2 |
Interest to gross profits |
11.9 |
12.6 |
15.6 |
13.5 |
16.8 |
21.5 |
34.6 |
23.3 |
Interest coverage(Times) |
8.4 |
7.9 |
6.4 |
7.4 |
6.0 |
4.6 |
2.9 |
4.3 |
Memo: |
Sales |
2,80,814 |
2,97,110 |
3,06,238 |
3,50,917 |
3,65,303 |
3,93,626 |
3,74,686 |
4,04,863 |
Other Income |
9,151 |
8,057 |
9,221 |
10,082 |
7,666 |
7,943 |
8,471 |
9,668 |
Expenditure |
2,37,698 |
2,49,194 |
2,57,472 |
3,02,105 |
3,17,605 |
3,43,921 |
3,22,077 |
3,36,771 |
Operating Profits |
47,802 |
50,816 |
51,457 |
54,306 |
56,854 |
57,101 |
47,391 |
62,036 |
Depreciation |
10,173 |
10,576 |
10,961 |
11,805 |
11,590 |
12,075 |
14,563 |
16,055 |
Gross Profits |
46,780 |
48,296 |
49,717 |
52,583 |
52,930 |
52,968 |
41,299 |
55,649 |
Interest |
5,504 |
6,194 |
7,609 |
7,703 |
8,891 |
11,403 |
14,277 |
12,971 |
Profits after tax |
32,699 |
34,266 |
37,470 |
36,109 |
35,295 |
33,844 |
19,962 |
32,849 |
Note: Figures in brackets denote percent change over the corresponding period of the previous year for 2306 common companies covered in four quarters of 2008-09. |
Increase in interest payments coupled with deceleration in gross profits resulted in increase in interest burden over the quarters of 2008-09. Statement 3 and 4 provide the quarterly growth and ratios of key performance parameters at industry disaggregated level.
Performance of Non-Government Financial Companies
Notwithstanding the 16.5 per cent rise in the income from operations of the select 210 non-government financial public limited companies, net profits dipped for these companies by 22 per cent in 2008-09. High growth in net interest outgo with declining support of other income impacted the profit margins (Table 11). Similar to trends shown by the non-financial private companies, income decelerated over the quarters from 21.3 per cent in Q1 to 7.1 per cent in fourth quarter. Other income too started receding from second quarter reflecting depressed capital markets. The companies registered a year-on-year increase in net profits during first quarter, fell in subsequent quarters. However, in comparison to steep drop witnessed in the third quarter, fall in net profits was limited to 3.6 per cent in fourth quarter.
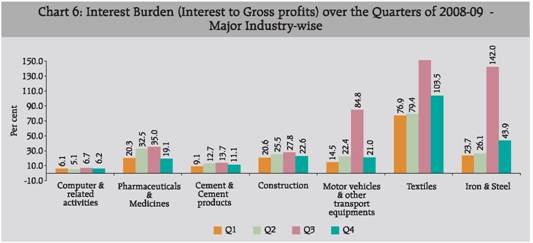
Table 11: Performance of Financial Companies, 2008-09 |
Item |
01:2008-09 |
02:2008-09 |
03:2008-09 |
04: 2008-09 |
2008-09 |
Amount (Rs. crore) |
Per cent change (yoy) |
Amount (Rs. crore) |
Per cent change (yoy) |
Amount (Rs. crore) |
Per cent change (yoy) |
Amount (Rs. crore) |
Per cent change (yoy) |
Amount (Rs. crore) |
Per cent change (yoy) |
1 |
2 |
3 |
4 |
5 |
6 |
7 |
8 |
9 |
10 |
11 |
Number of Companies |
210 |
Income from Operation |
7,537 |
21.3 |
8,174 |
16.7 |
9,007 |
12.4 |
9,128 |
7.1 |
33,964 |
16.5 |
Other Income |
134 |
33.9 |
83 |
0.1 |
108 |
-26.0 |
159 |
-11.7 |
362 |
-9.9 |
Expenditure |
2,544 |
-3.0 |
2,723 |
-12.1 |
2,748 |
-23.0 |
2,932 |
-17.6 |
11,516 |
-6.3 |
Interest |
3,148 |
40.9 |
3,573 |
49.4 |
4,155 |
51.7 |
4,173 |
45.5 |
15,047 |
47.1 |
Depreciation |
61 |
11.3 |
68 |
-7.8 |
69 |
6.5 |
99 |
11.0 |
297 |
5.1 |
Profits before tax (PBT) |
1,725 |
22.9 |
1,644 |
7.5 |
1,901 |
7.9 |
2,115 |
3.6 |
7,393 |
8.9 |
Tax provision |
429 |
26.5 |
436 |
-6.6 |
583 |
-23.6 |
543 |
-11.3 |
1,983 |
-11.4 |
Profits after tax (PAT) |
1,334 |
24.8 |
1,153 |
-16.1 |
1,327 |
-52.9 |
1,603 |
-3.6 |
5,418 |
-22.0 |
Paid-up capital |
3,205 |
7.5 |
3,299 |
9.2 |
3,326 |
5.5 |
3,444 |
7.3 |
3,457 |
7.5 |
Statement 1: Industry-wise Growth Rates of Select Performance Indicators, 2008-09 |
Industry / Industry group |
No. of companies |
Paid-up capital |
Per cent change (YoY) |
Amount (Rs. crore) |
Per cent share |
Sales |
Other income |
Expenditure |
Depreciation |
Gross profits |
Interest |
Operating Profits |
Tax provision |
Profits after tax |
1 |
2 |
3 |
4 |
5 |
6 |
7 |
8 |
9 |
10 |
11 |
12 |
13 |
1. |
Tea plantation |
25 |
273 |
0.4 |
25.5 |
-6.1 |
24.8 |
6.1 |
39.2 |
23.0 |
56.6 |
15.5 |
-25.7 |
2. |
Mining and quarrying |
35 |
1,368 |
2.0 |
19.2 |
56.9 |
26.7 |
11.1 |
9.6 |
73.6 |
4.2 |
-2.7 |
11.4 |
3. |
Food products and beverages |
155 |
2,380 |
3.4 |
16.7 |
2.7 |
11.0 |
18.8 |
34.7 |
42.7 |
35.0 |
29.2 |
44.6 |
| |
Of which |
|
|
|
|
|
|
|
|
|
|
|
|
| |
i. Sugar |
32 |
709 |
1.0 |
16.1 |
22.9 |
-10.4 |
22.4 |
462.4 |
40.1 |
220.9 |
706.6 |
$ |
| |
ii. Edible oils |
47 |
436 |
0.6 |
10.7 |
-22.6 |
8.8 |
17.1 |
-14.2 |
8.2 |
-7.9 |
-27.7 |
-22.8 |
| |
iii. Other food products & beverages |
76 |
1,235 |
1.8 |
23.8 |
-0.9 |
25.2 |
15.7 |
10.3 |
55.6 |
12.6 |
6.8 |
-21.7 |
4. |
Textiles |
270 |
5,167 |
7.5 |
9.5 |
-7.4 |
10.1 |
15.4 |
-29.2 |
43.3 |
-12.8 |
-49.5 |
$ |
5. |
Paper and paper products |
38 |
683 |
1.0 |
15.3 |
-50.7 |
18.9 |
18.8 |
-5.4 |
39.0 |
3.2 |
-18.3 |
-16.5 |
6. |
Chemicals and chemical products |
324 |
7,409 |
10.7 |
27.0 |
-8.9 |
31.1 |
14.5 |
2.8 |
85.1 |
6.5 |
-29.7 |
-21.3 |
| |
Of which |
|
|
|
|
|
|
|
|
|
|
|
|
| |
i. Basic industrial chemicals |
84 |
1,125 |
1.6 |
15.7 |
-32.6 |
20.8 |
14.8 |
-18.6 |
40.6 |
-10.3 |
-16.9 |
-41.0 |
| |
ii. Chemical fertilizers and pesticides |
34 |
2,046 |
2.9 |
71.4 |
25.9 |
78.9 |
12.3 |
42.0 |
59.2 |
37.0 |
38.9 |
-1.8 |
| |
iii. Paints and varnishes |
13 |
298 |
0.4 |
14.6 |
49.5 |
16.7 |
8.3 |
2.1 |
12.9 |
-2.8 |
10.7 |
27.3 |
| |
iv. Pharmaceuticals and medicines |
116 |
2,047 |
3.0 |
15.5 |
-28.5 |
19.6 |
18.5 |
-5.1 |
173.8 |
2.2 |
$ |
-37.9 |
| |
v. Other chemical & chemical products |
77 |
1,894 |
2.7 |
18.2 |
1.1 |
18.9 |
10.9 |
5.0 |
42.7 |
6.5 |
-19.7 |
-4.9 |
7. |
Rubber and plastic products |
92 |
1,002 |
1.4 |
14.8 |
-21.5 |
15.6 |
7.6 |
-14.0 |
21.7 |
-8.2 |
-35.0 |
-25.4 |
8. |
Cement and cement products |
38 |
2,384 |
3.4 |
15.2 |
-10.1 |
21.7 |
18.4 |
-6.7 |
25.8 |
-2.2 |
-18.0 |
-12.2 |
9. |
Iron and steel |
117 |
5,303 |
7.6 |
19.8 |
-42.7 |
24.2 |
13.7 |
-14.0 |
46.0 |
-6.8 |
-17.2 |
-38.0 |
10. |
Fabricated metal products except machinery and equipment |
32 |
421 |
0.6 |
0.0 |
-34.5 |
2.8 |
18.3 |
-32.5 |
63.4 |
-19.0 |
-40.2 |
-68.4 |
11. |
Machinery and machine tools |
130 |
1,372 |
2.0 |
8.4 |
-0.6 |
8.0 |
18.6 |
-6.1 |
39.9 |
-2.7 |
-5.8 |
-9.8 |
12. |
Electrical machinery and apparatus |
80 |
1,289 |
1.9 |
12.9 |
-7.1 |
11.5 |
18.8 |
-9.6 |
24.7 |
-5.5 |
-10.9 |
-20.5 |
13. |
Radio, television and communication equipments |
38 |
1,183 |
1.7 |
-5.9 |
38.8 |
-4.7 |
2.1 |
-38.7 |
29.2 |
-29.3 |
-77.6 |
$ |
14. |
Medical precision and other scientific instruments |
17 |
220 |
0.3 |
9.2 |
251.8 |
5.2 |
15.8 |
79.3 |
-3.7 |
55.8 |
59.2 |
49.3 |
15. |
Motor vehicles and other transport equipments |
82 |
2,099 |
3.0 |
1.9 |
19.5 |
3.7 |
20.5 |
-30.0 |
74.0 |
-24.8 |
-39.6 |
-27.2 |
16. |
Jewellery and related articles |
24 |
325 |
0.5 |
-3.2 |
-31.6 |
2.7 |
13.6 |
-50.9 |
43.2 |
-48.9 |
-59.5 |
$ |
17. |
Diversified |
17 |
599 |
0.9 |
18.1 |
5.3 |
22.5 |
25.3 |
-8.1 |
48.1 |
-4.0 |
-53.4 |
-26.0 |
18. |
Electricity generation and supply |
11 |
1,799 |
2.6 |
29.3 |
2.4 |
30.9 |
11.7 |
17.2 |
30.9 |
21.4 |
32.5 |
8.1 |
19. |
Construction |
73 |
2,406 |
3.5 |
34.3 |
52.8 |
35.3 |
42.8 |
24.5 |
77.2 |
24.0 |
12.3 |
25.8 |
20. |
Wholesale and retail trade |
103 |
1,407 |
2.0 |
14.5 |
15.3 |
14.3 |
38.8 |
-26.2 |
55.7 |
-22.6 |
-33.5 |
-79.6 |
21. |
Hotel and restaurant |
39 |
706 |
1.0 |
-7.9 |
-0.2 |
4.7 |
13.8 |
-30.3 |
2.7 |
-27.1 |
-33.2 |
-33.0 |
22. |
Transport, storage and communication |
44 |
11,716 |
16.9 |
24.4 |
9.3 |
30.7 |
15.8 |
7.4 |
67.2 |
10.5 |
-2.2 |
8.8 |
23. |
Computer and related activities |
179 |
5,521 |
8.0 |
18.1 |
-29.0 |
17.8 |
18.0 |
11.2 |
102.8 |
18.0 |
8.4 |
2.7 |
24. |
Petroleum refinery |
15 |
3,069 |
4.4 |
37.0 |
118.0 |
43.6 |
17.8 |
7.8 |
155.6 |
5.3 |
-20.2 |
-23.8 |
All companies + |
2306 |
69,343 |
100.0 |
17.6 |
7.3 |
20.0 |
17.8 |
-3.8 |
59.1 |
-0.7 |
-17.8 |
-18.0 |
$ : Numerator or denominator or both negative. + : All companies under study. |
Statement 2: Industry-wise Profit Allocation, Interest-linked and Profitability Ratios, 2008-09 |
(Per cent) |
Industry / Industry group |
Profit Allocation Ratios |
Interest linked Ratios |
Profitability Ratios |
Tax provision to Profits before tax |
Interest to Gross profits |
Interest coverage (Times) |
Interest to Sales |
Gross profits to Sales |
Profits after tax to Sales |
2007-08 |
2008-09 |
2007-08 |
2008-09 |
2007-08 |
2008-09 |
2007-08 |
2008-09 |
2007-08 |
2008-09 |
2007-08 |
2008-09 |
1 |
2 |
3 |
4 |
5 |
6 |
7 |
8 |
9 |
10 |
11 |
12 |
13 |
1. |
Tea plantation |
28.1 |
21.9 |
34.9 |
30.8 |
2.9 |
3.2 |
5.0 |
4.9 |
14.4 |
15.9 |
12.5 |
7.4 |
2. |
Mining and quarrying |
31.1 |
29.3 |
8.9 |
14.1 |
11.2 |
7.1 |
3.3 |
4.7 |
36.4 |
33.4 |
22.5 |
21.0 |
3. |
Food products and beverages |
30.2 |
30.2 |
39.7 |
42.1 |
2.5 |
2.4 |
2.8 |
3.5 |
7.2 |
8.3 |
3.4 |
4.2 |
| |
Of which |
|
|
|
|
|
|
|
|
|
|
|
|
| |
i. Sugar |
$ |
38.4 |
218.1 |
54.3 |
0.5 |
1.8 |
6.1 |
7.4 |
2.8 |
13.5 |
-2.3 |
9.6 |
| |
ii. Edible oils |
25.4 |
23.3 |
23.4 |
29.6 |
4.3 |
3.4 |
1.0 |
0.9 |
4.1 |
3.2 |
2.2 |
1.6 |
| |
iii. Other food products & beverages |
25.5 |
29.4 |
28.1 |
39.6 |
3.6 |
2.5 |
3.5 |
4.4 |
12.6 |
11.2 |
7.3 |
4.6 |
4. |
Textiles |
18.5 |
$ |
50.3 |
101.9 |
2.0 |
1.0 |
4.1 |
5.4 |
8.2 |
5.3 |
3.1 |
-0.6 |
5. |
Paper and paper products |
22.9 |
23.5 |
25.1 |
36.9 |
4.0 |
2.7 |
3.5 |
4.2 |
13.9 |
11.4 |
7.9 |
5.7 |
6. |
Chemicals and chemical products |
19.4 |
14.9 |
12.4 |
22.3 |
8.1 |
4.5 |
1.8 |
2.7 |
14.7 |
11.9 |
11.1 |
6.9 |
| |
Of which |
|
|
|
|
|
|
|
|
|
|
|
|
| |
i. Basic industrial chemicals |
18.0 |
23.1 |
22.0 |
37.9 |
4.6 |
2.6 |
3.4 |
4.1 |
15.3 |
10.8 |
10.5 |
5.4 |
| |
ii. Chemical fertilizers and pesticides |
32.3 |
32.9 |
23.8 |
26.7 |
4.2 |
3.7 |
2.6 |
2.4 |
10.9 |
9.0 |
8.3 |
4.8 |
| |
iii. Paints and varnishes |
30.4 |
33.1 |
3.2 |
3.5 |
31.5 |
28.5 |
0.4 |
0.4 |
13.4 |
12.0 |
8.8 |
9.8 |
| |
iv. Pharmaceuticals and medicines |
13.4 |
-0.7 |
8.9 |
25.7 |
11.2 |
3.9 |
1.7 |
4.0 |
18.9 |
15.5 |
14.5 |
7.8 |
| |
v. Other chemical & chemical products |
21.1 |
16.7 |
8.6 |
11.7 |
11.6 |
8.5 |
1.1 |
1.3 |
12.7 |
11.3 |
9.9 |
8.0 |
7. |
Rubber and plastic products |
22.0 |
20.7 |
32.0 |
45.3 |
3.1 |
2.2 |
3.3 |
3.5 |
10.2 |
7.7 |
5.0 |
3.3 |
8. |
Cement and cement products |
27.2 |
24.7 |
8.5 |
11.5 |
11.7 |
8.7 |
2.3 |
2.5 |
27.2 |
22.0 |
18.8 |
14.3 |
9. |
Iron and steel |
26.2 |
30.9 |
20.7 |
35.2 |
4.8 |
2.8 |
4.0 |
4.9 |
19.3 |
13.8 |
11.6 |
6.0 |
10. |
Fabricated metal products except machinery and equipment |
24.0 |
33.8 |
20.6 |
50.0 |
4.8 |
2.0 |
3.4 |
5.5 |
16.3 |
11.0 |
12.2 |
3.8 |
11. |
Machinery and machine tools |
28.8 |
30.9 |
11.7 |
17.5 |
8.5 |
5.7 |
1.4 |
1.8 |
12.1 |
10.5 |
8.3 |
6.9 |
12. |
Electrical machinery and apparatus |
30.0 |
32.1 |
17.5 |
24.1 |
5.7 |
4.2 |
2.1 |
2.3 |
12.2 |
9.7 |
7.3 |
5.1 |
13. |
Radio, television and communication equipments |
100.3 |
$ |
79.4 |
167.4 |
1.3 |
0.6 |
3.5 |
4.9 |
4.5 |
2.9 |
2.0 |
-1.6 |
14. |
Medical precision and other scientific instruments |
36.5 |
32.3 |
0.7 |
0.4 |
141.1 |
262.8 |
0.1 |
0.0 |
7.8 |
12.7 |
6.5 |
8.9 |
15. |
Motor vehicles and other transport equipments |
22.7 |
23.4 |
9.9 |
24.6 |
10.1 |
4.1 |
1.0 |
1.7 |
10.1 |
6.9 |
7.0 |
5.0 |
16. |
Jewellery and related articles |
19.6 |
47.3 |
25.6 |
74.6 |
3.9 |
1.3 |
1.6 |
2.4 |
6.4 |
3.2 |
1.2 |
-2.4 |
17. |
Diversified |
30.7 |
16.9 |
11.1 |
17.8 |
9.0 |
5.6 |
2.3 |
2.8 |
20.4 |
15.9 |
15.7 |
9.8 |
18. |
Electricity generation and supply |
11.5 |
13.5 |
21.8 |
24.3 |
4.6 |
4.1 |
4.0 |
4.0 |
18.3 |
16.6 |
14.3 |
11.9 |
19. |
Construction |
28.3 |
27.9 |
17.0 |
24.1 |
5.9 |
4.1 |
2.3 |
3.0 |
13.4 |
12.4 |
7.9 |
7.4 |
20. |
Wholesale and retail trade |
11.8 |
18.2 |
27.1 |
57.2 |
3.7 |
1.7 |
2.2 |
2.9 |
8.0 |
5.2 |
4.8 |
0.9 |
21. |
Hotel and restaurant |
32.8 |
34.1 |
14.4 |
21.2 |
7.0 |
4.7 |
5.4 |
6.1 |
37.8 |
28.6 |
21.1 |
15.3 |
22. |
Transport, storage and communication |
10.8 |
11.1 |
17.6 |
27.4 |
5.7 |
3.6 |
3.7 |
5.0 |
21.3 |
18.4 |
16.8 |
14.7 |
23. |
Computer and related activities |
13.4 |
13.4 |
3.8 |
6.9 |
26.6 |
14.6 |
0.8 |
1.3 |
20.5 |
19.3 |
17.9 |
15.5 |
24. |
Petroleum refinery |
15.1 |
12.1 |
5.5 |
13.1 |
18.1 |
7.6 |
0.8 |
1.5 |
14.4 |
11.3 |
14.3 |
8.0 |
All companies + |
21.0 |
20.1 |
14.2 |
23.5 |
7.0 |
4.3 |
2.3 |
3.1 |
16.2 |
13.3 |
11.7 |
8.1 |
$: Numerator or denominator or both negative. + : All companies under study. |
Statement 3: Industry wise Growth Rates of Select Performance Indicators over the Quarters of 2008-09 |
(Per cent) |
Industry / Industry group |
Number of Companies |
Sales |
Expenditure |
Q1 |
Q2 |
Q3 |
Q4 |
Q1 |
Q2 |
Q3 |
Q4 |
1 |
2 |
3 |
4 |
5 |
6 |
7 |
8 |
9 |
10 |
1. |
Tea plantation |
25 |
25.8 |
35.2 |
24.9 |
14.2 |
22.4 |
29.9 |
29.3 |
21.9 |
2. |
Mining and quarrying |
35 |
67.7 |
41.5 |
17.7 |
-11.5 |
31.5 |
31.9 |
31.2 |
20.1 |
3. |
Food products and beverages |
155 |
31.8 |
27.4 |
12.2 |
3.1 |
20.3 |
24.4 |
13.5 |
-2.3 |
| |
of which |
|
|
|
|
|
|
|
|
|
| |
i. Sugar |
32 |
12.5 |
32.4 |
19.6 |
3.5 |
-28.2 |
-2.2 |
28.0 |
-20.4 |
| |
ii. Edible oils |
47 |
28.4 |
23.4 |
3.5 |
-0.8 |
26.5 |
19.4 |
-1.2 |
2.5 |
| |
iii. Other food products & beverages |
76 |
45.3 |
29.1 |
19.8 |
7.7 |
40.4 |
37.4 |
27.0 |
5.9 |
4. |
Textiles |
270 |
20.0 |
15.1 |
5.3 |
0.7 |
20.4 |
16.0 |
5.4 |
1.7 |
5. |
Paper and paper products |
38 |
6.9 |
24.7 |
16.1 |
5.3 |
8.6 |
27.1 |
25.3 |
3.2 |
6. |
Chemicals and chemical products |
324 |
35.1 |
40.8 |
25.1 |
10.0 |
37.4 |
53.4 |
30.6 |
6.2 |
| |
Of which |
|
|
|
|
|
|
|
|
|
| |
i. Basic industrial chemicals |
84 |
31.7 |
39.3 |
3.0 |
-3.7 |
31.4 |
50.0 |
10.2 |
-2.0 |
| |
ii. Chemical fertilizers and pesticides |
34 |
79.1 |
97.5 |
80.7 |
25.0 |
80.1 |
140.1 |
83.4 |
22.6 |
| |
iii. Paints and varnishes |
13 |
23.0 |
22.1 |
2.3 |
12.6 |
19.3 |
33.5 |
9.5 |
3.2 |
| |
iv. Pharmaceuticals and medicines |
116 |
24.6 |
16.8 |
11.4 |
11.0 |
24.6 |
20.8 |
20.7 |
6.8 |
| |
v. Other chemical & chemical products |
77 |
27.8 |
26.5 |
14.2 |
6.6 |
30.8 |
36.4 |
15.0 |
0.5 |
7. |
Rubber and plastic products |
92 |
27.3 |
23.4 |
5.9 |
5.6 |
29.9 |
31.2 |
9.7 |
-0.8 |
8. |
Cement and cement products |
38 |
13.3 |
17.3 |
13.2 |
17.9 |
24.4 |
28.3 |
23.5 |
13.5 |
9. |
Iron and steel |
117 |
44.0 |
48.1 |
-1.2 |
-1.4 |
45.6 |
55.0 |
11.7 |
-4.7 |
10. |
Fabricated metal products except machinery and equipment |
32 |
20.6 |
17.9 |
-12.1 |
-24.1 |
23.3 |
28.0 |
-5.8 |
-26.2 |
11. |
Machinery and machine tools |
130 |
19.5 |
18.1 |
2.7 |
0.0 |
17.9 |
20.2 |
4.8 |
-1.8 |
12. |
Electrical machinery and apparatus |
80 |
27.9 |
25.1 |
3.0 |
1.3 |
28.9 |
24.4 |
1.2 |
-4.5 |
13. |
Radio, television and communication equipments |
38 |
-6.3 |
-1.6 |
-12.1 |
-4.2 |
-7.4 |
-3.1 |
-2.8 |
-3.5 |
14. |
Medical precision and other scientific instruments |
17 |
7.2 |
18.9 |
-0.7 |
10.9 |
0.6 |
17.8 |
9.3 |
-5.9 |
15. |
Motor vehicles and other transport equipments |
82 |
18.6 |
13.6 |
-17.9 |
-4.1 |
23.1 |
18.2 |
-14.2 |
-7.2 |
16. |
Jewellery and related articles |
24 |
15.6 |
11.6 |
-11.3 |
-12.2 |
25.6 |
12.7 |
7.8 |
-15.8 |
17. |
Diversified |
17 |
21.5 |
26.7 |
13.3 |
12.6 |
29.0 |
42.0 |
23.3 |
2.7 |
18. |
Electricity generation and supply |
11 |
27.0 |
35.9 |
38.4 |
21.6 |
30.6 |
40.3 |
41.3 |
14.3 |
19. |
Construction |
73 |
48.3 |
41.1 |
33.3 |
23.7 |
47.2 |
40.0 |
37.0 |
22.5 |
20. |
Wholesale and retail trade |
103 |
24.2 |
24.6 |
8.5 |
4.5 |
23.3 |
26.7 |
4.0 |
7.9 |
21. |
Hotel and restaurant |
39 |
14.7 |
7.8 |
-15.5 |
-20.9 |
18.7 |
19.9 |
2.1 |
-9.0 |
22. |
Transport, storage and communication |
44 |
32.5 |
34.5 |
25.0 |
9.6 |
47.2 |
45.9 |
30.6 |
5.0 |
23. |
Computer and related activities |
179 |
22.9 |
24.4 |
18.8 |
7.5 |
26.1 |
22.2 |
17.4 |
7.7 |
24. |
Petroleum refinery |
15 |
68.4 |
79.8 |
15.0 |
-5.0 |
97.8 |
93.8 |
7.3 |
-10.3 |
All companies+ |
2306 |
31.5 |
33.3 |
9.6 |
1.9 |
35.9 |
39.0 |
12.6 |
-0.3 |
$: Numerator or denominator or both negative. +: All companies under study. |
Statement 3: Industry wise Growth Rates of Select Performance Indicators over the Quarters of 2008-09 (Concld.) |
(Per cent) |
Industry / Industry group |
Number of Companies |
Gross Profits |
Profits afer Tax |
Q1 |
Q2 |
Q3 |
Q4 |
Q1 |
Q2 |
Q3 |
Q4 |
1 |
2 |
11 |
12 |
13 |
14 |
15 |
16 |
17 |
18 |
1. |
Tea plantation |
25 |
7.6 |
34.9 |
2.5 |
$ |
-18.5 |
30.9 |
-0.1 |
$ |
2. |
Mining and quarrying |
35 |
183.2 |
91.5 |
-13.9 |
-44.8 |
225.4 |
98.5 |
-19.6 |
-51.3 |
3. |
Food products and beverages |
155 |
112.2 |
80.4 |
6.5 |
-2.7 |
193.4 |
312.1 |
-30.7 |
-28.0 |
| |
of which |
|
|
|
|
|
|
|
|
|
| |
i. Sugar |
32 |
$ |
$ |
819.2 |
24.8 |
$ |
$ |
$ |
-3.3 |
| |
ii. Edible oils |
47 |
59.7 |
14.6 |
-59.1 |
-36.3 |
62.4 |
-15.6 |
-80.2 |
-39.6 |
| |
iii. Other food products & beverages |
76 |
33.4 |
24.2 |
-10.7 |
-8.0 |
21.1 |
9.5 |
-58.4 |
-44.7 |
4. |
Textiles |
270 |
-19.0 |
-20.6 |
-62.8 |
-20.0 |
-63.0 |
-70.3 |
$ |
$ |
5. |
Paper and paper products |
38 |
-11.4 |
2.1 |
-8.1 |
-8.4 |
-22.3 |
-15.7 |
-25.7 |
-11.4 |
6. |
Chemicals and chemical products |
324 |
19.6 |
9.0 |
-29.2 |
2.7 |
4.0 |
-11.4 |
-57.5 |
-28.5 |
| |
Of which |
|
|
|
|
|
|
|
|
|
| |
i. Basic industrial chemicals |
84 |
38.5 |
11.3 |
-70.6 |
-44.6 |
25.1 |
-14.5 |
$ |
-48.6 |
| |
ii. Chemical fertilizers and pesticides |
34 |
68.0 |
63.6 |
-14.4 |
-16.0 |
46.7 |
49.7 |
-37.8 |
-54.9 |
| |
iii. Paints and varnishes |
13 |
38.9 |
8.4 |
-39.2 |
7.7 |
48.8 |
10.0 |
52.3 |
0.0 |
| |
iv. Pharmaceuticals and medicines |
116 |
3.6 |
-2.4 |
-27.3 |
30.6 |
-10.6 |
-33.8 |
-76.2 |
-26.3 |
| |
v. Other chemical & chemical products |
77 |
9.1 |
-10.1 |
-19.9 |
13.5 |
-2.7 |
-12.3 |
-35.2 |
-5.2 |
7. |
Rubber and plastic products |
92 |
8.6 |
-40.2 |
-40.5 |
23.9 |
2.7 |
-67.1 |
-71.3 |
19.5 |
8. |
Cement and cement products |
38 |
-9.2 |
-16.6 |
-12.5 |
12.1 |
-18.7 |
-22.2 |
-16.5 |
9.4 |
9. |
Iron and steel |
117 |
34.4 |
36.6 |
-77.5 |
-43.5 |
27.9 |
25.8 |
$ |
-54.0 |
10. |
Fabricated metal products except machinery and equipment |
32 |
-17.1 |
-27.5 |
-59.4 |
-26.6 |
-22.0 |
-51.4 |
-97.0 |
-86.5 |
11. |
Machinery and machine tools |
130 |
20.1 |
1.1 |
-21.9 |
-12.8 |
-3.0 |
-5.4 |
-20.8 |
-9.6 |
12. |
Electrical machinery and apparatus |
80 |
14.3 |
1.4 |
-30.6 |
-9.1 |
2.3 |
-13.7 |
-58.6 |
-9.5 |
13. |
Radio, television and communication equipments |
38 |
1.4 |
-10.1 |
-31.2 |
$ |
-40.1 |
-46.5 |
$ |
$ |
14. |
Medical precision and other scientific instruments |
17 |
119.3 |
1.2 |
113.4 |
327.1 |
87.9 |
-8.8 |
47.4 |
289.9 |
15. |
Motor vehicles and other transport equipments |
82 |
-11.1 |
-33.4 |
-79.4 |
9.9 |
5.2 |
-20.7 |
-81.6 |
-4.8 |
16. |
Jewellery and related articles |
24 |
-6.5 |
-22.3 |
-79.2 |
-55.7 |
-9.2 |
-71.4 |
$ |
$ |
17. |
Diversified |
17 |
6.5 |
-10.8 |
-32.4 |
3.5 |
7.7 |
-49.9 |
-41.5 |
-8.8 |
18. |
Electricity generation and supply |
11 |
9.9 |
24.9 |
9.9 |
57.7 |
9.3 |
5.5 |
-10.8 |
26.2 |
19. |
Construction |
73 |
32.4 |
35.5 |
15.4 |
20.5 |
38.0 |
26.7 |
62.0 |
1.6 |
20. |
Wholesale and retail trade |
103 |
23.0 |
0.2 |
-45.2 |
-47.5 |
1.0 |
-56.9 |
$ |
-79.2 |
21. |
Hotel and restaurant |
39 |
6.8 |
-20.2 |
-38.1 |
-47.2 |
8.3 |
-32.6 |
-46.8 |
-41.3 |
22. |
Transport, storage and communication |
44 |
-2.9 |
12.3 |
11.1 |
18.4 |
-5.8 |
-24.6 |
16.8 |
53.2 |
23. |
Computer and related activities |
179 |
8.7 |
10.6 |
3.8 |
4.7 |
-2.1 |
7.9 |
-5.7 |
9.2 |
24. |
Petroleum refinery |
15 |
14.2 |
17.8 |
-9.3 |
21.0 |
14.3 |
8.5 |
-71.5 |
6.4 |
All companies+ |
2306 |
13.4 |
9.4 |
-26.1 |
-9.4 |
6.5 |
-3.6 |
-48.9 |
-20.2 |
Statement 4: Industry-wise Profitability Ratios over the Quarters of 2008-09 |
(Per cent) |
Industry / Industry group |
Gross profits to Sales |
Q1 |
Q2 |
Q3 |
Q4 |
2007-08 |
2008-09 |
2007-08 |
2008-09 |
2007-08 |
2008-09 |
2007-08 |
2008-09 |
1 |
2 |
3 |
4 |
5 |
6 |
7 |
8 |
9 |
1. |
Tea plantation |
20.5 |
17.5 |
28.3 |
28.2 |
19.5 |
16.0 |
-8.7 |
-4.4 |
2. |
Mining and quarrying |
25.8 |
43.5 |
25.6 |
34.7 |
40.5 |
29.6 |
44.2 |
27.6 |
3. |
Food products and beverages |
5.3 |
8.6 |
6.0 |
8.5 |
7.2 |
6.8 |
9.7 |
9.1 |
| |
Of which |
|
|
|
|
|
|
|
|
| |
i. Sugar |
-8.7 |
6.9 |
-5.1 |
10.4 |
1.7 |
13.0 |
19.6 |
23.6 |
| |
ii. Edible oils |
3.8 |
4.8 |
4.2 |
3.9 |
4.7 |
1.9 |
4.1 |
2.7 |
| |
iii. Other food products & beverages |
14.2 |
13.0 |
12.6 |
12.2 |
12.7 |
9.4 |
12.0 |
10.3 |
4. |
Textiles |
8.7 |
5.9 |
9.4 |
6.5 |
8.4 |
3.0 |
6.8 |
5.4 |
5. |
Paper and paper products |
14.9 |
12.4 |
14.8 |
12.1 |
14.7 |
11.6 |
12.1 |
10.5 |
6. |
Chemicals and chemical products |
16.2 |
14.3 |
15.5 |
12.0 |
15.4 |
8.7 |
13.9 |
12.9 |
| |
Of which |
|
|
|
|
|
|
|
|
| |
i. Basic industrial chemicals |
14.4 |
15.1 |
16.1 |
12.9 |
15.4 |
4.4 |
18.3 |
10.5 |
| |
ii.Chemical fertilizers and pesticides |
14.1 |
13.3 |
11.5 |
9.5 |
12.5 |
5.9 |
16.0 |
10.7 |
| |
iii. Paints and varnishes |
13.2 |
14.9 |
14.6 |
13.0 |
13.9 |
8.3 |
12.2 |
11.7 |
| |
iv. Pharmaceuticals and medicines |
21.3 |
17.7 |
19.4 |
16.2 |
19.4 |
12.7 |
14.0 |
16.4 |
| |
v. Other chemical & chemical products |
13.4 |
11.4 |
14.1 |
10.0 |
13.7 |
9.6 |
11.0 |
11.7 |
7. |
Rubber and plastic products |
10.3 |
8.8 |
10.6 |
5.1 |
10.5 |
5.9 |
9.6 |
11.2 |
8. |
Cement and cement products |
30.6 |
24.6 |
28.8 |
20.4 |
26.1 |
20.2 |
24.1 |
22.9 |
9. |
Iron and steel |
21.5 |
20.0 |
19.4 |
17.8 |
18.3 |
4.2 |
18.7 |
10.7 |
10 |
Fabricated metal products except machinery and equipment |
17.5 |
12.0 |
17.4 |
10.7 |
17.0 |
7.9 |
13.9 |
13.5 |
11 |
Machinery and machine tools |
11.5 |
11.6 |
12.6 |
10.8 |
11.7 |
8.9 |
12.8 |
11.2 |
12 |
Electrical machinery and apparatus |
12.6 |
11.2 |
12.8 |
10.4 |
12.4 |
8.3 |
11.1 |
9.9 |
13 |
Radio, television and communication equipments |
4.6 |
5.0 |
6.5 |
6.0 |
5.5 |
4.3 |
1.7 |
-2.9 |
14 |
Medical precision and other scientific instruments |
5.5 |
11.2 |
15.2 |
12.9 |
7.1 |
15.2 |
3.1 |
12.0 |
15 |
Motor vehicles and other transport equipments |
10.9 |
8.1 |
11.0 |
6.5 |
10.4 |
2.6 |
8.4 |
9.7 |
16 |
Jewellery and related articles |
7.1 |
5.7 |
6.6 |
4.6 |
6.5 |
1.5 |
5.3 |
2.7 |
17 |
Diversified |
21.6 |
18.9 |
21.3 |
15.0 |
21.4 |
12.8 |
18.4 |
16.9 |
18 |
Electricity generation and supply |
18.4 |
15.9 |
21.0 |
19.3 |
19.2 |
15.3 |
15.8 |
20.5 |
19 |
Construction |
13.7 |
12.2 |
12.3 |
11.8 |
13.2 |
11.4 |
14.1 |
13.7 |
20 |
Wholesale and retail trade |
6.5 |
6.4 |
7.1 |
5.7 |
8.5 |
4.3 |
8.9 |
4.5 |
21 |
Hotel and restaurant |
32.6 |
30.4 |
32.9 |
24.4 |
42.2 |
30.9 |
41.3 |
27.6 |
22 |
Transport, storage and communication |
24.1 |
17.6 |
20.5 |
17.1 |
20.3 |
18.1 |
19.6 |
21.2 |
23 |
Computer and related activities |
20.9 |
18.5 |
22.4 |
19.9 |
23.0 |
20.1 |
20.0 |
19.4 |
24 |
Petroleum refinery |
15.9 |
10.8 |
14.9 |
9.7 |
13.9 |
11.0 |
13.3 |
16.9 |
All companies+ |
17.2 |
14.9 |
16.6 |
13.6 |
16.6 |
11.2 |
15.5 |
13.7 |
$: Numerator or denominator or both negative. +: All companies under study. |
Statement 4: Industry-wise Profitability Ratios over the Quarters of 2008-09 (Concld.) |
(Per cent) |
Industry / Industry group |
Profits after tax to Sales |
Q1 |
Q2 |
Q3 |
Q4 |
2007-08 |
2008-09 |
2007-08 |
2008-09 |
2007-08 |
2008-09 |
2007-08 |
2008-09 |
1 |
10 |
11 |
12 |
13 |
14 |
15 |
16 |
17 |
1. |
Tea plantation |
14.1 |
9.2 |
22.0 |
21.3 |
11.8 |
9.4 |
2.1 |
-13.1 |
2. |
Mining and quarrying |
15.6 |
30.2 |
15.7 |
22.1 |
25.9 |
17.7 |
27.4 |
15.1 |
3. |
Food products and beverages |
1.7 |
3.8 |
2.2 |
7.3 |
3.4 |
2.1 |
5.4 |
3.8 |
| |
of which |
|
|
|
|
|
|
|
|
| |
i. Sugar |
-11.1 |
-0.3 |
-10.3 |
21.7 |
-3.6 |
4.9 |
12.7 |
11.9 |
| |
ii. Edible oils |
2.1 |
2.7 |
2.8 |
1.9 |
2.6 |
0.5 |
2.1 |
1.3 |
| |
iii. Other food products and beverages |
7.8 |
6.5 |
7.1 |
6.0 |
7.5 |
2.6 |
6.3 |
3.3 |
4. |
Textiles |
3.6 |
1.1 |
4.0 |
1.0 |
3.9 |
-3.2 |
1.7 |
-1.7 |
5. |
Paper and paper products |
9.0 |
6.5 |
8.8 |
6.0 |
7.5 |
4.8 |
6.7 |
5.7 |
6. |
Chemicals and chemical products |
12.3 |
9.5 |
11.6 |
7.3 |
11.6 |
4.0 |
9.8 |
6.4 |
| |
of which |
|
|
|
|
|
|
|
|
| |
i. Basic industrial chemicals |
9.3 |
8.8 |
11.2 |
6.9 |
9.9 |
-0.8 |
11.4 |
6.1 |
| |
ii. Chemical fertilizers and pesticides |
8.7 |
7.1 |
7.6 |
5.8 |
7.7 |
2.6 |
11.1 |
4.0 |
| |
iii. Paints and varnishes |
8.9 |
10.8 |
9.7 |
8.8 |
8.4 |
12.6 |
8.2 |
7.3 |
| |
iv. Pharmaceuticals and medicines |
17.2 |
12.4 |
15.6 |
8.8 |
16.1 |
3.4 |
10.4 |
6.9 |
| |
v. Other chemical & chemical products |
11.0 |
8.4 |
10.8 |
7.5 |
11.2 |
6.3 |
8.2 |
7.3 |
7. |
Rubber and plastic products |
5.1 |
4.1 |
5.3 |
1.4 |
4.1 |
1.1 |
5.4 |
6.1 |
8. |
Cement and cement products |
25.5 |
18.3 |
19.5 |
12.9 |
16.8 |
12.4 |
15.4 |
14.3 |
9. |
Iron and steel |
12.0 |
10.7 |
10.9 |
9.2 |
9.6 |
-3.3 |
10.9 |
5.1 |
10. |
Fabricated metal products except machinery and equipment |
10.2 |
6.6 |
9.9 |
4.1 |
9.1 |
0.3 |
19.0 |
3.4 |
11. |
Machinery and machine tools |
8.6 |
6.9 |
8.0 |
6.4 |
8.4 |
6.5 |
8.8 |
8.0 |
12. |
Electrical machinery and apparatus |
7.4 |
6.0 |
8.0 |
5.5 |
7.4 |
3.0 |
6.8 |
6.1 |
13. |
Radio, television and communication equipments |
1.4 |
0.9 |
3.1 |
1.7 |
2.7 |
-1.2 |
1.0 |
-7.1 |
14. |
Medical precision and scientific instruments |
4.2 |
7.4 |
11.6 |
8.9 |
8.0 |
11.9 |
2.2 |
7.7 |
15. |
Motor vehicles and other transport equipments |
7.1 |
6.3 |
7.3 |
5.1 |
7.9 |
1.8 |
6.0 |
6.0 |
16. |
Jewellary and related articles |
4.2 |
3.3 |
3.9 |
1.0 |
4.6 |
-5.6 |
-6.4 |
-8.2 |
17. |
Diversified |
13.8 |
12.2 |
22.7 |
9.0 |
14.0 |
7.2 |
13.5 |
11.0 |
18. |
Electricity generation and supply |
11.9 |
10.2 |
16.8 |
13.0 |
14.7 |
9.5 |
14.7 |
15.2 |
19. |
Construction |
7.6 |
7.1 |
6.8 |
6.1 |
7.7 |
9.3 |
8.7 |
7.1 |
20. |
Wholesale and retail trade |
3.6 |
2.9 |
4.8 |
1.7 |
5.7 |
-2.0 |
5.1 |
1.0 |
21. |
Hotel and restaurant |
18.3 |
17.3 |
19.0 |
11.9 |
25.9 |
16.3 |
21.0 |
15.6 |
22. |
Transport, storage and communication |
21.5 |
15.3 |
19.0 |
10.7 |
13.8 |
12.9 |
14.0 |
19.5 |
23. |
Computer & related activities |
18.3 |
14.6 |
18.8 |
16.3 |
19.8 |
15.7 |
15.5 |
15.7 |
24. |
Petroleum refinery |
12.1 |
8.2 |
11.8 |
7.1 |
22.8 |
5.7 |
10.4 |
11.7 |
All companies+ |
12.1 |
9.8 |
11.9 |
8.6 |
12.7 |
5.9 |
10.5 |
8.2 |
* Prepared in the Corporate Studies Division of the Department of Statistics and Information Management. The previous study ‘Performance of Private Corporate Business Sector, 2007-08’ was published in the September 2008 issue of the RBI Bulletin. 1 Data on components of expenditure are presented in Tables 7, 8 and 9 based on companies reporting the component under its expenditure head. |


