Performance of Private Corporate Business Sector during the First Half of 2007- 08* This article reviews the performance of private corporate business sector during the first half of 2007-08 based on the abridged un-audited/audited financial results of public limited companies. The non-government non-financial companies showed lower business activity in the first half of 2007-08 reflecting deceleration in consumer demand, signs of which surfaced from the last quarter of 2006-07. Sales and net profit growth at 17.4 per cent and 31.1 per cent were substantially lower by 10.0 and 10.5 percentage points when compared over their respective year ago levels. Sector-wise, performance of services sector companies (excluding those engaged in computer and related activities) was impressive in terms of growth in revenue as well as profits at 27.7 per cent and 70.7 per cent respectively. In contrast, manufacturing companies reported lower growth in sales (15.1 per cent) as well as post tax profits (25.1 per cent). Over the quarters, the sales and post tax profits growth at 16.0 per cent and 22.7 per cent observed in the second quarter was lower than the sales and net profits growth at 19.2 per cent and 33.9 per cent in the first quarter of 2007-08.
The performance of the private corporate business sector during the first half of 2007-08 (April-September) is assessed in this article, based on abridged un-audited/audited financial results submitted by the listed companies to the Stock Exchanges. Since the data are available for only few items and are provisional in nature, findings of analysis can be taken as indicative. This article covers data relating to 2082 non-government non-financial public limited companies and provides, inter alia, a brief size-wise and industry-wise analysis. The coverage of the selected companies in terms of paid-up capital (PUC) and sales in relation to the companies listed on the Bombay Stock Exchange is around 47 per cent and 63 per cent respectively. A brief review of the performance of private corporate sector over the first two quarters of 2007-08 has also been presented based on abridged financial results of 2342 and 2228 companies, respectively. In addition, it briefly touches upon the performance of 286 non-government financial public limited companies during the first half of 2007-08. Performance of Select 2082 Non-Government Non-Financial Companies during H1:2007-08
Overall Performance The non-government non-financial companies, broadly representing the pri-vate corporate sector, showed lower business activity in the first half of 2007-08 reflecting deceleration in consumer demand, signs of which surfaced from the last quarter of 2006-07. Consequently, profit growth too had declined. The sales growth at 17.4 per cent was lower by 10 percentage points when compared over year ago level (Table1). Gross profits of these companies increased by 28.1 per cent, much lower than 39.8 per cent posted in the corresponding period of previous year. Other income, which is not core to the companies, was up by 63.6 per cent as against 19.3 per cent in H1:2006-07. Gross profits excluding other income was lower by 6.8 percentage points to 21.3 per cent. More importantly, interest outgo in the current period increased by 10.1 per cent vis-a-vis 20.8 per cent rise observed in the previous period. Post-tax profits recorded 31.1 per cent increase, much lower than 41.6 per cent observed in H1: 2006-07. Interest burden (interest payments to gross profits) declined by 1.9 percentage points to 11.9 per cent (Chart 1). Higher contribution from other income helped gross profit margin (gross profits to sales) and net profit margin (profits after tax to sales) to improve by 1.4 percentage points and 1.2 percentage points to 16.9 per cent and 11.7 per cent respectively. Without this contribution, the improvement in the net profit margin would have shrunk to merely 30 basis point
|
Table 1: Performance of 2082 Non-Government Non- Financial Companies, H1: 2007-08
|
Item |
H1 : 2006-07 |
H1: 2007-08 |
Per cent change* |
(Rs. crore) |
(Rs. crore) |
H1: 2006-07# |
H1: 2007-08 |
1 |
2 |
3 |
4 |
5 |
Sales |
4,56,787 |
5,36,358 |
27.4 |
17.4 |
Expenditure |
3,80,701 |
4,45,086 |
25.6 |
16.9 |
Operating Profits $ |
7,60,86 |
91,272 |
43.3 |
20.0 |
Other income |
11,335 |
18,547 |
19.3 |
63.6 |
Depreciation |
16,805 |
19,347 |
16.1 |
15.1 |
Gross profits |
70,616 |
90,472 |
39.8 |
28.1 |
Interest |
9,777 |
10,760 |
20.8 |
10.1 |
Profits before tax |
60,840 |
79,712 |
43.5 |
31.0 |
Tax provision |
12,885 |
16,866 |
51.1 |
30.9 |
Profits after tax |
47,955 |
62,846 |
41.6 |
31.1 |
Paid-up capital |
49,563 |
52,912 |
8.8 |
6.8 |
'*' Over the corresponding period of previous year.
'$' Operating Profits = Sales - Expenditure
'#' Source: Performance of Private Corporate Business Sector during the first half of 2006-07', RBI Bulletin, January 2007 |

Performance according to Size of Paid-up Capital
The analysis of 2082 non-government non-financial companies classified on the basis of Paid-up Capital (PUC) revealed that 566 companies each with PUC of less than Rs.5 crore accounted for 3.3 per cent of the aggregate PUC while 381 companies each with PUC of Rs. 25 crore and above accounted for 73.1 per cent of the aggregate PUC (Table 2). The companies in the 'Rs.5 crore to Rs.10 crore' PUC size class performed remarkably well. These companies posted the highest growth rate in turnover (22.9 per cent), other income (90.7 per cent), interest payments (41.0 per cent) and post tax profits (45.0 per cent). Their net profit margin at 6.8 per cent improved by a percentage point (Table 3).
The differential between sales growth and expenditure growth - indicating profitability at the operating level -was the highest at 210 basis points for companies in the 'Rs.10 crore to Rs.15 crore' class. This coupled with 44.5 per cent rise in other income helped companies in this size class to post 42.3 per cent rise in net profits. The net profit margin improved from 7.6 per cent in H1: 2006-07 to 9.2 per cent in H1: 2007-08. The 381 companies in the top size class recorded 16.6 per cent growth in their income from sales, the lowest growth among all the classes. Their expenditure growth at 16.2 per cent was of marginally low magnitude when compared with that of sales. Helped by significant growth in other income these companies registered 31.2 per cent rise in profits after tax. In contrast to the high growth in interest payments observed across all the size classes, companies in the top size class, in aggregate recorded a very modest rise of 1.6 per cent. However, this low rise is masked by one large company. If it is excluded then interest payments for rest of the companies of this class would increase to 7.9 per cent.
Table 2: Performance of the Select Companies according to the Size of Paid-up Capital, H1: 2007-08 |
Paid-up
Capital
Size Class
(Rs. crore) |
No. of
Compa-
nies |
Paid-up capital |
Per cent change |
Amount
Out-
stand-
ing (Rs.
Crore) |
Per cent
Share |
Sales |
Other
Income |
Total
Expen-
diture |
Depre-
ciation
Provi-
sion |
Gross
Profits |
Interest |
Profits
before
Tax |
Tax
Provi-
sion |
Profits
after
Tax |
1 |
2 |
3 |
4 |
5 |
6 |
7 |
8 |
9 |
10 |
11 |
12 |
13 |
Below 5 |
566 |
1732 |
3.3 |
18.1 |
47.8 |
18.0 |
10.1 |
32.6 |
32.6 |
32.6 |
27.6 |
34.1 |
5 - 10 |
583 |
4073 |
7.7 |
22.9 |
90.7 |
22.3 |
15.2 |
45.1 |
41.0 |
46.5 |
51.9 |
45.0 |
10 - 15 |
309 |
3723 |
7.0 |
18.1 |
44.5 |
16.0 |
21.3 |
38.3 |
32.7 |
39.6 |
30.7 |
42.3 |
15 -25 |
243 |
4693 |
8.9 |
18.4 |
20.9 |
17.9 |
27.0 |
20.6 |
19.1 |
21.0 |
45.2 |
15.2 |
25 and above |
381 |
38,692 |
73.1 |
16.6 |
68.8 |
16.2 |
13.7 |
27.2 |
1.6 |
30.6 |
28.7 |
31.2 |
All Companies |
2,082 |
52,912 |
100.0 |
17.4 |
63.6 |
16.9 |
15.1 |
28.1 |
10.1 |
31.0 |
30.9 |
31.1 |
Table 3: Profit Allocation, Interest-linked and Profitability Ratios according to the Size of Paid-up Capital, H1:2007-08 |
(Per cent) |
Paid-up Capital Size Class(Rs. crore) |
Profit Allocation Ratios |
Interest-linked Ratios |
Profitability Ratios |
Tax Provision to Profits before Tax |
Interest to Gross Profits |
Interest Coverage Ratio (number) |
Interest to Sales |
Gross Profits to Sales |
Profits after Tax to Sales |
H1: |
H1: |
H1: |
H1: |
H1: |
H1: |
H1: |
H1: |
H1: |
H1: |
H1: |
H1: |
2006-07 |
2007-08 |
2006-07 |
2007-08 |
2006-07 |
2007-08 |
2006-07 |
2007-08 |
2006-07 |
2007-08 |
2006-07 |
2007-08 |
1 |
2 |
3 |
4 |
5 |
6 |
7 |
8 |
9 |
10 |
11 |
12 |
13 |
Below 5 |
23.5 |
22.6 |
32.7 |
32.7 |
3.1 |
3.1 |
2.5 |
2.8 |
7.5 |
8.4 |
3.9 |
4.4 |
5 - 10 |
21.8 |
22.6 |
24.7 |
23.9 |
4.1 |
4.2 |
2.4 |
2.8 |
9.8 |
11.6 |
5.8 |
6.8 |
10 - 15 |
23.1 |
21.6 |
18.8 |
18.1 |
5.3 |
5.5 |
2.3 |
2.6 |
12.2 |
14.3 |
7.6 |
9.2 |
15 - 25 |
19.3 |
23.1 |
19.7 |
19.5 |
5.1 |
5.1 |
2.5 |
2.6 |
12.9 |
13.1 |
8.3 |
8.1 |
25 and above |
21.2 |
20.9 |
12.0 |
9.6 |
8.3 |
10.4 |
2.0 |
1.8 |
17.0 |
18.5 |
11.8 |
13.2 |
All Companies |
21.2 |
21.2 |
13.8 |
11.9 |
7.2 |
8.4 |
2.1 |
2.0 |
15.5 |
16.9 |
10.5 |
11.7 |
Performance according to Size of Sales
Barring smaller classes having companies with sales turnover less than Rs. 50 crore, the other size classes based on sales performed well as depicted in robust growth in sales and net profits (Table 4). Significant contribution from other income appeared to have helped margins to improve despite marked increases in depreciation, interest and tax provision. Due to faster momentum in gross profits vis-à-vis interest payments, interest burden became lighter across all the size classes (Table 5). The combined sales of companies with sales between Rs. 500 crore and Rs. 1000 crore grew at 18.0 per cent, stronger by 1.1 percentage points than the expenditure. This differential along with marked growth in other income resulted in notable 36.9 per cent growth in net profits, despite high rise in depreciation provision (15.4 per cent) and interest payments (26.1 per cent). Large companies generated the highest rate of growth in sales (18.2 per cent), contained expenses had low growth in tax and interest payments and generally added to capacities as can be made out from the highest growth in depreciation provision. Moderate rise in interest payments at 4 per cent coupled with steep jump of 64.6 per cent in other income helped companies in this class to post 30.6 per cent growth in post tax profits in H1:2007-08. For these companies, interest burden was lighter by 200 basis points in the current period.
Table 4: Performance of Select Companies according to
Size of Sales, H1:2007-08 |
Sales Size Class(Rs. crore) |
No. of Com panies |
Sales Amount Out stand ing (Rs. crore) |
Per cent Share in Sales |
Per cent change |
Sales |
Other
Income |
Total
Expenditure |
Depre-
ciation Provi sion |
Gross
Profits |
Interest |
Profits
before Tax |
Tax
Provi sion- |
Profits
after Tax |
1 |
2 |
3 |
4 |
5 |
6 |
7 |
8 |
9 |
10 |
11 |
12 |
13 |
Less than 25 |
625 |
2,764 |
0.5 |
-2.0 |
62.0 |
-2.4 |
2.7 |
65.4 |
9.3 |
168.5 |
25.3 |
248.3 |
25 - 50 |
229 |
4,143 |
0.8 |
1.5 |
32.0 |
1.0 |
7.3 |
15.5 |
14.1 |
16.8 |
48.6 |
6.9 |
50-100 |
299 |
10,956 |
2.0 |
15.5 |
32.8 |
14.6 |
12.2 |
30.7 |
16.7 |
41.0 |
19.9 |
50.0 |
100-500 |
574 |
66,413 |
12.4 |
14.7 |
61.6 |
14.8 |
13.9 |
25.0 |
16.7 |
28.4 |
38.0 |
26.0 |
500-1000 |
161 |
58,296 |
10.9 |
18.0 |
72.2 |
16.9 |
15.4 |
35.4 |
26.1 |
37.5 |
40.0 |
36.9 |
1000 and above |
194 |
3,93,786 |
73.4 |
18.2 |
64.6 |
17.8 |
15.7 |
27.5 |
4.0 |
30.3 |
29.4 |
30.6 |
All Companies |
2082 |
5,36,358 |
100.0 |
17.4 |
63.6 |
16.9 |
15.1 |
28.1 |
10.1 |
31.0 |
30.9 |
31.1 |
Table 5: Profit allocation, Interest-linked and Profitability Ratios according to
Size of Sales, H1:2007-08 |
Sales Size Class(Rs. Crore) |
Profit Allocation Ratios |
Interest-linked Ratios |
Profitability Ratios |
Tax Provision to Profits before Tax |
Interest to Gross Profit |
Interest Coverage Ratio (number) |
Interest to Sales |
Gross Profits to Sales |
Profits after Tax to sales |
H1: |
H1: |
H1: |
H1: |
H1: |
H1: |
H1: |
H1: |
H1: |
H1: |
H1: |
H1: |
2006-07 |
2007-08 |
2006-07 |
2007-08 |
2006-07 |
2007-08 |
2006-07 |
2007-08 |
2006-07 |
2007-08 |
2006-07 |
2007-08 |
1 |
2 |
3 |
4 |
5 |
6 |
7 |
8 |
9 |
10 |
11 |
12 |
13 |
Less than 25 |
35.8 |
16.7 |
64.8 |
42.8 |
1.5 |
2.3 |
4.8 |
5.4 |
7.5 |
12.6 |
1.7 |
6.0 |
25 - 50 |
23.6 |
30.1 |
47.0 |
46.4 |
2.1 |
2.2 |
4.2 |
4.7 |
8.9 |
10.1 |
3.6 |
3.8 |
50-100 |
29.8 |
25.3 |
42.4 |
37.8 |
2.4 |
2.6 |
4.3 |
4.4 |
10.2 |
11.5 |
4.1 |
5.3 |
100-500 |
19.7 |
21.2 |
28.9 |
26.9 |
3.5 |
3.7 |
3.4 |
3.4 |
11.7 |
12.8 |
6.7 |
7.4 |
500-1000 |
21.4 |
21.8 |
18.5 |
17.3 |
5.4 |
5.8 |
2.4 |
2.6 |
13.2 |
15.1 |
8.4 |
9.8 |
1000 and above |
21.2 |
21.0 |
10.6 |
8.6 |
9.5 |
11.6 |
1.8 |
1.6 |
16.7 |
18.1 |
11.8 |
13.0 |
All companies |
21.2 |
21.2 |
13.8 |
11.9 |
7.2 |
8.4 |
2.1 |
2.0 |
15.5 |
16.9 |
10.5 |
11.7 |
Industry-wise Performance during H1: 2007-08
Performance of services sector was impressive in terms of growth in revenue as well as post tax profits at 26.4 per cent and 48.4 per cent respectively (Table 6). Net profits would have been much larger at 70.7 per cent had the companies engaged in computer and related activities were excluded. In contrast to services companies, manufacturing companies reported lower growth in sales (15.1 per cent) as well as post tax profits (25.1 per cent). For this sector cost of raw materials, accounting for about 66 per cent of the total expenses, went up by 12.9 per cent, little lower than 14.8 per cent increase observed for total expenditure.
The key indicators of performance across the industries showed considerable variations in their growth rates and ratios during H1:2007-08* . Of the 30 industries analysed, 15 industries posted more than 20 per cent growth in sales while another 6 industries posted less than 10 per cent (Statement 1). Post tax profits of 8 industries increased by more than 50 per cent. Interest payments rose by more than 30 per cent for 9 industries. Interest burden declined for most of the industries barring 5 industries where it moved in opposite direction (Statement 2). Net profit margin for 7 industries contracted whereas for rest of the industries it improved in first half of 2007-08.
Sugar industry continued to incur losses mainly due to lower sales realisations; sales were down by 16.7 per cent while interest payments rose by 31.5 per cent. The edible oil industry showed a remarkable performance in terms of turnover as well as net profits. The turnover growth of 34 per cent, aided further by more than 100 per cent rise in other income, helped these companies to register 78.3 per cent jump in post tax profits in H1:2007-08. For textile companies, expenditure rose at a higher rate of 15.7 per cent than sales at 12.9 per cent. Consequently, net profits of these companies were lower by 20.2 per cent. Fertilizer companies posted moderate growth in sales and expenditure at 6.1 per cent and 5.2 per cent respectively. The lower turnover growth coupled with a fall of 27.7 per cent in other income acted adversely on the gross profit that declined by 2.4 per cent in H1:2007-08 when compared over year ago level. Pharmaceutical and Medicines companies, witnessed higher growth in expenditure relative to sales and yet posted 25.2 per cent increase in net profits mainly on account of 80.1 per cent jump in other income. Net margin for these companies improved by 1.5 percentage points at 17.9 per cent. Iron & steel companies posted 54.0 per cent growth in post tax profits in H1: 2007-08 mainly on account of steep jump in other income (183.7 per cent) and 6.4 per cent fall in interest payments. Interest burden - ratio of interest payments to gross profits - eased by 9.2 percentage points while net margin improved by 230 basis points to 10.8 per cent during the current period. Sales of Machinery and machine tools companies recorded impressive growth of 25.0 per cent while expenditure went up by 24.3 per cent. Other income declined by 6.2 per cent. Higher provisioning for depreciation at 18.7 per cent reflected continuation of investment demand. Performance of Motor vehicles and other transport equipment industry was subdued in the first half of 2007-08 on account of slower consumer demand. The lower turnover growth (8.1 per cent), relatively higher increase in expenditure (9.0 per cent) accompanied by as much as 51.2 per cent rise in interest payments affected the performance of these companies adversely; post tax profits were stagnant at the previous periods level. Interest burden was higher by 2.5 percentage points while net margin at 7.9 per cent shrunk by 60 basis points.
Cement & Cement products companies posted 24.3 per cent increase in turnover. Lower growth in expenditure (20.7 per cent) and a decline of 2.0 per cent in interest payments helped cement companies to post 35.2 per cent growth in net profits. Net profit margin for this group of companies improved by 1.6 percentage points to 19.9 per cent. Net profits of construction companies shot up by 80.0 per cent on the turnover growth of 36.9 per cent mirroring continued expansion in this sector; consequently net profit margin improved by as much as 2.2 percentage points. Hotel & restaurant industry posted 24.6 per cent rise in net profits on the turnover growth of 22.8 per cent. Expenses of electricity generation and supply companies rose at a much faster pace (20.1 per cent) than revenue growth of 14.9 per cent. For companies engaged in computer and related activities, revenue growth at 23.9 per cent was lower than total expenditure growth (26.3 per cent) possibly due to adverse impact of rupee appreciation. Revenue growth of transport, storage & communication industry was much faster at 28.4 per cent than that of expenditure at 23.2 per cent; with steep jump in other income (136.8 per cent) and decline in interest payments (-53.3 per cent), net profits growth shot up to 90.9 per cent
.
Table 6 : Sector-wise Performance of Non-Government Non-Financial Companies
during H1:2007-08 |
Item |
Manufacturing |
Services |
Services Other than Computer and related activities |
Amount (Rs. Crore) |
Per cent change |
Amount (Rs. Crore) |
Per cent change |
Amount (Rs. Crore) |
Per cent change |
No. of Companies |
1,598 |
|
484 |
|
331 |
|
Sales |
4,16,461 |
15.1 |
1,19,897 |
26.4 |
81,606 |
27.7 |
Expenditure |
3,49,068 |
14.8 |
96,018 |
25.2 |
66,893 |
24.7 |
Of which |
|
|
|
|
|
|
Cost of raw Materials |
230,419 |
12.9 |
23,881 |
55.4 |
21,955 |
64.3 |
Staff Cost |
20,204 |
16.6 |
20,896 |
25.1 |
5,571 |
32.7 |
Operating Profits $ |
67,393 |
16.2 |
23,879 |
31.9 |
14,713 |
43.3 |
Other income |
12,831 |
51.6 |
5,715 |
98.9 |
3,718 |
77.7 |
Depreciation |
13,760 |
10.9 |
5,588 |
27.1 |
4,182 |
28.1 |
Gross Profits |
66,465 |
23.0 |
24,006 |
44.8 |
14,249 |
56.6 |
Interest |
8,520 |
10.3 |
2,240 |
9.2 |
2,006 |
4.6 |
Profits before tax |
57,946 |
25.1 |
21,766 |
49.9 |
12,243 |
70.5 |
Tax Provision |
13,358 |
25.3 |
3,508 |
58.0 |
2,409 |
69.9 |
Profits after tax |
44,587 |
25.1 |
18,258 |
48.4 |
9,834 |
70.7 |
Paid-up capital |
37,357 |
5.7 |
15,555 |
9.3 |
11,516 |
9.2 |
'$' Operating Profits = Sales - Expenditure |
Major Components of Expenditure, H1: 2007-08
Consumption of Raw Materials
Consumption of raw materials of 1624 reporting companies, during H1: 2007-08, increased at a lower rate of 13.8 per cent compared to the 15.9 per cent growth observed in total expenditure (Table 7). Consequently, share of consumption of raw materials in total expenditure at 64.9 per cent declined by 1.1 percentage points. During the second quarter consumption of raw materials rose at a much lower pace of 10.6 per cent than the total expenditure at 14.8 per cent reflecting lower input cost.
Table 7: Consumption of Raw Materials during H1: 2007-08 |
(Amount in Rs. crore) |
Item |
Q1 |
Q2 |
H1 |
|
2006-07 |
2007-08 |
2006-07 |
2007-08 |
2006-07 |
2007-08 |
1 |
2 |
3 |
4 |
5 |
6 |
7 |
No. of Companies Consumption |
1,826 |
|
|
1,713 |
1,624 |
|
of raw materials (CRM) |
1,17,342 |
1,38,758 |
1,21,087 |
1,33,918 |
2,194,02 |
2,49,779 |
|
|
(18.3) |
|
(10.6) |
|
(13.8) |
Total expenditure |
1,72,080 |
2,03,019 |
1,86,925 |
2,14,515 |
3,32,242 |
3,85,046 |
|
|
(18.0) |
|
(14.8) |
|
(15.9) |
CRM as percentage |
|
|
|
|
|
|
of total expenditure |
68.2 |
68.4 |
64.8 |
62.4 |
66.0 |
64.9 |
Note: Figures in brackets denote percentage change over the corresponding period of the previous year.
|
Table 8: Staff Cost during H1: 2007-08 |
(Amount in Rs. crore) |
Item |
Q1 |
|
Q2 |
|
H1 |
2006-07 |
2007-08 |
2006-07 |
2007-08 |
2006-07 |
2007-08 |
1 |
2 |
3 |
4 |
5 |
6 |
7 |
No. of Companies |
|
2,122 |
|
2,017 |
|
1,899 |
Staff cost |
17,665 |
21,607 |
1,9,084 |
22,923 |
33,968 |
41,078 |
|
|
(22.3) |
|
(20.1) |
|
(20.9) |
Total expenditure |
1,93,652 |
2,30,954 |
2,11,943 |
244,780 |
3,76,709 |
4,40,165 |
|
|
(19.3) |
|
(15.5) |
|
(16.8) |
Staff cost as percentage |
|
|
|
|
|
|
of total Expenditure |
9.1 |
9.4 |
9.0 |
9.4 |
9.0 |
9.3 |
Note: Figures in brackets denote percentage change over the corresponding period of the previous year. |
Staff Cost
Staff cost of reported companies went up by 20.9 per cent in the current period; higher by 4.1 percentage points than the increase in total expenditure and formed 9.3 per cent of the total expenditure (Table 8). Staff cost rose at a lower pace of 20.1 per cent during second quarter as against 22.3 per cent observed in the first quarter.
Change in Stock-in-trade
Stock-in-trade at Rs.7,090 crore during H1:2007-08 against Rs.8,719 crore observed in the previous period reflected depletion in the stock of traded goods by 18.7 per cent. Change in stock-in-trade formed 1.5 percent of sales, which was 2.2 per cent in H1: 2006-07 (Table 9). Over the quarters, first quarter witnessed sizeable reduction to the extent of 15.9 per cent in the stock of traded goods in comparison to marginal decline of 1.6 per cent in the second quarter.
Performance over the Quarters of 2007-08
Sales growth at 16.0 per cent in second quarter was lower than 19.2 per cent observed in Q1: 2007-08 (Table10, Chart 2). Expenditure growth, however, was contained as the major components viz., raw materials and staff cost moved quarter. Interest payments increased by at a slow pace when compared with first 18.4 per cent in Q2 as against 4.4 per cent 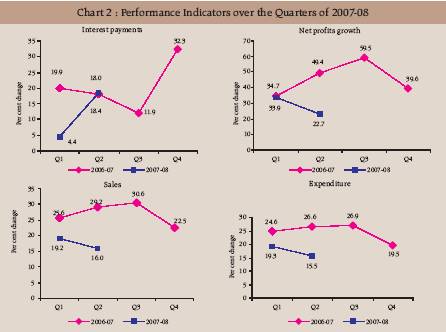

in Q1. Post tax profits were up by 22.7 per cent in Q2:2007-08 ; lower by 11.2 percentage points when compared over first quarter. Industry-wise, sales growth in mining and quarrying industry jumped from 12.4 per cent in Q1 to 42.1 per cent in Q2 that translated into 136.4 per cent growth in net profits in Q2 (Statement 3, 4 & 5, Charts 3,4,5,6). Textile companies that posted moderate growth in net profits in the first quarter witnessed sizeable fall of 46.3 per cent in Q2. Fertilizer companies posted marginal increase in sales (2.0 per cent) in Q2 against a dip in sales in Q1. Iron and steel companies growth in post tax profits receded to 30.4 per cent in the second quarter from 84.7 per cent observed in the first quarter. For machinery and machine tools industry, sales growth was lower at 22.7 per cent against 26.4 per cent in Q1. In the case of motor vehicles and other transport equipments industry, the slowdown in consumer demand was well reflected through deceleration in sales growth from 10.4 per cent in Q1 to 6.7 per cent in Q2:2007-08. These companies posted nominal growth in net profits in both the quarters. Construction companies' post tax profits growth receded from 111.9 per cent to 52.1 per cent in Q2:2007-08. Though second quarter was better in terms of revenue growth for companies engaged in computer and related activities, net profit growth was lower at 13.8 per cent (31.8 per cent in Q1). 

Table 9: Increase in Stock-in-trade during H1: 2007-08 |
(Amount in Rs. crore) |
Item |
Q1 |
Q2 |
H1 |
|
2006-07 |
2007-08 |
2006-07 |
2007-08 |
2006-07 |
2007-08 |
1 |
2 |
3 |
4 |
5 |
6 |
7 |
No. of Companies |
1755 |
|
|
1675 |
|
1571 |
Stock-in-trade |
5,427 |
4,683 |
2,962 |
2,916 |
8,719 |
7,090 |
|
|
(-15.9) |
|
(-1.6) |
|
(-18.7) |
Sales |
2,03,156 |
2,39,240 |
2,22,246 |
2,55,108 |
3,96,063 |
4,58,811 |
|
|
(17.8) |
|
(14.8) |
|
(15.8) |
Stock-in -trade as |
|
|
|
|
|
|
percentage of sales |
2.7 |
2.0 |
1.6 |
1.4 |
2.2 |
1.5 |
Note: Figures in brackets denote percentage change over the corresponding period of the previous year. |
Table 10: Performance of the Select Companies over the Quarters of 2007-08 |
Item |
2006-07 |
2007-08 |
Q1 |
Q2 |
Q3 |
Q4 |
Q1 |
Q2 |
1 |
2 |
3 |
4 |
5 |
6 |
7 |
No. of Companies |
2,228 |
2,263 |
2,258 |
2,356 |
2,342 |
2,228 |
Growth rate in Per cent: |
|
|
|
|
|
|
Sales |
25.6 |
29.2 |
30.3 |
22.5 |
19.2 |
16.0 |
Total expenditure |
24.6 |
26.6 |
26.9 |
19.5 |
19.3 |
15.5 |
Depreciation |
14.9 |
16.4 |
16.8 |
18.1 |
18.1 |
15.8 |
Gross profits |
33.9 |
45.9 |
51.8 |
39.2 |
28.6 |
22.1 |
Interest payments |
19.9 |
18.0 |
11.9 |
32.3 |
4.4 |
18.4 |
Profits after tax |
34.7 |
49.4 |
59.5 |
39.6 |
33.9 |
22.7 |
Ratio in Per cent |
|
|
|
|
|
|
Gross Profits to Sales |
15.6 |
15.9 |
15.8 |
15.3 |
16.7 |
16.6 |
Profits After Tax to Sales |
10.6 |
11.0 |
11.0 |
10.6 |
11.6 |
11.5 |
Interest to Sales |
2.2 |
2.0 |
2.0 |
2.0 |
2.0 |
2.1 |
Interest to Gross Profits |
13.9 |
12.8 |
12.5 |
13.0 |
11.7 |
12.6 |
Interest Coverage (Times) |
7.2 |
7.8 |
8.0 |
7.7 |
8.5 |
7.9 |
Memo Items (Rs. crore) |
|
|
|
|
|
|
Sales |
2,34,610 |
2,51,125 |
2,60,064 |
2,94,223 |
2,80,814 |
2,97,110 |
Expenditure |
1,95,556 |
2,09,437 |
2,16,053 |
2,48,740 |
2,34,596 |
2,47,425 |
Depreciation provision |
8,449 |
8,892 |
9,172 |
10,338 |
10,173 |
10,576 |
Gross profits |
36,567 |
40,041 |
41,169 |
45,108 |
46,925 |
49,228 |
Interest Payments |
5,083 |
5,121 |
5,162 |
5,862 |
5,504 |
6,194 |
Profits after tax |
24,845 |
27,710 |
28,698 |
31,251 |
32,699 |
34,266 |
Performance of Non-Government Financial Companies
In line with the buoyancy in the asset markets in the recent period, financial companies recorded sharp growth of 44.8 per cent and 59.7 per cent in income from operations and post tax profits. Performance of financial companies in the second quarter continued to be impressive as in the first quarter. Income from operations increased by 39.4 per cent and 41.7 per cent in the first and second quarter of 2007-08, respectively. Interest expenses growth at 59.2 per cent in Q1 slid to 47.8 per cent in Q2. Post tax profit growth at 56.4 per cent in Q2 was however lower by 1.9 percentage points when compared over Q1. 
Table 11: Performance of Non-Goverment Financial Companies, 2007-08 |
(Amount in Rs. crore) |
Item |
Q1 : 2007-08 |
Q2 : 2007-08 |
H1 : 2007-08 |
|
Amount(Rs. crore) |
Per cent Change |
Amount(Rs. crore) |
Per cent Change |
Amount (Rs. crore) |
Per cent Change |
1 |
2 |
3 |
4 |
5 |
6 |
7 |
No. of Companies |
256 |
|
284 |
|
286 |
|
Income from operations |
5,876 |
39.4 |
6,882 |
41.7 |
14078 |
44.8 |
Other income |
125 |
72.2 |
466 |
295.2 |
623 |
184.0 |
Expenditure |
2,346 |
17.0 |
2,937 |
37.2 |
5,983 |
33.5 |
Interest |
2,224 |
59.2 |
2,387 |
47.8 |
5,067 |
55.2 |
Gross profits |
3,601 |
60.6 |
4,319 |
56.1 |
8,531 |
60.1 |
Depreciation |
55 |
36.4 |
92 |
37.2 |
187 |
41.9 |
Profits before tax |
1,376 |
62.8 |
1,932 |
67.8 |
3,465 |
67.8 |
Tax provision |
307 |
80.8 |
473 |
116.1 |
833 |
100.0 |
Profits after tax |
1,069 |
58.3 |
1,459 |
56.4 |
2,631 |
59.7 |
Paid-up capital |
2,841 |
4.6 |
3,044 |
5.9 |
3,346 |
6.3 |
Per cent change is over the corresponding period of the previous year |
Statement 1: Industry-wise Growth Rates of Select Performance Indicators, H1:2007-08 |
Industry / Industry group |
No. of
compa-
nies |
Paid-up Capital |
Per cent change |
Amount
(Rs.
crore) |
Per
cent
Share |
Sales |
Other
Income |
Expen-
diture |
Depre-
ciation |
Gross
Profits |
Inter-
est |
Profits
before
Tax |
Tax
provi-
sion |
Profits
after
Tax |
1. |
Tea plantation |
17 |
162 |
0.3 |
5.0 |
-45.8 |
6.7 |
9.1 |
-25.1 |
80.8 |
-35.1 |
26.2 |
-41.1 |
2. |
Mining and quarrying |
35 |
452 |
0.9 |
24.6 |
25.7 |
23.4 |
-1.3 |
34.1 |
33.2 |
34.2 |
25.4 |
38.3 |
3. |
Food products and beverages |
|
|
|
|
|
|
|
|
|
|
|
|
|
Of which |
147 |
2,067 |
3.9 |
23.4 |
12.2 |
24.6 |
21.1 |
10.9 |
39.4 |
3.6 |
21.1 |
-2.1 |
|
i. Sugar |
21 |
442 |
0.8 |
-16.7 |
-48.3 |
-1.2 |
11.3 |
$ |
31.5 |
$ |
$ |
$ |
|
ii. Edible oils |
44 |
363 |
0.7 |
34.0 |
120.0 |
33.2 |
13.6 |
72.9 |
40.5 |
85.1 |
110.2 |
78.3 |
|
iii. Other food products & |
|
|
|
|
|
|
|
|
|
|
|
|
|
beverages |
82 |
1262 |
2.4 |
25.4 |
61.7 |
23.5 |
27.6 |
42.3 |
41.2 |
42.6 |
42.2 |
42.8 |
4. |
Textiles |
255 |
4,818 |
9.1 |
12.9 |
60.8 |
15.7 |
17.3 |
-2.5 |
27.2 |
-19.1 |
-14.2 |
-20.2 |
5. |
Paper and paper products |
35 |
483 |
0.9 |
11.6 |
111.8 |
9.9 |
18.7 |
29.8 |
27.8 |
30.5 |
44.4 |
26.8 |
6. |
Chemicals and chemical products |
|
|
|
|
|
|
|
|
|
|
|
|
|
Of which |
309 |
7,111 |
13.4 |
10.5 |
46.5 |
10.4 |
10.7 |
20.8 |
8.3 |
22.6 |
24.0 |
22.3 |
|
i. Basic industrial chemicals |
78 |
1,173 |
2.2 |
12.4 |
88.3 |
10.4 |
23.6 |
36.2 |
3.4 |
48.3 |
32.2 |
52.4 |
|
ii. Chemical fertilizers and |
|
|
|
|
|
|
|
|
|
|
|
|
|
pesticides |
34 |
1,946 |
3.7 |
6.1 |
-27.7 |
5.2 |
8.7 |
-2.4 |
-2.1 |
-2.4 |
14.1 |
-7.2 |
|
iii. Paints and varnishes |
12 |
279 |
0.5 |
12.4 |
80.9 |
11.9 |
3.1 |
24.7 |
19.6 |
24.9 |
23.1 |
25.6 |
|
iv. Pharmaceuticals |
|
|
|
|
|
|
|
|
|
|
|
|
|
and medicines |
112 |
2,008 |
3.8 |
15.1 |
80.1 |
16.6 |
15.4 |
25.7 |
16.5 |
26.5 |
34.4 |
25.2 |
|
v. Other chemical & |
|
|
|
|
|
|
|
|
|
|
|
|
|
chemical products |
73 |
1,704 |
3.2 |
5.4 |
67.0 |
5.4 |
-5.8 |
23.6 |
19.3 |
24.3 |
8.2 |
28.4 |
7. |
Rubber and plastic products |
98 |
1,153 |
2.2 |
14.3 |
23.1 |
10.1 |
8.0 |
81.5 |
22.1 |
153.2 |
271.1 |
128.8 |
8. |
Cement and cement products |
33 |
2,041 |
3.9 |
24.3 |
6.1 |
20.7 |
26.3 |
31.6 |
-2.0 |
35.2 |
35.3 |
35.2 |
9. |
Iron and steel |
105 |
6,150 |
11.6 |
21.7 |
183.7 |
20.9 |
16.5 |
39.4 |
-6.4 |
57.3 |
65.4 |
54.0 |
10. |
Fabricated metal products except |
|
|
|
|
|
|
|
|
|
|
|
|
|
machinery and equipment |
29 |
338 |
0.6 |
15.9 |
94.4 |
17.7 |
36.9 |
15.7 |
-2.0 |
20.1 |
21.9 |
19.5 |
11. |
Machinery and machine tools |
113 |
1,290 |
2.4 |
25.0 |
-6.2 |
24.3 |
18.7 |
21.8 |
25.3 |
21.5 |
21.1 |
21.6 |
12. |
Electrical machinery |
|
|
|
|
|
|
|
|
|
|
|
|
|
and apparatus |
83 |
1,158 |
2.2 |
28.3 |
2.4 |
25.9 |
16.6 |
43.5 |
29.7 |
46.0 |
68.2 |
38.4 |
13. |
Radio, television and |
|
|
|
|
|
|
|
|
|
|
|
|
|
communication equipments |
40 |
992 |
1.9 |
2.3 |
-13.8 |
2.7 |
-10.2 |
|
-28 |
38.5 |
24.8 |
44.7 |
14. |
Medical precision and other |
|
|
|
|
|
|
|
|
|
|
|
|
|
scientific instruments |
17 |
186 |
0.4 |
37.9 |
46.7 |
36.6 |
24.7 |
56.8 |
15.9 |
64.4 |
195.4 |
33.4 |
15. |
Motor vehicles and other |
|
|
|
|
|
|
|
|
|
|
|
|
|
transport equipments |
79 |
1,938 |
3.7 |
8.1 |
3.9 |
9.0 |
12.7 |
-0.5 |
51.2 |
-3.1 |
-11.2 |
|
16. |
Jewellery and related articles |
23 |
288 |
0.5 |
21.7 |
19.9 |
21.5 |
3.5 |
25.6 |
7.7 |
34.3 |
51.9 |
31.0 |
17. |
Diversified |
14 |
514 |
1.0 |
20.9 |
286.2 |
15.5 |
20.7 |
82.7 |
27.3 |
88.9 |
84.9 |
90.3 |
18. |
Electricity generation and supply |
7 |
1,199 |
2.3 |
14.9 |
79.2 |
20.1 |
-4.8 |
23.5 |
6.4 |
29.0 |
9.7 |
32.2 |
19. |
Construction |
63 |
1,547 |
2.9 |
36.9 |
53.6 |
31.9 |
34.6 |
75.8 |
54.3 |
81.0 |
83.4 |
80.0 |
20. |
Wholesale and retail trade |
94 |
734 |
1.4 |
24.0 |
56.3 |
23.0 |
25.0 |
50.9 |
33.3 |
62.4 |
34.6 |
70.5 |
21. |
Hotel and restaurant |
44 |
644 |
1.2 |
22.8 |
-11.7 |
17.6 |
4.2 |
29.0 |
18.8 |
31.8 |
52.8 |
24.6 |
22. |
Transport, storage and |
|
|
|
|
|
|
|
|
|
|
|
|
|
communication |
29 |
5,632 |
10.6 |
28.4 |
136.8 |
23.2 |
37.3 |
65.1 |
-53.3 |
91.7 |
97.1 |
90.9 |
23. |
Computer and related activities |
153 |
4,039 |
7.6 |
23.9 |
155.4 |
26.3 |
24.2 |
30.5 |
75.1 |
29.6 |
37.0 |
28.7 |
24. |
Petroleum refinery |
13 |
2,824 |
5.3 |
10.4 |
51.3 |
8.5 |
-2.6 |
29.0 |
-6.8 |
32.3 |
34.6 |
31.9 |
|
All companies |
2082 |
52,912 |
100.0 |
17.4 |
63.6 |
16.9 |
15.1 |
28.1 |
10.1 |
31.0 |
30.9 |
31.1 |
'$' : Numerator negative. ‘’: Nil/Negligible |
Statement 2: Industry-wise Profit Allocation, Interest-linked and Profitability Ratios, H1:2007-08 |
(Per cent) |
Industry / Industry group |
Profit Allocation Ratio |
Interest-linked ratio |
Profitability Ratio |
Tax Provision to profits before Tax |
Interest to Gross profits |
Interest Coverage Ratio(Number) |
Interest to Sales |
Gross Profits to Sales |
Profits after Tax to Sales |
H1: |
H1: |
H1: |
H1: |
H1: |
H1: |
H1: |
H1: |
H1: |
H1: |
H1: |
H1: |
2006- |
2007- |
2006- |
2007- |
2006- |
2007- |
2006- |
2007- |
2006- |
2007- |
2006- |
2007- |
07 |
08 |
07 |
08 |
07 |
08 |
07 |
08 |
07 |
08 |
07 |
08 |
1 |
2 |
3 |
4 |
5 |
6 |
7 |
8 |
9 |
10 |
11 |
12 |
13 |
1. |
Tea plantation |
9.0 |
17.4 |
8.6 |
20.8 |
11.6 |
4.8 |
2.9 |
5.0 |
33.7 |
24.0 |
28.0 |
15.7 |
2. |
Mining and quarrying |
31.9 |
29.8 |
10.9 |
10.8 |
9.2 |
9.2 |
2.3 |
2.5 |
21.1 |
22.7 |
12.8 |
14.2 |
3. |
Food products and beverages |
|
|
|
|
|
|
|
|
|
|
|
|
|
Of which |
24.4 |
28.6 |
20.4 |
25.7 |
4.9 |
3.9 |
1.9 |
2.2 |
9.4 |
8.5 |
5.7 |
4.5 |
|
ii. Sugar |
19.1 |
$ |
15.4 |
$ |
6.5 |
-0.6 |
2.6 |
4.2 |
17.1 |
-2.7 |
11.7 |
-6.6 |
|
iii. Edible oils |
21.1 |
24.0 |
27.2 |
22.1 |
3.7 |
4.5 |
0.9 |
0.9 |
3.3 |
4.2 |
1.9 |
2.5 |
|
iv. Other food products |
|
|
|
|
|
|
|
|
|
|
|
|
|
& beverages |
27.1 |
27.0 |
20.8 |
20.6 |
4.8 |
4.9 |
2.6 |
2.9 |
12.4 |
14.1 |
7.2 |
8.2 |
4. |
Textiles |
18.0 |
19.1 |
35.9 |
46.8 |
2.8 |
2.1 |
3.8 |
4.3 |
10.7 |
9.2 |
5.6 |
4.0 |
5. |
Paper and paper products |
20.8 |
23.0 |
23.9 |
23.6 |
4.2 |
4.2 |
2.9 |
3.3 |
12.1 |
14.1 |
7.3 |
8.3 |
6. |
Chemicals and chemical products |
|
|
|
|
|
|
|
|
|
|
|
|
|
Of which |
18.1 |
18.3 |
12.7 |
11.4 |
7.8 |
8.8 |
2.0 |
2.0 |
15.8 |
17.2 |
11.3 |
12.5 |
|
i. Basic industrial chemicals |
20.2 |
18.0 |
26.9 |
20.4 |
3.7 |
4.9 |
3.6 |
3.3 |
13.2 |
16.1 |
7.7 |
10.5 |
|
ii. Chemical fertilizers |
|
|
|
|
|
|
|
|
|
|
|
|
|
and pesticides |
22.2 |
26.0 |
18.5 |
18.5 |
5.4 |
5.4 |
2.7 |
2.5 |
14.7 |
13.5 |
9.3 |
8.1 |
|
iii. Paints and varnishes |
30.9 |
30.4 |
2.8 |
2.7 |
35.3 |
36.8 |
0.4 |
0.4 |
12.6 |
14.0 |
8.5 |
9.5 |
|
iv. Pharmaceuticals |
|
|
|
|
|
|
|
|
|
|
|
|
|
and medicines |
14.1 |
15.0 |
7.7 |
7.1 |
13.0 |
14.0 |
1.6 |
1.6 |
20.7 |
22.6 |
16.4 |
17.9 |
|
v. Other chemical & |
|
|
|
|
|
|
|
|
|
|
|
|
|
chemical products |
20.3 |
17.7 |
13.7 |
13.2 |
7.3 |
7.6 |
1.5 |
1.7 |
10.9 |
12.8 |
7.5 |
9.2 |
7. |
Rubber and plastic products |
17.2 |
25.2 |
54.7 |
36.8 |
1.8 |
2.7 |
3.4 |
3.6 |
6.1 |
9.8 |
2.3 |
4.6 |
8. |
Cement and cement products |
24.2 |
24.2 |
9.7 |
7.2 |
10.3 |
13.8 |
2.6 |
2.0 |
26.8 |
28.3 |
18.3 |
19.9 |
9. |
Iron and steel |
28.8 |
30.2 |
28.0 |
18.8 |
3.6 |
5.3 |
4.7 |
3.6 |
16.6 |
19.1 |
8.5 |
10.8 |
10. Fabricated metal products except |
|
|
|
|
|
|
|
|
|
|
|
|
|
machinery and equipment |
25.5 |
25.9 |
20.2 |
17.1 |
4.9 |
5.8 |
3.5 |
3.0 |
17.3 |
17.3 |
10.3 |
10.6 |
11. Machinery and machine tools |
24.4 |
24.3 |
8.5 |
8.7 |
11.8 |
11.5 |
1.2 |
1.2 |
13.6 |
13.3 |
9.4 |
9.2 |
12. Electrical machinery and apparatus |
25.3 |
29.2 |
15.1 |
13.7 |
6.6 |
7.3 |
1.8 |
1.8 |
11.8 |
13.2 |
7.5 |
8.1 |
13. Radio, television and |
|
|
|
|
|
|
|
|
|
|
|
|
|
communication equipments |
31.0 |
28.0 |
58.0 |
41.7 |
1.7 |
2.4 |
4.0 |
2.8 |
6.8 |
6.7 |
2.0 |
2.8 |
14. Medical precision and other |
|
|
|
|
|
|
|
|
|
|
|
|
|
scientific instruments |
19.1 |
34.3 |
15.6 |
11.6 |
6.4 |
8.7 |
1.2 |
1.0 |
7.9 |
9.0 |
5.4 |
5.2 |
15. Motor vehicles and other |
|
|
|
|
|
|
|
|
|
|
|
|
|
transport equipments |
27.5 |
25.2 |
4.7 |
7.2 |
21.2 |
13.9 |
0.6 |
0.8 |
12.3 |
11.3 |
8.5 |
7.9 |
16. Jewellery and related articles |
16.1 |
18.2 |
32.9 |
28.2 |
3.0 |
3.5 |
2.1 |
1.9 |
6.5 |
6.7 |
3.7 |
4.0 |
17. Diversified |
25.8 |
25.3 |
10.1 |
7.0 |
9.9 |
14.2 |
1.8 |
1.9 |
17.9 |
27.1 |
12.0 |
18.8 |
18. Electricity generation and supply |
14.2 |
12.1 |
24.1 |
20.8 |
4.2 |
4.8 |
5.3 |
4.9 |
22.0 |
23.6 |
14.3 |
16.4 |
19. Construction |
27.8 |
28.2 |
19.4 |
17.1 |
5.1 |
5.9 |
2.4 |
2.7 |
12.2 |
15.7 |
7.1 |
9.3 |
20. Wholesale and retail trade |
22.4 |
18.5 |
39.5 |
34.9 |
2.5 |
2.9 |
1.8 |
1.9 |
4.5 |
5.5 |
2.1 |
2.9 |
21. Hotel and restaurant |
25.7 |
29.7 |
21.4 |
19.7 |
4.7 |
5.1 |
6.7 |
6.5 |
31.2 |
32.8 |
18.2 |
18.5 |
22. Transport, storage and |
|
|
|
|
|
|
|
|
|
|
|
|
|
communication |
13.6 |
14.0 |
18.3 |
5.2 |
5.5 |
19.3 |
3.4 |
1.2 |
18.6 |
23.9 |
13.1 |
19.5 |
23. Computer and related activities |
10.9 |
11.5 |
1.8 |
2.4 |
56.0 |
41.7 |
0.4 |
0.6 |
24.2 |
25.5 |
21.2 |
22.0 |
24. Petroleum refinery |
12.4 |
12.6 |
8.4 |
6.0 |
12.0 |
16.6 |
1.0 |
0.9 |
12.5 |
14.6 |
10.0 |
12.0 |
|
All companies |
21.2 |
21.2 |
13.8 |
11.9 |
7.2 |
8.4 |
2.1 |
2.0 |
15.5 |
16.9 |
10.5 |
11.7 |
'$' : Numerator negative. |
Statement 3: Industry-wise Growth Rates of Select Performance Indicators over the quarters of 2007-08 |
(Per cent) |
Industry / Industry group |
Number of companies |
Sales |
Total Expenditure |
Gross Profits |
Profits after Tax |
Q1 |
Q2 |
H1 |
Q1 |
Q2 |
H1 |
Q1 |
Q2 |
H1 |
Q1 |
Q2 |
H1 |
Q1 |
Q2 |
H1 |
1 |
2 |
3 |
4 |
5 |
6 |
7 |
8 |
9 |
10 |
11 |
12 |
13 |
14 |
15 |
16 |
1. |
Tea plantation |
24 |
21 |
17 |
4.2 |
4.4 |
5.0 |
4.3 |
8.6 |
6.7 |
18.7 |
-33.5 |
-25.1 |
-0.3 |
-43.4 |
-41.1 |
2. |
Mining and quarrying |
38 |
35 |
35 |
12.4 |
42.1 |
24.6 |
16.1 |
31.9 |
23.4 |
4.3 |
101.3 |
34.1 |
0.9 |
136.4 |
38.3 |
3. |
Food products and beverages |
|
|
|
|
|
|
|
|
|
|
|
|
|
|
|
|
Of which |
169 |
156 |
147 |
21.9 |
18.4 |
23.4 |
28.2 |
19.8 |
24.6 |
-33.3 |
11.9 |
10.9 |
-69.1 |
-5.7 |
-2.1 |
|
i. Sugar |
34 |
26 |
21 |
-11.9 |
-14.0 |
-16.7 |
11.5 |
1.5 |
-1.2 |
$ |
$ |
$ |
$ |
$ |
$ |
|
ii. Edible oils |
50 |
45 |
44 |
54.1 |
23.7 |
34.0 |
53.1 |
22.5 |
33.2 |
101.9 |
45 |
72.9 |
122.2 |
30.6 |
78.3 |
|
iii. Other food products |
|
|
|
|
|
|
|
|
|
|
|
|
|
|
|
|
& beverages |
85 |
85 |
82 |
21.6 |
24.8 |
25.4 |
19.1 |
23.5 |
23.5 |
41.8 |
40.3 |
42.3 |
39.3 |
42.4 |
42.8 |
4. |
Textiles |
278 |
267 |
255 |
12.9 |
12.3 |
12.9 |
14.8 |
14.8 |
15.7 |
18.9 |
-20.4 |
-2.5 |
15.7 |
-46.3 |
-20.2 |
5. |
Paper and paper products |
41 |
36 |
35 |
12.7 |
8.4 |
11.6 |
12.7 |
5.7 |
9.9 |
20.0 |
26.4 |
29.8 |
19.2 |
24.3 |
26.8 |
6. |
Chemicals and chemical products |
|
|
|
|
|
|
|
|
|
|
|
|
|
|
|
|
Of which |
367 |
339 |
309 |
8.0 |
10.9 |
10.5 |
7.1 |
10.2 |
10.4 |
19.8 |
18.1 |
20.8 |
25.2 |
17.8 |
22.3 |
|
i. Basic industrial chemicals |
95 |
85 |
78 |
13.7 |
12.0 |
12.4 |
14.8 |
8.8 |
10.4 |
21.0 |
43.9 |
36.2 |
31.7 |
62.6 |
52.4 |
|
ii. Chemical fertilizers and |
|
|
|
|
|
|
|
|
|
|
|
|
|
|
|
|
pesticides |
38 |
35 |
34 |
-6.3 |
2.0 |
6.1 |
-8.5 |
0.0 |
5.2 |
-23.7 |
23.5 |
-2.4 |
-31.4 |
29.2 |
-7.2 |
|
iii. Paints and varnishes |
14 |
13 |
12 |
14.7 |
11.5 |
12.4 |
13.7 |
9.0 |
11.9 |
31.5 |
40.3 |
24.7 |
51.6 |
44.9 |
25.6 |
|
iv. Pharmaceuticals and medicines |
129 |
121 |
112 |
12.9 |
17.4 |
15.1 |
13.6 |
20.1 |
16.6 |
29.5 |
16.2 |
25.7 |
32.4 |
13.6 |
25.2 |
|
v. Other chemical & chemical |
|
|
|
|
|
|
|
|
|
|
|
|
|
|
|
|
products |
91 |
85 |
73 |
7.3 |
10.5 |
5.4 |
5.6 |
9.9 |
5.4 |
30.4 |
5.3 |
23.6 |
37.3 |
4.5 |
28.4 |
7. |
Rubber and plastic products |
110 |
105 |
98 |
16.0 |
12.8 |
14.3 |
11.7 |
8.8 |
10.1 |
94.6 |
75.7 |
81.5 |
148.3 |
115.2 |
128.8 |
8. |
Cement and cement products |
39 |
39 |
33 |
24.4 |
20.9 |
24.3 |
24.8 |
16.2 |
20.7 |
37.0 |
35.6 |
31.6 |
49.1 |
40.7 |
35.2 |
9. |
Iron and steel |
109 |
110 |
105 |
25.2 |
18.0 |
21.7 |
27.4 |
17.7 |
20.9 |
45.3 |
24.7 |
39.4 |
84.7 |
30.4 |
54 |
10. |
Fabricated metal products |
|
|
|
|
|
|
|
|
|
|
|
|
|
|
|
|
except machinery and |
|
|
|
|
|
|
|
|
|
|
|
|
|
|
|
|
equipment |
32 |
31 |
29 |
19.3 |
16.3 |
15.9 |
22.0 |
16.8 |
17.7 |
23.2 |
11.2 |
15.7 |
34.4 |
9.5 |
19.5 |
11. |
Machinery and machine tools |
134 |
127 |
113 |
26.4 |
22.7 |
25.0 |
26.4 |
21.0 |
24.3 |
45.7 |
6.6 |
21.8 |
48.2 |
2.2 |
21.6 |
12. |
Electrical machinery |
|
|
|
|
|
|
|
|
|
|
|
|
|
|
|
|
and apparatus |
92 |
87 |
83 |
31.8 |
25.8 |
28.3 |
29.6 |
23.4 |
25.9 |
33.3 |
43.5 |
43.5 |
22.1 |
40.2 |
38.4 |
13. |
Radio, television and |
|
|
|
|
|
|
|
|
|
|
|
|
|
|
|
|
communication equipments |
40 |
42 |
40 |
10.6 |
-8.2 |
2.3 |
10.4 |
-6.2 |
2.7 |
41.6 |
-34.6 |
-- |
362.4 |
-49.5 |
44.7 |
14. |
Medical precision and other |
|
|
|
|
|
|
|
|
|
|
|
|
|
|
|
|
scientific instruments |
20 |
17 |
17 |
57.9 |
33.9 |
37.9 |
60.2 |
32.3 |
36.6 |
58.3 |
54.2 |
56.8 |
44.3 |
38.2 |
33.4 |
15. |
Motor vehicles and other |
|
|
|
|
|
|
|
|
|
|
|
|
|
|
|
|
transport equipments |
85 |
82 |
79 |
10.4 |
6.7 |
8.1 |
11.4 |
7.2 |
9.0 |
4.2 |
-1.0 |
-0.5 |
1.2 |
1.4 |
-- |
16. |
Jewellery and related articles |
24 |
23 |
23 |
19.0 |
24.2 |
21.7 |
17.8 |
24.7 |
21.5 |
42.8 |
14.2 |
25.6 |
58.4 |
15.6 |
31.0 |
17. |
Diversified |
16 |
15 |
14 |
22.6 |
20.0 |
20.9 |
18.0 |
14.6 |
15.5 |
39.0 |
123.1 |
82.7 |
38.4 |
135.6 |
90.3 |
18. |
Electricity generation and supply |
9 |
7 |
7 |
19.2 |
10.5 |
14.9 |
29.4 |
12.9 |
20.1 |
17.0 |
28.5 |
23.5 |
26.9 |
37.5 |
32.2 |
19. |
Construction |
70 |
65 |
63 |
36.6 |
38.3 |
36.9 |
30.2 |
35.1 |
31.9 |
100.3 |
53.8 |
75.8 |
111.9 |
52.1 |
80.0 |
20. |
Wholesale and retail trade |
102 |
99 |
94 |
22.1 |
16.1 |
24.0 |
21.6 |
15.0 |
23.0 |
30.8 |
51.8 |
50.9 |
35.4 |
66.6 |
70.5 |
21. |
Hotel and restaurant |
45 |
43 |
44 |
22.9 |
22.5 |
22.8 |
20.5 |
15.5 |
17.6 |
8.3 |
51.2 |
29.0 |
3.2 |
56.0 |
24.6 |
22. |
Transport, storage and |
|
|
|
|
|
|
|
|
|
|
|
|
|
|
|
|
communication |
33 |
32 |
29 |
31.5 |
25.5 |
28.4 |
27.6 |
18.9 |
23.2 |
67.6 |
63.2 |
65.1 |
102.2 |
81.0 |
90.9 |
23. |
Computer and related activities |
166 |
164 |
153 |
25.8 |
36.3 |
23.9 |
27.3 |
42.2 |
26.3 |
28.6 |
17.0 |
30.5 |
31.8 |
13.8 |
28.7 |
24. |
Petroleum refinery |
14 |
13 |
13 |
15.0 |
7.2 |
10.4 |
13.6 |
5.3 |
8.5 |
28.3 |
25.9 |
29.0 |
29.5 |
29.0 |
31.9 |
|
All companies+ |
2342 |
2228 |
2082 |
19.2 |
16.0 |
17.4 |
19.3 |
15.5 |
16.9 |
28.6 |
22.1 |
28.1 |
33.9 |
22.7 |
31.1 |
$: Numerator negative; +: All companies under study. '-'Nil/Negligible |
Statement 4: Industry-wise
Interest-linked Ratios over the Quarters of 2007-08 |
(Per cent) |
Industry / Industry group |
Interest Gross Profits |
Interest to Sales |
Q1 |
Q2 |
H1 |
Q1 |
Q2 |
H1 |
2006- |
2007- |
2006- |
2007- |
2006- |
2007- |
2006- |
2007- |
2006- |
2007- |
2006- |
2007- |
07 |
08 |
07 |
08 |
07 |
08 |
07 |
08 |
07 |
08 |
07 |
08 |
1 |
2 |
3 |
4 |
5 |
6 |
7 |
8 |
9 |
10 |
11 |
12 |
13 |
1. |
Tea plantation |
17.5 |
28.1 |
8.2 |
16.6 |
8.6 |
20.8 |
3.1 |
5.8 |
3.8 |
4.8 |
2.9 |
5.0 |
2. |
Mining and quarrying |
8.2 |
11.8 |
20.0 |
12.1 |
10.9 |
10.8 |
2.1 |
2.8 |
3.2 |
2.8 |
2.3 |
2.5 |
3. |
Food products and beverages |
|
|
|
|
|
|
|
|
|
|
|
|
|
Of which |
18.1 |
44.9 |
24.5 |
31.2 |
20.4 |
25.7 |
2.0 |
2.7 |
2.1 |
2.5 |
1.9 |
2.2 |
|
i. Sugar |
13.1 |
$.0 |
39.8 |
$ |
15.4 |
$ |
2.3 |
5.7 |
3.7 |
6.4 |
2.6 |
4.2 |
|
ii. Edible oils |
34.1 |
25.7 |
22.4 |
19.5 |
27.2 |
22.1 |
1.0 |
1.0 |
0.9 |
0.9 |
0.9 |
0.9 |
|
iii. Other food products & |
|
|
|
|
|
|
|
|
|
|
|
|
|
beverages |
20.3 |
19.5 |
21.2 |
21.7 |
20.8 |
20.6 |
2.6 |
2.9 |
2.6 |
2.9 |
2.6 |
2.9 |
4. |
Textiles |
42.3 |
47.0 |
29.9 |
48.4 |
35.9 |
46.8 |
3.9 |
4.6 |
3.6 |
4.2 |
3.8 |
4.3 |
5. |
Paper and paper products |
26.1 |
28.8 |
23.3 |
22.7 |
23.9 |
23.6 |
3.1 |
3.6 |
3.1 |
3.5 |
2.9 |
3.3 |
6. |
Chemicals and chemical |
|
|
|
|
|
|
|
|
|
|
|
|
|
products |
|
|
|
|
|
|
|
|
|
|
|
|
|
Of which |
14.4 |
10.8 |
11.7 |
11.4 |
12.7 |
11.4 |
2.2 |
1.8 |
1.8 |
1.9 |
2.0 |
2.0 |
|
i. Basic industrial chemicals |
25.9 |
23.1 |
26.6 |
20.0 |
26.9 |
20.4 |
3.7 |
3.5 |
3.4 |
3.3 |
3.6 |
3.3 |
|
ii. Chemical fertilizers and |
|
|
|
|
|
|
|
|
|
|
|
|
|
pesticides |
28.7 |
26.0 |
24.1 |
24 |
18.5 |
18.5 |
4.8 |
3.5 |
2.4 |
2.9 |
2.7 |
2.5 |
|
iii. Paints and varnishes |
10.0 |
4.9 |
6.6 |
4.7 |
2.8 |
2.7 |
1.1 |
0.6 |
0.7 |
0.6 |
0.4 |
0.4 |
|
iv. Pharmaceuticals and medicines |
8.2 |
6.7 |
7.1 |
7.0 |
7.7 |
7.1 |
1.6 |
1.5 |
1.6 |
1.6 |
1.6 |
1.6 |
|
v. Other chemical & chemical |
|
|
|
|
|
|
|
|
|
|
|
|
|
products |
10.1 |
7.2 |
7.8 |
8.3 |
13.7 |
13.2 |
1.3 |
1.1 |
1.1 |
1.2 |
1.5 |
1.7 |
7. |
Rubber and plastic products |
52.0 |
32.5 |
54.1 |
36.8 |
54.7 |
36.8 |
2.8 |
3.0 |
3.4 |
3.6 |
3.4 |
3.6 |
8. |
Cement and cement products |
8.2 |
4.2 |
9.6 |
6.2 |
9.7 |
7.2 |
2.6 |
1.5 |
2.4 |
1.7 |
2.6 |
2.0 |
9. |
Iron and steel |
31.7 |
19.5 |
25.2 |
21.4 |
28.0 |
18.8 |
5.1 |
3.6 |
4.3 |
3.8 |
4.7 |
3.6 |
10. |
Fabricated metal products |
|
|
|
|
|
|
|
|
|
|
|
|
|
except machinery and |
|
|
|
|
|
|
|
|
|
|
|
|
|
equipment |
22.4 |
16.1 |
17.9 |
18.6 |
20.2 |
17.1 |
3.6 |
2.7 |
3.1 |
3.1 |
3.5 |
3.0 |
11. |
Machinery and machine tools |
12.5 |
9.9 |
7.9 |
8.8 |
8.5 |
8.7 |
1.5 |
1.3 |
1.2 |
1.1 |
1.2 |
1.2 |
12. |
Electrical machinery and apparatus |
14.0 |
14.6 |
15.2 |
13.7 |
15.1 |
13.7 |
1.8 |
1.9 |
1.8 |
1.9 |
1.8 |
1.8 |
13. |
Radio, television and |
|
|
|
|
|
|
|
|
|
|
|
|
|
communication equipments |
77.6 |
42.3 |
56.4 |
69.9 |
58.0 |
41.7 |
4.3 |
3.0 |
4.2 |
3.7 |
4.0 |
2.8 |
14. |
Medical precision and other |
|
|
|
|
|
|
|
|
|
|
|
|
|
scientific instruments |
-1.1 |
-0.6 |
11.3 |
8.7 |
15.6 |
11.6 |
-0.1 |
0.0 |
1.1 |
0.9 |
1.2 |
1.0 |
15. |
Motor vehicles and other |
|
|
|
|
|
|
|
|
|
|
|
|
|
transport equipments |
5.2 |
7.7 |
5.2 |
7.7 |
4.7 |
7.2 |
0.6 |
0.9 |
0.6 |
0.9 |
0.6 |
0.8 |
16. |
Jewellery and related articles |
36.5 |
28.9 |
30.5 |
27.5 |
32.9 |
28.2 |
2.1 |
2.0 |
2.2 |
1.8 |
2.1 |
1.9 |
17. |
Diversified |
11.5 |
10.9 |
10.3 |
6.2 |
10.1 |
7.0 |
2.1 |
2.3 |
1.8 |
2 |
1.8 |
1.9 |
18. |
Electricity generation and supply |
25.7 |
23.5 |
22.8 |
19 |
24.1 |
20.8 |
5.4 |
4.9 |
5.2 |
5 |
5.3 |
4.9 |
19. |
Construction |
19.9 |
15.2 |
20.4 |
20.4 |
19.4 |
17.1 |
2.3 |
2.6 |
2.6 |
2.9 |
2.4 |
2.7 |
20. |
Wholesale and retail trade |
37.9 |
36.4 |
38.4 |
36 |
39.5 |
34.9 |
1.9 |
1.9 |
1.7 |
2.1 |
1.8 |
1.9 |
21. |
Hotel and restaurant |
18.2 |
19.2 |
24.8 |
20.2 |
21.4 |
19.7 |
6.7 |
6.2 |
6.7 |
6.7 |
6.7 |
6.5 |
22. |
Transport, storage and |
|
|
|
|
|
|
|
|
|
|
|
|
|
communication |
18.5 |
-0.9 |
18.0 |
11.2 |
18.3 |
5.2 |
3.5 |
-0.2 |
3.3 |
2.7 |
3.4 |
1.2 |
23. |
Computer and related activities |
2.0 |
2.2 |
1.5 |
2.8 |
1.8 |
2.4 |
0.5 |
0.6 |
0.4 |
0.7 |
0.4 |
0.6 |
24. |
Petroleum refinery |
8.3 |
7.1 |
8.0 |
5.5 |
8.4 |
6.0 |
1.1 |
1.0 |
1.0 |
0.8 |
1.0 |
0.9 |
|
All companies+ |
14.5 |
11.7 |
13.0 |
12.6 |
13.8 |
11.9 |
2.2 |
2.0 |
2.0 |
2.1 |
2.1 |
2.0 |
$: Numerator Negative; '+': All companies under study. |
Statement 5: Industry-wise Profitability Ratios over the Quarters of 2007-08 |
(Per cent) |
Industry / Industry group |
|
Gross Profits to Sales |
|
|
Profits after Tax to Sales |
|
Q1 |
|
Q2 |
H1 |
|
Q1 |
|
Q2 |
|
H1 |
|
2006- |
2007- |
2006- |
2007- |
2006- |
2007- |
2006- |
2007- |
2006- |
2007- |
2006- |
2007- |
07 |
08 |
07 |
08 |
07 |
08 |
07 |
08 |
07 |
08 |
07 |
08 |
1 |
2 |
3 |
4 |
5 |
6 |
7 |
8 |
9 |
10 |
11 |
12 |
13 |
1. |
Tea plantation |
17.9 |
20.5 |
45.8 |
29.2 |
33.7 |
24.0 |
12.5 |
11.9 |
39.7 |
21.5 |
28.0 |
15.7 |
2. |
Mining and quarrying |
25.5 |
23.6 |
16.2 |
23.0 |
21.1 |
22.7 |
16.0 |
14.4 |
8.7 |
14.5 |
12.8 |
14.2 |
3. |
Food products and |
|
|
|
|
|
|
|
|
|
|
|
|
|
beverages |
11.1 |
6.1 |
8.5 |
8.0 |
9.4 |
8.5 |
7.1 |
1.8 |
4.9 |
3.9 |
5.7 |
4.5 |
|
Of which |
|
|
|
|
|
|
|
|
|
|
|
|
|
i. Sugar |
17.7 |
-6.5 |
9.4 |
-3.6 |
17.1 |
-2.7 |
12.7 |
-11.7 |
4.5 |
-9.6 |
11.7 |
-6.6 |
|
ii. Edible oils |
2.8 |
3.7 |
3.9 |
4.5 |
3.3 |
4.2 |
1.5 |
2.1 |
2.6 |
2.7 |
1.9 |
2.5 |
|
iii. Other food products |
|
|
|
|
|
|
|
|
|
|
|
|
|
& beverages |
12.6 |
14.7 |
12.1 |
13.6 |
12.4 |
14.1 |
7.3 |
8.4 |
7.0 |
8.0 |
7.2 |
8.2 |
4. |
Textiles |
9.2 |
9.7 |
12.2 |
8.7 |
10.7 |
9.2 |
4.1 |
4.2 |
7.4 |
3.5 |
5.6 |
4.0 |
5. |
Paper and paper products |
11.8 |
12.6 |
13.3 |
15.5 |
12.1 |
14.1 |
6.8 |
7.2 |
8.4 |
9.6 |
7.3 |
8.3 |
6. |
Chemicals and chemical products |
15.3 |
17.0 |
15.6 |
16.6 |
15.8 |
17.2 |
10.5 |
12.2 |
11.2 |
11.9 |
11.3 |
12.5 |
|
Of which |
|
|
|
|
|
|
|
|
|
|
|
|
|
i. Basic industrial
chemicals |
14.3 |
15.2 |
12.9 |
16.5 |
13.2 |
16.1 |
8.2 |
9.5 |
7.5 |
10.9 |
7.7 |
10.5 |
|
ii. Chemical fertilizers and |
|
|
|
|
|
|
|
|
|
|
|
|
|
pesticides |
16.8 |
13.7 |
10.0 |
12.1 |
14.7 |
13.5 |
9.7 |
7.1 |
5.1 |
6.5 |
9.3 |
8.1 |
|
iii. Paints and varnishes |
10.5 |
12.0 |
11.0 |
13.9 |
12.6 |
14.0 |
6.3 |
8.3 |
7.0 |
9.1 |
8.5 |
9.5 |
|
iv. Pharmaceuticals and medicines |
19.4 |
22.3 |
22.6 |
22.4 |
20.7 |
22.6 |
15.2 |
17.8 |
18.1 |
17.5 |
16.4 |
17.9 |
|
v. Other chemical & chemical |
|
|
|
|
|
|
|
|
|
|
|
|
|
products |
12.5 |
15.2 |
14.5 |
13.9 |
10.9 |
12.8 |
8.6 |
10.9 |
11.0 |
10.4 |
7.5 |
9.2 |
7. |
Rubber and plastic products |
5.5 |
9.2 |
6.3 |
9.8 |
6.1 |
9.8 |
2.1 |
4.6 |
2.4 |
4.6 |
2.3 |
4.6 |
8. |
Cement and cement products |
31.3 |
34.5 |
24.6 |
27.6 |
26.8 |
28.3 |
21.9 |
26.3 |
17.0 |
19.7 |
18.3 |
19.9 |
9. |
Iron and steel |
16.1 |
18.6 |
17.0 |
17.9 |
16.6 |
19.1 |
7.5 |
11.1 |
9.3 |
10.3 |
8.5 |
10.8 |
10. |
Fabricated metal products except |
|
|
|
|
|
|
|
|
|
|
|
|
|
machinery and equipment |
16.2 |
16.7 |
17.6 |
16.8 |
17.3 |
17.3 |
9.4 |
10.6 |
10.9 |
10.3 |
10.3 |
10.6 |
11. |
Machinery and machine tools |
11.6 |
13.4 |
14.9 |
12.9 |
13.6 |
13.3 |
7.3 |
8.6 |
10.4 |
8.7 |
9.4 |
9.2 |
12. |
Electrical machinery and apparatus |
13.0 |
13.1 |
11.9 |
13.5 |
11.8 |
13.2 |
8.6 |
8.0 |
7.5 |
8.4 |
7.5 |
8.1 |
13. |
Radio, television and |
|
|
|
|
|
|
|
|
|
|
|
|
|
communication equipments |
5.6 |
7.1 |
7.5 |
5.3 |
6.8 |
6.7 |
0.7 |
3.0 |
2.4 |
1.3 |
2.0 |
2.8 |
14. |
Medical precision and other |
|
|
|
|
|
|
|
|
|
|
|
|
|
scientific instruments |
6.6 |
6.6 |
9.5 |
10.9 |
7.9 |
9.0 |
4.8 |
4.4 |
6.7 |
6.9 |
5.4 |
5.2 |
15. |
Motor vehicles and other transport |
|
|
|
|
|
|
|
|
|
|
|
|
|
equipments |
12.1 |
11.4 |
12.4 |
11.5 |
12.3 |
11.3 |
8.3 |
7.6 |
8.4 |
8.0 |
8.5 |
7.9 |
16. |
Jewellery and related articles |
5.9 |
7.0 |
7.1 |
6.5 |
6.5 |
6.7 |
3.1 |
4.1 |
4.2 |
3.9 |
3.7 |
4.0 |
17. |
Diversified |
18.4 |
20.8 |
17.3 |
32.1 |
17.9 |
27.1 |
12.0 |
13.6 |
11.5 |
22.6 |
12.0 |
18.8 |
18. |
Electricity generation and supply |
21.1 |
20.8 |
22.7 |
26.4 |
22.0 |
23.6 |
13.1 |
14.0 |
15.3 |
19.1 |
14.3 |
16.4 |
19. |
Construction |
11.6 |
17.0 |
12.7 |
14.1 |
12.2 |
15.7 |
6.7 |
10.4 |
7.3 |
8.0 |
7.1 |
9.3 |
20. |
Wholesale and retail trade |
5.0 |
5.3 |
4.4 |
5.8 |
4.5 |
5.5 |
2.5 |
2.8 |
2.1 |
3.1 |
2.1 |
2.9 |
21. |
Hotel and restaurant |
36.7 |
32.3 |
26.9 |
33.2 |
31.2 |
32.8 |
21.8 |
18.3 |
14.9 |
18.9 |
18.2 |
18.5 |
22. |
Transport, storage and |
|
|
|
|
|
|
|
|
|
|
|
|
|
communication |
18.8 |
23.9 |
18.3 |
23.8 |
18.6 |
23.9 |
13.2 |
20.3 |
13.0 |
18.7 |
13.1 |
19.5 |
23. Computer and related activities |
24.9 |
25.5 |
27.2 |
23.3 |
24.2 |
25.5 |
21.4 |
22.4 |
23.7 |
19.8 |
21.2 |
22.0 |
24. Petroleum refinery |
12.7 |
14.2 |
12.2 |
14.3 |
12.5 |
14.6 |
10.2 |
11.5 |
9.8 |
11.8 |
10.0 |
12.0 |
|
All companies+ |
15.5 |
16.7 |
15.7 |
16.6 |
15.5 |
16.9 |
10.4 |
11.6 |
10.9 |
11.5 |
10.5 |
11.7 |
+: All companies under study. |
* Prepared in the Corporate Studies Division of the Department of Statistical Analysis and Computer Services. The previous study "Performance of Private Corporate Business Sector during the first half of 2006-07" was published in the January 2007 issue of the RBI Bulletin. * For the companies where the information on major industrial activity was not available in the abridged financial results, information is compiled from other sources such as previous annual reports, stock exchanges and capital market newsletters, etc. |


