RbiSearchHeader

Press escape key to go back

Past Searches

Theme
Theme
Text Size
Text Size
S3

RbiAnnouncementWeb

RBI Announcements
RBI Announcements

Asset Publisher

99419688

Private Corporate Investment: Performance and Near-term Outlook

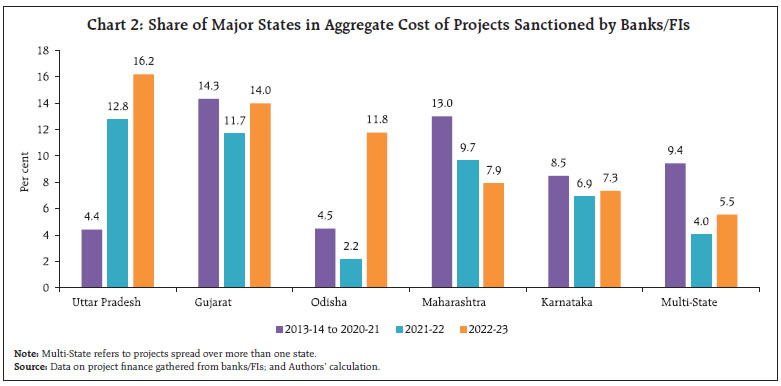
by Shreya Bhan^, Rajendra N Chavhan^ and Rajesh B Kavediya^

The near-term outlook for private investment activity in India is gauged from project investment proposals of the private corporate sector. A sustained pick-up in bank credit in recent period, rising capacity utilisation, improved business outlook and demand conditions and various government policy initiatives to support investment activities provided a conducive environment for the private corporates to undertake fresh capital all-India investment. The envisaged total cost of the projects financed by banks/financial institutions reached a new peak during 2022-23 since 2014-15. Of the total capital investment during 2022-23, about 40 per cent is expected to be spent in 2023-24. A long-term analysis points to the usefulness of investment intentions of private corporates as an early indicator of the assessment of private capex.

Introduction

Generally, investment and consumption remained the major drivers of India’s growth story. After experiencing a slowdown in investment since 2013-14, early signs of revival in the capex cycle, particularly of the private corporate sector, was seen since 2021-22, supported by the capital expenditure push by the Government. The improvement in capacity utilisation of the manufacturing sector, pick-up in credit demand, improving demand conditions and consumer sentiment bode well for the capex cycle. Cleaning up of balance sheets by both corporates and banks provides scope to increase lending activities. Capital expenditure (capex) of the private corporate sector serves as a leading indicator that reflects the investment climate within the economy. This underscores the importance to evaluate the potential for economic expansion by conducting a thorough analysis of the private investment outlook. Given the time lag in releasing the yearly financial statements by corporations, relying solely on a balance sheet-based investment assessment may not be an effective approach for setting up a forward-looking investment outlook for prospective planning. In many economies, survey-based approach is commonly employed as an alternative source to gather data on intended corporate investment plans and investment sentiment. These surveys provide valuable insights into the current investment climate and the anticipated investment intentions that are expected to materialise in the near to medium-term.

India too, since the late 1980s, regularly collects the information on project finance data of private corporates from the select banks/financial institutions (FIs)1 for the assessment and forecasting/nowcasting of private investment. The Reserve Bank has been tracking capex plans of the private corporate sector through the projects that are funded by banks/FIs for providing an outlook on investment2.

The article is structured into six sections. Section II sets out the methodology and its limitations. Important features of projects sanctioned or contracted during the period of review (i.e., 2022-23), funding thereof, and distributional aspects in terms of regions and industries are presented in Section III. Section IV deals with the phasing profile of the sanctioned/contracted loans/financing and estimates growth of corporate investment. Analysis of envisaged capital expenditure and gross fixed capital formation of private corporates is presented in section V, while section VI concludes the study.

II. Methodology and Limitations

For the assessment of the near-term outlook of investment activity of private corporates, the methodology proposed by Rangarajan (1970)3 has been adopted. For this purpose, data on investment intentions were gathered through three different sources, viz., (i) banks and FIs which are involved in the business of project finance to private corporates, (ii) finances raised for capex purpose through the external commercial borrowings (ECBs) [including issuance of foreign currency convertible bonds (FCCBs)), rupee denominated bonds (RDBs)], and (iii) initial public offerings (IPOs), follow-on public offerings (FPOs) and rights issues during a year by the private corporates for capex purpose.

To avoid double counting and consequent overestimation of capital investment, meticulous efforts have been made to ensure that each project is included in the dataset only once. This is achieved by utilising internal databases of the Reserve Bank and incorporating information supplied by the Securities and Exchange Board of India (SEBI), even when a project is funded through multiple sources. This study focuses exclusively on projects that receive funding from the aforementioned sources, having a project cost exceeding ₹10 crore, and majority ownership stake of project with private corporates. Projects having majority stakeholding with the Central and/or State governments, and projects initiated by trusts and educational institutions are excluded from the scope of this study.

The estimates are derived under the assumption that companies adhere to their ex-ante capital expenditure plans. However, it is important to note that these estimates differ from the actual private corporates fixed investment figures reported in the National Accounts Statistics (NAS), as some planned intentions may not materialise into realised investments in terms of their amount and timing, and that certain projects may be funded through internal resources as well as through the fund raised from capital market/ bond financing and foreign direct investment (FDI), which are not being captured in the project finance data collected by the RBI.

III. Characteristics of Projects Sanctioned/Contracted

The investment outlook of private corporates, as reflected in terms of the total number of projects as well as the total project cost, which got sanctioned by banks/FIs, continued to show improvement during 2022-23. About 547 projects got assistance from banks/FIs during 2022-23 with a record high total project cost of ₹2,66,547 crore, compared to 401 projects having a total project cost of ₹1,41,976 crore during 2021-22 (Annex Table A1).

During 2022-23, 393 companies, which did not avail of any financing from banks/FIs for capex projects, raised ₹82,448 crore through ECBs, while 42 other companies raised ₹3,629 crore through domestic equity issues under the IPO route for funding their capex needs. Overall, investment plans of 982 projects were made during 2022-23, with record capital outlay of ₹3,52,624 crore – higher than the level seen since 2014-15, as against 791 projects in 2021-22 with investment intentions of ₹1,96,445 crore (Annex Table A1-A4).

i) Size-wise

The size-wise distribution of projects showed a noticeable increase in the number of projects across various sizes. There were eight mega projects (with project cost ₹5,000 crore & above) and 68 large projects (₹1000 crore-₹5000 crore), sanctioned by banks/FIs during 2022-23, having share of 27.1 per cent and 41.3 per cent of total project costs, respectively. The phasing plan of mega/large projects may have a bearing on the capex in the longer-term (Annex Table A5).

ii) Purpose-wise

Purpose-wise pattern of projects indicates that investment in green field (new) projects accounted for the largest share of 93.1 per cent in the total cost of projects financed by banks/FIs during 2022-23, in line with the trend seen in the past. A marginal share of 6.1 per cent of total project cost was directed towards expansion and modernisation (Annex Table A6).

iii) Industry-wise

The infrastructure sector, comprising (a) power, (b) telecom, (c) ports and airports, (d) storage and water management, (e) special economic zone (SEZ), industrial, biotech and IT park, and (f) roads & bridges, remained the major sector accounting for 60 per cent share in the total cost of projects during 2022-23 (Annex Table A7). Within the infrastructure sector, roads & bridges held a significant share in the total project cost, supported by government’s push towards infrastructure projects through “Bharatmala4” initiative. Besides the infrastructure sector, major industries like metal & metal products, construction, textile, and food products accounted for the sizable share in the total cost of projects envisaged during 2022-23, with a notable increase in its share by metal & metal products as compared with the previous year (Chart 1).

iv) State-wise

The location of projects depends upon a range of factors, including the accessibility to raw materials, the nature of the project, the availability of skilled labour, the presence of adequate infrastructure, the size of the market, the growth potential, the availability of suppliers, and the demand for the products. For the analysis purpose, in this article, the projects which are spread across multiple states have been classified as “multi-state” projects. The state-wise distribution revealed that the top five states viz., Uttar Pradesh, Gujarat, Odisha, Maharashtra and Karnataka, together account for 57.2 per cent share in total project cost during 2022-23, higher than 43.2 per cent share during 2021-22 (Chart 2 and Annex Table A8). In 2022-23, Uttar Pradesh accounted for the highest share (16.2 per cent) in the total cost of projects sanctioned by banks/FIs, followed by Gujarat, Odisha, Maharashtra and Karnataka. The share of Uttar Pradesh and Odisha in the total cost of projects improved significantly from the previous year as well as the average share recorded during the period 2013-14 to 2020-21.

Chart 1: Share of Major Industries in Aggregate Cost of Projects Sanctioned by Banks/FIs

Chart 2: Share of Major States in Aggregate Cost of Projects Sanctioned by Banks/FIs

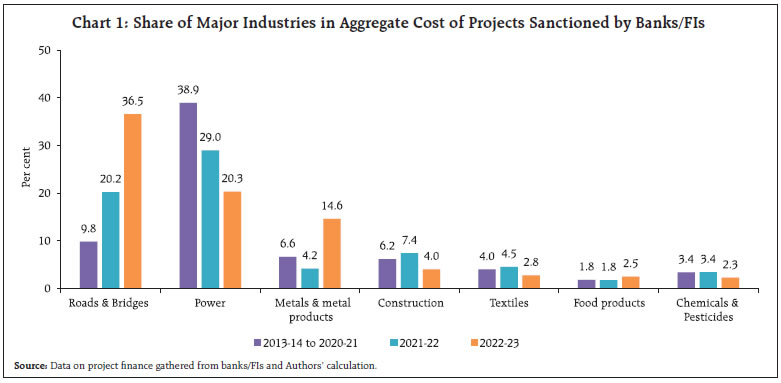
IV. Phasing Profile of Investment Intentions

Phasing profile of capital expenditure of projects sanctioned by banks/FIs during the current year and the previous years provides near-term (one year ahead) investment outlook of private corporates. The phasing from the cohort of projects in 2022-23 indicates that about 33.0 per cent (₹87,997 crore) of the total proposed capital expenditure was expected to be spent in the same year, while 34.7 per cent (₹92,539 crore) is likely to be spent in 2023-24 and another 24.8 per cent (₹66,071 crore) in the subsequent period. Of the total cost of projects sanctioned in 2022-23, 7.5 per cent of the amount was already spent prior to 2022-23. From the planned capital expenditure based on the projects sanctioned by banks/FIs till 2022-23, the capex envisaged in 2022-23 recorded an increase of 9.8 per cent to ₹1,58,903 crore during 2022-23 over the previous year (Annex Table A1).

Resources raised through the ECB and IPO route by private corporates supplement the financing of their investment activities. From the fund raised through ECB route for capex purpose, capital expenditure planned to be incurred during 2022-23 declined by 3.0 per cent over the previous year to ₹58,186 crore. The capital market (equity route) enabled the financing of envisaged capex of ₹2,560 crore in 2022-23, higher than the previous year (Annex Tables A2 and A3), though its share in total envisaged capital expenditure remained miniscule.

Overall, a total capital investment of ₹2,19,649 crore through the various channels of funding, as alluded to earlier, was expected to be made by the private corporate sector in 2022-23, recording an increase of 6.7 per cent from the planned phasing of the previous year, primarily led by a rise in capex projects financed by banks/FIs more than offsetting the decline in capital investment through ECB. The phasing profile of the envisaged capex, based on the pipeline projects5 sanctioned by the banks/ FIs in the previous years prior to the reference year, increased from ₹70,906 crore in 2022-23 to ₹1,17,182 crore in 2023-24; while based on all channels of financing together, it stood at ₹1,71,568 crore in 2023-24 as against ₹94,876 crore in 2022-23 (Annex Tables A1 and A4).

V. Investment Intentions and GFCF of Private Corporates

Envisaged capital investment, based on the project finance data through all sources, tracks the growth of gross fixed capital formation (GFCF) at current prices by private corporates well, barring episodic occasions of divergence in direction (Chart 3).

However, over the period, the ratio of envisaged capex to GFCF of private corporates (as per NAS data) declined significantly - the average share declined from 40.5 per cent during 1971-72 to 2010-11 to 15.5 per cent during 2011-12 to 2021-22. Deleveraging of corporate balance sheet, rising use of internal sources of funds and funds raised through other sources such as FDI, resulted in lower dependence of private corporates on banks/FIs for funding their capital investment, which has been mirrored in the decline in the ratio of envisaged capex to GFCF of private corporates. Despite a decline in the ratio, envisaged capital investment still remains useful as an early indicator for assessing private capital investment cycle (Box 1).

Chart 3: Investment Intentions and GFCF ofPrivate Corporates

Box 1: Envisaged Capex and GFCF of Private Corporates

To study empirically the existence of a long-run relationship as well as the short-run dynamics between the envisaged capital investment (based on project finance data) and GFCF of private corporates (based on NAS data), Autoregressive Distributed Lag (ARDL) approach (Pesaran and Shin,19986) to cointegration is employed. Lagged gross value added (GVA) growth is used to control the acceleration effect. Besides, other macro variables such as non-food bank credit growth and weighted average lending rate were also used in the estimation framework.

Bound test confirmed the existence of a long-term relationship between the envisaged capital investment and GFCF of private corporates. The long-term relationship suggests that a one per cent increase in investment intentions may lead to 48 bps increase in the GFCF of private corporates. Additionally, the coefficient of error correction term – the speed of adjustment or convergence towards long-run equilibrium – suggests that disequilibrium from the past year will be corrected at a faster speed, but in an oscillating manner.

Table 1: Envisaged Capex and GFCF of Private Corporates
  Coefficient t-stat p-value
Selected Model* ARDL(1,3,3,1,0)      
Long-term relationship: Dependent variable – Growth in GFCF of private corporates
Envisaged Capex 0.48 3.74 0.00
GVA growth 2.98 3.96  
Non-food credit growth 0.82 2.23 0.04
Real WALR# -0.83 -0.93 0.37
constant -35.6 -2.36 0.03
Error Correction (-1) -1.24 -12.68 0.00
Adj R2 0.89    
Bound test (F stat) 20.71    
Lower and Upper Bound Critical Values 10%
[2.46, 3.46]
5%
[2.95, 4.09]
1%
[4.09, 5.53]
Serial correlation LM-test F-stat (p-value) 2.21 (0.14)   J-B statistics
0.85 (0.65)
Heteroskedasticity-
BPG test
F-stat (p-value)
0.72 (0.73)
*: lag length is selected using Schwarz criterion.
#: Adjusted with WPI inflation.

Despite a decline in the ratio of envisaged capex, as gathered from the project finance data, empirical analysis still suggests that it provides the early indication about the private capex cycle.

VI. Conclusion

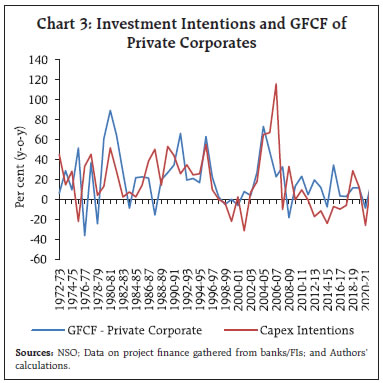
The Government’s thrust on capex, besides various policy initiatives to revive the investment cycle, and improved economic outlook provided a conducive environment for the private corporates to undertake fresh capital investment. The envisaged capital investments of private corporates, based on the projects sanctioned by banks/FIs, increased for the second consecutive year after remaining subdued during 2019-20 and 2020-21. The total cost of projects sanctioned by banks/FIs during 2022-23 increased to a record high of ₹2,66,547 crore. The infrastructure sector continued to attract maximum capex projects, led by ‘Road & Bridges’ and ‘Power’ sectors, reflecting the Government’s push towards infrastructure development. Of the total cost of projects, around 35 per cent is likely to be spent during 2023-24 and about 25 per cent in the subsequent period. The phasing profile of the envisaged capex, based on the pipeline projects finance through all three channels, suggests that the envisaged capex increased significantly to ₹1,71,568 crore in 2023-24 as against ₹94,876 crore in 2022-23. Further, empirical analysis underscored the usefulness of envisaged capital investment (ex-ante phasing plan) as an early indicator for assessing the near-term private corporate investment outlook.

Improved capacity utilisation, pick-up in credit demand, and improved business expectations, as reflected in forward-looking enterprise surveys conducted by the RBI and also by other agencies, are pointing towards reinvigoration of investment activity in the Indian economy in the period ahead.

On the downside, the higher cost of capital owing to tightening of monetary policy by various central banks including India, global uncertainty led by geo-political tensions, and risk of slowdown in major advanced economies could hamper investment activities. Overall, the investment cycle appears to be poised to gain momentum going ahead, but, its sustainability needs to be watched closely.

Table A1: Phasing of Capex of Projects Sanctioned by Banks/FIs
Year of sanction ↓ No of Proj ects Project Cost in the Year of Sanction
(in ₹ crore)
Project Cost due to Revision/ Cancellation^
(in ₹ crore)
2013- 14 2014- 15 2015- 16 2016- 17 2017- 18 2018- 19 2019- 20 2020- 21 2021- 22 2022- 23 2023- 24 Bey ond 2023-24
  1 2 3 4 5 6 7 8 9 10 11 12 13 14 15
upto 2013-14       1,70,603 93,658 34,172 14,421 4,722 1,472            
2014-15 326 87,601 87,253 14,822 34,589 25,765 9,535 1,246 162 1,036          
      (0.4)                        
2015-16 346 95,371 91,781 3,787 7,434 37,517 28,628 8,079 4,964 1,152 220        
      (3.8)                        
2016-17 541 1,82,807 1,79,249 1,352 3,952 25,388 71,186 41,075 21,643 8,566 4,001 2,086      
      (2.0)                        
2017-18 485 1,72,831 1,68,239   620 15,184 12,445 63,001 41,436 22,767 10,202 2,342 242    
      (2.6)                        
2018-19 409 1,76,581 1,59,189     569 6,862 11,000 59,973 47,080 21,248 9,759 2,663 35  
      (9.8)                        
2019-20 320 2,00,038 1,75,830         4,049 14,524 53,978 58,556 28,116 14,114 2,299 194
      (12.1)                        
2020-21 220 75,558 75,558           2,491 3,709 29,013 26,166 9,711 3,867 601
      (0.0)                        
2021-22 401 1,43,314 1,41,976             3,610 10,543 59,622 44,176 18,442 5,583
      (0.9)                        
2022-23 547 2,66,547               1,127 2,150 16,663 87,997 92,539 66,071
Grand Total&       1,90,564 1,40,253 1,38,595 1,43,077 1,33,172 1,46,665 1,43,025 1,35,933 1,44,754 1,58,903 1,17,182 72,449
Percentage change         -26.4 -1.2 3.2 -6.9 10.1 -2.5 -5.0 6.5 9.8 #  
&: Column totals indicate envisaged capex in a particular year covering the projects which received financial assistance in various years. The estimate is ex ante incorporating only envisaged investments. They are different from those actually realised/utilised.
#: Per cent change for 2023-24 is not worked out as capex from proposal that are likely to be sanctioned in 2023-24 is not fully available.
^: Figures in bracket are percentage of revision/cancellation.

Table A2: Phasing of Capex Projects* Funded Through ECBs/ FCCBs/RDBs**
Loans contracted in ↓ No of LRNs issued Total loan contracted
(₹ crore)
2013-14 2014-15 2015-16 2016-17 2017-18 2018-19 2019-20 2020-21 2021-22 2022-23 2023-24 Beyond 2023-24
  1 2 3 4 5 6 7 8 9 10 11 12 13 14
upto 2013-14     78,864 27,376 4,896                  
2014-15 478 57,327   36,791 16,806 3,151 575 2 2          
2015-16 314 38,885     28,998 7,311 2,572 4            
2016-17 346 22,154       14,953 6,005 1,192 2 2        
2017-18 419 37,896         17,822 13,054 6,484 529 7      
2018-19 515 72,490           46,221 17,725 1,236 5,398 1,844 66  
2019-20 495 95,491             65,367 17,157 11,717 965 285  
2020-21 362 40,564               21,865 13,574 3,219 1,675 231
2021-22 363 51,059               13 29,315 16,554 5,089 88
2022-23 393 82,448                   35,604 44,132 2,712
Total&     78,864 64,167 50,700 25,415 26,974 60,473 89,580 40,802 60,011 58,186 51,247 3,031
Percentage change       -18.6 -21.0 -49.9 6.1 124.2 48.1 -54.5 47.1 -3.0 #  
*: Projects which did not receive assistance from banks/FIs.
**: Rupee Denominated Bonds (RDBs) have been included since 2016-17.
#: Percent change for 2023-24 is not worked out as capex from proposals that are likely to be drawn in 2023-24 is not fully available.
&: The estimate is ex ante incorporating only envisaged investment. They are different from those actually realised/utilised.
LRN: Loan registration number

Table A3: Phasing of Capex of Projects Funded Through Equity Issues*
Equity issued during ↓ No. of Companies Capex Envisaged
(₹ crore)
2013-14 2014-15 2015-16 2016-17 2017-18 2018-19 2019-20 2020-21 2021-22 2022-23 2023-24 Beyond 2023-24
  1 2 3 4 5 6 7 8 9 10 11 12 13 14
Up to 2013-14     494 492 70                  
2014-15 24 1,078   189 557 332                
2015-16 40 4,511   11 644 2753 849 183 71          
2016-17 29 1,159     14 471 368 163 143          
2017-18 51 1,538         419 327 787 5        
2018-19 39 609           506 90 13        
2019-20 12 53           2 49 2        
2020-21 12 663               139 421 84 19  
2021-22 27 3,410               10 757 1,304 939 400
2022-23 42 3,629                   1,172 2,181 276
Total&     494 692 1,285 3,556 1,636 1,181 1,140 169 1,178 2,560 3,139 676
Percentage change       40.1 85.7 176.7 -54 -27.8 -3.5 -85.2 597 117.3 #  
*: Projects which did not receive assistance from banks/FIs/ECBs/FCCBs/RDBs.
#: Per cent change for 2023-24 is not worked out as capex from proposals that are likely to be implemented in 2023-24 is not fully available.
&: The estimate is ex ante incorporating only envisaged investment, they are different from those actually realised/utilised.

Table A4: Phasing of Capex of Projects Funded Through Banks/FIs/IPOs/ECBs/FCCBs/RDBs*/IPOs
Year of sanction↓ No. of Companies Project Cost
(₹ crore)
2013-14 2014-15 2015-16 2016-17 2017-18 2018-19 2019-20 2020-21 2021-22 2022-23 2023-24 Beyond 2023-24
Banks/FIs/ ECBs/ FCCBs/ RDBs/IPOs
  1 2 3 4 5 6 7 8 9 10 11 12 13 14
upto 2013-14     2,49,961 1,21,526 39,138 14,421 4,722 1,472            
2014-15 828 1,45,658 14,822 71,569 43,128 13,018 1,821 164 1,038          
2015-16 700 1,35,177 3,787 7,445 67,159 38,692 11,500 5,151 1,223 220        
2016-17 916 2,02,562 1,352 3,952 25,402 86,610 47,448 22,998 8,711 4,003 2,086      
2017-18 955 2,07,673   620 15,184 12,445 81,242 54,817 30,038 10,736 2,349 242    
2018-19 963 2,32,288         11,000 1,06,700 64,895 22,497 15,157 4,507 101  
2019-20 827 2,71,374         4,049 14,526 1,19,394 75,715 39,833 15,079 2,584 194
2020-21 594 1,16,785           2,491 3,709 51,017 40,161 13,014 5,561 832
2021-22 791 1,96,445             3,610 10,566 89,694 62,034 24,470 6,071
2022-23 982 3,52,624             1,127 2,150 16,663 1,24,773 1,38,852 69,059
Total&     2,69,922 2,05,112 1,90,580 1,72,048 1,61,782 2,08,319 2,33,745 1,76,904 2,05,943 2,19,649 1,71,568 76,156
Percentage Change       -24.0 -7.1 -9.7 -6.0 28.8 12.2 -24.3 16.4 6.7 #  
*: Rupee Denominated Bonds (RDBs) have been included since 2016-17.
#: Per cent change for 2023-24 is not worked out as capex from proposals that are likely to be sanctioned in 2023-24 is not fully available.
&: The estimate is ex ante incorporating only envisaged investment, they are different from those actually realised/utilised.

Table A5: Size-wise Distribution of Projects Sanctioned by Banks/FIs: 2013-14 to 2022-23
Period Number and Share of Projects Less than ₹100 crore ₹100 crore to ₹500 crore ₹500 crore to ₹1000 crore ₹1000 crore to ₹5000 crore ₹5000 crore & above Total
2013-14 No. of Projects 306 115 25 21 5 472
  Per cent Share 8.3 20.0 13.9 29.1 28.7 100 (1,27,328)
2014-15 No. of Projects 223 65 18 19 1 326
  Per cent Share 9.0 16.6 14.6 47.8 12.0 100 (87,253)
2015-16 No. of Projects 214 76 34 21 1 346
  Per cent Share 8.6 20.9 26.0 38.5 5.9 100 (91,781)
2016-17 No. of Projects 287 180 29 40 5 541
  Per cent Share 5.8 23.3 11.9 41.7 17.4 100 (1,79,239)
2017-18 No. of Projects 263 149 28 42 3 485
  Per cent Share 5.2 21.0 10.8 43.8 19.1 100 (1,68,239)
2018-19 No. of Projects 220 110 39 36 4 409
  Per cent Share 4.8 17.0 17.0 39.6 21.6 100 (1,59,189)
2019-20 No. of Projects 150 84 45 36 5 320
  Per cent Share 3.3 11.9 18.6 37.4 28.8 100 (1,75,830)
2020-21 No. of Projects 128 52 15 24 1 220
  Per cent Share 5.5 16.8 14.2 53.5 10.0 100 (75,558)
2021-22 No. of Projects 200 127 36 36 2 401
  Per cent Share 5.6 20.0 19.6 46.9 7.9 100 (1,41,976)
2022-23 No. of Projects 264 156 51 68 8 547
  Per cent Share 3.9 13.6 14.1 41.3 27.1 100 (2,66,547)
Note: i. Figures in brackets are total cost of projects in ₹ crore.
ii. Per cent share is the share in total cost of projects. Percentages may not total 100 due to rounding.

Table A6: Purpose-wise Distribution of Projects Sanctioned by Banks/FIs during 2013-14 to 2022-23
Period Number and Share of Projects New Expansion & Modernisation Diversification Others Total
2013-14 No. of Projects 361 95 2 14 472
  Percent Share 65.2 20.1 - 14.7 100 (1,27,328)
2014-15 No. of Projects 203 92 2 29 326
  Percent Share 39.4 14.7 0.2 45.7 100 (87,253)
2015-16 No. of Projects 260 64 3 19 346
  Percent Share 73.6 14.3 0.1 12.0 100 (91,781)
2016-17 No. of Projects 429 97 4 11 541
  Percent Share 78.6 9.9 0.1 11.3 100 (1,79,249)
2017-18 No. of Projects 396 80 2 7 485
  Percent Share 89.0 9.5 0.1 1.5 100 (1,68,239)
2018-19 No. of Projects 309 80 - 20 409
  Percent Share 76.8 19.3 - 3.9 100 (1,59,189)
2019-20 No. of Projects 262 37 1 20 320
  Percent Share 79.8 13.7 - 6.4 100 (1,75,830)
2020-21 No. of Projects 181 38 1 - 220
  Percent Share 94.1 5.9 - - 100 (75,558)
2021-22 No. of Projects 312 88 1 - 401
  Percent Share 89.1 10.8 0.1 - 100 (1,41,976)
2022-23 No. of Projects 440 101 - 6 547
  Percent Share 93.1 6.1 - 0.8 100 (2,66,547)
Note: i. Figures in brackets are total cost of projects in ₹ crore.
ii. Per cent share is the share in total cost of projects. Percentages may not total 100 due to rounding.
iii. -: Nil/ Negligible.

Table A7: Industry-wise Distribution of Projects Sanctioned by Banks/FIs: 2013-14 to 2022-23
Industry 2013-14 2014-15 2015-16 2016-17 2017-18 2018-19 2019-20 2020-21 2021-22 2022-23
  No. of Proj ects Per cent Sh are No. of Proj ects Per cent Sh are No. of Proj ects Per cent Sh are No. of Proj ects Per cent Sh are No. of Proj ects Per cent Sh are No. of Proj ects Per cent Sh are No. of Proj ects Per cent Sh are No. of Proj ects Per cent Sh are No. of Proj ects Per cent Sh are No. of Proj ects Per cent Sh are
Infrastructure 87 39.7 74 48.9 108 72.0 204 62.5 150 51.7 122 60.3 99 61.5 63 74.3 95 56.4 135 59.9
i) Power 70 35.1 65 42.2 92 57.1 170 45.4 117 36.5 78 26.8 47 32.9 35 49.3 58 29.0 53 20.3
ii) Telecom 1 - 1 4.9 1 0.3 1 - - - - - - - - - - - - -
iii) Ports & Airports 1 0.8 - - 3 2.4 8 5.7 6 3.1 4 14.2 4 8.4 1 0.1 2 5.9 2 0.4
iv) Storage & Water Management 5 1.1 2 0.6 4 4.2 6 3.7 2 0.4 13 5.7 4 0.4 5 1.2 2 0.2 3 0.8
v) SEZ, Industrial, Biotech and IT Park 8 1.5 3 0.9 1 0.4 2 0.4 9 1.6 11 3.2 8 1.3 5 2.2 3 1.1 8 1.9
vi) Roads & Bridges 2 1.2 3 0.3 7 7.6 17 7.3 16 10.1 16 10.4 36 18.5 17 21.5 30 20.2 69 36.5
Metal & Metal Products 44 17.4 17 17.4 14 1.5 23 4.9 21 9.7 16 3.0 14 0.8 6 0.8 27 4.2 60 14.6
Construction 27 2.1 29 4.0 26 1.8 60 12.0 39 5.3 26 2.3 44 11.4 27 4.8 22 7.4 35 4.0
Textiles 58 10.3 50 4.1 49 4.8 57 4.1 54 3.7 27 3.4 11 0.5 15 1.8 56 4.5 42 2.8
Food Products 43 1.8 34 2.9 26 1.8 38 0.9 47 2.8 28 1.4 32 1.9 20 1.5 25 1.8 40 2.5
Chemicals & Pesticides 15 1.0 7 2.6 11 1.6 10 2.1 23 11.4 19 2.9 12 1.3 9 1.6 20 3.4 16 2.3
Pharmaceuticals 19 1.3 9 1.5 11 0.3 12 1.1 15 0.6 23 1.6 9 0.6 7 0.5 20 1.3 30 2.1
Mining and quarrying 1 0.6 2 0.1 10 2.7 4 0.4 1 - - - - - - - 1 0.1 7 1.8
IT Software 3 0.1 1 - 1 - - - 1 - 2 0.7 1 - - - 2 0.6 4 1.2
Electrical Equipments & Electronics 9 2.0 7 0.2 2 0.2 9 0.2 6 0.2 1 0.1 4 - 1 0.1 5 4.0 9 1.1
Hospitals & Health services 10 0.7 2 0.1 1 - 22 1.1 18 1.8 15 2.6 12 0.7 7 0.3 19 2.3 20 1.1
Coke and Petroleum Products 1 0.5 1 3.4 2 2.0 2 0.5 1 0.4 - - 3 8.0 - - 7 1.0 17 1.1
Glass & Pottery 11 0.3 19 0.7 8 0.5 19 0.6 20 0.8 2 - - - 12 0.6 8 0.7 5 1.0
Rubber & Plastic products 9 0.3 8 0.8 4 0.5 8 0.2 10 2.5 5 0.5 5 0.3 17 2.1 12 0.8 13 0.8
Cement 12 7.1 7 3.8 5 1.9 5 2.3 3 0.6 10 5.1 2 0.1 5 1.3 3 3.3 2 0.8
Others* 123 15.3 59 9.5 68 8.4 68 7.2 76 8.5 113 16.0 72 12.9 31 10.3 79 8.2 112 3.0
Total 472 100 326 100 346 100 541 100 485 100 409 100 320 100 220 100 401 100 547 100
Total project cost in ₹ crore 1,27,328 87,253 91,781 1,79,249 1,68,239 1,59,189 1,75,730 75,558 1,41,976 2,66,547
*: Comprise industries like Transport Services, Transport Equipment, Hotel & Restaurants, Paper & Paper Products, Agricultural & Related Activities, Manufacturing of electric and non-electric machinery, Sugar and allied products, Entertainment, Trading of services, Printing & Publishing, other manufacturing and other services.
Note: i. Per cent share is the share in total cost of project. Percentages may not total 100 due to rounding.
ii. -: Nil/Negligible.

Table A8: State-wise Distribution of Projects Sanctioned by Banks/FIs: 2013-14 to 2020-21
State 2013-14 2014-15 2015-16 2016-17 2017-18 2018-19 2019-20 2020-21 2021-22 2022-23
No. of Proj ects Per cent Sh are No. of Proj ects Per cent Sh are No. of Proj ects Per cent Sh are No. of Proj ects Per cent Sh are No. of Proj ects Per cent Sh are No. of Proj ects Per cent Sh are No. of Proj ects Per cent Sh are No. of Proj ects Per cent Sh are No. of Proj ects Per cent Sh are No. of Proj ects Per cent Sh are
Uttar Pradesh 21 1.1 20 5.4 15 2.5 22 3.7 30 2.4 28 4.8 24 5.4 30 13.7 33 12.8 45 16.2
Gujarat 66 14.5 71 9.5 61 15.1 102 23.0 71 8.0 56 11.1 47 15.1 54 17.1 82 11.7 82 14.0
Odisha 10 11.7 5 15.9 6 3.1 6 3.1 5 3.0 9 1.4 6 1.9 2 0.1 9 2.2 12 11.8
Maharashtra 76 19.7 38 14.8 36 9.4 57 8.8 65 23.3 34 11.5 41 6.9 13 8.5 44 9.7 48 7.9
Karnataka 39 6.2 27 5.4 21 6.2 52 6.8 64 9.6 34 5.7 33 17.2 11 6.1 24 6.9 37 7.3
Madhya Pradesh 30 6.1 14 3.9 21 7 18 7.5 10 0.7 12 1.6 10 1.2 19 2.8 18 4.2 35 5.0
Tamil Nadu 33 5.4 27 2.9 26 9.3 23 4.4 28 6.6 32 12.8 28 8.3 7 0.7 40 8.8 44 4.8
Andhra Pradesh 37 4.0 24 8.1 33 12.3 47 8.0 22 9.9 29 11.1 12 4.0 7 15.0 11 2.1 27 4.4
Jammu & Kashmir 10 5.2 2 0.1 9 0.2 3 0.1 8 2.0 11 0.4 3 0.3 5 0.2 5 0.2 23 3.1
Rajasthan 24 1.4 29 11.1 10 0.9 23 2.8 33 6.3 21 7.7 23 3.8 21 17.1 32 12.6 22 3.1
Punjab 28 1.5 6 0.3 11 1.7 29 2.1 31 2.2 15 1.9 9 0.8 4 0.7 15 2.1 21 2.5
Himachal Pradesh 3 1.8 3 0.1 8 1.4 1 - 8 2.3 7 0.3 6 0.1 4 0.2 7 1.2 11 2.2
Telangana - - - - 10 3.8 51 5.5 17 1.9 26 9.1 12 4.0 9 1.9 16 3.4 30 1.9
Jharkhand 4 0.3 2 0.7 5 0.3 1 - 3 0.3 2 0.5 4 9.4 1 0.2 6 0.8 12 1.9
Bihar 6 0.2 4 0.1 6 0.2 4 0.2 3 0.1 6 0.4 6 3.4 1 - 5 3.4 6 1.6
Chhattisgarh 16 10.7 8 7.4 8 4.6 15 4.0 7 4.8 6 0.9 6 0.2 3 1.2 4 0.8 8 1.4
West Bengal 12 1.2 9 1.3 14 3.1 18 1.7 14 1.8 13 1.1 7 0.9 3 0.4 11 2.6 16 1.0
Haryana 15 1.1 11 1.9 16 3.6 13 1.6 21 0.5 18 1.7 20 3.4 15 7.8 14 2.0 14 1.0
Kerala 3 - 4 0.2 4 0.1 6 2.7 3 0.1 6 0.9 3 1.0 - - 5 4.2 12 0.9
Goa - - - - 1 - 3 0.6 2 1.9 3 1.8 2 0.1 - - 3 3.0 3 0.8
Assam 4 0.3 2 0.2 4 0.4 10 0.6 5 0.8 4 0.2 1 0.3 3 4.4 2 - 6 0.7
Multi-State # 21 6.9 10 9.5 13 13.5 17 11.8 16 7.5 15 9.8 8 11.7 2 1.4 7 4.0 10 5.5
others* 14 0.7 10 1.2 8 1.3 20 1.0 19 4.0 22 3.3 9 0.6 6 0.5 8 1.3 23 0.9
Total 472 100 326 100 346 100 541 100 485 100 409 100 320 100 220 100 401 100 547 100
Total Cost of Projects (in ₹ crore) 1,27,328 87,253 91,781 1,79,249 1,68,239 1,59,189 1,75,830 75,558 1,41,976 2,66,547
#: Comprise projects over several states.
*: Comprise remaining states/union territories.
Note: i. Per cent share is the share in total cost of project. Percentages may not total 100 due to rounding.
ii. -: Nil/Negligible.

^ The authors are from the Department of Statistics and Information Management. The views expressed in the article are those of the authors and do not represent the views of the Reserve Bank of India. The previous article in the series “ Private Corporate Investment: Growth in 2021-22 and Outlook for 2022-23” was published in the August 2022 issue of the Reserve Bank of India Bulletin.

1 Includes all public sector banks, major private sector and foreign banks, and financial institutions which are actively involved in project financing namely, Industrial Financial Corporation of India (IFCI), Life Insurance Corporation (LIC), Power Finance Corporation (PFC), Rural Electrification Corporation of India (REC) and Export-Import Bank of India (EXIM).

2 Analysis of investment outlook of private corporates are regularly released in the form of articles, initially in the Economic and Political Weekly and, since 1989, in the RBI Bulletin.

3 The methodology was published on 19th December, 1970 in the article “Forecasting Capital Expenditure in the Corporate Sector” authored by Dr. C Rangarajan in the Economic and Political Weekly (EPW), Volume No. 5, Issue No. 51, Page 2049-2051.

4 Bharatmala, under Ministry of Road Transport and Highways, Government of India, is an umbrella programme for the highways sector in India that focuses on optimising efficiency of freight & passenger movement across the country by bridging critical infrastructure gaps.

5 Pipeline projects are those projects which are already undertaken for implementation. Capex from pipeline projects are envisaged amounts for a given year, which got sanctioned prior to that given year.

6 M.H. Pesaran, Y. Shin (1998), “An autoregressive distributed lag Modelling approach to cointegration analysis”, S. Strøm (Ed.), Econometrics and Economic Theory in The Twentieth Century: The Ragnar Frisch Centennial Symposium, Cambridge University Press, Cambridge, UK (1998), pp. 371-413.

RbiTtsCommonUtility

PLAYING
LISTEN

Related Assets

RBI-Install-RBI-Content-Global

RbiSocialMediaUtility

Install the RBI mobile application and get quick access to the latest news!

Scan Your QR code to Install our app

RbiWasItHelpfulUtility

Was this page helpful?