
Production Weighted Rainfall Index and Agriculture Production: Relationship Re-visited - RBI - Reserve Bank of India


Production Weighted Rainfall Index and Agriculture Production: Relationship Re-visited
| by Shivangee Misra, Rajendra Raghumandaand Sanjay Singh^ To assess the impact of Southwest monsoon (SWM) rainfall on agriculture activities, the Reserve Bank of India staff has been preparing Production Weighted Rainfall Index (PRN) which takes into account the state wise rainfall and their respective contributions in all-India foodgrain production. The PRN has proved to be a better rainfall indicator over IMD index for projecting kharif foodgrain production. This article attempts to modify the PRN (Modified PRN) for better monitoring of SWM rainfall as well as forecasting of kharif foodgrain production. Introduction Rainfall is a crucial aspect of agricultural production, especially in India, where nearly half of the net sown area is rain-fed. Other major drivers of production apart from rainfall include irrigation infrastructure, technological innovations, usage of high yield varieties of seeds, improved fertilisers, soil moisture level and temperature among others. Despite the rapid expansion in irrigation infrastructure in the recent years, the net irrigated area in India is only marginally higher than half of the total net sown area.1 India Meteorological Department (IMD)2 classifies the annual rainfall in India into four seasons: i) Winter (January to February), ii) Pre-Monsoon (March to May), iii) Southwest monsoon (SWM) (June to September), and iv) Post monsoon (October to December). Among these, SWM receives around 75 per cent of the annual rainfall and assumes great importance for the agricultural activities in the country. Along with being a major source for irrigation, SWM is also essential for maintaining the optimum level of storage in the reservoirs which facilitates irrigation during the entire year. A normal monsoon supports the crop production and boosts the rural consumption. Whereas, a deficit or an erratic monsoon can lower the productivity and affect the cropping pattern. Among the three seasons of agriculture in India, kharif, which accounts for around 50 per cent of the total foodgrain production of the country, has the highest dependency on SWM rainfall. Better SWM rainfall improves the prospects of kharif crops, however, excess rainfall during monsoon season may damage the crops and hence is detrimental to the kharif production. The excess rainfall during SWM, however, may lead to improved reservoir levels and might augur well for rabi production. Thus, analysing the impact of SWM rainfall - the quantum, spatial and temporal dynamics of it, on the kharif foodgrain production has always remained an area of concern. Given the importance of rainfall in the Indian economy, the Reserve Bank monitors the progress of rainfall, particularly the SWM very closely. The IMD’s rainfall index for the country is the weighted aggregation of sub-division wise rainfall wherein weights are based on geographical areas. To capture the impact of rainfall from the point of view of agricultural activities in a better way, the Reserve Bank has been compiling Production Weighted Rainfall Index (PRN), wherein state wise rainfall is aggregated based on the state wise share in total foodgrain production. RBI has been publishing PRN in the Monetary Policy Report and the State of the Economy article of the RBI Bulletin issues, released during and around the SWM season. The PRN addresses the concern that, despite IMD rainfall index falling in the normal range at the country level, the states with higher foodgrain production capacity might receive lower rainfall as compared to the lower foodgrain producing states, leading to a lower foodgrain production than normal and vice versa. For example, in 2022, PRN stayed below the IMD index for the first three months of the SWM season,3 reflecting the lower rainfall received by major foodgrain producing states in the northern and eastern parts of India. The methodology for construction of PRN which is explained in the subsequent section, broadly follows Cummings et al. (1969) and Arif (1988). Though, a higher value of PRN indicates better rainfall which generally leads to better agriculture prospects, excess rainfall beyond a threshold might result in the incidence of crop damage, diminishing of nutrients and soil erosion, etc., resulting in lower agriculture production (which is empirically proven in the subsequent section of this article) i.e., if rainfall is below a threshold, the relationship between the foodgrain production and the rainfall index is positive, whereas if the rainfall is above the threshold, the relationship changes and becomes negative. While PRN is an improvement over IMD index, it is unable to differentiate the impact of excess rainfall on crop production with that of normal or below normal rainfall. Furthermore, there may be a case when PRN turns out to be normal despite deficit rainfall in some major foodgrain producing states and vice versa. This might arise due to the shortfall, in key foodgrain producing states, being offset by high rainfall in other major foodgrain producing states. Hence, to address the above mentioned shortcomings of PRN, this article attempts to modify the PRN [named as modified PRN (MPRN)] by using one-sided winsorisation at state-level, wherein, if a state receives rainfall more than a pre-decided threshold, the actual rainfall for the state is restricted to that threshold for the calculation of PRN. This article also empirically examines the usefulness of MPRN in the projection of kharif foodgrain production which is largely influenced by the SWM. The remainder of the study proceeds as follows. Section II briefly presents the major literature explored for the study. The data being used for the study and methodology for calculation of PRN and MPRN is explained in Section III. The empirical results have been discussed in Section IV. Finally, Section V concludes by summarising inferences that emanated from the study. II. Review of Major Literature Various studies have been undertaken to examine the impact of several factors, such as, rainfall, weather, technological innovations, etc., on the production of crops. Cummings et al. (1969) analysed the impact of New Agricultural strategy and provided an estimate of the foodgrain production for the year 1968-69, by taking into consideration the effects of rainfall and the role of technology. Similarly, the quantum of foodgrains produced in India was analysed by incorporating the spatial and temporal distribution of monsoon rainfall (Arif, 1988). Further, studies done on rainfall forecast and foodgrain production (Bhatia, 1997) emphasise on the importance of crop level production forecasting using crop-wise production weighted rainfall index. Another study finds the relationship of agricultural growth with deviation of rainfall from previous year and irrigation growth (Kumar et al., 2019). The impact of climate change on major crops of Pakistan was assessed by analysing the factors, such as, maximum temperature, minimum temperature, relative humidity, sunshine and rainfall (Ali et al., 2017). The potential impact of rising temperature on wheat yield is studied for the north Indian plains (Kuriachen et al., 2022). Gupta et al. (2023) found statistically significant impact of SW rainfall on kharif production, though the impact has moderated over time. Singh et al. (2020) examined the impact of timing of arrival of monsoon on crop yields using district-level panel data. In India, technological innovations in crop forecasting have been a continuous phenomenon. Crop forecasting using remote sensing data, started in late 1980s, however, it became fully operational through a national level programme - FASAL (Forecasting Agriculture output using Space, Agro-meteorology and Land-based observations) since 2006 (Ray et al., 2014). It involves econometric models to forecast area and production before crop sowing season. It aids in validating the estimates of the output along with the other sources. Due to this scientific advancement, the agriculture production estimates were believed to be more reliable since 2000s. This is also evident from the co-movement of kharif foodgrain production growth with the IMD rainfall index after 2002-03 (Chart 1).4 Given the better alignment of kharif foodgrain production estimates with rainfall since 2002-03, the timeframe to study the impact of SWM rainfall on kharif production was taken as 2002-03 to 2022-23 (Chart 1). 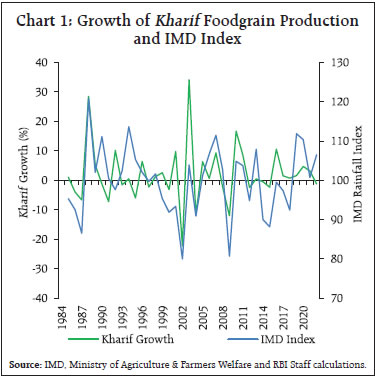
The PRN and MPRN have been constructed by using the following formulas: a. Production weighted Rainfall Index (PRN): 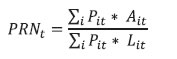
where, Ait Actual Rainfall of ith state during the year/month ‘t’ and Lit: Long Period Average (LPA) Rainfall5 of ith state for the year/month ‘t’. Pit: Foodgrain production share of ith state during the year/month6 ‘t’. The state-wise foodgrain production share is derived based on the average share of latest five years. The state wise production share of foodgrains is given in the Annexure 1. b. Modified Production weighted Rainfall Index (MPRN): A one-sided winsorisation was applied on the actual state-wise rainfall to get MPRN. Accordingly, PRN is modified as follows to get MPRN: 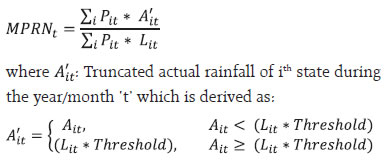
According to IMD, rainfall in the range of 96-104, above 104-110 and above 110 per cent of LPA rainfall is categorised as normal, above normal and excess rainfall, respectively, at all-India level. The above normal or excess rainfall may not be favourably impacting the agriculture activity and hence for this study various thresholds starting from 105 have been considered for constructing the MPRN. Results for the alternative threshold settings in the range of 105 to 110 per cent and 115 per cent are presented in this article. Descriptive statistics of IMD, PRN and MPRN show that due to one-sided truncation, the average value of MPRN is considerably lower than IMD and PRN, indicating that the definition of normal rainfall, which is based on IMD index, may not be applicable for MPRN (Table 1). To examine the impact of SWM rainfall on kharif foodgrain production, the following regression model was used: 
where, Productiont is the deviation of the actual kharif foodgrain production from its trend, and Rainfall Indext is the IMD/ PRN/ MPRN for the SWM season in the year ‘t’. The trend of kharif production was alternatively taken as time trend – deterministic trend and the Hodrick Prescott(HP) filter based trend – stochastic trend with a smoothing parameter λ=100. Deviation of foodgrain production from its trend eliminates the impact of gradual improvement in production on account of factors, such as, greater use of technology, high yielding variety of seeds, etc., and hence is left with the short-run movement wherein rainfall could be a major driver. Since rainfall in different months of the monsoon season may have differential impact on the agriculture activities, the temporal characteristic was factored-in by modifying the above model as: 
where, Rainfall Indexj,t is the IMD/PRN/MPRN for thejth month (j: June, July, August and September) of the ‘tth’ SWM year. Furthermore, the possible adverse impact of excess rainfall that is the rainfall being left out while computing the MPRN on crop production, was factored-in by taking the difference of MPRN from PRN as another explanatory variable in the Model (1). The modified regression equation transformed as: 
where, DMPRNt is the difference of MPRN at a pre-decided threshold from PRN in the year ‘t’ (i.e., DMPRNt= PRNt – MPRNt). Given the differences in mean and variance of rainfall indices – the explanatory variables used in this study (Table 1), the associated coefficients of above regression models may not be directly comparable. Hence, to make them comparable, all the explanatory as well as dependent variables were standardised by using standard normal transformation. Therefore, all the above three models became regression through the origin (i.e. regression without intercept). The correlation between SWM rainfall and the growth rate in kharif foodgrain production was found to be highly positive. Among the three indices, MPRN has slightly higher correlation. Though all the monsoon months have positive correlation with kharif foodgrain production, July has the highest, indicating that the July rainfall is crucial for the sowing activities and also for the early growing stage of the crops (Table 2). Estimates of the regression model (1) using both the time trend and HP filter trend show that all the three rainfall Indices have positive and significant impact on the deviation of kharif foodgrain production from the trend. MPRN is found to have the highest impact on kharif production with significantly better in-sample fit (measured by Adj. R-square) followed by PRN and IMD. The MPRN at threshold value of 105 proves to be the best fit among all the threshold settings. Moreover, the Adj. R-square was observed to be declining sequentially when the threshold was increased beyond 105, indicating that rainfall above 105 per cent of LPA could start having adverse impact on kharif foodgrain production. Impact of temporal distribution of SWM rainfall on kharif production, which was captured in the model (2) with month-wise rainfall, reveals that the rainfall in the July month (the month accounting for around half of the kharif sowing) has the highest impact on output prospects followed by that in June, September and August, indicating that the adverse impact of delay in onset or subdued performance of monsoon in June on agriculture prospects may be somewhat mitigated if the monsoon picks-up in the subsequent month. Unlike IMD and PRN, MPRN shows that rainfall in all the four months of the monsoon season has significant implication for kharif foodgrains (Tables 3 and 4). One-year ahead projections7 carried out by using model (1) suggest that MPRNs have lower forecast errors as compared to PRN and IMD in all the cases.Relative Root Mean Square Percentage Error (RMSPE)8 of MPRN over IMD indicate that there is significant improvement in the forecasting performance of the model. Among the MPRNs with different thresholds selected under study, the MPRN at threshold 105 outperforms all the others. In the last 5 years, the RMSPE for kharif foodgrain production using MPRN (threshold 105) is lower by 21.3 per cent and 38.3 per cent, than the RMSPE based on IMD under time trend and HP trend, respectively (Table 5.1). Incorporating the month-wise rainfall dynamics in the model [regression model (2)] in place of total rainfall during SWM season does not help in improving the forecasting performance for the last 5 years (Table 5.2). Further, the model which factors in the adverse impact of excess rainfall [model (3)] seems to be improving the overall in-sample fit (Adj. R Square) when compared to the model only with annual rainfall [model (1)]. MPRN at 105 stands out to be having the best in-sample fit. The negative and statistically significant regression coefficient of the excess rainfall suggests unfavourable output conditions for kharif foodgrain production. As the threshold setting for excess rainfall increases, the negative impact of the excess part also magnifies (Annexure 2). The adverse impact comes out to be significant at 10 per cent and 5 per cent level of significance under time trend and HP trend, respectively. The forecast performance for kharif foodgrain production seem to be improving only marginally when compared to model (1) in the case of Time Trend. However, no such improvement was observed in the case of HP trend (Table 5.3). An assessment of the impact of the quantum, spatial and temporal distribution of SWM rainfall on the production of kharif foodgrains reaffirms the positive and statistically significant impact of SWM rainfall on kharif production prospects. Among the SWM months, July rainfall has the highest impact on production followed by June, September and August, indicating that the adverse impact of delay in onset or subdued performance of monsoon in June may be somewhat mitigated if the monsoon picks-up in the subsequent month. The MPRN derived by applying a one-sided winsorisation on the actual state-wise rainfall was constructed for various thresholds starting from 105. While PRN performs better than IMD index in terms of better in-sample fit and lower forecast error, MPRN proves to be a further improvement over PRN. As the threshold of MPRN increases after 105, the in-sample fit of the model decreases and the impact gradually diminishes, indicating that rainfall around 105 per cent of LPA has the highest and significant impact on kharif foodgrain production. Also, MPRN at 105 has better forecasting performance over PRN, IMD and MPRN with other thresholds. Incorporating the temporal distribution of SWM rainfall (based on month-wise rainfall index) over annual rainfall, however, does not help in improving the forecasting performance of production at least in the last five years. Further, the excess rainfall was found to have a significant and negative impact on kharif foodgrain production. References Ali, S., Liu, Y., Ishaq, M., Shah, T., Abdullah, Ilyas, A., & Din, I. U. (2017). Climate change and its impact on the yield of major food crops: Evidence from Pakistan. Foods, 6(6), 39. Arif, R. R. (1988). Kharif production and monsoon rainfall: An empirical study. Reserve Bank of India Occasional Papers, 9(4), 375-393. Bhatia, M. S. (1997). Rainfall forecast and Kharif foodgrains in 1997. Economic and Political Weekly, 2289-2294. Cummings Jr, R. W., & Ray, S. K. (1969). 1968-69 Foodgrain Production: Relative Contribution of Weather and New Technology. Economic and Political Weekly, 4(39), A163-A174. Gupta, K., Kumar, S., & Gulati, S. (2023). Agriculture’s Dependency on Monsoon Rainfall in India. RBI Bulletin, August, 99-114. Kumar, M. D., Ganguly, A., & Sivamohan, M. V. K. (2019). What Drives Annual Agricultural Growth Rates in India?. Economic and Political Weekly, 54(1), 33-36. Kuriachen, P., Devi, A., Sam, A. S., Kumar, S., Kumari, J., Suresh, A., & Jha, G. K. (2022). Wheat yield responses to rising temperature: insights from northern plains of India. Theoretical and Applied Climatology, 150(3-4), 1157-1172. Ray, S. K. (1981). Weather, prices and fluctuations in agricultural production. Indian Economic Review, 16(4), 251-277. Ray, S. S., Mamatha Neetu, S., & Gupta, S. (2014). Use of remote sensing in crop forecasting and assessment of impact of natural disasters: operational approaches in India. Crop monitoring for improved food security. Singh, H., Negi, D. S., & Birthal, P. S. (2020). Uncertain monsoon, irrigation and crop yields: Implications for pricing of insurance products. Indira Gandhi Institute of Development Research Working paper, No. 2020-018. ^ The authors are from Department of Statistics and Information Management. The authors are thankful to Dr. O. P. Mall and Dr. A. R. Joshi for their encouragement and guidance in preparing this article. The views expressed are those of the authors and do not represent the views of the Reserve Bank of India. 1 Land Use Statistics, 2019-20. 2 https://internal.imd.gov.in/press_release/20220414_pr_1572.pdf 3 State of the Economy article of the RBI Bulletin, October 2022. 4 Directional concordance between kharif foodgrain production and IMD rainfall index improves by 28 per cent for the period 2002-2022 as compared to 1985-2001. Also, the correlation coefficient of foodgrain production’s deviation from trend and IMD rainfall index increases from 0.5 to 0.7. 5 The latest LPA rainfall i.e. 50-year average rainfall for 1971-2020 is used for computing all three indices viz. IMD rainfall index, PRN and MPRN for the entire sample period considered. 6 Since, state-wise foodgrain share is derived based on annual production, the state-wise foodgrain production share remains same across months of the year. 7 The projections are generated recursively, i.e., the model was first estimated using data till time ‘t’, then using the estimated model and the rainfall index observed for time ‘t+1’, foodgrain production for time ‘t+1’ was projected. |


Share this page:


Install the RBI mobile application and get quick access to the latest news!


