Quarterly Industrial Outlook Survey: July-September 2009 (47th Round)* This article presents the survey findings of Industrial Outlook Survey conducted for July-September 2009 quarter, the 47th round in the series. It gives the assessment of business situation of companies in manufacturing sector, for the quarter July-September 2009, and their expectations for the ensuing quarter October-December 2009. The survey findings indicate that the business sentiments that were at an improving stage during the previous quarter (April-June 2009) have shown further improvement during current quarter (July-September 2009) implying Indian manufacturing sector continues to recover further. The present round of the survey shows further improvement in the Business Expectation Index (BEI) by 8 per cent over the preceding round (April-June 2009) which also follows a sharp rise by 30 per cent over Jan-March 2009 quarter. The recovery of economic growth appears to be more robust in view of the continuing consolidation of business confidence. Highlights
The survey conducted in July-September 2009 signals continued improvement in the sentiments of the manufacturing sector after a turnaround in the previous quarter (April-June 2009), pointing towards a robust growth in the overall performance of the manufacturing sector.
• The demand conditions show signs of further recovery in the second consecutive quarter signalling towards economy escalation. This is reflected from the improved growth in production, order books and export and import orders compared to previous quarter. Also, the decrease in pending orders ‘below normal’ over previous quarters and the upward turn of capacity utilisation in current quarter reflects the improvement in demand condition. However, a large proportion of respondents expected no change in the inventory levels (both raw material and finished goods) for the current and ensuing quarters. • The financial conditions show further recuperation as more respondents assessed ‘betterment’ of overall financial situation during the quarters under review. In line with demand conditions, the working capital finance requirement is also expected to grow in October-December 2009 quarter and the assessment on availability of finance has further improved and eased. The pressure on profit margin continues but the contraction is expected at a much lower rate. The input prices are expected to rise for the second successive quarter and with increased demand, companies are feeling the pricing power to pass it on to their selling prices. The outlook on employment has also improved and companies are expected to increase their workforce with the prevailing optimistic demand conditions. • There is a remarkable improvement in the assessment and expectation of Overall business situation as the net response exhibited a rising trend. These upward movements of assessment and expectations as compared to previous quarters are large and statistically significant. The business expectations indices based on assessment for July-September 2009 and on expectations for next quarter were both in growth terrain and reached to 107.2 and 116.4 respectively from 99.4 and 109.9.
• The industry-wise break-up shows that while all the industry groups have positive overall business sentiments in the present quarter, specifically few industry groups, viz., transport, food products, and pharmaceuticals and fertilisers are more optimistic than the others. The rise in input price is also felt across board, but it is highest for paper, rubber, textiles and food industries. All industries except textiles are expected to increase their workforce. • Size wise analysis shows that the improvement is also seen across all size groups, but the bigger companies with annual production of Rs. 1000 crore or more are most optimistic. The smaller companies (annual production less than Rs 100 crore) feel the more input price pressures and their net response for availability of finance is also lower as compared to bigger companies. Introduction The Reserve Bank of India has been conducting the Industrial Outlook Survey (IOS) on a quarterly basis since 1998. The Survey gives insight into the perception of the public and private limited companies engaged in manufacturing activities about their own performance and prospects. The survey covers selected non-financial private and public limited companies with a good size/industry representation. The assessment of business sentiments for the current quarter and expectations for the ensuing quarter are based on qualitative responses on 19 major parameters covering overall business situation, financial situation, demand indicators, price and employment expectations, profit margins, etc. The survey provides useful forward looking inputs for policymakers, analysts and business alike. II. Data Coverage and Methodology1 II.1. Sample Size The sample covers about 3000 non-financial public and private limited companies, mostly with paid up capital above Rs. 50 lakh, in the manufacturing sector. The fieldwork for the survey was carried out during the two-month period ending August 2009 by outsourcing. The panel of respondents is kept uniform to the extent possible except for periodic updation in the case of addition of new companies or deletion of closed/merged companies. The sample is chosen so as to get a good representation of size and industry. II. 2. Response to the Survey The survey elicited response from 1200 companies (40 per cent of the sample) within the stipulated time. Companies with incomplete or improperly filled-in schedules were excluded for the analysis2. The study is based on responses of 1180 companies which were included in the analysis. II. 3. The Survey Schedule
The present survey schedule predominantly consists of qualitative questions (Annex I) and the target respondents are senior management personnel or finance heads of the companies. The schedule runs into two pages containing five blocks canvassed on quarterly basis. Block 1 collects information about location and contact details of the respondent company. Block 2 pertains to information of three major products (in terms of their sales) manufactured by company and on that basis company gets classified into different industry groups. Block 3 seeks size details of the company in terms of paid-up capital, annual production and current level of capacity utilisation, the information being sought in pre-specified ranges. Production constraints faced by the company during the quarter and reasons thereof are collected through Block 4.
Block 5 pertains to qualitative questions on 19 core parameters which include Overall Business Situation, Financial Situation, Working Capital Finance Requirement, Availability of Finance, Production, Order Books, Cost of Raw Material, Inventory Levels (both raw material and finished goods), Capacity Utilisation indicators, Employment, Exports, Imports, Selling Prices and Profit Margin. The information is sought for two reference periods, i.e., assessment of current quarter and the expectations for the next quarter. These responses are collected on a 3-point scale (i.e. increase, decrease and no change). The results are presented using Net Responses (NR), which is the percentage difference of positive (Optimistic) minus negative (pessimistic) responses; ignoring no change. III. Survey Findings The survey results are being published in a concise form in the Reserve Bank’s quarterly publication ‘Macroeconomic and Monetary Developments’ since 2005 and Monetary Policy statements. A time series article presenting the movements of the survey findings since Round 10 (April-June 2000), after which consistent time series data on the survey results were available, till Round 46 (April-June 2009) was published in October 2009 Bulletin. The survey findings of the 47th round conducted for July-September 2009 quarter, are presented in this article. III.1. Demand conditions
Survey collects perceptions of the Indian manufacturers about prominent demand related parameters namely Production, Order Books, Capacity Utilisation, Inventory, Exports and Imports.
111.1.1. Production
The questions on production seek the company’s assessment and expectations of Production (for all products), whether it will increase, decrease, or there will be no change. On the output front assessment and expectations, for the quarter under study, went up from the levels observed in the previous quarter (April-June 2009). This shows a marked improvement in the demand condition. 111.1.2. Order Books The demand position of the manufacturing companies, as directly measured by order books, has improved remarkably over the previous quarter; the net response is sharply up from -0.9 per cent to 20.5 per cent. The expectation for the next quarter echoed the similar sentiment.
Table 1 : Assessment & Expectations for Production |
(Percentage responses) |
Survey Quarter |
Total response |
Assessment for Current Quarter |
Expectation for Next Quarter |
Increase |
Decrease |
No
change |
Net
response |
Increase |
Decrease |
No
change |
Net
response |
1 |
2 |
3 |
4 |
5 |
6 |
7 |
8 |
9 |
10 |
Jul-Sep 08 |
1032 |
42.5 |
17.3 |
40.2 |
25.2 |
53.4 |
9.9 |
36.6 |
43.5 |
Oct-Dec 08 |
1178 |
36.0 |
24.9 |
39.1 |
11.1 |
48.8 |
9.0 |
42.1 |
39.8 |
Jan-Mar 09 |
1225 |
27.1 |
35.1 |
37.7 |
-8.0 |
41.8 |
15.8 |
42.3 |
26.0 |
Apr-Jun 09 |
1242 |
33.1 |
26.2 |
40.6 |
6.9 |
32.5 |
22.6 |
44.9 |
9.9 |
Jul-Sep 09 |
1180 |
40.9 |
18.3 |
40.8 |
22.6 |
38.5 |
16.1 |
45.5 |
22.4 |
Oct-Dec 09 |
|
|
|
|
|
46.0 |
11.0 |
43.0 |
35.0 |
III.1.3. Pending orders
The question on pending orders were asked to the manufacturing companies to seek information whether pending orders for current and next quarter will be above normal, normal or below normal. It is seen that the optimism level both for assessment and expectations for maintaining pending order ‘above normal’ has decreased over preceding quarters as more companies shifted from above normal to normal level of pending order. III.1.4. Capacity Utilisation
Another important economic variable indicative of demand in the economy is the utilisation of capacity, the extent to which an enterprise actually uses its installed capacity. The Survey has three questions on capacity utilisation. It collects views of manufacturing companies about Capacity Utilisation of main product (increase/ decrease/ no change), level of capacity utilisation compared to the average in the last 4 quarters (above normal/ below normal/ normal) and assessment of production capacity with regard to expected demand in next six months (more than adequate/ less than adequate/ adequate).
 |
Table 2: Assessment & Expectations for Order books |
(Percentage responses) |
Survey Quarter |
Total response |
Assessment for Current Quarter |
Expectation for Next Quarter |
Increase |
Decrease |
No change |
Net response |
Increase |
Decrease |
No change |
Net response |
1 |
2 |
3 |
4 |
5 |
6 |
7 |
8 |
9 |
10 |
Jul-Sep 08 |
1032 |
40.8 |
16.4 |
42.8 |
24.4 |
47.5 |
9.0 |
43.5 |
38.5 |
Oct-Dec 08 |
1178 |
32.6 |
25.1 |
42.2 |
7.5 |
44.8 |
9.1 |
46.1 |
35.7 |
Jan-Mar 09 |
1225 |
22.9 |
39.7 |
37.4 |
-16.8 |
37.3 |
16.7 |
46.1 |
20.6 |
Apr-Jun 09 |
1242 |
28.4 |
29.3 |
42.3 |
-0.9 |
31.0 |
24.6 |
44.4 |
6.4 |
Jul-Sep 09 |
1180 |
38.2 |
17.7 |
44.1 |
20.5 |
35.5 |
18.7 |
45.8 |
16.8 |
Oct-Dec 09 |
|
|
|
|
|
43.5 |
11.2 |
45.3 |
32.3 |
i) More companies reported an increase in capacity utilisation turning around negative sentiments, indicating a contraction in rate of Capacity Utilisation of the last two quarters into the growth terrain in the current quarter. The expectation for the next quarter echoed the similar sentiment with higher degree. ii) Level of capacity utilisation - Assessment of Production capacity with regard to expected demand in next six months shows that there will be adequate capacity as net response increased to 5.8 per cent in current quarter (July-September 2009) from 4.6 per cent in previous quarter (April-June 2009). The proportion of companies that expressed about the inadequacy of their production capacity in meeting the demand for next 6 months has decreased to 7.6 per cent from 9.4 per cent. This improvement in higher level of demand vis-à-vis capacity is in tune with the increase level of capacity utilisation in the period.
Table 3: Assessment & Expectations for Pending Orders |
(Percentage responses) |
Survey Quarter |
Total response |
Assessment for Current Quarter |
Expectation for Next Quarter |
Above Normal |
Below Normal |
Normal |
Net response |
Above Normal |
Below Normal |
Normal |
Net response |
1 |
2 |
3 |
4 |
5 |
6 |
7 |
8 |
9 |
10 |
Jul-Sep 08 |
1032 |
16.7 |
7.4 |
76.0 |
9.3 |
10.6 |
8.4 |
80.9 |
2.2 |
Oct-Dec 08 |
1178 |
19.2 |
5.6 |
75.2 |
13.6 |
11.3 |
6.7 |
82.0 |
4.6 |
Jan-Mar 09 |
1225 |
36.3 |
4.3 |
59.4 |
32.0 |
16.9 |
5.4 |
77.8 |
11.5 |
Apr-Jun 09 |
1242 |
29.1 |
4.5 |
66.5 |
24.6 |
28.0 |
4.8 |
59.4 |
23.2 |
Jul-Sep 09 |
1180 |
21.1 |
3.7 |
75.2 |
17.4 |
22.9 |
3.8 |
73.4 |
19.1 |
Oct-Dec 09 |
|
|
|
|
|
15.2 |
4.2 |
80.6 |
11.0 |
 |
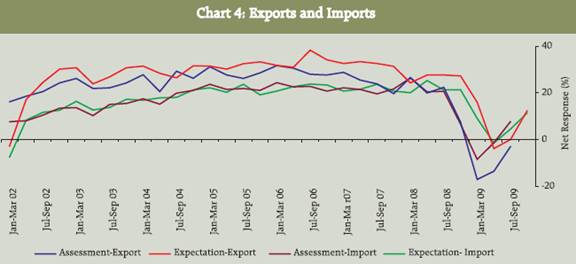
III.1.5. Exports and Imports
The external demand of manufacturing companies is gauged by the survey through their assessment and expectation of Exports and Imports. The companies report their perceptions in the form; increase, no change and decrease in Exports and Imports.
The survey results show that the assessment and expectations about Export growth is recovering progressively in both the quarters. Though the net responses are still in contraction terrain during current quarter, they has improved considerably as compared to previous quarter (-13.5 per cent to -2.9 per cent). Half of the responding companies expect no change in export growth during current quarter; while 58.5 per cent expect no change in ensuing quarter (October-December 2009).
Table 3: Per cent responses under Expectations for Capacity Utilisation |
(Percentage responses) |
Parameter |
Options |
Assessment for quarter |
Expectations for quarter |
Apr-Jun 2009 |
July-Sep 2009 |
July-Sep 2009 |
Oct-Dec 2009 |
1 |
2 |
3 |
4 |
5 |
6 |
Capacity Utilisation (main product) |
Increase |
21.6 |
28.3 |
26.6 |
32.9 |
No Change |
53.1 |
53.5 |
57.5 |
56.2 |
Decrease |
25.3 |
18.2 |
15.9 |
10.9 |
|
Net Response |
-3.7 |
10.1 |
10.7 |
22.0 |
Level of Capacity Utilisation (compared to the average in last 4 quarters) |
Above normal |
8.3 |
10.2 |
8.6 |
10.1 |
Normal |
64.2 |
68.4 |
70.8 |
76.0 |
Below Normal |
27.5 |
21.4 |
20.7 |
13.9 |
|
Net Response |
-19.2 |
-11.2 |
-12.1 |
-3.8 |
Assessment of Production Capacity (with regard to expected demand in next 6 months) |
More than adequate |
14.0 |
13.4 |
14.3 |
13.4 |
Adequate |
76.6 |
79.0 |
76.9 |
79.7 |
Less than adequate |
9.4 |
7.6 |
8.8 |
6.9 |
|
Net Response |
4.6 |
5.8 |
5.5 |
6.5 |
Table 4: Assessment & Expectations for Exports |
(Percentage responses) |
Survey Quarter |
Total response |
Assessment for Current Quarter |
Expectation for Next Quarter |
Increase |
Decrease |
No
change |
Net
response |
Increase |
Decrease |
No
change |
Net
response |
1 |
2 |
3 |
4 |
5 |
6 |
7 |
8 |
9 |
10 |
Jul-Sep 08 |
1032 |
36.0 |
13.6 |
50.4 |
22.4 |
36.4 |
8.7 |
54.9 |
27.7 |
Oct-Dec 08 |
1178 |
27.6 |
20.0 |
52.4 |
7.6 |
36.5 |
9.2 |
54.3 |
27.3 |
Jan-Mar 09 |
1225 |
17.8 |
34.8 |
47.4 |
-17.0 |
30.6 |
14.6 |
54.8 |
16.0 |
Apr-Jun 09 |
1242 |
17.4 |
30.9 |
51.7 |
-13.5 |
19.5 |
23.3 |
57.3 |
-3.8 |
Jul-Sep 09 |
1180 |
20.9 |
23.8 |
55.3 |
-2.9 |
20.6 |
20.5 |
59.0 |
0.1 |
Oct-Dec 09 |
|
|
|
|
|
27.0 |
14.5 |
58.5 |
12.5 |
The net response on assessment and expectation for Import growth shows a speedy recovery. The sentiments have now turned to positive from negative for both the quarters under review indicating that the demand (external and domestic) for manufactured products is picking up in the current quarter as well as for the next quarter. III.2. Financial Situation
The survey assesses sentiments about financial condition through four parameters, viz., Overall Financial Situation, Working Capital Finance Requirement (excluding internal sources of funds), Availability of Finance (both internal and external sources) and Profit Margin.
Table 5: Assessment & Expectations for Imports |
(Percentage responses) |
Survey Quarter |
Total response |
Assessment for Current Quarter |
Expectation for Next Quarter |
Increase |
Decrease |
No change |
Net response |
Increase |
Decrease |
No change |
Net response |
1 |
2 |
3 |
4 |
5 |
6 |
7 |
8 |
9 |
10 |
Jul-Sep 08 |
1032 |
28.5 |
7.8 |
63.8 |
20.7 |
27.4 |
6.1 |
66.5 |
21.3 |
Oct-Dec 08 |
1178 |
20.2 |
13.5 |
66.3 |
6.7 |
26.7 |
5.3 |
67.9 |
21.4 |
Jan-Mar 09 |
1225 |
13.7 |
22.1 |
64.2 |
-8.4 |
19.7 |
10.6 |
69.7 |
9.1 |
Apr-Jun 09 |
1242 |
17.1 |
18.4 |
64.5 |
-1.3 |
14.9 |
16.3 |
68.8 |
-1.4 |
Jul-Sep 09 |
1180 |
21.8 |
14.0 |
64.2 |
7.8 |
17.0 |
12.4 |
70.6 |
4.6 |
Oct-Dec 09 |
|
|
|
|
|
21.3 |
9.8 |
68.9 |
11.5 |
III.2.1. Overall Financial Situation Corporates gauge a positive assessment about the Overall Financial Situation, indubitably, for the current quarter (July-September 2009), as more respondents assessed ‘betterment’ of overall financial situation during the current quarter. The improvement in the net response of 21.8 per cent from 7.0 per cent was large and significant as compared to preceding quarter. The expectations for the ensuing quarter (October-December 2009) also registered an improvement of optimism (net response of 33.5 per cent as compared to 20.0 per cent). The quarterly movements of overall financial situation for the last eight years are presented in the chart below. There was a continuous sliding optimism on Overall Financial Situation since beginning 2008, which has rebounded from last round of the survey.
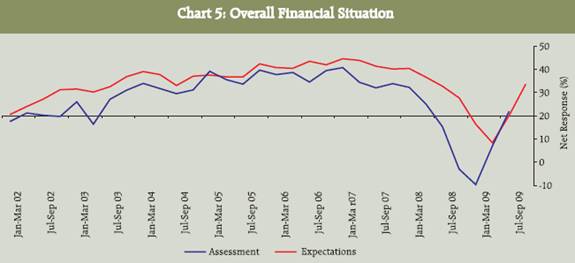 |
Table 6: Assessment & Expectations for Overall Financial Situation |
(Percentage responses) |
Survey Quarter |
Total response |
Assessment for Current Quarter |
Expectation for Next Quarter |
Better |
Worsen |
No change |
Net response |
Better |
Worsen |
No change |
Net response |
1 |
2 |
3 |
4 |
5 |
6 |
7 |
8 |
9 |
10 |
Jul-Sep 08 |
1032 |
31.0 |
15.7 |
53.3 |
15.3 |
39.9 |
7.2 |
53.0 |
32.7 |
Oct-Dec 08 |
1178 |
22.0 |
24.9 |
53.1 |
-2.9 |
37.6 |
9.9 |
52.5 |
27.7 |
Jan-Mar 09 |
1225 |
20.3 |
29.9 |
49.9 |
-9.6 |
31.6 |
15.2 |
53.2 |
16.4 |
Apr-Jun 09 |
1242 |
26.4 |
19.4 |
54.2 |
7.0 |
27.8 |
19.4 |
52.7 |
8.4 |
Jul-Sep 09 |
1180 |
34.3 |
12.5 |
53.2 |
21.8 |
32.8 |
12.8 |
54.4 |
20.0 |
Oct-Dec 09 |
|
|
|
|
|
40.5 |
7.0 |
52.5 |
33.5 |
III.2.2. Working Capital Finance requirement and Availability of Finance
The assessment on the Working Capital Finance Requirement (excluding internal source of funds) for the current quarter register a minor fall; which is mainly due to adequate inventory levels in the last quarter. On the other hand, the improvement is observed in the expectation for ensuing quarter on account of more companies expecting the working capital finance requirement to support the production activities and fewer companies expecting a decline in outlook as compared to the previous quarter. Although about 63 per cent of respondents do not see any change in Availability of finance (from both internal as well as external sources) during the quarters under study, however, the net optimism is enhanced.
The quarterly movements of Working Capital Requirements and Availability of Finance (both internal and external sources), presented in the chart above, shows that for ensuing quarter , the manufacturers’ expect their WCFR to improve marginally, while their sentiments on availability of finance show significant improvement.
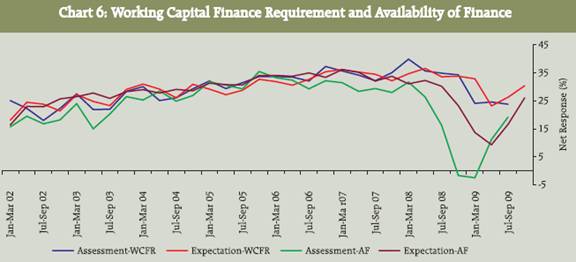 |
Table 7: Assessment & Expectations for Working capital finance requirement |
(Percentage responses) |
Survey Quarter |
Total response |
Assessment for Current Quarter |
Expectation for Next Quarter |
Increase |
Decrease |
No change |
Net response |
Increase |
Decrease |
No change |
Net response |
1 |
2 |
3 |
4 |
5 |
6 |
7 |
8 |
9 |
10 |
Jul-Sep 08 |
1032 |
41.4 |
6.5 |
52.0 |
34.9 |
38.1 |
4.5 |
57.3 |
33.6 |
Oct-Dec 08 |
1178 |
41.1 |
6.8 |
52.1 |
34.3 |
38.1 |
4.3 |
57.7 |
33.8 |
Jan-Mar 09 |
1225 |
36.0 |
11.9 |
52.1 |
24.1 |
37.9 |
5.0 |
57.1 |
32.9 |
Apr-Jun 09 |
1242 |
57.0 |
24.6 |
9.2 |
24.6 |
31.1 |
7.9 |
61.0 |
23.2 |
Jul-Sep 09 |
1180 |
31.2 |
7.4 |
61.4 |
23.8 |
32.3 |
6.0 |
61.7 |
26.3 |
Oct-Dec 09 |
|
|
|
|
|
34.7 |
4.3 |
61.0 |
30.4 |
III.2.3. Profit margin Survey asks manufacturing companies whether in their opinion their profit margin (gross profits as percentage at net sales) is expected to increase, decrease or remain same. The Profit margin in the Jan-Mar 2009 quarter of the survey which was at all time low in the survey history, is picking up from the last survey round (April-June 2009), however, it is still in the contraction terrain in the current round of the survey (July-September 2009). This is due to the persisting pessimistic view of the respondents about Profit margin.
 |
Table 8: Assessment & Expectations for Availability of Finance |
(Percentage responses) |
Survey Quarter |
Total response |
Assessment for Current Quarter |
Expectation for Next Quarter |
Improve |
Worsen |
No change |
Net response |
Improve |
Worsen |
No change |
Net response |
1 |
2 |
3 |
4 |
5 |
6 |
7 |
8 |
9 |
10 |
Jul-Sep 08 |
1032 |
27.7 |
11.5 |
60.8 |
16.2 |
36.1 |
5.9 |
57.9 |
30.2 |
Oct-Dec 08 |
1178 |
21.4 |
23.1 |
55.5 |
-1.7 |
32.1 |
8.8 |
59.0 |
23.3 |
Jan-Mar 09 |
1225 |
19.2 |
21.7 |
59.1 |
-2.5 |
28.7 |
15.0 |
56.3 |
13.7 |
Apr-Jun 09 |
1242 |
24.8 |
13.6 |
61.6 |
11.2 |
23.8 |
14.5 |
61.7 |
9.3 |
Jul-Sep 09 |
1180 |
28.0 |
8.8 |
63.2 |
19.2 |
27.0 |
10.4 |
62.6 |
16.6 |
Oct-Dec 09 |
|
|
|
|
|
31.7 |
5.6 |
62.7 |
26.1 |
Table 9: Assessment & Expectations for Profit margin |
(Percentage responses) |
Survey Quarter |
Total response |
Assessment for Current Quarter |
Expectation for Next Quarter |
Increase |
Decrease |
No change |
Net response |
Increase |
Decrease |
No change |
Net response |
1 |
2 |
3 |
4 |
5 |
6 |
7 |
8 |
9 |
10 |
Jul-Sep 08 |
1032 |
18.1 |
32.8 |
49.0 |
-14.7 |
22.0 |
18.2 |
59.8 |
3.8 |
Oct-Dec 08 |
1178 |
14.4 |
41.0 |
44.6 |
-26.6 |
20.8 |
24.4 |
54.7 |
-3.6 |
Jan-Mar 09 |
1225 |
11.3 |
48.8 |
39.8 |
-37.5 |
16.9 |
29.8 |
53.3 |
-12.9 |
Apr-Jun 09 |
1242 |
13.4 |
38.5 |
48.1 |
-25.1 |
15.4 |
34.0 |
50.6 |
-18.6 |
Jul-Sep 09 |
1180 |
16.9 |
32.0 |
51.1 |
-15.1 |
16.0 |
29.4 |
54.5 |
-13.4 |
Oct-Dec 09 |
|
|
|
|
|
20.2 |
23.0 |
56.8 |
-2.8 |
III.3. Price and Employment Expectation
Three questions related to prices were canvassed in the survey. The question sought increase, decrease or no change in the Cost of Raw Material and those of Selling Prices (ex-factory unit prices); and if there was an increase expected on Selling Prices, enquiries are made about the rate of increase in the Selling Prices (at higher/ lower/similar rate). III.3.1. Cost of raw material
The net response on cost of raw material of the reporting companies declined sharply in both the quarters under review, indicating that the manufactures are more concern on cost of raw material as more respondents opined about increase in the raw material prices as compared to those in preceding quarter. Thus the manufacturing corporates feel that their input price inflation is likely to increase. It is interesting to note that the gloominess for profit margin in the current survey round has reduced compared to previous round; therefore, corporates are at comparatively better place to pass on their cost burden to customers.
 |
Table 10: Assessment & Expectations for Cost of raw material |
(Percentage responses) |
Survey Quarter |
Total response |
Assessment for Current Quarter |
Expectation for Next Quarter |
Increase |
Decrease |
No change |
Net response |
Increase |
Decrease |
No change |
Net response |
1 |
2 |
3 |
4 |
5 |
6 |
7 |
8 |
9 |
10 |
Jul-Sep 08 |
1032 |
1.4 |
80.8 |
17.8 |
-79.4 |
3.1 |
57.8 |
39.1 |
-54.7 |
Oct-Dec 08 |
1178 |
14.1 |
60.1 |
25.8 |
-46 |
3.3 |
64.4 |
32.3 |
-61.1 |
Jan-Mar 09 |
1225 |
29.1 |
37.2 |
33.7 |
-8.1 |
12.3 |
48.0 |
39.7 |
-35.7 |
Apr-Jun 09 |
1242 |
14.3 |
40.6 |
45.1 |
-26.3 |
14.3 |
30.5 |
33.7 |
-16.2 |
Jul-Sep 09 |
1180 |
8.1 |
49.8 |
42.1 |
-41.7 |
8.7 |
35.8 |
55.5 |
-27.1 |
Oct-Dec 09 |
|
|
|
|
|
5.0 |
43.4 |
51.6 |
-38.4 |
III.3.2. Inventory of Raw materials & finished goods (in quantity terms) Survey questionnaire includes two questions about inventory level of the companies during current and ensuing quarter. Manufacturers are solicited to opine on the extent of raw material and finished goods inventory (both in quantity terms) in the form of 3-point scale - above average, average or below average level, where below average inventory was considered an optimistic response as it reflected better inventory management. The average level is computed as average of the levels at the end of four quarters during the corresponding preceding year (Statement I). Majority of the corporate (80-85 per cent) reported ‘average’ (i.e., no change) level of Inventory of raw materials and Inventory of finished goods for the current quarter as well as ensuing quarter. The responses on level of Inventory (raw material and finished goods) in the current quarter shifted from ‘below average’ to ‘average’ as compared to the previous quarter indicating further improvement in the demand conditions.
Table 11: Assessment & Expectations for Cost of raw material for Inventory |
(Percentage responses) |
Parameter |
Options |
Assessment for quarter |
Expectations for quarter |
Apr-Jun 2009 |
July-Sep 2009 |
July-Sep 2009 |
Oct-Dec 2009 |
1 |
2 |
3 |
4 |
5 |
6 |
Inventory of raw material |
Below average |
9.4 |
8.8 |
8.4 |
6.9 |
|
Average |
78.7 |
80.3 |
82.7 |
85.0 |
|
Above average |
11.8 |
10.9 |
8.9 |
8.1 |
|
Net Response |
-2.4 |
-2.1 |
-0.5 |
-1.2 |
Inventory of Finished goods |
Below average |
9.6 |
8.6 |
8.8 |
5.5 |
|
Average |
76.6 |
78.5 |
80.6 |
85.3 |
|
Above average |
13.8 |
12.9 |
10.6 |
9.2 |
|
Net Response |
-4.2 |
-4.3 |
-1.8 |
-3.7 |
Below average is optimistic |
 |
III.3.3. Selling price
Survey seeks responses from manufacturing corporates about ex-factory Selling Prices. In case of multi-product companies, they are requested to take into account the average of the price changes. Optimism level for Selling prices (‘increase in selling price’) for both assessment and expectations has improved, which is mainly due to increase in proportion of ‘no change in selling price’. While 19.2 percent corporates opined about a ‘decline’ in the selling prices in the current quarter, only 13.2 expected this decline to continue in October-December 2009 as well. Among the respondents that viewed an increase in selling prices, 31.3 per cent of respondents viewed increase to be ‘at lower rate’. Sharp decline in respondents who opined about increase in selling prices ‘at higher rate’ was also observed during the period under review.
Table 12: Assessment & Expectations for Selling Price |
(Percentage responses) |
Survey Quarter |
Total response |
Assessment for Current Quarter |
Expectation for Next Quarter |
Increase |
Decrease |
No change |
Net response |
Increase |
Decrease |
No change |
Net response |
1 |
2 |
3 |
4 |
5 |
6 |
7 |
8 |
9 |
10 |
Jul-Sep 08 |
1032 |
41.7 |
8.2 |
50.1 |
33.5 |
29.7 |
8.7 |
61.5 |
21.0 |
Oct-Dec 08 |
1178 |
23.2 |
23.7 |
53.1 |
-0.5 |
34.3 |
8.1 |
57.6 |
26.2 |
Jan-Mar 09 |
1225 |
12.5 |
38.0 |
49.5 |
-25.5 |
21.2 |
17.1 |
61.7 |
4.1 |
Apr-Jun 09 |
1242 |
17.0 |
24.4 |
58.0 |
-7.4 |
14.5 |
23.6 |
61.9 |
-9.1 |
Jul-Sep 09 |
1180 |
19.4 |
19.2 |
61.4 |
0.2 |
17.2 |
17.2 |
65.6 |
0.0 |
Oct-Dec 09 |
|
|
|
|
|
19.2 |
13.2 |
67.6 |
6.0 |
 |
III.3.4. Employment
Industrial Outlook Survey seeks from the companies their perceptions on employment change at their company. Employment includes all cadres comprising full-time, part-time and casual labour. The employment outlook of Indian manufacturing has taken U-turn in the current quarter (July-September 2009). The companies will be net hirers in the current quarter compared to the last quarter (net response from -3.3% to 4.1%). Marked improvement is also observed in the employment expectation for the October-December 2009. Indian manufacturing sector will be a net hirer for the quarters under review. Around 76-77 per cent of companies did not expect any change in their employment position.
Table 13: Assessment & Expectations for Employment outlook |
(Percentage responses) |
Survey Quarter |
Total response |
Assessment for Current Quarter |
Expectation for Next Quarter |
Increase |
Decrease |
No change |
Net response |
Increase |
Decrease |
No change |
Net response |
1 |
2 |
3 |
4 |
5 |
6 |
7 |
8 |
9 |
10 |
Jul-Sep 08 |
1032 |
23.5 |
9.4 |
67.1 |
14.1 |
22.2 |
6.4 |
71.5 |
15.8 |
Oct-Dec 08 |
1178 |
18.7 |
9.3 |
72.0 |
9.4 |
23.1 |
6.5 |
70.4 |
16.6 |
Jan-Mar 09 |
1225 |
11.2 |
19.5 |
69.3 |
-8.3 |
16.0 |
8.3 |
75.7 |
7.7 |
Apr-Jun 09 |
1242 |
11.9 |
15.2 |
72.9 |
-3.3 |
10.5 |
15.6 |
74.0 |
-5.1 |
Jul-Sep 09 |
1180 |
14.2 |
10.1 |
75.7 |
4.1 |
11.5 |
10.0 |
78.6 |
1.5 |
Oct-Dec 09 |
|
|
|
|
|
15.8 |
7.0 |
77.2 |
8.8 |
 |
III.4. Overall business conditions
III.4.1: Overall Business Situation
The Overall Business Situation is a parameter that provides the overall confidence of manufacturing companies. The companies are enquired if their overall business situation would become better/ worsen /remain same. The net response for assessment about the Overall business situation during the current quarter July-September 2009 has improved significantly to 26.3 per cent from the level of 9.3 per cent in the previous quarter. Similarly the net response for expectation has also shown a rising trend (from 24.2 per cent to 39.8 per cent). The net response assessment and expectation for the last six quarters are presented in Table 14 it shows that the trend of sharp declining positive sentiments and rising negative sentiments till Jan-Mar 2009 has now been reversed. These upward movements of assessment and expectations with respect to previous periods under comparison are statistically significant. The movement of the overall business situation since Jan-Mar 2002 quarter is presented in the chart.
Table 14 : Assessment & Expectations of Overall Business Situation |
(Percentage responses) |
Survey Quarter |
Total response |
Assessment for Current Quarter |
Expectation for Next Quarter |
Better |
Worsen |
No change |
Net response |
Better |
Worsen |
No change |
Net response |
1 |
2 |
3 |
4 |
5 |
6 |
7 |
8 |
9 |
10 |
Jul-Sep 08 |
1032 |
39.3 |
16.7 |
44.0 |
22.6 |
49.6 |
7.8 |
42.6 |
41.8 |
Oct-Dec 08 |
1178 |
30.2 |
26.2 |
43.6 |
4.0 |
44.8 |
11.1 |
44.1 |
33.7 |
Jan-Mar 09 |
1225 |
24.1 |
35.2 |
40.7 |
-11.1 |
38.6 |
17.5 |
43.9 |
21.1 |
Apr-Jun 09 |
1242 |
30.7 |
21.4 |
47.9 |
9.3 |
31.8 |
20.6 |
47.6 |
11.2 |
Jul-Sep 09 |
1180 |
39.3 |
13.0 |
47.7 |
26.3 |
38.8 |
14.6 |
46.7 |
24.2 |
Oct-Dec 09 |
|
|
|
|
|
47.2 |
7.4 |
45.4 |
39.8 |
III.4.2: Business Expectation Index
Business Expectation Index gives a single snapshot of the industrial outlook in each study quarter. This index is computed based on weighted average of responses from different industries on selected 9 out of the 19 performance parameters. These parameters are Overall Business Situation, Production, Order Books, Inventory of Raw Materials, Inventory of Finished Goods, Profit Margin, Employment, Exports, and Capacity Utilisation.
For both the quarters under review the Business Expectation Index (BEI) improved, indicating a precise recovery for the Indian manufacturing sector by entering into the growth terrain. The BEI for July-September 2009 was at 107.2 increased from 99.4 and for October-December 2009 it was 116.4 as compared to 109.9 seen in the previous quarter. III.5: Industry-wise analysis3
Transport Equipment (70), Rubber & Plastic products (77), Pharmaceuticals & Medicines (71), Food products (101), Other Machinery & Apparatus (153), Electrical machinery (85), Basic Chemicals (105), Fertilisers (22) industries are generally optimistic about their overall business situation for October-December 2009. They expect demand conditions to improve, and thus higher levels of production and capacity utilisation. Their overall financial situation is good, working capital finance requirement will go up and availability of finance is expected to be comfortable. The Food and Pharmaceuticals companies are expecting an increase in their input prices and expect to pass that on to their customers. The industries having weak, though positive, overall business sentiments are Paper and paper products (37), Diversified (15), Cement (27) Textiles (157).
 |
III.6: Size-wise analysis Paid-up Capital (PUC) and Annual production
Bigger companies (annual production above Rs. 1000 crore) are more positive about overall business & financial situation and working capital finance requirement. The smaller companies (annual production less than Rs 100 crore) are less optimistic about availability of finance than the larger ones. Bigger companies are more positive about domestic and external demand. Smaller firms anticipate the domestic demand to go up but expect a contraction in their exports. The smaller companies feel more pressure on the input price, availability of finance is also lower than their bigger counterparts. Bigger companies are expected to be net hirers; the smaller firms will continue to shed jobs. Though all firms expect a net decline in their profit margins, the small and medium firms are the worst hit. Incidentally the same is inferred based on the analysis on annual production-size wise.
Industry-wise analysis |
Net Response (%) for October-December 2009 |
Industry |
Production |
Financial Situation |
Profit margin |
Employment |
Overall Business Situation |
1 |
2 |
3 |
4 |
5 |
6 |
7 |
1 |
Transport Equipment |
49.3 |
49.3 |
6.9 |
13.9 |
57.2 |
2 |
Rubber & Plastic products |
46.1 |
31.2 |
-2.6 |
15.4 |
48.0 |
3 |
Pharmecutical & Medicines |
37.1 |
38.0 |
2.8 |
15.5 |
45.1 |
4 |
Food products |
34.7 |
44.0 |
10.2 |
18.0 |
43.6 |
5 |
Other Machinery & Appratus |
35.7 |
35.3 |
-5.3 |
3.3 |
43.2 |
6 |
Electrical machinery |
54.1 |
32.9 |
-10.9 |
21.1 |
42.3 |
7 |
Basic Chemicals |
39.6 |
35.3 |
0.0 |
6.6 |
41.9 |
8 |
Fertilisers |
27.3 |
27.3 |
10.0 |
18.2 |
41.0 |
9 |
Basic Metals & Metal products |
33.6 |
32.6 |
0.0 |
8.5 |
40.3 |
10 |
Wood & wood products |
14.3 |
42.9 |
7.7 |
-7.1 |
35.8 |
11 |
Other industries |
14.8 |
24.2 |
-7.5 |
-6.4 |
30.2 |
12 |
Textiles |
28.2 |
25.6 |
-6.5 |
7.0 |
30.0 |
13 |
Cement |
40.7 |
40.7 |
-22.2 |
0.0 |
29.6 |
14 |
Diversified companies |
21.5 |
33.3 |
-20.0 |
6.7 |
26.7 |
15 |
Paper & Paper products |
19.5 |
16.2 |
-18.9 |
2.7 |
21.6 |
All Industries |
35.0 |
33.5 |
-2.8 |
8.8 |
39.8 |
Size-wise analysis Annual production and Paid-up Capital (PUC) |
|
Production- wise |
PUC- wise |
Small firms-(Production less than Rs. 100 Crore) |
Medium firms-(Production more than Rs. 100 Crore& less than 1000Cr) |
Large
firms-(Production Rs. 1000 Crore or
more) |
Small Firms-(PUC
|
Medium firms-(PUC>1Cr& < 100Cr) |
Large
firms- (PUC
> Rs. 100
Cr) |
1 |
2 |
3 |
4 |
5 |
6 |
7 |
8 |
9 |
10 |
11 |
12 |
13 |
|
Rd |
Rd |
Rd |
Rd |
Rd |
Rd |
Rd |
Rd |
Rd |
Rd |
Rd |
Rd |
Characteristic |
46 |
47 |
46 |
47 |
46 |
47 |
46 |
47 |
46 |
47 |
46 |
47 |
Production |
15.8 |
28.4 |
26.2 |
38.9 |
38.8 |
47.4 |
7.7 |
23.6 |
23.2 |
35.1 |
43.7 |
55.0 |
Order book |
9.7 |
28.1 |
21.1 |
35.2 |
34.1 |
41.3 |
8.6 |
26.4 |
17.1 |
32.2 |
31.1 |
46.9 |
Exports |
-5.9 |
3.2 |
3.5 |
18.2 |
11.1 |
27.0 |
-9.6 |
-1.0 |
1.4 |
13.9 |
-5.2 |
14.9 |
Raw material inventory |
-0.5 |
1.1 |
2.1 |
-4.1 |
0.0 |
-1.5 |
-3.9 |
-5.9 |
1.0 |
-0.4 |
2.0 |
-4.9 |
Finished goods inventory |
0.6 |
-2.6 |
3.2 |
-4.8 |
1.9 |
-3.9 |
3.2 |
-4.4 |
1.5 |
-3.6 |
4.0 |
-3.5 |
Capacity utilisation |
2.4 |
16.7 |
15.4 |
25.1 |
27.2 |
31.3 |
-2.2 |
14.4 |
11.9 |
22.4 |
17.3 |
30.0 |
Input price |
-28.6 |
-41.9 |
-28.2 |
-35.5 |
-12.0 |
-35.2 |
-28.5 |
-39.4 |
-27.7 |
-39.0 |
-12.3 |
-27.8 |
Output price |
-1.8 |
4.0 |
0.2 |
9.2 |
6.0 |
3.2 |
-2.3 |
2.5 |
0.6 |
6.9 |
-5.8 |
-1.6 |
Employment |
-2.4 |
5.3 |
4.8 |
11.7 |
4.9 |
12.1 |
-5.4 |
3.3 |
2.5 |
9.5 |
2.0 |
8.2 |
Overall financial situation |
16.0 |
26.4 |
22.7 |
39.4 |
25.0 |
41.2 |
12.2 |
23.8 |
21.1 |
34.6 |
17.3 |
35.0 |
Working capital finance requirement |
23.1 |
28.3 |
28.2 |
31.7 |
32.1 |
34.4 |
14.4 |
18.0 |
27.5 |
31.7 |
33.4 |
34.5 |
5: Constraints for attaining the normal production level
The responses for attaining the normal production level during the quarter July-September 2009 has remained at 56 per cent which is slightly lower compared to last survey round (61 per cent)). The constraints reported are due to ‘Lack of domestic demand’, ‘Lack of export demand’ ‘Uncertainty of economic environment’, and ‘Shortage of Power’. The major industry groups for which higher proportion of companies reported production constraints are ‘Diversified’ (73 per cent), ‘Paper and paper products’ (73 per cent) ‘Textiles’ (59 per cent). On the other end of the spectrum, only 28.6 per cent of ‘Wood and wood products’, 40.8 per cent of ‘Pharmaceutical’ companies reported production constraints. Smaller companies, in terms of their annual production, paid-up capital and lower level of capacity utilisation felt more production constraints than the bigger ones. Out of 655 companies who reported output constraints during the current quarter (July-September 2009), 80 per cent of companies belong to paid up capital class ‘Upto Rs. 25 crore’, whereas 4.4 per cent of the bigger companies in paid up capital class of ‘Above Rs.100 crore’ reported a similar view. About 66.1 per cent of companies in annual production class ‘Upto Rs.100 crore’ reported output constraints during current quarter whereas 45.2 per cent of companies in higher annual production class of ‘Above Rs.1000 crore’ reported similar views.
Business Confidence Surveys of other Agencies
Comparison of other business indices along with their survey highlights are briefly outlined below.
Business Confidence Surveys of other Agencies |
Parameter |
Dun & Bradstreet |
NCAER |
FICCI |
PMI |
RBI |
1 |
2 |
3 |
4 |
5 |
6 |
Coverage |
Service and Manufacturing
companies in both Public and
Private Sector |
Manufacturing companies |
Manufacturing companies in
Private & Public Sector |
Sample size |
- |
528 |
372 |
<500 |
1180 |
Index |
Business
Optimism
Index |
Business
Confidence
Index |
Overall
Business
Confidence
Index |
Purchasing
Managers'
Index |
Business
Expectations
Index |
Period |
Jul-Sep 2009 |
Jul-09 |
Q1 2009-10 |
Aug-09 |
Oct-Dec 2009 |
Index based on current survey |
132.1 |
118.6 |
67.2 |
53.2 |
116.4 |
Index based on previous survey |
93.8 |
81.6 |
64.1 |
55.4 |
109.9 |
Index based on one year back |
136.5 |
125.8 |
52.5 |
57.9 |
118.9 |
survey |
|
|
|
|
|
% change q-o-q |
40.8 |
45.3 |
4.8 |
-4.0* |
5.9 |
% change y-o-y |
-3.2 |
-5.7 |
28.0 |
-8.1 |
-2.1 |
* Change over previous month |
 |
Survey Results and Official Statistics
The Business Expectations Indices (BEI) based on the information gathered on critical parameters in the Industrial Outlook Survey provides the private manufacturing sector’s aggregate assessment of the current quarter and outlook for the ensuing quarter. Chart 14 shows the co-movements of annual growth rates of quarterly GDP-Manufacturing (at 1999-00 prices), IIP-Manufacturing (base: 1993-94=100) and the BEI based on assessment and expectations where movements in BEI appear to be closely leading the official output indicators released subsequently.
 |
Statement 1: Assessment of the Industrial performance for the July- September 2009 & Expectations of the Industrial performance for the quarter October-December 2009 |
(Percentage of responding companies) |
Parameter |
Assessment (April-June 2009) |
Expectations
(October-December 2009) |
Scenario |
Scenario |
Optimistic (Positive) |
Pessimistic (Negative) |
No Change |
Net
response
(Col. 2 -
Col. 3) |
Optimistic (Positive) |
Pessimistic (Negative) |
No Change |
Net
response
(Col. 6- Col. 7) |
1 |
2 |
3 |
4 |
5 |
6 |
7 |
8 |
9 |
1. Overall Business Situation |
39.3 |
13.0 |
47.7 |
26.3 |
47.2 |
7.4 |
45.4 |
39.8 |
2. Financial Situation |
34.3 |
12.5 |
53.2 |
21.8 |
40.5 |
7.0 |
52.5 |
33.5 |
3. Working Capital Finance requirement |
31.2 |
7.4 |
61.4 |
23.8 |
34.7 |
4.3 |
61.0 |
30.4 |
4. Availability of Finance |
28.0 |
8.8 |
63.2 |
19.2 |
31.7 |
5.6 |
62.7 |
26.1 |
5. Production |
40.9 |
18.3 |
40.8 |
22.6 |
46.0 |
11.0 |
43.0 |
35.0 |
6. Order Books |
38.2 |
17.7 |
44.1 |
20.5 |
43.5 |
11.2 |
45.3 |
32.3 |
7. Pending Orders, if applicable |
21.1 |
3.7 |
75.2 |
17.4 |
15.2 |
4.2 |
80.6 |
11.0 |
8. Cost of raw material |
8.1 |
49.8 |
42.1 |
-41.7 |
5.0 |
43.4 |
51.6 |
-38.4 |
9. Inventory of Raw Material |
8.8 |
10.9 |
80.3 |
-2.1 |
6.9 |
8.1 |
85.0 |
-1.2 |
10. Inventory of Finished goods |
8.6 |
12.9 |
78.5 |
-4.3 |
5.5 |
9.2 |
85.3 |
-3.7 |
11. Capacity Utilisation (Main product) |
28.3 |
18.2 |
53.5 |
10.1 |
32.9 |
10.9 |
56.2 |
22.0 |
12. Level of Capacity Utilisation (Compared to the average in preceding four quarters) |
10.2 |
21.4 |
68.4 |
-11.2 |
10.1 |
13.9 |
76.0 |
-3.8 |
13. Assessment of the Production Capacity (With regard to expected demand in next six months) |
13.4 |
7.6 |
79.0 |
5.8 |
13.4 |
6.9 |
79.7 |
6.5 |
14. Employment in the Company |
14.2 |
10.1 |
75.7 |
4.1 |
15.8 |
7.0 |
77.2 |
8.8 |
15. Exports, if applicable |
20.9 |
23.8 |
55.3 |
-2.9 |
27.0 |
14.5 |
58.5 |
12.5 |
16. Imports, if any |
21.8 |
14.0 |
64.2 |
7.8 |
21.3 |
9.8 |
68.9 |
11.5 |
17. Selling Prices |
19.4 |
19.2 |
61.4 |
0.2 |
19.2 |
13.2 |
67.6 |
6.0 |
18. If Increase Expected in Selling Prices, rate of increase |
31.3 |
8.1 |
60.6 |
23.2 |
28.1 |
8.7 |
63.2 |
19.4 |
19. Profit Margin |
16.9 |
32.0 |
51.1 |
-15.1 |
20.2 |
23.0 |
56.8 |
-2.8 |
Statement 2: Net Response on Assessment of Industrial Performance Over the Latest Six Quarterly Rounds of the Industrial Outlook Survey |
(Per cent) |
Parameter |
Optimistic
Response |
Apr-Jun
2008
(1039) |
Jul-Sep
2008
(1032) |
Oct-Dec
2008
(1178) |
Jan-Mar
2009
(1225) |
Apr-Jun
2009
(1242) |
Jul-Sep
2009
(1180) |
1 |
2 |
3 |
4 |
5 |
6 |
7 |
8 |
1. Overall business situation |
Better |
31.0 |
22.6 |
4.0 |
-11.1 |
9.3 |
26.3 |
2. Financial situation |
Better |
25.1 |
15.3 |
-2.9 |
-9.6 |
7.0 |
21.8 |
3. Working capital finance requirement |
Increase |
35.7 |
34.9 |
34.3 |
24.1 |
24.6 |
23.8 |
4. Availability of finance |
Improve |
26.4 |
16.2 |
-1.7 |
-2.5 |
11.2 |
19.2 |
5. Production |
Increase |
33.6 |
25.2 |
11.1 |
-8.0 |
6.9 |
22.6 |
6. Order books |
Increase |
29.7 |
24.4 |
7.5 |
-16.8 |
-0.9 |
20.5 |
7. Pending Orders, if applicable |
Below normal |
5.8 |
9.3 |
13.6 |
32.0 |
24.6 |
17.4 |
8. Cost of raw material |
Decrease |
-68.9 |
-79.4 |
-46.0 |
-8.1 |
-26.3 |
-41.7 |
9. Inventory of raw material |
Below average |
-4.3 |
-7.0 |
-4.8 |
-1.8 |
-2.4 |
-2.1 |
10. Inventory of finished goods |
Below average |
-3.9 |
-4.0 |
-8.4 |
-13.1 |
-4.2 |
-4.3 |
11. Capacity utilization (Main product) |
Increase |
17.7 |
13.6 |
1.7 |
-16.3 |
-3.7 |
10.1 |
12. Level of capacity utilization (Compared to the average in preceding four quarters) |
Above normal |
-1.5 |
-4.1 |
-12.0 |
-29.3 |
-19.2 |
-11.2 |
13. Assessment of the production capacity (With regard to expected demand in next six months) |
More than adequate |
4.0 |
5.0 |
12.1 |
8.3 |
4.6 |
5.8 |
14. Employment in the company |
Increase |
16.4 |
14.1 |
9.4 |
-8.3 |
-3.3 |
4.1 |
15. Exports, if applicable |
Increase |
20.0 |
22.4 |
7.6 |
-17.0 |
-13.5 |
-2.9 |
16. Imports, if any |
Increase |
20.5 |
20.7 |
6.7 |
-8.4 |
-1.3 |
7.8 |
17. Selling prices are expected to |
Increase |
23.6 |
33.5 |
-0.5 |
-25.5 |
-7.4 |
0.2 |
18. If increase expected in selling prices |
Increase at lower rate |
-2.4 |
-0.5 |
1.2 |
31.7 |
11.0 |
23.2 |
19. Profit margin |
Increase |
-5.3 |
-14.7 |
-26.6 |
-37.5 |
-25.1 |
-15.1 |
Note: Italicised figures in bracket represent number of companies covered in the report |
Statement 3 : Net Response on Expectations of Industrial Performance Over the Latest Six Quarterly Rounds of the Industrial Outlook Survey |
(Per cent) |
Parameter |
Optimistic
Response |
July-Sep
2008
(1039) |
Oct-Dec
2008
(1032) |
Jan-Mar
2009
(1178) |
Apr-Jun
2009
(1225) |
July-Sep
2009
(1242) |
Oct-Dec
2009
(1180) |
1 |
2 |
3 |
4 |
5 |
6 |
7 |
8 |
1 |
Overall business situation |
Better |
41.8 |
33.7 |
21.1 |
11.2 |
24.2 |
39.8 |
2 |
Financial situation |
Better |
32.7 |
27.7 |
16.4 |
8.4 |
20.0 |
33.5 |
3 |
Working capital finance requirement |
Increase |
33.6 |
33.8 |
32.9 |
23.2 |
26.3 |
30.4 |
4 |
Availability of finance |
Improve |
30.2 |
23.3 |
13.7 |
9.3 |
16.6 |
26.1 |
5 |
Production |
Increase |
43.5 |
39.8 |
26.0 |
9.9 |
22.4 |
35.0 |
6 |
Order books |
Increase |
38.5 |
35.7 |
20.6 |
6.4 |
16.8 |
32.3 |
7 |
Pending Orders, if applicable |
Below normal |
2.2 |
4.6 |
11.5 |
23.2 |
19.1 |
11.0 |
8 |
Cost of raw material |
Decrease |
-54.7 |
-61.1 |
-35.7 |
-16.2 |
-27.1 |
-38.4 |
9 |
Inventory of raw material |
Below average |
-3.8 |
-7.6 |
-3.3 |
1.1 |
-0.5 |
-1.2 |
10 |
Inventory of finished goods |
Below average |
-1.5 |
-4.3 |
-4.4 |
-4.4 |
-1.8 |
-3.7 |
11 |
Capacity utilization (Main product) |
Increase |
22.2 |
26.4 |
12.3 |
-0.7 |
10.7 |
22.0 |
12 |
Level of capacity utilization (Compared to the average in preceding four quarters) |
Above normal |
3.6 |
-0.5 |
-7.4 |
-20.8 |
-12.1 |
-3.8 |
13 |
Assessment of the production capacity (With regard to expected demand in next six months) |
More than adequate |
4.6 |
5.7 |
11.8 |
8.9 |
5.5 |
6.5 |
14 |
Employment in the company |
Increase |
15.8 |
16.6 |
7.7 |
-5.1 |
1.5 |
8.8 |
15 |
Exports, if applicable |
Increase |
27.7 |
27.3 |
16.0 |
-3.8 |
0.1 |
12.5 |
16 |
Imports, if any |
Increase |
21.3 |
21.4 |
9.1 |
-1.4 |
4.6 |
11.5 |
17 |
Selling prices are expected to |
Increase |
21.0 |
26.2 |
4.1 |
-9.1 |
0 |
6.0 |
18 |
If increase expected in selling prices |
Increase at lower rate |
3.0 |
0.6 |
0.9 |
25.9 |
-100.0 |
19.4 |
19 |
Profit margin |
Increase |
3.8 |
-3.6 |
-12.9 |
-18.6 |
-13.4 |
-2.8 |
Note: Italicised figures in bracket represent number of companies covered in the report |
Statement 4: Comparative scenarios pertaining to Assessment for the Current Quarter and Expectations for the Next Quarter based on the Net Responses for all parameters from a year ago, previous and current quarter surveys (i.e. Round 43, 46 and 47 respectively) |
Parameter |
Optimism
Criteria |
Assessment |
Expectations |
Net Response (%) |
Differences in net
response of current
quarter of current
survey over current
quarter of |
Net Response (%) |
Differences in net
response of next
quarter of current
survey over current
quarter of |
Current
quarter
of a year
ago
survey |
Current
quarter
of
previous
survey |
Current
quarter
of
current
survey |
A year
ago
survey |
Pervious
quarter
survey |
Next
quarter
of a year
ago
survey |
Next
quarter
previous
of
survey |
Next
quarter
of
current
survey |
A year
ago
survey |
Pervious
quarter
survey |
July-
Sept 08 |
Apr-
Jun 09 |
July-
Sept 09 |
(5)-(3) |
(5)-(4) |
Oct-
Dec 08 |
July-
Sept 09 |
Oct-
Dec 09 |
(10)-(8) |
(10)-(9) |
1 |
2 |
3 |
4 |
5 |
6 |
7 |
8 |
9 |
10 |
11 |
12 |
1. Overall business situation |
Better |
22.6 |
9.3 |
26.3 |
3.7 |
17.0 |
33.7 |
24.2 |
39.8 |
6.1 |
15.6 |
2. Financial situation |
Better |
15.3 |
7.0 |
21.8 |
6.5 |
14.8 |
27.7 |
20.0 |
33.5 |
5.8 |
13.5 |
3. Working capital finance requirement |
Increase |
34.9 |
24.6 |
23.8 |
-11.1 |
-0.8 |
33.8 |
26.3 |
30.4 |
-3.4 |
4.1 |
4. Availability of finance |
Improve |
16.2 |
11.2 |
19.2 |
3.0 |
8.0 |
23.3 |
16.6 |
26.1 |
2.8 |
9.5 |
5. Production |
Increase |
25.2 |
6.9 |
22.6 |
-2.6 |
15.7 |
39.8 |
22.4 |
35.0 |
-4.8 |
12.6 |
6. Order books |
Increase |
24.4 |
-0.9 |
20.5 |
-3.9 |
21.4 |
35.7 |
16.8 |
32.3 |
-3.4 |
15.5 |
7. Pending Orders, if applicable |
Below normal |
9.3 |
24.6 |
17.4 |
8.1 |
-7.2 |
4.6 |
19.1 |
11.0 |
6.4 |
-8.1 |
8. Cost of raw material |
Decrease |
-79.4 |
-26.3 |
-41.7 |
37.7 |
-15.4 |
-61.1 |
-27.1 |
-38.4 |
22.7 |
-11.3 |
9. Inventory of raw material |
Below average |
-7.0 |
-2.4 |
-2.1 |
4.9 |
0.3 |
-7.6 |
-0.5 |
-1.2 |
6.4 |
-0.7 |
10. Inventory of finished goods |
Below average |
-4.0 |
-4.2 |
-4.3 |
-0.3 |
-0.1 |
-4.3 |
-1.8 |
-3.7 |
0.6 |
-1.9 |
11. Capacity utilization (Main Product) |
Increase |
13.6 |
-3.7 |
10.1 |
-3.5 |
13.8 |
26.4 |
10.7 |
22.0 |
-4.4 |
11.3 |
12. Level of capacity utilization (Compared to the average in preceding four quarters) |
Above normal |
-4.1 |
-19.2 |
-11.2 |
-7.1 |
8.0 |
-0.5 |
-12.1 |
-3.8 |
-3.3 |
8.3 |
13. Assessment of the production capacity (With regard to expected demand in next six months) |
More than adequate |
5.0 |
4.6 |
5.8 |
0.8 |
1.2 |
5.7 |
5.5 |
6.5 |
0.8 |
1.0 |
14. Employment in the company |
Increase |
14.1 |
-3.3 |
4.1 |
-10.0 |
7.4 |
16.6 |
1.5 |
8.8 |
-7.8 |
7.3 |
15. Exports, if applicable |
Increase |
22.4 |
-13.5 |
-2.9 |
-25.3 |
10.6 |
27.3 |
0.1 |
12.5 |
-14.8 |
12.4 |
16. Imports, if any |
Increase |
20.7 |
-1.3 |
7.8 |
-12.9 |
9.1 |
21.4 |
4.6 |
11.5 |
-9.9 |
6.9 |
17. Selling prices are expected to |
Increase |
33.5 |
-7.4 |
0.2 |
-33.3 |
7.6 |
26.2 |
0.0 |
6.0 |
-20.2 |
6.0 |
18. If increase expected in selling prices |
Increase at lower rate |
-0.5 |
11.0 |
23.2 |
23.7 |
12.2 |
0.6 |
-100.0 |
19.4 |
18.8 |
119.4 |
19. Profit margin |
Increase |
-14.7 |
-25.1 |
-15.1 |
-0.4 |
10.0 |
-3.6 |
-13.4 |
-2.8 |
0.8 |
10.6 |
Statement 5 : Business Expectations Index based on Assessment and Expectations |
Quarter |
Assessment |
Expectations |
Index |
Change over
previous
quarter |
Change over
previous
year |
Index |
Change over
previous
quarter |
Change over
previous
year |
1 |
2 |
3 |
4 |
5 |
6 |
7 |
Jan-Mar 2000 |
122.8 |
— |
— |
— |
— |
— |
Apr-Jun 2000 |
115.2 |
-7.6 |
— |
125.5 |
— |
— |
Jul-Sep 2000 |
116.1 |
0.9 |
— |
126.1 |
0.6 |
— |
Oct-Dec 2000 |
113.9 |
-2.2 |
— |
124.4 |
-1.7 |
— |
Jan-Mar 2001 |
115.2 |
1.3 |
-7.6 |
122.5 |
-1.8 |
— |
Apr-Jun 2001 |
109.9 |
-5.3 |
-5.3 |
120.7 |
-1.8 |
-4.8 |
Jul-Sep 2001 |
108.7 |
-1.3 |
-7.4 |
118.9 |
-1.8 |
-7.2 |
Oct-Dec 2001 |
100.7 |
-8.0 |
-13.2 |
119.5 |
0.6 |
-4.9 |
Jan-Mar 2002 |
108.4 |
7.7 |
-6.8 |
105.3 |
-14.2 |
-17.3 |
Apr-Jun 2002 |
110.8 |
2.4 |
0.9 |
112.3 |
7.0 |
-8.5 |
Jul-Sep 2002 |
113.2 |
2.4 |
4.5 |
116.7 |
4.4 |
-2.2 |
Oct-Dec 2002 |
113.8 |
0.6 |
13.1 |
121.2 |
4.6 |
1.7 |
Jan-Mar 2003 |
118.4 |
4.6 |
10.0 |
119.7 |
-1.6 |
14.4 |
Apr-Jun 2003 |
109.8 |
-8.6 |
-1.0 |
117.8 |
-1.8 |
5.6 |
Jul-Sep 2003 |
114.3 |
4.5 |
1.1 |
117.2 |
-0.7 |
0.5 |
Oct-Dec 2003 |
119.8 |
5.4 |
5.9 |
122.1 |
4.9 |
0.8 |
Jan-Mar 2004 |
121.4 |
1.7 |
3.0 |
122.2 |
0.2 |
2.6 |
Apr-Jun 2004 |
118.4 |
-3.0 |
8.6 |
121.5 |
-0.7 |
3.7 |
Jul-Sep 2004 |
116.9 |
-1.5 |
2.6 |
120.0 |
-1.5 |
2.9 |
Oct-Dec 2004 |
122.0 |
5.1 |
2.2 |
121.5 |
1.5 |
-0.6 |
Jan-Mar 2005 |
122.5 |
0.5 |
1.1 |
123.2 |
1.7 |
1.0 |
Apr-Jun 2005 |
117.5 |
-5.0 |
-0.9 |
120.7 |
-2.5 |
-0.8 |
Jul-Sep 2005 |
114.9 |
-2.6 |
-2.0 |
119.6 |
-1.1 |
-0.4 |
Oct-Dec 2005 |
124.3 |
9.4 |
2.3 |
122.7 |
3.1 |
1.2 |
Jan-Mar 2006 |
120.7 |
-3.6 |
-1.8 |
125.7 |
3.0 |
2.5 |
Apr-Jun 2006 |
121.8 |
1.1 |
4.3 |
120.5 |
-5.2 |
-0.2 |
Jul-Sep 2006 |
120.7 |
-1.1 |
5.8 |
126.5 |
6.0 |
6.9 |
Oct-Dec 2006 |
123.9 |
3.2 |
-0.4 |
125.3 |
-1.2 |
2.6 |
Jan-Mar 2007 |
127.7 |
3.8 |
7.0 |
126.5 |
1.2 |
0.8 |
Apr-Jun 2007 |
115.8 |
-11.9 |
-6.0 |
127.5 |
1.0 |
7.0 |
Jul-Sep 2007 |
118.9 |
3.1 |
-1.8 |
121.1 |
-6.4 |
-5.4 |
Oct-Dec 2007 |
115.9 |
-3.0 |
-8.0 |
124.4 |
3.3 |
-0.9 |
Jan-Mar 2008 |
122.8 |
6.9 |
-4.9 |
118.6 |
-5.8 |
-7.9 |
Apr-Jun 2008 |
116.2 |
-6.6 |
0.4 |
123.2 |
4.6 |
-4.3 |
Jul-Sep 2008 |
113.4 |
-2.8 |
-5.5 |
122.1 |
-1.1 |
1.0 |
Oct-Dec 2008 |
104.1 |
-9.3 |
-11.8 |
118.9 |
-3.2 |
-5.5 |
Jan-Mar 2009 |
82.6 |
-21.5 |
-40.2 |
111.9 |
-7.0 |
-6.7 |
Apr-Jun 2009 |
99.4 |
16.8 |
-16.8 |
96.4 |
-15.5 |
-26.8 |
Jul-Sep 2009 |
107.2 |
7.8 |
-6.2 |
109.9 |
13.5 |
-12.2 |
Oct-Dec 2009 |
|
|
|
116.4 |
6.5 |
-2.5 |
* Prepared in the Survey Division of Department of Statistics and Information Management. This is in continuation to the article ‘Quarterly Industrial Outlook Surveys: Trends since 2001’ published in October 2009 Bulletin. 1 The methodology used for Analysis of Survey Data has been provided in the article Quarterly Industrial Outlook Surveys: Trends since 2001 in October 2009 Bulletin. 2 Only erroneous (incomplete or improperly filled-in schedules) are discarded; however, these companies are not deleted from the master permanently and are considered for future rounds of this survey. 3(Figures in bracket represent number of companies) |