Quarterly Industrial Outlook Surveys: Trends since 2000-01* The Reserve Bank of India has been conducting the Industrial Outlook Survey (IOS) on a quarterly basis since 1998. The Survey gives insights into the perception of the private corporate sector engaged in manufacturing activities about their own performance and prospects. The survey covers selected nongovernment non-financial private and public limited companies with a good size/ industry representation. The assessment of business sentiments for the current quarter and expectations for the ensuing quarter are based on qualitative responses on 19 major parameters covering overall business situation, financial situation, demand indicators, price and employment expectations, profit margins, etc. The time series movements in these parameters of the survey show a steady growth in economy from 2002 to mid 2008, a decline in tandem with the global recession thereafter and a recovery in the April-June 2009 quarter. An empirical analysis of various survey rounds shows that the survey indicators are able to capture the turning points in the movements of key macroeconomic aggregates, thereby providing good leading indicators of the manufacturing sector. The survey provides useful forward looking inputs for policymakers, analysts and business alike. The IOS results are being published in concise form in the Reserve Bank’s quarterly publication ‘Macroeconomic and Monetary Developments’ since 2005. The Reserve Bank’s internal Working Group on Surveys conducted empirical analysis of the survey data and found that the survey has stabilised over the years. In its report of August 20091 the Working Group noted that the IOS is meeting its objective in providing useful forward looking inputs for monetary policy and recommended that the detailed results of the comparable rounds of the survey should be placed in public domain.
In light of the above, this detailed article, first in the series, presents the time series movements of the survey findings since Round 10 (April-June 2000) after which consistent times series data on the survey results are available. Introduction
The Business Expectations or Business Tendency (BT) surveys are important means of generating timely information on short-term economic developments. These surveys collect information from business managers on their assessment of the current economic situation and their perceptions and intentions for the immediate future (say, quarter or a year ahead). The surveys usually ask for qualitative information and the questionnaire is designed in such a way that the respondents are able to complete it easily and quickly. BT surveys cover a number of variables selected for their ability to gauge ensuing business environment, monitor business cycle and include information on critical guiding variables which cannot be quantified (e.g., overall business situation, production constraints and investment climate).
Business Tendency surveys are conducted in developed economies, like, the USA, the UK, Japan and other member countries of Organisation for Economic Cooperation and Development (OECD), transition economies of Central/Eastern Europe and in the countries of the Asia-Pacific region. In many countries multiple BT surveys are conducted. International agencies, like, OECD, European Union, Asian Development Bank (ADB) and UNEconomic and Social Council for Asia and Pacific (ESCAP), have been working towards harmonisation of these surveys to achieve co-coordinated and comparable BT surveys. In addition to giving an insight into the corporate sector’s perception about its own performance and prospects, the indicator series available from BT surveys are useful in the construction of leading indicators for the business cycle analysis. The short-term outlook as gauged through BT surveys is expected to be useful in addition to central banks, for users in the Government, corporate sector, business analysts, and general public.
II. Background of RBI’s Industrial Outlook Survey
The Reserve Bank has been conducting quarterly Industrial Outlook Survey since 1998. The survey is non-statutory and response is voluntary. The survey is conducted with a view to gain insights into the performance and assessment/prospect of the manufacturing private corporate sector, with regard to economic and industrial environment. It was felt that a regular survey of industrial credit, output and inventory of the private industrial sector would supplement the existing information base and also provide industry feedback for input in policy making by assessing the performance and prospects of the industrial economy. In the initial rounds, the survey collected quantitative data and quarterly growth rates on output, capacity utilisation, order books outstanding, and inventory holding from the industrial units. The quantitative and qualitative information on demand factors such as output, order books, capacity utilisation, working capital finance and supply factors such as credit extended by commercial banks to the private industrial units and their perceptions on credit related aspects were collected. It also covered the expectations on selling price, to get an advanced indicator for movements in price level of manufactured products.
Based on the experience gained from the initial rounds of the survey, the schedule was revised and the quantitative block was removed as its non-response was high. The survey became largely qualitative from 2002 (Round 19), though the questions on paid-up capital and annual production were kept to get the information on size of the responding companies. In 2005 (Round 31), the question on capacity utilisation was also introduced. Information on size was collected in class intervals and actual numbers were not sought. A consistent set of time series for the survey is available from April-June 2000. The present schedule is given in Annex I.
In the first two rounds of the survey years, in addition to non-government public limited companies various industry associations/chambers of commerce were addressed to get required information from the point of view of demand for credit. However, the schedule canvassed with industry associations/chambers of commerce was discontinued from the third round onwards due to very poor response of these associations and to avoid possible bias in the responses of the companies, given the fact that there were other channels of gathering relevant information from such agencies. To obtain the supply side information, the branches of scheduled commercial banks were addressed; however, this was also discontinued from 16th Round as the similar information was available with the Reserve Bank from the regular consultations with bankers.
The survey gives indications on the future direction of performance of the private manufacturing sector ahead of other official statistics.
III. Data Coverage and Methodology
III.1 Sample Size
The survey sample covers about 2500 non-government non-financial public limited companies, mostly with paid up capital above Rs. 50 lakh in the manufacturing sector. A fixed panel of respondents is used for this survey with periodic updation (addition of new companies or deletion of closed/merged companies). The sample is chosen so as to get a good representation of size and industry.
111.2 Response rate
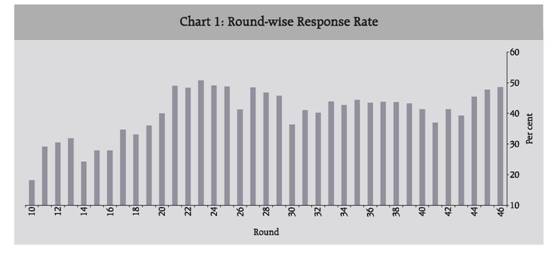
From among the list of companies identified for the survey, in the initial survey rounds response rate was very low (around 30 per cent). Over the period the response has improved to around 45-50 per cent. The response rate is very good considering the non-statutory nature of the survey. Details of response are presented in Chart 1.
111.3 The Survey Schedule The present survey schedule predominantly consists of qualitative questions (Annex I) and the target respondents are senior management personnel or finance heads of the companies. The current schedule runs into two pages containing five blocks canvassed on a quarterly basis and an additional Block 6 is canvassed annually. Block 1 collects information about location and contact details of the respondent company. Block 2 pertains to information of three major products (in terms of their sales) manufactured by company and on that basis company gets classified into different industry groups. Block 3 seeks size details of the company in terms of paid-up capital, annual production and current level of capacity utilisation, the information being sought in pre-specified ranges. Production constraints faced by the company during the quarter and reasons thereof are collected through Block 4.
Block 5 pertains to qualitative questions on 19 core parameters which include Overall Business Situation, Financial Situation, Working Capital Finance Requirement, Availability of Finance, Production, Order Books, Cost of Raw Material, Inventory Levels (both raw material and finished goods), Employment, Exports, Imports, Capacity Utilisation indicators, Selling Prices, and Profit Margin. These responses are collected on a 3-point scale (i.e. increase, decrease and no change). The Block 5 information is sought for two reference periods, i.e., assessment of current quarter and the expectations for the next quarter.
The additional data block (Block 6) on investment intentions is canvassed annually in the April-June quarter for the purpose of getting an assessment of the corporate investment. The fieldwork of the survey is carried out through private market research agencies and both mail enquiry and interview methods are adopted to gather the required information.
III.4 Methodology used for Analysis of Survey Data
In BT surveys, respondents generally have three reply options such as up/same/ down; or above-normal/normal/below-normal; or increase/remain-same/decrease. Because of the difficulty of interpreting all three percentages, BT survey results are normally converted into a single quantitative number. The two most common ways of doing this are to use ‘Balances’ (also called ‘Net-Responses’ or ‘Net Balances’) or ‘Diffusion Indices’3 . Net Responses can take values from –100 to +100, while diffusion indices range from 0 to 100. The mid-points are 0 and 50, respectively. Both indices move in the same way over time but, because the range for Diffusion Indices is narrower than for Balances, the scale for Diffusion Indices are flatter than Net Responses when shown in graphical form. In practice, Net Responses are the most common way of presenting the results of BT surveys and the OECD Handbook deals only with Net Responses, where a value above zero indicates growth while a value below zero indicates contraction. In the rest of this article, Net Response is used to analyse the Industrial Outlook Survey results and to track the movements of various parameters.
IV. Survey Findings
The survey results are being published in concise form in the Reserve Bank’s quarterly publication ‘Macroeconomic and Monetary Developments’ since 2005. This article presents the time series movements of the survey findings since Round 10 (April-June 2000) after which consistent times series data on the survey results are available, till the latest Round 46 (April-June 2009). Henceforth, a quarterly update article will be brought out to present the salient features of each round of the survey results.
The survey results are presented under demand conditions, financial situation, price and employment expectations and overall business conditions. The original responses and Net Responses (computed as difference of pessimistic response from the optimistic response) for each parameter, since Round 10 of the survey, are given in Statement-I.
IV.1 Demand Conditions
Survey collects perceptions of the Indian manufacturers about prominent demand related parameters namely Production, Order Books, Capacity Utilisation, Inventory, Export and Imports. IV.1.1 Production
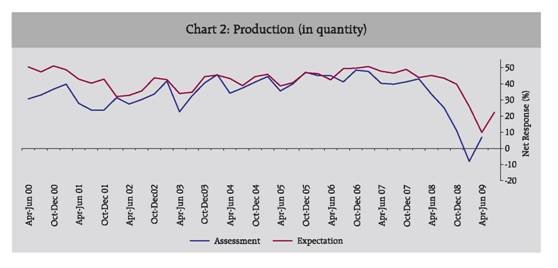
The questions on production seek the company’s assessment and expectation of production (for all products), whether it will increase, decrease, or there will be no change. These two questions were introduced in the April-June 2000 Round. The sentiments on production showed gradual improvement from 2002 and were at the highest during October 2006-March 2007 (Net Response of around 48-50 per cent). From July-September 2007 quarter, the survey findings indicated slight moderation in manufacturing activities and from April-June 2008 quarter a sharp decline in production outlook of the manufacturing companies was seen in consonance with the global slow down.
In January-March 2009 quarter, for the first time in survey history, more respondents assessed decline in production than those who assessed an increase, resulting in overall negative sentiments, indicating contraction in production outlook. However, for April-June 2009 quarter, assessment and expectation on the output front went up significantly from the levels observed in the previous quarters, signifying a turnaround in business sentiments.
IV.1.2 Order Books
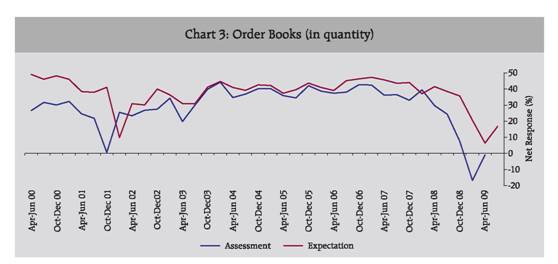
Pattern of responses of assessment and expectations for Order Books (in quantity terms, free of price impact) is also similar to that for production. Thus the movements in production of the manufacturing companies were coherent with their demand as depicted through order books movements.
IV.1.3 Pending Order
The question on pending orders was included during 31st Round of the survey (July-September 2005 quarter) and responding manufacturing companies were asked whether pending orders for current and next quarter will be above normal, normal or below normal. Since beginning around 80-85 per cent of respondents have been reporting ‘normal’ level of pending orders. However, this ‘normal’ level slid down to 60-70 per cent in the recent quarters. The Net Response of the pending orders was nearly zero in the initial rounds and since mid 2008 the companies that maintained below normal pending orders shot up in coherence with the shrinkage in the overall demand. The recent turnaround in demand is also reflected in the decline in the Net Response of pending orders and fewer companies maintained below normal pending order.
IV.1.4 Capacity Utilisation
Another important economic variable indicative of demand in the market is the utilisation of capacity, the extent to which an enterprise actually uses its installed capacity. The Industrial Outlook Survey has three questions on capacity utilisation. The Survey collects views of manufacturing companies about Capacity Utilisation of main product (increase/ decrease/ no change), level of capacity utilisation (above normal/ below normal/ normal) and assessment of production capacity with regard to expected demand in next six months (more than adequate/ less than adequate/ adequate).
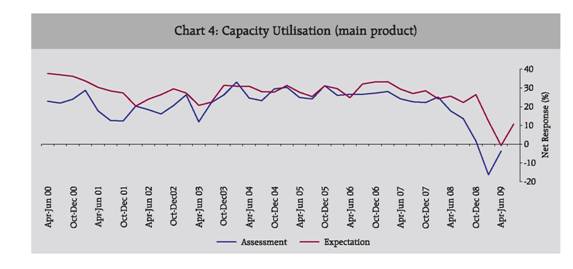
The long-term trend as seen from the chart for capacity utilisation of main product shows that the Net Response in capacity utilisation was growing since mid 2003 till 2008. Since the middle of 2008, the movement indicates contraction of capacity utilisation. The slide in this sentiment was arrested and reversed in the latest round of survey, but the Net Response remained in the negative territory. The other indicators of capacity utilisation endorsed these movements.
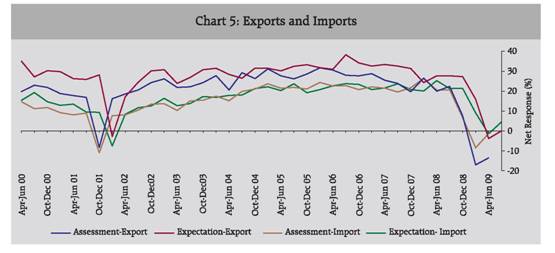
IV.1.5 Exports and Imports
The external demand of manufacturing companies is gauged by the survey through their assessment and expectation of Exports and Imports. The companies report their perceptions in the form increase, no change and decrease in Exports and Imports.
The companies assessed, as seen from their Net Response, a gradual increase in the levels of exports and imports all through the period from 2002 to 2008. However, the sentiments on export and import growth started falling from mid 2008 and dropped sharply in January-March 2009 reflecting the global economic slump. More than a third of the respondents assessed a decline in exports in this quarter. But in April-June 2009, the decline was arrested, even though the Net Response in assessment continues to be in contraction terrain.
IV.1.6 Inventory
Survey questionnaire includes two questions about inventory level of the companies during current and ensuing quarter. Manufacturers are solicited to opine on the extent of raw material and finished goods inventory (both in quantity terms) in the form of on 3-point scale - above average, average or below average level, where below average inventory was considered an optimistic response as it reflected better inventory management. The average level is computed as average of the levels at the end of four quarters during the corresponding preceding year (Statement I). The inventory responses show that around 4 in every 5 companies maintain average inventory. Majority of the remaining companies maintained above average inventory for a large period of the survey history, resulting in an overall negative Net Response. This could be due the fact that the high growth in the economy resulted in high demand and in anticipation of high demand, some companies hoped to maintain above average inventories. Also, during this period there was easy availability of finance that facilitated companies in marinating above average inventories. However, during the period of recent slow down, the demand crashed, availability of finance tightened and the inventory level also reduced (Statement I).
IV.2 Financial Situation
The survey assesses sentiments about financial condition through three parameters, namely, Overall Financial Situation, Working Capital Finance Requirement (excluding internal sources of funds), Availability of Finance (both internal and external sources) and Profit Margin.
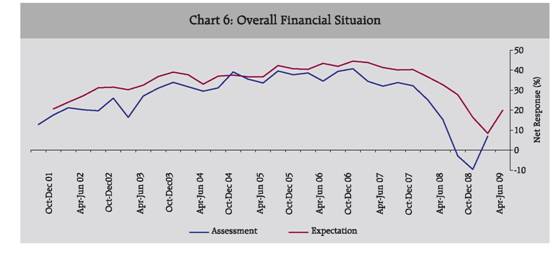
IV.2.1 Overall Financial Situation
Reflecting the general optimism that prevails in businesses, the Net Response curve of expectations for the next quarter usually lies above the corresponding assessment curve. General optimism prevailed with reference to Overall Financial Situation throughout the survey period. The Net Response improved from about 20 per cent in 2001-02 to more than 40 per cent in early 2007 and then started declining. The decline was sharp in 2008 and availability of finance entered the contraction zone in January-March 2009. In the latest quarter (April-June 2009), the sentiment for Overall Financial Situation registered a turnaround.
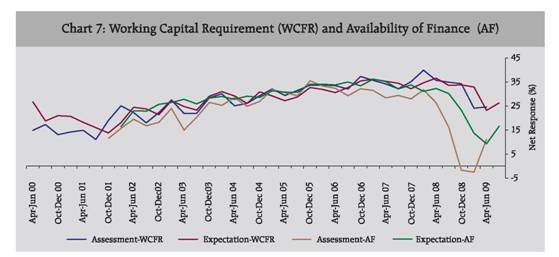
IV.2.2 Working Capital Finance requirement and Availability of Finance
The indicators on Working Capital Finance requirement and Availability of Finance also recorded similar movements. There was gradual increase in Working Capital Finance requirement over the survey period and Availability of Finance also improved correspondingly.
Starting 2008, the Availability of Finance reduced sharply and went into a contraction with the global financial crisis deepening. On the other hand, the decline in the Working Capital Finance requirement was relatively moderate. Both the indicators registered recovery in the latest round of survey.
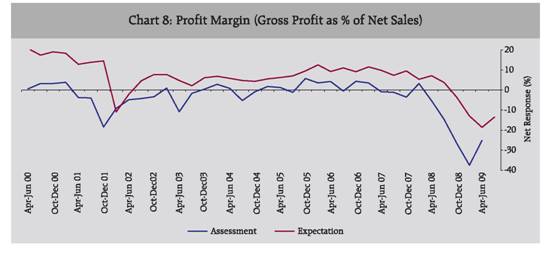
IV.2.3 Profit Margin
Survey asks manufacturing companies whether in their opinion their profit margin (gross profits as percentage at net sales) is expected to increase, decrease or remain same. The graph shows that the respondents are usually more optimistic about their profit margin of the ensuing quarter than what their assessment for the current quarter is, reflecting their general sense of optimism. The curve of expectation lies above that of assessment throughout the survey period. The movement of this indicator shows that from early 2000 to late 2001, there was a decline in profit margins of the manufacturing companies and thereafter till mid 2008, the movement was indicative of gradual improvement. However, the movement since early 2008 shows sharp decline in profit margins, again in consonance with the economic downturn. In January-March 2009 quarter, the profit margin was at all time low in the survey history, and in April-June 2009 it moved towards recovery i.e. a lower rate of contraction in profit margins.
IV.3 Price and Employment Expectation
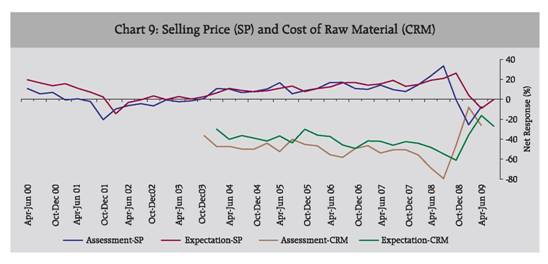
Price related three questions were canvassed in the survey. The question sought increase, decrease or no change in the Cost of Raw Material and those of Selling Prices (ex-factory unit prices); and if an increase is expected on Selling Prices, enquiries are made about the rate of increase in the Selling Prices (at higher/ lower/similar rate).
IV.3.1 Cost of Raw material
Question about the Cost of Raw Material was included during 24th Survey Round (October-December 2003 quarter). The Net Response for this variable represents the proportion of respondents expecting decline in prices (optimistic response) minus the proportion that expect input price increase (pessimistic response). The Net Response curve lies below the zero line as more respondents expect price increase than otherwise. Cost of raw material is a big concern for manufacturers and usually more than 50 per cent of respondents expect ‘increase’ in input prices. As the inflation shot up during 2008, the respondents who expected increase in cost of raw material increased sharply to more than 80 per cent. Subsequently, as the inflation tapered in late 2008 and early 2009, the impact could be seen in the corresponding decline in respondents expecting price increase. However, in the latest round, the perception about the input price inflation reversed and more respondents started expecting price increase.
IV.3.2 Selling Price Survey seeks responses from manufacturing corporate about ex-factory Selling Prices. In case of multi-product companies, they are requested to take into account the average of the price changes. The direction of movements in selling prices revealed that since 2002, the Net Response (i.e. selling price increase minus decline in selling price) for this indicator increased reflecting increase in pricing power of the manufacturing companies as there was an increase in demand. The high inflation prevailing in mid 2008 was also reflected in the manufacturing sector’s sentiments as also the decline in inflation in early 2009 and subsequent recovery in the latest quarter.
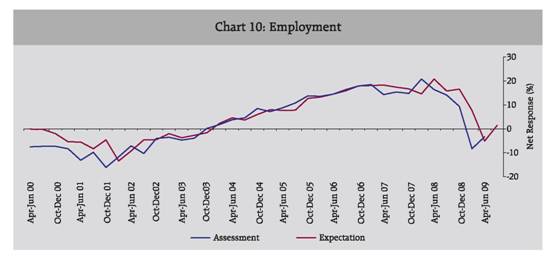
IV.3.3 Employment
Industrial Outlook Survey seeks from the companies their perceptions on employment change in their company. Employment includes all cadres i.e. part-time, full-time and casual labour. Usually 70-80 per cent of companies responded ‘no change’ in employment level over a quarter. From 2000 to 2002, the manufacturing companies witnessed a contraction in their employment levels. The sentiment started improving thereafter and around end of 2003 there was net increase in employment. The improvement continued in the subsequent years till the global economic slowdown in late 2008 that led to decline in domestic and foreign demand. The slowdown resulted in surplus manpower in the manufacturing companies. The latest quarter survey showed improvement in this sentiment along with improvement in all other indicators.
IV.4 Overall business conditions
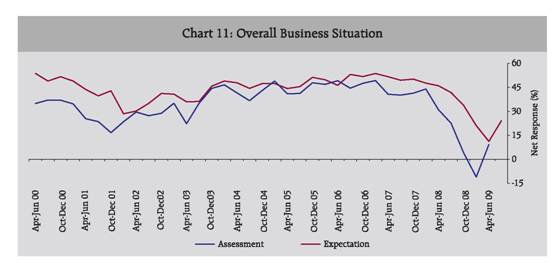
IV.4.1 Overall Business Situation
The Overall Business Situation is a parameter that provides the overall confidence of manufacturing companies. The companies are asked if their overall business situation would become better/ worsen /remain same. The overall business situation has indicated net optimism since 2000. The level of optimism increased steadily from 2001 till 2007 end. The global crisis impacted the sentiments of the Indian companies and the manufacturing sector recorded a contraction in their overall business situation. The situation recorded a turnaround in the latest quarter.
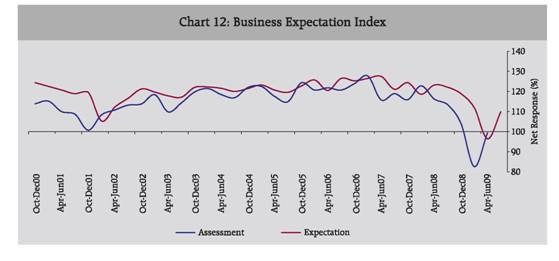
IV.4.2 Business Expectation Index
Business Expectation Index gives a single snapshot of the industrial outlook in each study quarter. This index is computed based on weighted average of responses from different industries on selected 9 out of the 19 performance parameters. These parameters are Overall Business Situation, Production, Order Books, Inventory of Raw Materials, Inventory of Finished Goods, Profit Margin, Employment, Exports, and Capacity Utilization. Detailed methodology used in index compilation is given in the Annex II. For each of the survey round, two indices are computed - one based on assessment and another based on expectations. The index ranges from 0 to 200 and the 100 mark separates growth from contraction. Higher the level of index, greater is the optimism of the manufacturing sector and vice-versa.
The index based on expectations is usually higher than the index based on assessment signifying general optimism of businesses for future. The index has remained in the growth terrain throughout the survey history till the October-December 2008 quarter. Mirroring the slowdown, consequent to the global economic crisis, the index fell below 100 in January-March 2009 quarter and signified contraction in the business of the manufacturing sector. However, in April-June 2009, the sentiment improved sharply with reference to the previous quarter but still remained marginally below 100 showing continued contraction, though at a much lower rate.
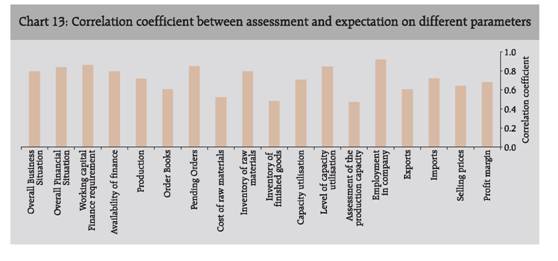
IV.5 Parameter-wise correlation between Assessment and Expectations Survey collects assessment for current quarter and expectations for next quarter on 19 different performance parameters. To see how close are the assessments for a given quarter to corresponding expectation reflected a quarter back, parameter-wise correlation between quarterly assessment (during current survey) and expectations for that parameter for that quarter (given during the last quarter) is computed and presented in Chart 13. It is seen that all the parameters are positively correlated, though the extent of correlation varies, as expected, for different parameters. Assessment and expectations for ‘employment in the company’ are highly correlated (correlation coefficient 0.92) implying that three months ahead expectations nearly coincide with assessment given during current quarter. Assessment and expectations about working capital finance requirement are also closely related. Other parameters where higher degree of correlation exists between assessment and expectations are pending orders, level of capacity utilisation, overall financial situation, availability of finance, overall business situation and inventory of raw material. This shows that the expectation for each parameter is a very good lead indicator for its subsequent actual behaviour.
IV.6 Survey Results and Official Statistics
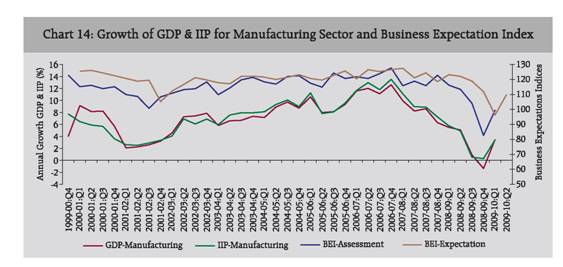
The Business Expectations Indices (BEI) based on the information gathered on critical parameters in the Industrial Outlook Survey provides the private manufacturing sector’s aggregate assessment of the current quarter and outlook for the ensuing quarter. Chart 14 shows the co-movements of annual growth rates of quarterly GDP-Manufacturing (at 1999-00 prices), IIP-Manufacturing (base: 1993-94=100) and the BEI based on assessment and expectations from various rounds since 2000 where movements in BEI appear to be closely leading the official output indicators released subsequently.
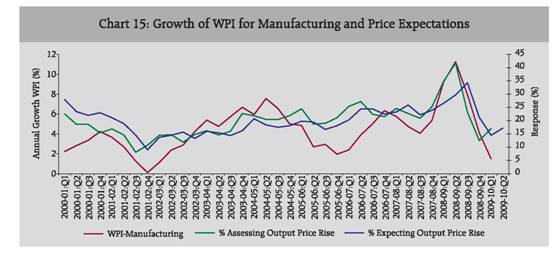
Similarly the co-movements of inflation rates based on WPI-Manufacturing and Industrial Outlook survey-based corporate sector’s output price assessments and expectations are given in Chart 15. The turning points in price outlook of private manufacturing companies obtained from the survey generally precede the actual price movements measured through the official series on WPI-Manufacturing.
IV.7 Survey Results and Corporate Statistics
An empirical exercise was also carried out to examine how closely assessment and expectation in the quarterly Industrial Outlook Survey track the observed quarterly performance of manufacturing companies. The exercise employed information on survey responses (Business Expectation Indices (BEI) as well as select parameters, such as, overall business situation, order books, production, and profit margin) and observed corporate/ industrial performance (in terms of select indicators like, IIP, sales, gross profits, net profits and profit margin).
The results show that BEI-assessment captures turning points in gross profits and net profits/profits after tax (PAT) and also with IIP growth. When it comes to overall relationship, regression results show that BEI-assessment has strong correlation with corporate performance indicators as well as with growth in IIP. The findings for BEI-expectation are broadly similar to those of BEI-assessment, except that the former has weak correlation with changes in PAT.
Analyses using select survey indicators also show that both assessment and expectation on Overall Business Situation (OBS) as well as Order Books (OB) capture well the turning points in corporate performance indicators and IIP, with the exception of directional changes in sales. Survey responses in terms of assessment and expectation on production captured major turning points in IIP growth well, and both survey indicators are strongly correlated with the latter. However, responses on profit margin are neither correlated with nor are able to capture major turns in observed profit margin well. The details of the analysis are available in the Report of the Working Group on Surveys that has been brought out as a supplement to the RBI Bulletin, September 2009.
Statement I : Quarter-wise number of responses (per cent) under three options pertaining to assessment for current quarter and expectations for next quarter |
Parameter: 1. Overall business situation |
Round No. |
Survey Quarter |
Total response |
Assessment for Current Quarter |
Expectation for Next Quarter |
Better |
Worsen |
No change |
Net response |
Better |
Worsen |
No change |
Net response |
1 |
2 |
3 |
4 |
5 |
6 |
7 |
8 |
9 |
10 |
11 |
10 |
Apr-Jun 00 |
515 |
47.9 |
13.0 |
39.1 |
34.9 |
59.0 |
5.2 |
35.8 |
53.8 |
11 |
Jul-Sep 00 |
765 |
47.1 |
10.0 |
42.9 |
37.1 |
55.1 |
6.1 |
38.8 |
49.0 |
12 |
Oct-Dec 00 |
776 |
47.4 |
10.4 |
42.2 |
37.0 |
56.5 |
4.8 |
38.7 |
51.7 |
13 |
Jan-mar 01 |
801 |
46.8 |
12.1 |
41.1 |
34.7 |
54.2 |
5.2 |
40.6 |
49.0 |
14 |
Apr-Jun 01 |
594 |
39.3 |
13.9 |
46.8 |
25.4 |
52.0 |
8.3 |
39.7 |
43.7 |
15 |
Jul-Sep 01 |
672 |
38.7 |
15.1 |
46.2 |
23.6 |
48.9 |
9.2 |
41.9 |
39.7 |
16 |
Oct-Dec 01 |
672 |
32.9 |
16.2 |
50.9 |
16.7 |
52.1 |
9.2 |
38.7 |
42.9 |
17 |
Jan-Mar 02 |
761 |
36.1 |
12.6 |
51.3 |
23.5 |
40.3 |
11.8 |
47.9 |
28.5 |
18 |
Apr-Jun 02 |
716 |
41.1 |
11.5 |
47.4 |
29.6 |
41.6 |
11.5 |
46.9 |
30.2 |
19 |
Jul-Sep 02 |
884 |
38.6 |
11.3 |
50.1 |
27.3 |
42.9 |
7.9 |
49.2 |
35.0 |
20 |
Oct-Dec02 |
852 |
38.9 |
10.1 |
51.0 |
28.8 |
47.4 |
6.2 |
46.4 |
41.2 |
21 |
Jan-Mar 03 |
1044 |
43.9 |
8.8 |
47.3 |
35.1 |
46.8 |
6.0 |
47.2 |
40.8 |
22 |
Apr-Jun 03 |
957 |
35.2 |
12.9 |
51.9 |
22.3 |
43.4 |
7.4 |
49.2 |
36.0 |
23 |
Jul-Sep 03 |
964 |
44.6 |
9.5 |
45.9 |
35.1 |
42.8 |
6.6 |
50.6 |
36.2 |
24 |
Oct-Dec03 |
919 |
50.0 |
5.6 |
44.4 |
44.4 |
50.6 |
4.8 |
44.6 |
45.8 |
25 |
Jan-Mar 04 |
903 |
53.4 |
6.8 |
39.8 |
46.6 |
53.3 |
4.3 |
42.4 |
49.0 |
26 |
Apr-Jun 04 |
778 |
49.0 |
7.4 |
43.7 |
41.6 |
52.8 |
4.9 |
42.3 |
47.9 |
27 |
Jul-Sep 04 |
955 |
45.3 |
8.6 |
46.1 |
36.7 |
50.1 |
5.7 |
44.1 |
44.4 |
28 |
Oct-Dec 04 |
987 |
50.4 |
7.4 |
42.2 |
43.0 |
51.7 |
4.3 |
44.0 |
47.4 |
29 |
Jan-Mar 05 |
987 |
55.1 |
6.1 |
38.8 |
49.0 |
52.3 |
4.9 |
42.8 |
47.4 |
30 |
Apr-Jun 05 |
816 |
48.5 |
7.5 |
44.0 |
41.0 |
48.8 |
4.5 |
46.7 |
44.3 |
31 |
Jul-Sep 05 |
961 |
49.3 |
8.1 |
42.7 |
41.2 |
50.9 |
5.4 |
43.7 |
45.5 |
32 |
Oct-Dec 05 |
934 |
52.7 |
4.8 |
42.7 |
47.9 |
55.1 |
3.8 |
41.2 |
51.3 |
33 |
Jan-Mar 06 |
1086 |
53.0 |
6.1 |
40.9 |
46.9 |
52.4 |
2.6 |
45.0 |
49.8 |
34 |
Apr-Jun 06 |
1073 |
54.2 |
5.0 |
40.7 |
49.2 |
50.8 |
4.5 |
44.7 |
46.3 |
35 |
Jul-Sep 06 |
1138 |
50.1 |
5.6 |
44.2 |
44.5 |
57.6 |
4.5 |
37.9 |
53.1 |
36 |
Oct-Dec 06 |
1115 |
52.0 |
4.4 |
43.6 |
47.6 |
55.3 |
3.5 |
41.2 |
51.8 |
37 |
Jan-Ma r07 |
1108 |
53.9 |
4.6 |
41.4 |
49.3 |
56.5 |
2.8 |
40.7 |
53.7 |
38 |
Apr-Jun 07 |
1056 |
47.7 |
7.0 |
45.4 |
40.7 |
55.2 |
3.5 |
41.3 |
51.7 |
39 |
Jul-Sep 07 |
1047 |
48.9 |
8.6 |
42.5 |
40.2 |
54.2 |
4.6 |
41.2 |
49.5 |
40 |
Oct-Dec 07 |
1001 |
49.7 |
8.3 |
42.0 |
41.4 |
54.1 |
3.8 |
42.1 |
50.2 |
41 |
Jan-Mar 08 |
937 |
50.8 |
6.8 |
42.5 |
44.0 |
52.4 |
4.7 |
42.9 |
47.7 |
42 |
Apr-Jun 08 |
1039 |
43.7 |
12.7 |
43.5 |
31.0 |
51.6 |
5.6 |
42.7 |
46.0 |
43 |
Jul-Sep 08 |
1032 |
39.3 |
16.7 |
44.0 |
22.6 |
49.6 |
7.8 |
42.6 |
41.8 |
44 |
Oct-Dec 08 |
1178 |
30.2 |
26.2 |
43.6 |
4.0 |
44.8 |
11.1 |
44.1 |
33.7 |
45 |
Jan-Mar 09 |
1225 |
24.1 |
35.2 |
40.7 |
-11.1 |
38.6 |
17.5 |
43.9 |
21.1 |
46 |
Apr-Jun 09 |
1242 |
30.7 |
21.4 |
47.9 |
9.3 |
31.8 |
20.6 |
47.6 |
11.2 |
|
Jul-Sep 09 |
|
|
|
|
|
38.8 |
14.6 |
46.7 |
24.2 |
Statement I : Quarter-wise number of responses (per cent) under three options pertaining to assessment for current quarter and expectations for next quarter (Contd.) |
Parameter: 2. Financial Situation (overall) |
Round No. |
Survey Quarter |
Assessment for Current Quarter |
Expectation for Next Quarter |
Better |
Worsen |
No change |
Net response |
Better |
Worsen |
No change |
Net response |
1 |
2 |
12 |
13 |
14 |
15 |
16 |
17 |
18 |
19 |
10 |
Apr-Jun 00 |
|
|
|
|
|
|
|
|
11 |
Jul-Sep 00 |
|
|
|
|
|
|
|
|
12 |
Oct-Dec 00 |
|
|
|
|
|
|
|
|
13 |
Jan-mar 01 |
|
|
|
|
|
|
|
|
14 |
Apr-Jun 01 |
|
|
|
|
|
|
|
|
15 |
Jul-Sep 01 |
|
|
|
|
|
|
|
|
16 |
Oct-Dec 01 |
26.9 |
14.1 |
59.0 |
12.8 |
|
|
|
|
17 |
Jan-Mar 02 |
29.5 |
11.9 |
58.6 |
17.6 |
32.1 |
11.5 |
56.4 |
20.6 |
18 |
Apr-Jun 02 |
32.2 |
11.0 |
56.8 |
21.2 |
34.1 |
10.1 |
55.8 |
24.0 |
19 |
Jul-Sep 02 |
32.7 |
12.5 |
54.8 |
20.2 |
34.0 |
6.8 |
59.2 |
27.2 |
20 |
Oct-Dec02 |
31.3 |
11.6 |
57.1 |
19.7 |
38.0 |
6.8 |
55.2 |
31.2 |
21 |
Jan-Mar 03 |
34.4 |
8.4 |
57.2 |
26.0 |
36.8 |
5.3 |
57.9 |
31.5 |
22 |
Apr-Jun 03 |
29.8 |
13.4 |
56.8 |
16.4 |
37.6 |
7.4 |
55.0 |
30.2 |
23 |
Jul-Sep 03 |
36.9 |
9.8 |
53.3 |
27.1 |
39.8 |
7.3 |
52.9 |
32.5 |
24 |
Oct-Dec03 |
38.8 |
7.8 |
53.4 |
31.0 |
41.9 |
5.1 |
53.0 |
36.8 |
25 |
Jan-Mar 04 |
42.2 |
8.3 |
49.6 |
33.9 |
43.9 |
4.9 |
51.2 |
39.0 |
26 |
Apr-Jun 04 |
39.5 |
7.8 |
52.7 |
31.7 |
43.2 |
5.5 |
51.3 |
37.7 |
27 |
Jul-Sep 04 |
37.5 |
8.0 |
54.5 |
29.5 |
39.2 |
6.2 |
54.6 |
33.0 |
28 |
Oct-Dec 04 |
38.9 |
7.8 |
53.3 |
31.1 |
42.0 |
5.0 |
52.9 |
37.0 |
29 |
Jan-Mar 05 |
44.8 |
5.7 |
49.5 |
39.1 |
41.8 |
4.3 |
53.8 |
37.5 |
30 |
Apr-Jun 05 |
41.0 |
5.5 |
53.5 |
35.5 |
41.2 |
4.5 |
54.3 |
36.7 |
31 |
Jul-Sep 05 |
40.5 |
6.9 |
52.5 |
33.6 |
40.9 |
4.2 |
54.9 |
36.7 |
32 |
Oct-Dec 05 |
44.8 |
5.2 |
50.0 |
39.6 |
45.6 |
3.3 |
51.1 |
42.3 |
33 |
Jan-Mar 06 |
44.4 |
6.7 |
48.9 |
37.7 |
42.7 |
2.0 |
55.4 |
40.7 |
34 |
Apr-Jun 06 |
43.6 |
5.0 |
51.4 |
38.6 |
43.9 |
3.5 |
52.6 |
40.4 |
35 |
Jul-Sep 06 |
40.8 |
6.3 |
53.0 |
34.5 |
47.1 |
3.7 |
49.2 |
43.4 |
36 |
Oct-Dec 06 |
44.1 |
4.7 |
51.2 |
39.4 |
45.6 |
3.7 |
50.6 |
41.9 |
37 |
Jan-Ma r07 |
45.4 |
4.7 |
49.9 |
40.7 |
47.3 |
2.8 |
49.9 |
44.5 |
38 |
Apr-Jun 07 |
41.3 |
6.9 |
51.8 |
34.4 |
47.0 |
3.2 |
49.8 |
43.8 |
39 |
Jul-Sep 07 |
40.7 |
8.7 |
50.5 |
32.0 |
45.7 |
4.5 |
49.8 |
41.3 |
40 |
Oct-Dec 07 |
42.1 |
8.2 |
49.7 |
33.8 |
44.4 |
4.3 |
51.3 |
40.1 |
41 |
Jan-Mar 08 |
40.3 |
8.1 |
51.6 |
32.2 |
45.0 |
4.7 |
50.3 |
40.3 |
42 |
Apr-Jun 08 |
35.7 |
10.6 |
53.8 |
25.1 |
42.5 |
5.9 |
51.6 |
36.6 |
43 |
Jul-Sep 08 |
31.0 |
15.7 |
53.3 |
15.3 |
39.9 |
7.2 |
53.0 |
32.7 |
44 |
Oct-Dec 08 |
22.0 |
24.9 |
53.1 |
-2.9 |
37.6 |
9.9 |
52.5 |
27.7 |
45 |
Jan-Mar 09 |
20.3 |
29.9 |
49.9 |
-9.6 |
31.6 |
15.2 |
53.2 |
16.4 |
46 |
Apr-Jun 09 |
26.4 |
19.4 |
54.2 |
7.0 |
27.8 |
19.4 |
52.7 |
8.4 |
|
Jul-Sep 09 |
|
|
|
|
32.8 |
12.8 |
54.4 |
20.0 |
Statement I : Quarter-wise number of responses (per cent) under three options pertaining to assessment for current quarter and expectations for next quarter (Contd.) |
Parameter: 3. Working capital Finance requirement (excluding external sources) |
Round No. |
Survey Quarter |
Assessment for Current Quarter |
Expectation for Next Quarter |
Increase |
Decrease |
No change |
Net response |
Increase |
Decrease |
No change |
Net response |
1 |
2 |
20 |
21 |
22 |
23 |
24 |
25 |
26 |
27 |
10 |
Apr-Jun 00 |
26.0 |
11.1 |
62.9 |
14.9 |
33.8 |
7.0 |
59.2 |
26.8 |
11 |
Jul-Sep 00 |
25.3 |
8.0 |
66.7 |
17.3 |
26.1 |
7.3 |
66.6 |
18.8 |
12 |
Oct-Dec 00 |
22.0 |
8.9 |
69.1 |
13.1 |
27.1 |
6.1 |
66.8 |
21.0 |
13 |
Jan-mar 01 |
23.5 |
9.3 |
67.2 |
14.2 |
26.1 |
5.4 |
68.5 |
20.7 |
14 |
Apr-Jun 01 |
21.7 |
6.8 |
71.5 |
14.9 |
25.4 |
7.2 |
67.4 |
18.2 |
15 |
Jul-Sep 01 |
18.7 |
7.6 |
73.7 |
11.1 |
22.7 |
6.7 |
70.6 |
16.0 |
16 |
Oct-Dec 01 |
29.4 |
10.4 |
60.2 |
19.0 |
19.7 |
5.9 |
74.4 |
13.8 |
17 |
Jan-Mar 02 |
30.6 |
5.5 |
63.9 |
25.1 |
28.7 |
10.6 |
60.7 |
18.1 |
18 |
Apr-Jun 02 |
28.7 |
6.4 |
64.9 |
22.3 |
31.0 |
6.5 |
62.5 |
24.5 |
19 |
Jul-Sep 02 |
26.1 |
8.1 |
65.8 |
18.0 |
29.4 |
5.6 |
65.0 |
23.8 |
20 |
Oct-Dec02 |
27.9 |
5.6 |
66.5 |
22.3 |
27.2 |
5.8 |
67.0 |
21.4 |
21 |
Jan-Mar 03 |
32.6 |
5.1 |
62.3 |
27.5 |
30.4 |
3.2 |
66.4 |
27.2 |
22 |
Apr-Jun 03 |
27.8 |
5.9 |
66.3 |
21.9 |
31.5 |
6.7 |
61.8 |
24.8 |
23 |
Jul-Sep 03 |
29.4 |
7.4 |
63.2 |
22.0 |
28.6 |
5.3 |
66.0 |
23.3 |
24 |
Oct-Dec03 |
34.1 |
5.7 |
60.2 |
28.4 |
33.3 |
4.2 |
62.6 |
29.1 |
25 |
Jan-Mar 04 |
35.2 |
5.1 |
59.7 |
30.1 |
35.4 |
4.4 |
60.2 |
31.0 |
26 |
Apr-Jun 04 |
31.9 |
6.8 |
61.4 |
25.1 |
34.4 |
5.2 |
60.4 |
29.2 |
27 |
Jul-Sep 04 |
32.8 |
6.7 |
60.5 |
26.1 |
31.3 |
5.2 |
63.4 |
26.1 |
28 |
Oct-Dec 04 |
34.1 |
4.8 |
61.1 |
29.3 |
35.2 |
4.3 |
60.5 |
30.9 |
29 |
Jan-Mar 05 |
35.9 |
3.8 |
60.3 |
32.1 |
33.1 |
3.9 |
63.0 |
29.2 |
30 |
Apr-Jun 05 |
34.8 |
5.4 |
59.8 |
29.4 |
32.2 |
5.0 |
62.8 |
27.2 |
31 |
Jul-Sep 05 |
35.9 |
4.4 |
59.7 |
31.5 |
33.2 |
4.4 |
62.4 |
28.8 |
32 |
Oct-Dec 05 |
37.4 |
3.7 |
58.9 |
33.7 |
35.1 |
2.4 |
62.6 |
32.7 |
33 |
Jan-Mar 06 |
37.0 |
3.3 |
59.7 |
33.7 |
34.1 |
2.2 |
63.7 |
31.9 |
34 |
Apr-Jun 06 |
37.7 |
4.2 |
58.1 |
33.5 |
34.5 |
3.9 |
61.6 |
30.6 |
35 |
Jul-Sep 06 |
37.1 |
5.0 |
57.8 |
32.1 |
36.8 |
4.1 |
59.1 |
32.7 |
36 |
Oct-Dec 06 |
40.3 |
3.0 |
56.8 |
37.3 |
38.5 |
3.1 |
58.3 |
35.4 |
37 |
Jan-Ma r07 |
38.7 |
3.0 |
58.3 |
35.7 |
38.5 |
2.3 |
59.2 |
36.2 |
38 |
Apr-Jun 07 |
37.1 |
2.9 |
60.0 |
34.2 |
38.0 |
2.7 |
59.2 |
35.3 |
39 |
Jul-Sep 07 |
36.8 |
4.7 |
58.5 |
32.2 |
37.6 |
3.1 |
59.2 |
34.5 |
40 |
Oct-Dec 07 |
39.5 |
4.4 |
56.1 |
35.1 |
34.8 |
2.6 |
62.6 |
32.2 |
41 |
Jan-Mar 08 |
43.3 |
3.4 |
53.4 |
39.9 |
37.2 |
2.5 |
60.3 |
34.7 |
42 |
Apr-Jun 08 |
41.7 |
6.0 |
52.2 |
35.7 |
40.1 |
3.5 |
56.5 |
36.6 |
43 |
Jul-Sep 08 |
41.4 |
6.5 |
52.0 |
34.9 |
38.1 |
4.5 |
57.3 |
33.6 |
44 |
Oct-Dec 08 |
41.1 |
6.8 |
52.1 |
34.3 |
38.1 |
4.3 |
57.7 |
33.8 |
45 |
Jan-Mar 09 |
36.0 |
11.9 |
52.1 |
24.1 |
37.9 |
5.0 |
57.1 |
32.9 |
46 |
Apr-Jun 09 |
57.0 |
24.6 |
9.2 |
24.6 |
31.1 |
7.9 |
61.0 |
23.2 |
|
Jul-Sep 09 |
|
|
|
|
32.3 |
6.0 |
61.7 |
26.3 |
Statement I : Quarter-wise number of responses (per cent) under three options pertaining to assessment for current quarter and expectations for next quarter (Contd.) |
Parameter: 4. Availability of finance (both internal and external sources) |
Round No. |
Survey Quarter |
Assessment for Current Quarter |
Expectation for Next Quarter |
Improve |
Worsen |
No change |
Net response |
Improve |
Worsen |
No change |
Net response |
1 |
2 |
28 |
29 |
30 |
31 |
32 |
33 |
34 |
35 |
10 |
Apr-Jun 00 |
|
|
|
|
|
|
|
|
11 |
Jul-Sep 00 |
|
|
|
|
|
|
|
|
12 |
Oct-Dec 00 |
|
|
|
|
|
|
|
|
13 |
Jan-mar 01 |
|
|
|
|
|
|
|
|
14 |
Apr-Jun 01 |
|
|
|
|
|
|
|
|
15 |
Jul-Sep 01 |
|
|
|
|
|
|
|
|
16 |
Oct-Dec 01 |
24.0 |
12.5 |
63.5 |
11.5 |
|
|
|
|
17 |
Jan-Mar 02 |
25.7 |
10.0 |
64.3 |
15.7 |
27.5 |
11.1 |
61.4 |
16.4 |
18 |
Apr-Jun 02 |
27.7 |
8.2 |
64.1 |
19.5 |
30.0 |
7.0 |
63.0 |
23.0 |
19 |
Jul-Sep 02 |
26.6 |
9.8 |
63.6 |
16.8 |
28.4 |
5.5 |
66.1 |
22.9 |
20 |
Oct-Dec02 |
26.5 |
8.3 |
65.2 |
18.2 |
31.6 |
5.9 |
62.5 |
25.7 |
21 |
Jan-Mar 03 |
31.3 |
7.3 |
61.4 |
24.0 |
32.1 |
5.6 |
62.3 |
26.5 |
22 |
Apr-Jun 03 |
25.3 |
10.3 |
64.5 |
15.0 |
33.6 |
5.8 |
60.6 |
27.8 |
23 |
Jul-Sep 03 |
28.4 |
8.1 |
63.5 |
20.3 |
32.3 |
6.4 |
61.3 |
25.9 |
24 |
Oct-Dec03 |
33.3 |
6.8 |
60.0 |
26.5 |
32.4 |
4.1 |
63.5 |
28.3 |
25 |
Jan-Mar 04 |
32.9 |
7.6 |
59.5 |
25.3 |
33.9 |
4.9 |
61.1 |
29.0 |
26 |
Apr-Jun 04 |
33.6 |
5.1 |
61.2 |
28.5 |
32.8 |
5.0 |
62.2 |
27.8 |
27 |
Jul-Sep 04 |
30.4 |
5.5 |
64.1 |
24.9 |
32.9 |
3.8 |
63.3 |
29.1 |
28 |
Oct-Dec 04 |
32.4 |
5.5 |
62.1 |
26.9 |
32.5 |
3.9 |
63.6 |
28.6 |
29 |
Jan-Mar 05 |
36.2 |
4.4 |
59.5 |
31.8 |
34.8 |
3.5 |
61.8 |
31.3 |
30 |
Apr-Jun 05 |
35.0 |
4.4 |
60.5 |
30.6 |
33.9 |
3.1 |
63.0 |
30.8 |
31 |
Jul-Sep 05 |
33.8 |
4.5 |
61.6 |
29.3 |
34.6 |
3.9 |
61.5 |
30.7 |
32 |
Oct-Dec 05 |
38.4 |
2.9 |
58.7 |
35.5 |
36.5 |
2.4 |
61.1 |
34.1 |
33 |
Jan-Mar 06 |
37.8 |
4.5 |
57.7 |
33.3 |
36.0 |
1.9 |
62.1 |
34.1 |
34 |
Apr-Jun 06 |
37.6 |
5.2 |
57.2 |
32.4 |
36.1 |
2.3 |
61.6 |
33.8 |
35 |
Jul-Sep 06 |
34.2 |
4.9 |
60.9 |
29.3 |
39.1 |
4.1 |
56.8 |
35.0 |
36 |
Oct-Dec 06 |
37.2 |
5.0 |
57.8 |
32.2 |
37.8 |
4.4 |
57.8 |
33.4 |
37 |
Jan-Ma r07 |
36.8 |
5.3 |
57.8 |
31.5 |
39.8 |
3.6 |
56.6 |
36.2 |
38 |
Apr-Jun 07 |
34.4 |
5.9 |
59.7 |
28.4 |
39.0 |
3.8 |
57.2 |
35.2 |
39 |
Jul-Sep 07 |
35.1 |
5.8 |
59.1 |
29.4 |
36.7 |
4.7 |
58.6 |
32.1 |
40 |
Oct-Dec 07 |
34.2 |
6.2 |
59.6 |
28.0 |
37.7 |
3.8 |
58.5 |
33.8 |
41 |
Jan-Mar 08 |
37.7 |
6.0 |
56.3 |
31.7 |
35.8 |
4.7 |
59.5 |
31.1 |
42 |
Apr-Jun 08 |
34.3 |
7.9 |
57.8 |
26.4 |
37.0 |
4.7 |
58.3 |
32.3 |
43 |
Jul-Sep 08 |
27.7 |
11.5 |
60.8 |
16.2 |
36.1 |
5.9 |
57.9 |
30.2 |
44 |
Oct-Dec 08 |
21.4 |
23.1 |
55.5 |
-1.7 |
32.1 |
8.8 |
59.0 |
23.3 |
45 |
Jan-Mar 09 |
19.2 |
21.7 |
59.1 |
-2.5 |
28.7 |
15.0 |
56.3 |
13.7 |
46 |
Apr-Jun 09 |
24.8 |
13.6 |
61.6 |
11.2 |
23.8 |
14.5 |
61.7 |
9.3 |
|
Jul-Sep 09 |
|
|
|
|
27.0 |
10.4 |
62.6 |
16.6 |
Statement I : Quarter-wise number of responses (per cent) under three options pertaining to assessment for current quarter and expectations for next quarter (Contd.) |
Parameter: 5. Production (in quantity terms) (All products) |
Round No. |
Survey Quarter |
Assessment for Current Quarter |
Expectation for Next Quarter |
Increase |
Decrease |
No change |
Net response |
Increase |
Decrease |
No change |
Net response |
1 |
2 |
36 |
37 |
38 |
39 |
40 |
41 |
42 |
43 |
10 |
Apr-Jun 00 |
49.2 |
18.5 |
32.3 |
30.7 |
59.0 |
8.5 |
32.5 |
50.5 |
11 |
Jul-Sep 00 |
48.9 |
15.8 |
35.3 |
33.1 |
57.6 |
10.2 |
32.2 |
47.4 |
12 |
Oct-Dec 00 |
50.5 |
13.8 |
35.7 |
36.7 |
58.6 |
7.5 |
33.9 |
51.1 |
13 |
Jan-mar 01 |
55.4 |
15.6 |
29.0 |
39.8 |
55.5 |
6.8 |
37.7 |
48.7 |
14 |
Apr-Jun 01 |
45.7 |
17.8 |
36.5 |
27.9 |
53.0 |
10.1 |
36.9 |
42.9 |
15 |
Jul-Sep 01 |
44.4 |
20.6 |
35.0 |
23.8 |
51.4 |
11.0 |
37.6 |
40.4 |
16 |
Oct-Dec 01 |
42.6 |
18.8 |
38.6 |
23.8 |
52.7 |
9.8 |
37.5 |
42.9 |
17 |
Jan-Mar 02 |
45.7 |
14.3 |
37.4 |
31.4 |
46.6 |
14.5 |
38.9 |
32.1 |
18 |
Apr-Jun 02 |
44.4 |
16.9 |
38.7 |
27.5 |
46.6 |
13.7 |
39.7 |
32.9 |
19 |
Jul-Sep 02 |
45.1 |
14.8 |
43.5 |
30.3 |
46.3 |
10.7 |
43.0 |
35.6 |
20 |
Oct-Dec02 |
45.1 |
11.4 |
43.5 |
33.7 |
51.4 |
7.7 |
40.9 |
43.7 |
21 |
Jan-Mar 03 |
51.2 |
9.5 |
32.1 |
41.7 |
49.1 |
6.5 |
44.4 |
42.6 |
22 |
Apr-Jun 03 |
39.4 |
16.7 |
43.8 |
22.7 |
45.0 |
11.0 |
44.0 |
34.0 |
23 |
Jul-Sep 03 |
45.7 |
13.1 |
41.2 |
32.6 |
44.8 |
10.0 |
45.2 |
34.8 |
24 |
Oct-Dec03 |
50.7 |
10.1 |
39.2 |
40.6 |
51.5 |
7.0 |
41.5 |
44.5 |
25 |
Jan-Mar 04 |
55.1 |
9.4 |
35.5 |
45.7 |
53.0 |
7.6 |
39.5 |
45.4 |
26 |
Apr-Jun 04 |
46.6 |
12.4 |
41.0 |
34.2 |
51.9 |
8.6 |
39.5 |
43.3 |
27 |
Jul-Sep 04 |
48.3 |
10.9 |
40.8 |
37.4 |
47.8 |
8.9 |
43.3 |
38.9 |
28 |
Oct-Dec 04 |
50.9 |
9.8 |
39.3 |
41.1 |
50.9 |
6.4 |
42.7 |
44.5 |
29 |
Jan-Mar 05 |
54.1 |
9.6 |
36.3 |
44.5 |
52.8 |
6.9 |
40.3 |
45.9 |
30 |
Apr-Jun 05 |
47.5 |
11.9 |
40.6 |
35.6 |
48.2 |
9.5 |
42.2 |
38.7 |
31 |
Jul-Sep 05 |
50.7 |
10.7 |
38.6 |
40.0 |
48.1 |
7.4 |
44.5 |
40.7 |
32 |
Oct-Dec 05 |
53.8 |
6.6 |
39.6 |
47.2 |
53.0 |
6.1 |
40.9 |
46.9 |
33 |
Jan-Mar 06 |
54.1 |
9.0 |
36.8 |
45.1 |
51.8 |
5.5 |
42.7 |
46.3 |
34 |
Apr-Jun 06 |
53.7 |
8.6 |
37.7 |
45.1 |
50.0 |
7.5 |
42.4 |
42.5 |
35 |
Jul-Sep 06 |
50.4 |
9.2 |
40.4 |
41.2 |
55.7 |
6.3 |
38.0 |
49.4 |
36 |
Oct-Dec 06 |
55.9 |
7.4 |
36.7 |
48.5 |
55.1 |
5.4 |
39.6 |
49.7 |
37 |
Jan-Ma r07 |
53.5 |
5.8 |
40.6 |
47.7 |
55.3 |
4.6 |
40.1 |
50.7 |
38 |
Apr-Jun 07 |
49.0 |
8.6 |
42.4 |
40.3 |
53.1 |
5.3 |
41.6 |
47.8 |
39 |
Jul-Sep 07 |
50.0 |
10.2 |
39.8 |
39.8 |
52.8 |
6.1 |
41.1 |
46.6 |
40 |
Oct-Dec 07 |
50.5 |
9.3 |
40.2 |
41.2 |
54.0 |
5.0 |
40.9 |
49.0 |
41 |
Jan-Mar 08 |
52.2 |
9.1 |
38.7 |
43.1 |
50.8 |
6.9 |
42.3 |
43.9 |
42 |
Apr-Jun 08 |
47.9 |
14.3 |
37.8 |
33.6 |
52.1 |
6.9 |
41.0 |
45.2 |
43 |
Jul-Sep 08 |
42.5 |
17.3 |
40.2 |
25.2 |
53.4 |
9.9 |
36.6 |
43.5 |
44 |
Oct-Dec 08 |
36.0 |
24.9 |
39.1 |
11.1 |
48.8 |
9.0 |
42.1 |
39.8 |
45 |
Jan-Mar 09 |
27.1 |
35.1 |
37.7 |
-8.0 |
41.8 |
15.8 |
42.3 |
26.0 |
46 |
Apr-Jun 09 |
33.1 |
26.2 |
40.6 |
6.9 |
32.5 |
22.6 |
44.9 |
9.9 |
|
Jul-Sep 09 |
|
|
|
|
38.5 |
16.1 |
45.5 |
22.4 |
Statement I : Quarter-wise number of responses (per cent) under three options pertaining to assessment for current quarter and expectations for next quarter (Contd.) |
Parameter: 6. Order Books (in quantity terms ), if applicable |
Round No. |
Survey Quarter |
Assessment for Current Quarter |
Expectation for Next Quarter |
Increase |
Decrease |
No change |
Net response |
Increase |
Decrease |
No change |
Net response |
1 |
2 |
44 |
45 |
46 |
47 |
48 |
49 |
50 |
51 |
10 |
Apr-Jun 00 |
44.7 |
18.1 |
37.2 |
26.6 |
56.9 |
7.8 |
35.3 |
49.1 |
11 |
Jul-Sep 00 |
47.6 |
15.9 |
36.5 |
31.7 |
55.0 |
8.9 |
36.1 |
46.1 |
12 |
Oct-Dec 00 |
45.0 |
14.9 |
40.1 |
30.1 |
56.3 |
8.1 |
35.6 |
48.2 |
13 |
Jan-mar 01 |
49.6 |
17.3 |
33.1 |
32.3 |
52.7 |
6.6 |
40.7 |
46.1 |
14 |
Apr-Jun 01 |
43.1 |
18.5 |
38.4 |
24.6 |
50.0 |
11.6 |
38.4 |
38.4 |
15 |
Jul-Sep 01 |
41.7 |
19.9 |
38.4 |
21.8 |
49.7 |
11.7 |
38.6 |
38.0 |
16 |
Oct-Dec 01 |
31.1 |
30.5 |
38.4 |
0.6 |
51.0 |
9.9 |
39.1 |
41.1 |
17 |
Jan-Mar 02 |
40.2 |
14.7 |
45.1 |
25.5 |
36.5 |
26.7 |
36.8 |
9.8 |
18 |
Apr-Jun 02 |
37.8 |
14.4 |
47.8 |
23.4 |
44.0 |
13.1 |
42.9 |
30.9 |
19 |
Jul-Sep 02 |
41.4 |
14.6 |
44.0 |
26.8 |
41.9 |
11.8 |
46.3 |
30.1 |
20 |
Oct-Dec02 |
40.1 |
12.6 |
47.3 |
27.5 |
47.6 |
7.6 |
44.8 |
40.0 |
21 |
Jan-Mar 03 |
44.6 |
10.3 |
45.1 |
34.3 |
44.5 |
8.1 |
47.4 |
36.4 |
22 |
Apr-Jun 03 |
36.0 |
16.2 |
47.8 |
19.8 |
41.9 |
10.9 |
47.2 |
31.0 |
23 |
Jul-Sep 03 |
43.0 |
12.9 |
44.1 |
30.1 |
41.0 |
10.0 |
49.0 |
31.0 |
24 |
Oct-Dec03 |
47.9 |
8.0 |
44.1 |
39.9 |
49.0 |
7.8 |
43.2 |
41.2 |
25 |
Jan-Mar 04 |
52.4 |
8.1 |
39.5 |
44.3 |
51.3 |
6.6 |
42.1 |
44.7 |
26 |
Apr-Jun 04 |
44.6 |
9.9 |
45.5 |
34.7 |
48.8 |
7.8 |
43.4 |
41.0 |
27 |
Jul-Sep 04 |
46.6 |
9.7 |
43.7 |
36.9 |
46.4 |
7.2 |
46.4 |
39.2 |
28 |
Oct-Dec 04 |
48.7 |
8.5 |
42.8 |
40.2 |
48.7 |
6.1 |
45.2 |
42.6 |
29 |
Jan-Mar 05 |
49.5 |
9.3 |
41.2 |
40.2 |
49.3 |
7.1 |
43.6 |
42.2 |
30 |
Apr-Jun 05 |
45.5 |
9.6 |
44.9 |
35.9 |
45.8 |
8.4 |
45.8 |
37.4 |
31 |
Jul-Sep 05 |
45.7 |
11.2 |
43.1 |
34.5 |
47.0 |
7.4 |
45.6 |
39.6 |
32 |
Oct-Dec 05 |
49.8 |
7.7 |
42.5 |
42.1 |
50.3 |
6.6 |
43.1 |
43.7 |
33 |
Jan-Mar 06 |
48.2 |
9.5 |
42.3 |
38.7 |
46.9 |
5.9 |
47.2 |
41.0 |
34 |
Apr-Jun 06 |
45.8 |
8.4 |
45.8 |
37.4 |
46.0 |
6.9 |
47.1 |
39.1 |
35 |
Jul-Sep 06 |
46.9 |
8.8 |
44.3 |
38.1 |
51.3 |
6.1 |
42.6 |
45.2 |
36 |
Oct-Dec 06 |
50.4 |
7.7 |
41.9 |
42.7 |
51.9 |
5.6 |
42.5 |
46.3 |
37 |
Jan-Ma r07 |
48.6 |
6.1 |
45.3 |
42.5 |
52.1 |
4.8 |
43.1 |
47.3 |
38 |
Apr-Jun 07 |
45.0 |
8.8 |
46.2 |
36.2 |
50.1 |
4.4 |
45.5 |
45.7 |
39 |
Jul-Sep 07 |
45.8 |
9.3 |
44.9 |
36.5 |
48.8 |
5.2 |
46.0 |
43.6 |
40 |
Oct-Dec 07 |
43.7 |
10.7 |
45.6 |
33.0 |
49.0 |
5.0 |
46.0 |
44.0 |
41 |
Jan-Mar 08 |
48.4 |
8.9 |
42.7 |
39.5 |
44.3 |
7.2 |
48.5 |
37.1 |
42 |
Apr-Jun 08 |
44.1 |
14.4 |
41.6 |
29.7 |
48.6 |
7.1 |
44.3 |
41.5 |
43 |
Jul-Sep 08 |
40.8 |
16.4 |
42.8 |
24.4 |
47.5 |
9.0 |
43.5 |
38.5 |
44 |
Oct-Dec 08 |
32.6 |
25.1 |
42.2 |
7.5 |
44.8 |
9.1 |
46.1 |
35.7 |
45 |
Jan-Mar 09 |
22.9 |
39.7 |
37.4 |
-16.8 |
37.3 |
16.7 |
46.1 |
20.6 |
46 |
Apr-Jun 09 |
28.4 |
29.3 |
42.3 |
-0.9 |
31.0 |
24.6 |
44.4 |
6.4 |
|
Jul-Sep 09 |
|
|
|
|
35.5 |
18.7 |
45.8 |
16.8 |
Statement I : Quarter-wise number of responses (per cent) under three options pertaining to assessment for current quarter and expectations for next quarter (Contd.) |
Parameter: 7. Pending Orders, if applicable |
Round No. |
Survey Quarter |
Assessment for Current Quarter |
Expectation for Next Quarter |
Below Normal |
Above Normal |
Normal |
Net response |
Below Normal |
Above Normal |
Normal |
Net response |
1 |
2 |
52 |
53 |
54 |
55 |
56 |
57 |
58 |
59 |
10 |
Apr-Jun 00 |
|
|
|
|
|
|
|
|
11 |
Jul-Sep 00 |
|
|
|
|
|
|
|
|
12 |
Oct-Dec 00 |
|
|
|
|
|
|
|
|
13 |
Jan-mar 01 |
|
|
|
|
|
|
|
|
14 |
Apr-Jun 01 |
|
|
|
|
|
|
|
|
15 |
Jul-Sep 01 |
|
|
|
|
|
|
|
|
16 |
Oct-Dec 01 |
|
|
|
|
|
|
|
|
17 |
Jan-Mar 02 |
|
|
|
|
|
|
|
|
18 |
Apr-Jun 02 |
|
|
|
|
|
|
|
|
19 |
Jul-Sep 02 |
|
|
|
|
|
|
|
|
20 |
Oct-Dec02 |
|
|
|
|
|
|
|
|
21 |
Jan-Mar 03 |
|
|
|
|
|
|
|
|
22 |
Apr-Jun 03 |
|
|
|
|
|
|
|
|
23 |
Jul-Sep 03 |
|
|
|
|
|
|
|
|
24 |
Oct-Dec03 |
|
|
|
|
|
|
|
|
25 |
Jan-Mar 04 |
|
|
|
|
|
|
|
|
26 |
Apr-Jun 04 |
|
|
|
|
|
|
|
|
27 |
Jul-Sep 04 |
|
|
|
|
|
|
|
|
28 |
Oct-Dec 04 |
|
|
|
|
|
|
|
|
29 |
Jan-Mar 05 |
|
|
|
|
|
|
|
|
30 |
Apr-Jun 05 |
|
|
|
|
|
|
|
|
31 |
Jul-Sep 05 |
9.1 |
6.4 |
84.5 |
2.7 |
|
|
|
|
32 |
Oct-Dec 05 |
8.6 |
7.2 |
84.2 |
1.4 |
7.4 |
6.6 |
86.0 |
0.8 |
33 |
Jan-Mar 06 |
10.2 |
8.3 |
81.5 |
1.9 |
6.5 |
7.9 |
85.6 |
-1.4 |
34 |
Apr-Jun 06 |
10.5 |
8.6 |
80.9 |
1.9 |
7.9 |
8.0 |
84.1 |
-0.1 |
35 |
Jul-Sep 06 |
9.6 |
9.1 |
81.3 |
0.5 |
8.9 |
9.7 |
81.4 |
-0.8 |
36 |
Oct-Dec 06 |
9.9 |
9.0 |
81.1 |
0.9 |
8.1 |
10.2 |
81.7 |
-2.1 |
37 |
Jan-Ma r07 |
9.6 |
9.7 |
80.7 |
-0.1 |
7.2 |
9.9 |
82.9 |
-2.7 |
38 |
Apr-Jun 07 |
9.4 |
9.9 |
80.7 |
-0.5 |
7.5 |
9.7 |
82.8 |
-2.2 |
39 |
Jul-Sep 07 |
10.2 |
10.3 |
79.5 |
-0.1 |
7.6 |
9.8 |
82.6 |
-2.2 |
40 |
Oct-Dec 07 |
9.6 |
9.6 |
80.8 |
0.0 |
7.1 |
10.6 |
82.3 |
-3.5 |
41 |
Jan-Mar 08 |
10.6 |
12.4 |
77.0 |
-1.8 |
10.1 |
9.7 |
80.2 |
0.4 |
42 |
Apr-Jun 08 |
13.9 |
8.1 |
78.0 |
5.8 |
7.2 |
11.5 |
81.3 |
-4.3 |
43 |
Jul-Sep 08 |
16.7 |
7.4 |
76.0 |
9.3 |
10.6 |
8.4 |
80.9 |
2.2 |
44 |
Oct-Dec 08 |
19.2 |
5.6 |
75.2 |
13.6 |
11.3 |
6.7 |
82.0 |
4.6 |
45 |
Jan-Mar 09 |
36.3 |
4.3 |
59.4 |
32.0 |
16.9 |
5.4 |
77.8 |
11.5 |
46 |
Apr-Jun 09 |
29.1 |
4.5 |
66.5 |
24.6 |
28.0 |
4.8 |
59.4 |
23.2 |
|
Jul-Sep 09 |
|
|
|
|
22.9 |
3.8 |
73.4 |
19.1 |
Statement I : Quarter-wise number of responses (per cent) under three options pertaining to assessment for current quarter and expectations for next quarter (Contd.) |
Parameter: 8. Cost of raw materials |
Round No. |
Survey Quarter |
Assessment for Current Quarter |
Expectation for Next Quarter |
Increase |
Decrease |
No change |
Net response |
Increase |
Decrease |
No change |
Net response |
1 |
2 |
60 |
61 |
62 |
63 |
64 |
65 |
66 |
67 |
10 |
Apr-Jun 00 |
|
|
|
|
|
|
|
|
11 |
Jul-Sep 00 |
|
|
|
|
|
|
|
|
12 |
Oct-Dec 00 |
|
|
|
|
|
|
|
|
13 |
Jan-mar 01 |
|
|
|
|
|
|
|
|
14 |
Apr-Jun 01 |
|
|
|
|
|
|
|
|
15 |
Jul-Sep 01 |
|
|
|
|
|
|
|
|
16 |
Oct-Dec 01 |
|
|
|
|
|
|
|
|
17 |
Jan-Mar 02 |
|
|
|
|
|
|
|
|
18 |
Apr-Jun 02 |
|
|
|
|
|
|
|
|
19 |
Jul-Sep 02 |
|
|
|
|
|
|
|
|
20 |
Oct-Dec02 |
|
|
|
|
|
|
|
|
21 |
Jan-Mar 03 |
|
|
|
|
|
|
|
|
22 |
Apr-Jun 03 |
|
|
|
|
|
|
|
|
23 |
Jul-Sep 03 |
|
|
|
|
|
|
|
|
24 |
Oct-Dec03 |
4.5 |
40.7 |
54.8 |
-36.2 |
|
|
|
|
25 |
Jan-Mar 04 |
4.6 |
51.9 |
43.5 |
-47.3 |
4.9 |
34.8 |
60.3 |
-29.9 |
26 |
Apr-Jun 04 |
4.5 |
51.7 |
43.8 |
-47.2 |
3.7 |
43.8 |
52.4 |
-40.1 |
27 |
Jul-Sep 04 |
4.5 |
54.3 |
41.2 |
-49.8 |
5.3 |
41.6 |
53.1 |
-36.3 |
28 |
Oct-Dec 04 |
5.8 |
55.6 |
38.6 |
-49.8 |
4.3 |
43.3 |
52.4 |
-39.0 |
29 |
Jan-Mar 05 |
6.9 |
50.9 |
42.2 |
-44.0 |
3.9 |
45.7 |
50.4 |
-41.8 |
30 |
Apr-Jun 05 |
3.8 |
56.2 |
40.1 |
-52.4 |
4.8 |
41.5 |
53.6 |
-36.7 |
31 |
Jul-Sep 05 |
6.0 |
46.1 |
47.9 |
-40.1 |
2.8 |
46.4 |
50.8 |
-43.6 |
32 |
Oct-Dec 05 |
4.4 |
49.6 |
46.0 |
-45.2 |
6.0 |
36.0 |
57.9 |
-30.0 |
33 |
Jan-Mar 06 |
3.8 |
50.5 |
45.7 |
-46.7 |
3.4 |
39.3 |
57.3 |
-35.9 |
34 |
Apr-Jun 06 |
2.6 |
58.2 |
39.2 |
-55.6 |
4.3 |
41.6 |
54.2 |
-37.3 |
35 |
Jul-Sep 06 |
2.0 |
60.2 |
37.8 |
-58.2 |
2.1 |
47.9 |
50.0 |
-45.8 |
36 |
Oct-Dec 06 |
4.6 |
53.9 |
41.5 |
-49.3 |
2.2 |
51.4 |
46.4 |
-49.2 |
37 |
Jan-Ma r07 |
3.8 |
50.3 |
45.9 |
-46.5 |
3.7 |
45.4 |
51.0 |
-41.7 |
38 |
Apr-Jun 07 |
3.0 |
56.8 |
40.3 |
-53.8 |
2.9 |
45.0 |
52.0 |
-42.1 |
39 |
Jul-Sep 07 |
3.1 |
53.7 |
43.2 |
-50.6 |
2.2 |
48.2 |
49.7 |
-46.0 |
40 |
Oct-Dec 07 |
3.5 |
54.1 |
42.3 |
-50.6 |
3.3 |
45.7 |
51.0 |
-42.4 |
41 |
Jan-Mar 08 |
3.6 |
59.4 |
37.1 |
-55.8 |
3.4 |
47.4 |
49.2 |
-44.1 |
42 |
Apr-Jun 08 |
2.2 |
71.1 |
26.7 |
-68.9 |
2.9 |
51.1 |
46.0 |
-48.2 |
43 |
Jul-Sep 08 |
1.4 |
80.8 |
17.8 |
-79.4 |
3.1 |
57.8 |
39.1 |
-54.7 |
44 |
Oct-Dec 08 |
14.1 |
60.1 |
25.8 |
-46.0 |
3.3 |
64.4 |
32.3 |
-61.1 |
45 |
Jan-Mar 09 |
29.1 |
37.2 |
33.7 |
-8.1 |
12.3 |
48.0 |
39.7 |
-35.7 |
46 |
Apr-Jun 09 |
14.3 |
40.6 |
45.1 |
-26.3 |
14.3 |
30.5 |
33.7 |
-16.2 |
|
Jul-Sep 09 |
|
|
|
|
8.7 |
35.8 |
55.5 |
-27.1 |
Statement I : Quarter-wise number of responses (per cent) under three options pertaining to assessment for current quarter and expectations for next quarter (Contd.) |
Parameter: 9. Inventory of raw materials (in quantity terms) |
Round No. |
Survey Quarter |
Assessment for Current Quarter |
Expectation for Next Quarter |
Below Average |
Above Average |
Average |
Net response |
Below Average |
Above Average |
Average |
Net response |
1 |
2 |
68 |
69 |
70 |
71 |
72 |
73 |
74 |
75 |
10 |
Apr-Jun 00 |
8.0 |
8.4 |
83.6 |
-0.4 |
9.9 |
5.4 |
84.7 |
4.5 |
11 |
Jul-Sep 00 |
7.7 |
8.2 |
84.1 |
-0.5 |
7.5 |
6.5 |
86.0 |
1.0 |
12 |
Oct-Dec 00 |
6.5 |
8.5 |
85.0 |
-2.0 |
4.8 |
8.3 |
86.9 |
-3.5 |
13 |
Jan-mar 01 |
7.1 |
10.1 |
82.8 |
-3.0 |
4.6 |
10.4 |
85.0 |
-5.8 |
14 |
Apr-Jun 01 |
8.3 |
9.0 |
82.7 |
-0.7 |
6.7 |
6.5 |
86.8 |
0.2 |
15 |
Jul-Sep 01 |
7.1 |
8.2 |
84.7 |
-1.1 |
5.3 |
6.9 |
87.8 |
-1.6 |
16 |
Oct-Dec 01 |
11.4 |
7.2 |
81.4 |
4.2 |
5.0 |
6.1 |
88.9 |
-1.1 |
17 |
Jan-Mar 02 |
7.1 |
8.2 |
84.7 |
-1.1 |
9.2 |
7.6 |
83.2 |
1.6 |
18 |
Apr-Jun 02 |
6.7 |
7.5 |
85.8 |
-0.8 |
6.7 |
7.3 |
86.0 |
-0.6 |
19 |
Jul-Sep 02 |
11.2 |
8.2 |
80.6 |
3.0 |
6.1 |
5.8 |
88.1 |
0.3 |
20 |
Oct-Dec02 |
8.1 |
9.0 |
82.9 |
-0.9 |
6.9 |
7.6 |
85.5 |
-0.7 |
21 |
Jan-Mar 03 |
8.3 |
12.9 |
78.8 |
-4.6 |
6.8 |
8.7 |
84.5 |
-1.9 |
22 |
Apr-Jun 03 |
9.3 |
10.1 |
80.6 |
-0.8 |
7.1 |
9.3 |
83.6 |
-2.2 |
23 |
Jul-Sep 03 |
9.7 |
8.3 |
82.0 |
1.4 |
8.1 |
8.1 |
83.8 |
0.0 |
24 |
Oct-Dec03 |
7.5 |
8.9 |
83.6 |
-1.4 |
6.3 |
7.3 |
86.4 |
-1.0 |
25 |
Jan-Mar 04 |
8.5 |
11.7 |
79.8 |
-3.2 |
6.0 |
8.9 |
85.1 |
-2.9 |
26 |
Apr-Jun 04 |
7.2 |
11.8 |
81.0 |
-4.6 |
7.4 |
8.2 |
84.4 |
-0.8 |
27 |
Jul-Sep 04 |
8.5 |
10.4 |
81.1 |
-1.9 |
6.5 |
9.9 |
83.6 |
-3.4 |
28 |
Oct-Dec 04 |
7.6 |
12.8 |
79.6 |
-5.2 |
6.1 |
10.2 |
83.7 |
-4.1 |
29 |
Jan-Mar 05 |
6.0 |
14.2 |
79.8 |
-8.2 |
5.0 |
12.4 |
82.6 |
-7.4 |
30 |
Apr-Jun 05 |
5.9 |
12.1 |
82.0 |
-6.2 |
5.6 |
9.9 |
84.5 |
-4.3 |
31 |
Jul-Sep 05 |
4.8 |
12.0 |
83.2 |
-7.2 |
5.6 |
9.8 |
84.6 |
-4.2 |
32 |
Oct-Dec 05 |
4.5 |
10.9 |
84.6 |
-6.4 |
3.9 |
10.8 |
85.3 |
-6.9 |
33 |
Jan-Mar 06 |
5.7 |
11.7 |
82.6 |
-6.0 |
3.0 |
9.8 |
87.2 |
-6.8 |
34 |
Apr-Jun 06 |
5.2 |
12.7 |
82.1 |
-7.5 |
5.0 |
10.0 |
85.0 |
-5.0 |
35 |
Jul-Sep 06 |
6.5 |
12.4 |
81.1 |
-5.9 |
4.6 |
10.9 |
84.5 |
-6.3 |
36 |
Oct-Dec 06 |
5.4 |
13.3 |
81.3 |
-7.9 |
5.2 |
11.3 |
83.5 |
-6.1 |
37 |
Jan-Ma r07 |
5.2 |
12.5 |
82.3 |
-7.3 |
4.6 |
11.7 |
83.7 |
-7.1 |
38 |
Apr-Jun 07 |
6.1 |
12.5 |
81.4 |
-6.4 |
3.6 |
10.9 |
85.5 |
-7.3 |
39 |
Jul-Sep 07 |
5.3 |
11.5 |
83.2 |
-6.2 |
4.8 |
10.2 |
85.0 |
-5.4 |
40 |
Oct-Dec 07 |
4.7 |
11.3 |
84.0 |
-6.6 |
4.3 |
10.6 |
85.1 |
-6.3 |
41 |
Jan-Mar 08 |
6.1 |
14.8 |
79.1 |
-8.7 |
4.0 |
11.2 |
84.8 |
-7.2 |
42 |
Apr-Jun 08 |
9.3 |
13.6 |
77.1 |
-4.3 |
4.9 |
11.9 |
83.2 |
-7.0 |
43 |
Jul-Sep 08 |
9.6 |
16.6 |
73.8 |
-7.0 |
7.2 |
11.0 |
81.8 |
-3.8 |
44 |
Oct-Dec 08 |
10.3 |
15.1 |
74.6 |
-4.8 |
7.4 |
15.0 |
77.6 |
-7.6 |
45 |
Jan-Mar 09 |
13.0 |
14.8 |
72.2 |
-1.8 |
7.7 |
11.0 |
81.3 |
-3.3 |
46 |
Apr-Jun 09 |
9.4 |
11.8 |
78.7 |
-2.4 |
10.5 |
9.4 |
80.2 |
1.1 |
|
Jul-Sep 09 |
|
|
|
|
8.4 |
8.9 |
82.7 |
-0.5 |
Statement I : Quarter-wise number of responses (per cent) under three options pertaining to assessment for current quarter and expectations for next quarter (Contd.) |
Parameter: 10. Inventory of finished goods (in quantity terms) |
Round No. |
Survey Quarter |
Assessment for Current Quarter |
Expectation for Next Quarter |
Below Average |
Above Average |
Average |
Net response |
Below Average |
Above Average |
Average |
Net response |
1 |
2 |
76 |
77 |
78 |
79 |
80 |
81 |
82 |
83 |
10 |
Apr-Jun 00 |
12.3 |
8.8 |
78.9 |
3.5 |
10.7 |
5.1 |
84.2 |
5.6 |
11 |
Jul-Sep 00 |
7.4 |
11.8 |
80.8 |
-4.4 |
9.0 |
7.6 |
83.4 |
1.4 |
12 |
Oct-Dec 00 |
8.0 |
13.2 |
78.8 |
-5.2 |
4.4 |
9.4 |
86.2 |
-5.0 |
13 |
Jan-mar 01 |
7.1 |
15.4 |
77.5 |
-8.3 |
5.8 |
10.5 |
83.7 |
-4.7 |
14 |
Apr-Jun 01 |
7.9 |
11.7 |
80.4 |
-3.8 |
5.7 |
10.1 |
84.2 |
-4.4 |
15 |
Jul-Sep 01 |
6.6 |
11.2 |
82.2 |
-4.6 |
5.1 |
8.7 |
86.2 |
-3.6 |
16 |
Oct-Dec 01 |
10.7 |
13.1 |
76.2 |
-2.4 |
4.9 |
7.7 |
87.4 |
-2.8 |
17 |
Jan-Mar 02 |
6.6 |
12.7 |
80.7 |
-6.1 |
8.3 |
11.9 |
79.8 |
-3.6 |
18 |
Apr-Jun 02 |
6.9 |
11.5 |
81.6 |
-4.6 |
5.9 |
8.2 |
85.9 |
-2.3 |
19 |
Jul-Sep 02 |
9.0 |
11.4 |
79.6 |
-2.4 |
4.5 |
9.8 |
85.7 |
-5.3 |
20 |
Oct-Dec02 |
8.2 |
13.4 |
78.4 |
-5.2 |
6.2 |
10.5 |
83.3 |
-4.3 |
21 |
Jan-Mar 03 |
8.1 |
13.3 |
78.6 |
-5.2 |
5.5 |
11.5 |
83.0 |
-6.0 |
22 |
Apr-Jun 03 |
7.9 |
13.8 |
78.3 |
-5.9 |
6.8 |
11.5 |
81.7 |
-4.7 |
23 |
Jul-Sep 03 |
8.2 |
10.0 |
81.7 |
-1.8 |
7.4 |
10.1 |
82.5 |
-2.7 |
24 |
Oct-Dec03 |
7.1 |
10.1 |
82.8 |
-3.0 |
5.8 |
9.5 |
84.7 |
-3.7 |
25 |
Jan-Mar 04 |
8.4 |
12.6 |
79.1 |
-4.2 |
6.4 |
9.6 |
84.1 |
-3.2 |
26 |
Apr-Jun 04 |
8.1 |
10.3 |
81.6 |
-2.2 |
6.4 |
10.4 |
83.2 |
-4.0 |
27 |
Jul-Sep 04 |
7.7 |
12.6 |
79.7 |
-4.9 |
6.9 |
9.1 |
83.9 |
-2.2 |
28 |
Oct-Dec 04 |
7.3 |
11.6 |
81.1 |
-4.3 |
6.7 |
10.2 |
83.1 |
-3.5 |
29 |
Jan-Mar 05 |
7.6 |
12.3 |
80.1 |
-4.7 |
6.3 |
11.5 |
82.3 |
-5.2 |
30 |
Apr-Jun 05 |
6.3 |
12.4 |
81.3 |
-6.1 |
6.0 |
9.1 |
84.9 |
-3.1 |
31 |
Jul-Sep 05 |
6.4 |
12.7 |
80.9 |
-6.3 |
5.8 |
10.0 |
84.2 |
-4.2 |
32 |
Oct-Dec 05 |
5.6 |
10.0 |
84.4 |
-4.4 |
5.1 |
8.4 |
86.5 |
-3.3 |
33 |
Jan-Mar 06 |
7.1 |
12.3 |
80.5 |
-5.2 |
5.5 |
10.2 |
84.3 |
-4.7 |
34 |
Apr-Jun 06 |
7.9 |
10.1 |
82.0 |
-2.2 |
5.2 |
9.7 |
85.0 |
-4.5 |
35 |
Jul-Sep 06 |
6.9 |
12.5 |
80.6 |
-5.6 |
6.5 |
9.1 |
84.4 |
-2.6 |
36 |
Oct-Dec 06 |
6.2 |
11.7 |
82.1 |
-5.5 |
5.8 |
10.7 |
83.5 |
-4.9 |
37 |
Jan-Ma r07 |
6.9 |
11.6 |
81.5 |
-4.7 |
5.1 |
10.3 |
84.5 |
-5.2 |
38 |
Apr-Jun 07 |
6.4 |
9.9 |
83.7 |
-3.5 |
5.2 |
9.6 |
85.2 |
-4.4 |
39 |
Jul-Sep 07 |
5.6 |
11.8 |
82.6 |
-6.1 |
5.1 |
7.8 |
87.1 |
-2.7 |
40 |
Oct-Dec 07 |
4.4 |
11.8 |
83.8 |
-7.5 |
5.1 |
8.6 |
86.4 |
-3.5 |
41 |
Jan-Mar 08 |
5.8 |
12.7 |
81.5 |
-6.9 |
4.7 |
9.2 |
86.1 |
-4.5 |
42 |
Apr-Jun 08 |
7.8 |
11.7 |
80.5 |
-3.9 |
4.9 |
10.7 |
84.5 |
-5.8 |
43 |
Jul-Sep 08 |
8.1 |
12.1 |
79.9 |
-4.0 |
7.0 |
8.5 |
84.5 |
-1.5 |
44 |
Oct-Dec 08 |
8.0 |
16.4 |
75.6 |
-8.4 |
6.5 |
10.8 |
82.6 |
-4.3 |
45 |
Jan-Mar 09 |
8.6 |
21.7 |
69.7 |
-13.1 |
7.3 |
11.7 |
80.9 |
-4.4 |
46 |
Apr-Jun 09 |
9.6 |
13.8 |
76.6 |
-4.2 |
8.6 |
13.0 |
78.4 |
-4.4 |
|
Jul-Sep 09 |
|
|
|
|
8.8 |
10.6 |
80.6 |
-1.8 |
Statement I : Quarter-wise number of responses (per cent) under three options pertaining to assessment for current quarter and expectations for next quarter (Contd.) |
Parameter: 11. Capacity utilisation (main product) |
Round No. |
Survey Quarter |
Assessment for Current Quarter |
Expectation for Next Quarter |
Increase |
Decrease |
No change |
Net response |
Increase |
Decrease |
No change |
Net response |
1 |
2 |
84 |
85 |
86 |
87 |
88 |
89 |
90 |
91 |
10 |
Apr-Jun 00 |
40.3 |
17.4 |
42.3 |
22.9 |
46.6 |
8.9 |
44.5 |
37.7 |
11 |
Jul-Sep 00 |
36.8 |
14.9 |
48.3 |
21.9 |
45.3 |
8.3 |
46.4 |
37.0 |
12 |
Oct-Dec 00 |
36.3 |
12.3 |
51.4 |
24.0 |
42.9 |
6.7 |
50.4 |
36.2 |
13 |
Jan-mar 01 |
41.2 |
12.5 |
46.3 |
28.7 |
41.2 |
7.5 |
51.3 |
33.7 |
14 |
Apr-Jun 01 |
34.1 |
16.3 |
49.6 |
17.8 |
39.6 |
9.3 |
51.1 |
30.3 |
15 |
Jul-Sep 01 |
31.4 |
18.8 |
49.8 |
12.6 |
37.7 |
9.3 |
53.0 |
28.4 |
16 |
Oct-Dec 01 |
30.6 |
18.2 |
51.2 |
12.4 |
35.7 |
8.4 |
55.9 |
27.3 |
17 |
Jan-Mar 02 |
32.8 |
12.5 |
54.7 |
20.3 |
35.4 |
15.1 |
49.5 |
20.3 |
18 |
Apr-Jun 02 |
31.5 |
13.1 |
55.4 |
18.4 |
35.1 |
11.1 |
53.8 |
24.0 |
19 |
Jul-Sep 02 |
30.7 |
14.6 |
54.7 |
16.1 |
35.7 |
9.3 |
55.0 |
26.4 |
20 |
Oct-Dec02 |
33.0 |
12.4 |
54.6 |
20.6 |
37.1 |
7.6 |
55.3 |
29.5 |
21 |
Jan-Mar 03 |
36.1 |
9.8 |
54.1 |
26.3 |
35.2 |
7.9 |
56.9 |
27.3 |
22 |
Apr-Jun 03 |
28.8 |
16.9 |
54.3 |
11.9 |
31.5 |
10.8 |
57.7 |
20.7 |
23 |
Jul-Sep 03 |
34.7 |
12.5 |
52.8 |
22.2 |
33.4 |
11.0 |
55.5 |
22.4 |
24 |
Oct-Dec03 |
36.7 |
10.4 |
52.9 |
26.3 |
39.0 |
7.6 |
53.4 |
31.4 |
25 |
Jan-Mar 04 |
42.9 |
9.8 |
47.3 |
33.1 |
37.7 |
6.8 |
55.6 |
30.9 |
26 |
Apr-Jun 04 |
36.8 |
12.2 |
51.0 |
24.6 |
39.1 |
8.2 |
52.7 |
30.9 |
27 |
Jul-Sep 04 |
34.0 |
10.8 |
55.2 |
23.2 |
36.3 |
8.3 |
55.4 |
28.0 |
28 |
Oct-Dec 04 |
38.9 |
9.4 |
51.7 |
29.5 |
34.7 |
6.9 |
58.4 |
27.8 |
29 |
Jan-Mar 05 |
39.6 |
9.3 |
51.1 |
30.3 |
38.0 |
6.7 |
55.3 |
31.3 |
30 |
Apr-Jun 05 |
35.4 |
10.5 |
54.1 |
24.9 |
35.5 |
7.8 |
56.7 |
27.7 |
31 |
Jul-Sep 05 |
33.1 |
9.0 |
57.9 |
24.1 |
32.3 |
6.9 |
60.9 |
25.4 |
32 |
Oct-Dec 05 |
36.5 |
5.3 |
58.2 |
31.2 |
35.8 |
4.7 |
59.6 |
31.1 |
33 |
Jan-Mar 06 |
33.8 |
7.8 |
58.4 |
26.0 |
34.4 |
4.8 |
60.8 |
29.6 |
34 |
Apr-Jun 06 |
35.1 |
8.5 |
56.4 |
26.6 |
32.5 |
7.7 |
59.8 |
24.8 |
35 |
Jul-Sep 06 |
34.7 |
8.1 |
57.2 |
26.6 |
38.2 |
6.1 |
55.7 |
32.1 |
36 |
Oct-Dec 06 |
33.8 |
6.6 |
59.6 |
27.2 |
38.3 |
5.1 |
56.6 |
33.2 |
37 |
Jan-Ma r07 |
33.9 |
5.8 |
60.3 |
28.1 |
37.8 |
4.5 |
57.7 |
33.3 |
38 |
Apr-Jun 07 |
31.7 |
7.5 |
60.8 |
24.2 |
34.5 |
5.1 |
60.4 |
29.4 |
39 |
Jul-Sep 07 |
31.3 |
8.7 |
60.0 |
22.6 |
32.8 |
5.8 |
61.4 |
27.0 |
40 |
Oct-Dec 07 |
30.7 |
8.5 |
60.8 |
22.2 |
33.5 |
5.0 |
61.5 |
28.5 |
41 |
Jan-Mar 08 |
33.6 |
8.5 |
57.9 |
25.1 |
31.0 |
6.8 |
62.3 |
24.2 |
42 |
Apr-Jun 08 |
31.0 |
13.3 |
55.7 |
17.7 |
32.9 |
7.3 |
59.9 |
25.6 |
43 |
Jul-Sep 08 |
28.9 |
15.3 |
55.8 |
13.6 |
31.7 |
9.5 |
58.8 |
22.2 |
44 |
Oct-Dec 08 |
23.2 |
21.5 |
55.3 |
1.7 |
35.2 |
8.8 |
56.0 |
26.4 |
45 |
Jan-Mar 09 |
17.4 |
33.7 |
48.9 |
-16.3 |
26.6 |
14.3 |
59.1 |
12.3 |
46 |
Apr-Jun 09 |
21.6 |
25.3 |
53.1 |
-3.7 |
22.2 |
22.9 |
55.0 |
-0.7 |
|
Jul-Sep 09 |
|
|
|
|
26.6 |
15.9 |
57.5 |
10.7 |
Statement I : Quarter-wise number of responses (per cent) under three options pertaining to assessment for current quarter and expectations for next quarter (Contd.) |
Parameter: 12. Level of capacity utilisation (compared to average in preceding 4 quarters) |
Round No. |
Survey Quarter |
Assessment for Current Quarter |
Expectation for Next Quarter |
Above Normal |
Below Normal |
Normal |
Net response |
Above Normal |
Below Normal |
Normal |
Net response |
1 |
2 |
92 |
93 |
94 |
95 |
96 |
97 |
98 |
99 |
10 |
Apr-Jun 00 |
10.4 |
9.5 |
80.1 |
0.9 |
13.8 |
10.2 |
76.0 |
3.6 |
11 |
Jul-Sep 00 |
9.8 |
16.8 |
73.4 |
-7.0 |
12.5 |
12.5 |
75.0 |
0.0 |
12 |
Oct-Dec 00 |
10.0 |
16.3 |
73.7 |
-6.3 |
11.1 |
9.8 |
79.1 |
1.3 |
13 |
Jan-mar 01 |
9.6 |
17.4 |
73.0 |
-7.8 |
13.5 |
10.5 |
76.0 |
3.0 |
14 |
Apr-Jun 01 |
10.5 |
18.1 |
71.4 |
-7.6 |
11.6 |
13.3 |
75.1 |
-1.7 |
15 |
Jul-Sep 01 |
7.3 |
19.2 |
73.5 |
-11.9 |
9.6 |
10.6 |
79.8 |
-1.0 |
16 |
Oct-Dec 01 |
9.3 |
23.6 |
67.1 |
-14.3 |
7.7 |
11.9 |
80.4 |
-4.2 |
17 |
Jan-Mar 02 |
10.9 |
18.5 |
70.6 |
-7.6 |
10.3 |
21.1 |
68.6 |
-10.8 |
18 |
Apr-Jun 02 |
11.5 |
15.0 |
73.5 |
-3.5 |
10.5 |
16.1 |
73.4 |
-5.6 |
19 |
Jul-Sep 02 |
11.7 |
15.5 |
72.8 |
-3.8 |
12.2 |
13.1 |
74.7 |
-0.9 |
20 |
Oct-Dec02 |
13.4 |
12.0 |
74.6 |
1.4 |
12.7 |
10.5 |
76.8 |
2.2 |
21 |
Jan-Mar 03 |
17.2 |
12.2 |
70.6 |
5.0 |
15.3 |
9.3 |
75.4 |
6.0 |
22 |
Apr-Jun 03 |
11.2 |
16.7 |
72.1 |
-5.5 |
14.4 |
13.3 |
72.3 |
1.1 |
23 |
Jul-Sep 03 |
13.7 |
14.2 |
72.1 |
-0.5 |
13.6 |
13.0 |
73.4 |
0.6 |
24 |
Oct-Dec03 |
15.3 |
11.4 |
73.3 |
3.9 |
14.2 |
9.4 |
76.4 |
4.8 |
25 |
Jan-Mar 04 |
17.3 |
12.8 |
70.0 |
4.5 |
15.6 |
8.4 |
76.0 |
7.2 |
26 |
Apr-Jun 04 |
16.3 |
12.2 |
71.4 |
4.1 |
15.8 |
8.4 |
75.8 |
7.4 |
27 |
Jul-Sep 04 |
13.1 |
12.2 |
74.7 |
0.9 |
17.1 |
9.0 |
73.9 |
8.1 |
28 |
Oct-Dec 04 |
18.1 |
9.8 |
72.1 |
8.3 |
15.0 |
8.7 |
76.4 |
6.3 |
29 |
Jan-Mar 05 |
19.2 |
9.6 |
71.2 |
9.6 |
19.4 |
6.5 |
74.1 |
12.9 |
30 |
Apr-Jun 05 |
17.3 |
9.5 |
73.1 |
7.8 |
16.0 |
7.9 |
76.0 |
8.1 |
31 |
Jul-Sep 05 |
14.7 |
8.1 |
77.3 |
6.6 |
14.9 |
7.3 |
77.8 |
7.6 |
32 |
Oct-Dec 05 |
17.0 |
6.5 |
76.5 |
10.5 |
15.9 |
5.0 |
79.1 |
10.9 |
33 |
Jan-Mar 06 |
18.2 |
8.5 |
73.3 |
9.7 |
16.4 |
5.0 |
78.6 |
11.4 |
34 |
Apr-Jun 06 |
17.8 |
8.6 |
73.7 |
9.2 |
16.2 |
6.8 |
77.0 |
9.4 |
35 |
Jul-Sep 06 |
16.3 |
8.7 |
75.0 |
7.6 |
18.2 |
6.4 |
75.4 |
11.8 |
36 |
Oct-Dec 06 |
17.9 |
8.3 |
73.7 |
9.6 |
17.2 |
6.3 |
76.6 |
10.9 |
37 |
Jan-Ma r07 |
19.3 |
7.4 |
73.3 |
11.9 |
18.2 |
5.4 |
76.4 |
12.8 |
38 |
Apr-Jun 07 |
16.7 |
8.9 |
74.4 |
7.8 |
17.2 |
5.7 |
77.1 |
11.5 |
39 |
Jul-Sep 07 |
14.9 |
10.0 |
75.1 |
4.9 |
16.5 |
7.1 |
76.5 |
9.4 |
40 |
Oct-Dec 07 |
14.5 |
9.3 |
76.2 |
5.1 |
16.7 |
6.0 |
77.2 |
10.7 |
41 |
Jan-Mar 08 |
16.8 |
9.5 |
73.7 |
7.3 |
14.0 |
7.7 |
78.3 |
6.4 |
42 |
Apr-Jun 08 |
12.3 |
13.8 |
73.9 |
-1.5 |
16.2 |
6.8 |
77.0 |
9.4 |
43 |
Jul-Sep 08 |
10.6 |
14.7 |
74.7 |
-4.1 |
14.4 |
10.8 |
74.9 |
3.6 |
44 |
Oct-Dec 08 |
9.2 |
21.2 |
69.7 |
-12.0 |
10.4 |
10.9 |
78.7 |
-0.5 |
45 |
Jan-Mar 09 |
6.2 |
35.5 |
58.3 |
-29.3 |
9.4 |
16.8 |
73.7 |
-7.4 |
46 |
Apr-Jun 09 |
8.3 |
27.5 |
64.2 |
-19.2 |
6.4 |
27.2 |
66.4 |
-20.8 |
|
Jul-Sep 09 |
|
|
|
|
8.6 |
20.7 |
70.8 |
-12.1 |
Statement I : Quarter-wise number of responses (per cent) under three options pertaining to assessment for current quarter and expectations for next quarter (Contd.) |
Parameter: 13. Assessment of production capacity w.r.t. expected demand in next 6 month |
Round No. |
Survey Quarter |
Assessment for Current Quarter |
Expectation for Next Quarter |
More than adequate |
Not adequate |
Adequate |
Net response |
More than adequate |
Not adequate |
Adequate |
Net response |
1 |
2 |
100 |
101 |
102 |
103 |
104 |
105 |
106 |
107 |
10 |
Apr-Jun 00 |
14.4 |
7.4 |
78.2 |
7.0 |
13.9 |
4.5 |
81.6 |
9.4 |
11 |
Jul-Sep 00 |
11.1 |
5.9 |
83.0 |
5.2 |
15.0 |
6.1 |
78.9 |
8.9 |
12 |
Oct-Dec 00 |
12.5 |
4.9 |
82.6 |
7.6 |
12.5 |
4.1 |
83.4 |
8.4 |
13 |
Jan-mar 01 |
13.4 |
5.9 |
80.7 |
7.5 |
13.8 |
3.8 |
82.4 |
10.0 |
14 |
Apr-Jun 01 |
13.9 |
5.9 |
80.2 |
8.0 |
12.6 |
5.1 |
82.3 |
7.5 |
15 |
Jul-Sep 01 |
14.3 |
5.5 |
80.2 |
8.8 |
12.7 |
4.4 |
82.9 |
8.3 |
16 |
Oct-Dec 01 |
14.0 |
14.4 |
71.6 |
-0.4 |
13.5 |
4.3 |
82.2 |
9.2 |
17 |
Jan-Mar 02 |
15.2 |
6.5 |
78.3 |
8.7 |
14.8 |
13.1 |
72.1 |
1.7 |
18 |
Apr-Jun 02 |
16.2 |
5.2 |
78.6 |
11.0 |
15.7 |
6.8 |
77.5 |
8.9 |
19 |
Jul-Sep 02 |
14.0 |
6.4 |
79.6 |
7.6 |
16.3 |
5.4 |
78.3 |
10.9 |
20 |
Oct-Dec02 |
17.1 |
6.1 |
76.8 |
11.0 |
14.8 |
5.2 |
80.0 |
9.6 |
21 |
Jan-Mar 03 |
16.9 |
7.2 |
75.9 |
9.7 |
17.6 |
5.7 |
76.7 |
11.9 |
22 |
Apr-Jun 03 |
16.3 |
6.1 |
77.6 |
10.2 |
16.9 |
6.9 |
76.2 |
10.0 |
23 |
Jul-Sep 03 |
13.7 |
6.4 |
79.9 |
7.3 |
16.6 |
6.2 |
77.2 |
10.4 |
24 |
Oct-Dec03 |
15.2 |
6.1 |
78.7 |
9.1 |
14.5 |
5.4 |
80.1 |
9.1 |
25 |
Jan-Mar 04 |
15.3 |
7.0 |
77.7 |
8.3 |
14.2 |
5.7 |
80.1 |
8.5 |
26 |
Apr-Jun 04 |
15.2 |
7.8 |
77.0 |
7.4 |
15.2 |
6.2 |
78.7 |
9.0 |
27 |
Jul-Sep 04 |
12.2 |
7.7 |
80.1 |
4.5 |
13.4 |
7.3 |
79.3 |
6.1 |
28 |
Oct-Dec 04 |
12.7 |
7.6 |
79.6 |
5.1 |
12.0 |
6.6 |
81.4 |
5.4 |
29 |
Jan-Mar 05 |
12.8 |
8.3 |
78.9 |
4.5 |
13.2 |
6.6 |
80.2 |
6.6 |
30 |
Apr-Jun 05 |
11.6 |
6.8 |
81.6 |
4.8 |
13.3 |
7.6 |
79.0 |
5.7 |
31 |
Jul-Sep 05 |
11.8 |
6.2 |
82.0 |
5.6 |
12.0 |
6.7 |
81.2 |
5.3 |
32 |
Oct-Dec 05 |
10.8 |
5.7 |
83.5 |
5.1 |
10.3 |
5.3 |
84.3 |
5.0 |
33 |
Jan-Mar 06 |
10.3 |
7.0 |
82.7 |
3.3 |
10.2 |
5.3 |
84.4 |
4.9 |
34 |
Apr-Jun 06 |
11.5 |
8.9 |
79.6 |
2.6 |
11.4 |
7.3 |
81.4 |
4.1 |
35 |
Jul-Sep 06 |
11.4 |
8.3 |
80.3 |
3.1 |
11.5 |
7.9 |
80.6 |
3.6 |
36 |
Oct-Dec 06 |
10.0 |
8.1 |
81.9 |
1.9 |
12.7 |
7.6 |
79.7 |
5.1 |
37 |
Jan-Ma r07 |
10.1 |
7.1 |
82.2 |
3.0 |
11.5 |
6.7 |
81.8 |
4.8 |
38 |
Apr-Jun 07 |
10.4 |
8.0 |
81.5 |
2.4 |
10.9 |
6.9 |
82.2 |
4.0 |
39 |
Jul-Sep 07 |
10.7 |
7.4 |
82.0 |
3.3 |
10.4 |
7.4 |
82.2 |
3.0 |
40 |
Oct-Dec 07 |
10.5 |
6.1 |
83.4 |
4.3 |
10.6 |
6.4 |
83.0 |
4.2 |
41 |
Jan-Mar 08 |
13.7 |
6.3 |
79.9 |
7.4 |
10.5 |
5.8 |
83.8 |
4.7 |
42 |
Apr-Jun 08 |
12.1 |
8.1 |
79.7 |
4.0 |
13.4 |
5.4 |
81.2 |
8.0 |
43 |
Jul-Sep 08 |
12.1 |
7.1 |
80.8 |
5.0 |
11.6 |
7.0 |
81.3 |
4.6 |
44 |
Oct-Dec 08 |
15.9 |
3.8 |
80.3 |
12.1 |
12.0 |
6.3 |
81.7 |
5.7 |
45 |
Jan-Mar 09 |
18.6 |
10.3 |
71.1 |
8.3 |
15.4 |
3.6 |
81.0 |
11.8 |
46 |
Apr-Jun 09 |
14.0 |
9.4 |
76.6 |
4.6 |
19.1 |
10.2 |
70.7 |
8.9 |
|
Jul-Sep 09 |
|
|
|
|
14.3 |
8.8 |
76.9 |
5.5 |
Statement I : Quarter-wise number of responses (per cent) under three options pertaining to assessment for current quarter and expectations for next quarter (Contd.) |
Parameter: 14. Employment in company (including part time/ full-time/casual labour) |
Round No. |
Survey Quarter |
Assessment for Current Quarter |
Expectation for Next Quarter |
Increase |
Decrease |
No change |
Net response |
Increase |
Decrease |
No change |
Net response |
1 |
2 |
108 |
109 |
110 |
111 |
112 |
113 |
114 |
115 |
10 |
Apr-Jun 00 |
10.9 |
18.4 |
70.7 |
-7.5 |
10.7 |
10.8 |
78.5 |
-0.1 |
11 |
Jul-Sep 00 |
7.8 |
15.1 |
77.1 |
-7.3 |
11.0 |
11.2 |
77.8 |
-0.2 |
12 |
Oct-Dec 00 |
7.5 |
14.8 |
77.7 |
-7.3 |
8.9 |
10.9 |
80.2 |
-2.0 |
13 |
Jan-mar 01 |
7.9 |
16.2 |
75.9 |
-8.3 |
8.4 |
13.8 |
77.8 |
-5.4 |
14 |
Apr-Jun 01 |
5.2 |
18.3 |
76.5 |
-13.1 |
8.0 |
13.5 |
78.5 |
-5.5 |
15 |
Jul-Sep 01 |
5.9 |
15.7 |
78.4 |
-9.8 |
7.5 |
15.8 |
76.7 |
-8.3 |
16 |
Oct-Dec 01 |
4.8 |
20.9 |
74.3 |
-16.1 |
6.8 |
11.4 |
81.8 |
-4.6 |
17 |
Jan-Mar 02 |
5.2 |
16.9 |
77.9 |
-11.7 |
5.0 |
18.4 |
76.6 |
-13.4 |
18 |
Apr-Jun 02 |
8.0 |
15.1 |
76.9 |
-7.1 |
5.3 |
14.5 |
80.2 |
-9.2 |
19 |
Jul-Sep 02 |
7.0 |
17.3 |
75.7 |
-10.3 |
7.8 |
12.4 |
79.8 |
-4.6 |
20 |
Oct-Dec02 |
8.6 |
12.6 |
78.8 |
-4.0 |
8.8 |
13.3 |
77.9 |
-4.5 |
21 |
Jan-Mar 03 |
9.4 |
12.9 |
77.7 |
-3.5 |
9.1 |
11.1 |
79.8 |
-2.0 |
22 |
Apr-Jun 03 |
8.0 |
12.7 |
79.3 |
-4.7 |
8.4 |
12.1 |
79.5 |
-3.7 |
23 |
Jul-Sep 03 |
8.9 |
12.8 |
78.2 |
-3.9 |
8.1 |
10.8 |
81.1 |
-2.7 |
24 |
Oct-Dec03 |
11.5 |
11.3 |
77.1 |
0.2 |
9.3 |
10.9 |
79.8 |
-1.6 |
25 |
Jan-Mar 04 |
13.3 |
11.5 |
75.3 |
1.8 |
11.9 |
9.6 |
78.5 |
2.3 |
26 |
Apr-Jun 04 |
13.7 |
9.9 |
76.5 |
3.8 |
14.0 |
9.4 |
76.7 |
4.6 |
27 |
Jul-Sep 04 |
13.8 |
9.2 |
77.0 |
4.6 |
13.0 |
9.3 |
77.7 |
3.7 |
28 |
Oct-Dec 04 |
16.2 |
7.7 |
76.1 |
8.5 |
13.9 |
7.9 |
78.2 |
6.0 |
29 |
Jan-Mar 05 |
14.2 |
7.0 |
78.8 |
7.2 |
15.0 |
7.0 |
78.1 |
8.0 |
30 |
Apr-Jun 05 |
14.9 |
6.1 |
79.0 |
8.8 |
14.4 |
6.7 |
78.9 |
7.7 |
31 |
Jul-Sep 05 |
17.1 |
6.3 |
76.6 |
10.8 |
13.9 |
6.1 |
80.1 |
7.8 |
32 |
Oct-Dec 05 |
19.1 |
5.3 |
75.6 |
13.8 |
17.0 |
4.3 |
78.7 |
12.7 |
33 |
Jan-Mar 06 |
19.1 |
5.5 |
75.4 |
13.6 |
17.8 |
4.5 |
77.7 |
13.3 |
34 |
Apr-Jun 06 |
21.1 |
6.6 |
72.2 |
14.5 |
20.1 |
5.6 |
74.3 |
14.5 |
35 |
Jul-Sep 06 |
22.3 |
6.4 |
71.2 |
15.9 |
22.6 |
6.2 |
71.2 |
16.4 |
36 |
Oct-Dec 06 |
23.4 |
5.5 |
71.1 |
17.9 |
22.3 |
4.4 |
73.3 |
17.9 |
37 |
Jan-Ma r07 |
23.2 |
4.7 |
72.1 |
18.5 |
22.2 |
4.1 |
73.7 |
18.1 |
38 |
Apr-Jun 07 |
20.3 |
6.0 |
73.6 |
14.3 |
22.5 |
4.2 |
73.3 |
18.3 |
39 |
Jul-Sep 07 |
21.8 |
6.4 |
71.8 |
15.4 |
21.9 |
4.6 |
73.5 |
17.4 |
40 |
Oct-Dec 07 |
20.4 |
5.6 |
74.0 |
14.8 |
21.3 |
4.6 |
74.1 |
16.7 |
41 |
Jan-Mar 08 |
26.6 |
5.8 |
67.6 |
20.8 |
19.5 |
4.9 |
75.6 |
14.6 |
42 |
Apr-Jun 08 |
23.4 |
7.0 |
69.6 |
16.4 |
26.3 |
5.5 |
68.2 |
20.8 |
43 |
Jul-Sep 08 |
23.5 |
9.4 |
67.1 |
14.1 |
22.2 |
6.4 |
71.5 |
15.8 |
44 |
Oct-Dec 08 |
18.7 |
9.3 |
72.0 |
9.4 |
23.1 |
6.5 |
70.4 |
16.6 |
45 |
Jan-Mar 09 |
11.2 |
19.5 |
69.3 |
-8.3 |
16.0 |
8.3 |
75.7 |
7.7 |
46 |
Apr-Jun 09 |
11.9 |
15.2 |
72.9 |
-3.3 |
10.5 |
15.6 |
74.0 |
-5.1 |
|
Jul-Sep 09 |
|
|
|
|
11.5 |
10.0 |
78.6 |
1.5 |
Statement I : Quarter-wise number of responses (per cent) under three options pertaining to assessment for current quarter and expectations for next quarter (Contd.) |
Parameter: 15. Exports, if applicable |
Round No. |
Survey Quarter |
Assessment for Current Quarter |
Expectation for Next Quarter |
Increase |
Decrease |
No change |
Net response |
Increase |
Decrease |
No change |
Net response |
1 |
2 |
116 |
117 |
118 |
119 |
120 |
121 |
122 |
123 |
10 |
Apr-Jun 00 |
32.0 |
12.2 |
55.8 |
19.8 |
41.5 |
6.4 |
52.1 |
35.1 |
11 |
Jul-Sep 00 |
32.9 |
9.9 |
57.2 |
23.0 |
33.4 |
6.2 |
60.4 |
27.2 |
12 |
Oct-Dec 00 |
32.8 |
10.9 |
56.3 |
21.9 |
35.4 |
5.1 |
59.5 |
30.3 |
13 |
Jan-mar 01 |
30.7 |
11.9 |
57.4 |
18.8 |
36.3 |
6.5 |
57.2 |
29.8 |
14 |
Apr-Jun 01 |
30.5 |
12.7 |
56.8 |
17.8 |
33.3 |
7.0 |
59.7 |
26.3 |
15 |
Jul-Sep 01 |
30.5 |
13.6 |
55.9 |
16.9 |
33.6 |
7.7 |
58.7 |
25.9 |
16 |
Oct-Dec 01 |
22.5 |
30.8 |
46.7 |
-8.3 |
35.3 |
7.1 |
57.6 |
28.2 |
17 |
Jan-Mar 02 |
27.3 |
11.1 |
61.6 |
16.2 |
25.1 |
27.9 |
47.0 |
-2.8 |
18 |
Apr-Jun 02 |
30.5 |
11.9 |
57.6 |
18.6 |
28.8 |
11.6 |
59.6 |
17.2 |
19 |
Jul-Sep 02 |
32.5 |
11.9 |
55.6 |
20.6 |
32.3 |
7.8 |
59.9 |
24.5 |
20 |
Oct-Dec02 |
33.7 |
9.4 |
56.9 |
24.3 |
37.5 |
7.3 |
55.2 |
30.2 |
21 |
Jan-Mar 03 |
34.2 |
8.0 |
57.8 |
26.2 |
37.4 |
6.6 |
56.0 |
30.8 |
22 |
Apr-Jun 03 |
32.8 |
10.9 |
56.3 |
21.9 |
31.7 |
7.8 |
60.5 |
23.9 |
23 |
Jul-Sep 03 |
33.8 |
11.6 |
54.6 |
22.2 |
34.9 |
8.0 |
57.1 |
26.9 |
24 |
Oct-Dec03 |
33.8 |
9.5 |
56.7 |
24.3 |
38.5 |
7.7 |
53.8 |
30.8 |
25 |
Jan-Mar 04 |
37.6 |
9.8 |
52.6 |
27.8 |
38.0 |
6.5 |
55.5 |
31.5 |
26 |
Apr-Jun 04 |
32.4 |
11.8 |
55.8 |
20.6 |
36.0 |
7.6 |
56.4 |
28.4 |
27 |
Jul-Sep 04 |
37.5 |
8.2 |
54.3 |
29.3 |
34.4 |
7.9 |
57.7 |
26.5 |
28 |
Oct-Dec 04 |
35.5 |
9.2 |
55.3 |
26.3 |
37.2 |
5.6 |
57.2 |
31.6 |
29 |
Jan-Mar 05 |
38.6 |
7.4 |
54.0 |
31.2 |
37.7 |
6.2 |
56.1 |
31.5 |
30 |
Apr-Jun 05 |
35.6 |
7.9 |
56.5 |
27.7 |
36.4 |
6.2 |
57.4 |
30.2 |
31 |
Jul-Sep 05 |
34.9 |
8.7 |
56.4 |
26.2 |
36.9 |
4.4 |
58.7 |
32.5 |
32 |
Oct-Dec 05 |
36.5 |
7.9 |
55.6 |
28.6 |
37.8 |
4.5 |
57.7 |
33.3 |
33 |
Jan-Mar 06 |
38.4 |
6.7 |
54.9 |
31.7 |
35.9 |
4.1 |
60.0 |
31.8 |
34 |
Apr-Jun 06 |
38.2 |
7.6 |
54.2 |
30.6 |
36.3 |
5.3 |
58.4 |
31.0 |
35 |
Jul-Sep 06 |
35.7 |
7.7 |
56.6 |
28.0 |
42.8 |
4.5 |
52.7 |
38.3 |
36 |
Oct-Dec 06 |
36.7 |
9.0 |
54.3 |
27.7 |
38.5 |
4.3 |
57.2 |
34.2 |
37 |
Jan-Ma r07 |
36.4 |
7.6 |
56.0 |
28.8 |
37.7 |
5.1 |
57.2 |
32.6 |
38 |
Apr-Jun 07 |
35.1 |
9.6 |
55.3 |
25.5 |
38.3 |
4.9 |
56.8 |
33.4 |
39 |
Jul-Sep 07 |
33.4 |
9.5 |
57.1 |
23.9 |
38.5 |
5.9 |
55.6 |
32.6 |
40 |
Oct-Dec 07 |
32.0 |
12.3 |
55.7 |
19.7 |
37.8 |
6.4 |
55.8 |
31.4 |
41 |
Jan-Mar 08 |
37.8 |
11.2 |
51.0 |
26.6 |
33.0 |
8.7 |
58.3 |
24.3 |
42 |
Apr-Jun 08 |
32.7 |
12.7 |
54.5 |
20.0 |
37.2 |
9.5 |
53.3 |
27.7 |
43 |
Jul-Sep 08 |
36.0 |
13.6 |
50.4 |
22.4 |
36.4 |
8.7 |
54.9 |
27.7 |
44 |
Oct-Dec 08 |
27.6 |
20.0 |
52.4 |
7.6 |
36.5 |
9.2 |
54.3 |
27.3 |
45 |
Jan-Mar 09 |
17.8 |
34.8 |
47.4 |
-17.0 |
30.6 |
14.6 |
54.8 |
16.0 |
46 |
Apr-Jun 09 |
17.4 |
30.9 |
51.7 |
-13.5 |
19.5 |
23.3 |
57.3 |
-3.8 |
|
Jul-Sep 09 |
|
|
|
|
20.6 |
20.5 |
59.0 |
0.1 |
Statement I : Quarter-wise number of responses (per cent) under three options pertaining to assessment for current quarter and expectations for next quarter (Contd.) |
Parameter: 16. Imports ,if any |
Round No. |
Survey Quarter |
Assessment for Current Quarter |
Expectation for Next Quarter |
Increase |
Decrease |
No change |
Net response |
Increase |
Decrease |
No change |
Net response |
1 |
2 |
124 |
125 |
126 |
127 |
128 |
129 |
130 |
131 |
10 |
Apr-Jun 00 |
24.8 |
10.1 |
65.1 |
14.7 |
23.1 |
7.7 |
69.2 |
15.4 |
11 |
Jul-Sep 00 |
19.3 |
8.1 |
72.6 |
11.2 |
24.8 |
5.5 |
69.7 |
19.3 |
12 |
Oct-Dec 00 |
20.2 |
8.4 |
71.4 |
11.8 |
20.3 |
5.6 |
74.1 |
14.7 |
13 |
Jan-mar 01 |
17.6 |
8.4 |
74.0 |
9.2 |
19.6 |
6.7 |
73.7 |
12.9 |
14 |
Apr-Jun 01 |
17.4 |
9.3 |
73.3 |
8.1 |
20.0 |
6.5 |
73.5 |
13.5 |
15 |
Jul-Sep 01 |
17.9 |
8.9 |
73.2 |
9.0 |
17.4 |
7.9 |
74.7 |
9.5 |
16 |
Oct-Dec 01 |
14.1 |
25.1 |
60.8 |
-11.0 |
16.8 |
7.4 |
75.8 |
9.4 |
17 |
Jan-Mar 02 |
16.6 |
8.9 |
74.5 |
7.7 |
16.4 |
23.9 |
59.7 |
-7.5 |
18 |
Apr-Jun 02 |
17.5 |
9.4 |
73.1 |
8.1 |
15.8 |
7.4 |
76.8 |
8.4 |
19 |
Jul-Sep 02 |
20.1 |
9.6 |
70.3 |
10.5 |
17.9 |
6.2 |
75.9 |
11.7 |
20 |
Oct-Dec02 |
23.2 |
9.7 |
67.1 |
13.5 |
21.6 |
9.0 |
69.4 |
12.6 |
21 |
Jan-Mar 03 |
21.3 |
7.6 |
71.1 |
13.7 |
23.6 |
7.2 |
69.2 |
16.4 |
22 |
Apr-Jun 03 |
20.0 |
9.7 |
70.3 |
10.3 |
20.9 |
8.2 |
70.9 |
12.7 |
23 |
Jul-Sep 03 |
23.6 |
8.5 |
67.9 |
15.1 |
21.1 |
7.3 |
71.6 |
13.8 |
24 |
Oct-Dec03 |
23.0 |
7.5 |
69.4 |
15.5 |
22.6 |
5.3 |
72.1 |
17.3 |
25 |
Jan-Mar 04 |
25.5 |
8.0 |
66.5 |
17.5 |
23.4 |
6.5 |
70.1 |
16.9 |
26 |
Apr-Jun 04 |
23.8 |
8.6 |
67.6 |
15.2 |
24.5 |
6.6 |
68.8 |
17.9 |
27 |
Jul-Sep 04 |
26.8 |
6.9 |
66.3 |
19.9 |
25.2 |
7.1 |
67.7 |
18.1 |
28 |
Oct-Dec 04 |
27.3 |
6.2 |
66.5 |
21.1 |
26.4 |
5.1 |
68.4 |
21.3 |
29 |
Jan-Mar 05 |
28.5 |
4.8 |
66.7 |
23.7 |
26.0 |
3.8 |
70.2 |
22.2 |
30 |
Apr-Jun 05 |
26.1 |
4.6 |
69.3 |
21.5 |
24.4 |
4.1 |
71.4 |
20.3 |
31 |
Jul-Sep 05 |
27.4 |
5.5 |
67.1 |
21.9 |
26.9 |
3.2 |
69.9 |
23.7 |
32 |
Oct-Dec 05 |
27.0 |
5.9 |
67.1 |
21.1 |
24.0 |
4.8 |
71.3 |
19.2 |
33 |
Jan-Mar 06 |
29.6 |
5.2 |
65.1 |
24.4 |
25.0 |
4.2 |
70.8 |
20.8 |
34 |
Apr-Jun 06 |
28.7 |
6.1 |
65.2 |
22.6 |
27.9 |
5.2 |
66.9 |
22.7 |
35 |
Jul-Sep 06 |
27.7 |
4.9 |
67.4 |
22.8 |
29.1 |
5.3 |
65.6 |
23.8 |
36 |
Oct-Dec 06 |
27.9 |
7.1 |
65.0 |
20.8 |
27.6 |
4.2 |
68.1 |
23.4 |
37 |
Jan-Ma r07 |
28.1 |
5.9 |
66.0 |
22.2 |
26.4 |
5.6 |
68.0 |
20.8 |
38 |
Apr-Jun 07 |
27.0 |
5.5 |
67.5 |
21.5 |
26.6 |
5.0 |
68.4 |
21.6 |
39 |
Jul-Sep 07 |
26.3 |
6.7 |
67.0 |
19.6 |
27.7 |
4.0 |
68.2 |
23.7 |
40 |
Oct-Dec 07 |
27.5 |
5.8 |
66.7 |
21.7 |
26.1 |
5.3 |
68.6 |
20.8 |
41 |
Jan-Mar 08 |
31.9 |
5.5 |
62.5 |
26.4 |
24.8 |
4.7 |
70.5 |
20.1 |
42 |
Apr-Jun 08 |
28.5 |
8.0 |
63.5 |
20.5 |
29.8 |
4.5 |
65.6 |
25.3 |
43 |
Jul-Sep 08 |
28.5 |
7.8 |
63.8 |
20.7 |
27.4 |
6.1 |
66.5 |
21.3 |
44 |
Oct-Dec 08 |
20.2 |
13.5 |
66.3 |
6.7 |
26.7 |
5.3 |
67.9 |
21.4 |
45 |
Jan-Mar 09 |
13.7 |
22.1 |
64.2 |
-8.4 |
19.7 |
10.6 |
69.7 |
9.1 |
46 |
Apr-Jun 09 |
17.1 |
18.4 |
64.5 |
-1.3 |
14.9 |
16.3 |
68.8 |
-1.4 |
|
Jul-Sep 09 |
|
|
|
|
17.0 |
12.4 |
70.6 |
4.6 |
Statement I : Quarter-wise number of responses (per cent) under three options pertaining to assessment for current quarter and expectations for next quarter (Contd.) |
Parameter: 17. Selling prices (ex-factory unit prices) |
Round No. |
Survey Quarter |
Assessment for Current Quarter |
Expectation for Next Quarter |
Increase |
Decrease |
No change |
Net response |
Increase |
Decrease |
No change |
Net response |
1 |
2 |
132 |
133 |
134 |
135 |
136 |
137 |
138 |
139 |
10 |
Apr-Jun 00 |
22.6 |
11.8 |
65.6 |
10.8 |
28.0 |
8.4 |
63.6 |
19.6 |
11 |
Jul-Sep 00 |
18.6 |
13.1 |
68.3 |
5.5 |
23.4 |
6.9 |
69.7 |
16.5 |
12 |
Oct-Dec 00 |
18.6 |
11.7 |
69.7 |
6.9 |
22.0 |
8.4 |
69.6 |
13.6 |
13 |
Jan-mar 01 |
15.4 |
16.0 |
68.6 |
-0.6 |
23.0 |
7.3 |
69.7 |
15.7 |
14 |
Apr-Jun 01 |
16.9 |
16.4 |
66.7 |
0.5 |
21.1 |
10.1 |
68.8 |
11.0 |
15 |
Jul-Sep 01 |
14.6 |
16.8 |
68.6 |
-2.2 |
18.9 |
11.7 |
69.4 |
7.2 |
16 |
Oct-Dec 01 |
8.1 |
28.5 |
63.4 |
-20.4 |
14.6 |
12.2 |
73.2 |
2.4 |
17 |
Jan-Mar 02 |
10.7 |
20.4 |
68.9 |
-9.7 |
9.0 |
23.4 |
67.6 |
-14.4 |
18 |
Apr-Jun 02 |
14.5 |
20.8 |
64.7 |
-6.3 |
13.7 |
16.9 |
69.4 |
-3.2 |
19 |
Jul-Sep 02 |
14.7 |
19.1 |
66.2 |
-4.4 |
14.5 |
15.0 |
70.5 |
-0.5 |
20 |
Oct-Dec02 |
11.9 |
18.5 |
69.6 |
-6.6 |
15.7 |
12.3 |
72.0 |
3.4 |
21 |
Jan-Mar 03 |
14.8 |
15.4 |
69.8 |
-0.6 |
13.3 |
13.5 |
73.2 |
-0.2 |
22 |
Apr-Jun 03 |
16.2 |
18.6 |
65.2 |
-2.4 |
16.0 |
13.2 |
70.8 |
2.8 |
23 |
Jul-Sep 03 |
14.6 |
16.1 |
69.4 |
-1.5 |
15.4 |
15.1 |
69.5 |
0.3 |
24 |
Oct-Dec03 |
16.0 |
15.3 |
68.7 |
0.7 |
14.4 |
11.8 |
73.8 |
2.6 |
25 |
Jan-Mar 04 |
22.7 |
12.0 |
65.3 |
10.7 |
16.2 |
9.8 |
74.0 |
6.4 |
26 |
Apr-Jun 04 |
21.8 |
11.5 |
66.8 |
10.3 |
20.7 |
9.8 |
69.6 |
10.9 |
27 |
Jul-Sep 04 |
20.5 |
13.8 |
65.6 |
6.7 |
18.4 |
9.5 |
72.0 |
8.9 |
28 |
Oct-Dec 04 |
20.4 |
12.5 |
67.1 |
7.9 |
17.5 |
9.9 |
72.6 |
7.6 |
29 |
Jan-Mar 05 |
21.9 |
11.6 |
66.5 |
10.3 |
18.1 |
9.5 |
72.3 |
8.6 |
30 |
Apr-Jun 05 |
24.5 |
7.8 |
67.7 |
16.7 |
19.8 |
8.8 |
71.4 |
11.0 |
31 |
Jul-Sep 05 |
18.7 |
13.1 |
68.3 |
5.6 |
19.5 |
6.2 |
74.3 |
13.3 |
32 |
Oct-Dec 05 |
19.0 |
10.3 |
70.8 |
8.7 |
16.7 |
8.9 |
74.4 |
7.8 |
33 |
Jan-Mar 06 |
21.1 |
10.2 |
68.7 |
10.9 |
18.1 |
7.3 |
74.5 |
10.8 |
34 |
Apr-Jun 06 |
25.4 |
8.5 |
66.0 |
16.9 |
20.3 |
7.9 |
71.8 |
12.4 |
35 |
Jul-Sep 06 |
27.2 |
10.2 |
62.2 |
17.0 |
24.4 |
7.8 |
67.9 |
16.6 |
36 |
Oct-Dec 06 |
22.4 |
11.6 |
66.0 |
10.8 |
24.4 |
7.6 |
68.0 |
16.8 |
37 |
Jan-Ma r07 |
21.5 |
11.5 |
66.9 |
10.0 |
22.5 |
8.3 |
69.2 |
14.2 |
38 |
Apr-Jun 07 |
24.6 |
10.2 |
65.2 |
14.3 |
23.3 |
7.8 |
68.9 |
15.5 |
39 |
Jul-Sep 07 |
22.7 |
13.0 |
64.3 |
9.7 |
25.9 |
6.9 |
67.1 |
19.0 |
40 |
Oct-Dec 07 |
20.9 |
13.1 |
66.0 |
7.8 |
22.2 |
9.2 |
68.5 |
13.0 |
41 |
Jan-Mar 08 |
25.2 |
10.6 |
64.2 |
14.6 |
23.9 |
9.0 |
67.1 |
14.9 |
42 |
Apr-Jun 08 |
34.9 |
11.3 |
53.8 |
23.6 |
26.6 |
7.5 |
66.0 |
19.1 |
43 |
Jul-Sep 08 |
41.7 |
8.2 |
50.1 |
33.5 |
29.7 |
8.7 |
61.5 |
21.0 |
44 |
Oct-Dec 08 |
23.2 |
23.7 |
53.1 |
-0.5 |
34.3 |
8.1 |
57.6 |
26.2 |
45 |
Jan-Mar 09 |
12.5 |
38.0 |
49.5 |
-25.5 |
21.2 |
17.1 |
61.7 |
4.1 |
46 |
Apr-Jun 09 |
17.0 |
24.4 |
58.0 |
-7.4 |
14.5 |
23.6 |
61.9 |
-9.1 |
|
Jul-Sep 09 |
|
|
|
|
17.2 |
17.2 |
65.6 |
0.0 |
Statement I : Quarter-wise number of responses (per cent) under three options pertaining to assessment for current quarter and expectations for next quarter (Contd.) |
Parameter: 18. If increase expected in selling prices, rate of such increase |
Round No. |
Survey Quarter |
Assessment for Current Quarter |
Expectation for Next Quarter |
Increase
at lower
rate |
Increase
at higher
rate |
Increase
at about
same rate |
Net response |
Increase
at lower
rate |
Increase
at higher
rate |
Increase
at about
same rate |
Net response |
1 |
2 |
140 |
141 |
142 |
143 |
144 |
145 |
146 |
147 |
10 |
Apr-Jun 00 |
31.1 |
11.0 |
57.9 |
20.1 |
22.2 |
15.0 |
62.8 |
7.2 |
11 |
Jul-Sep 00 |
24.9 |
12.2 |
59.0 |
12.7 |
21.4 |
14.3 |
64.3 |
7.1 |
12 |
Oct-Dec 00 |
22.9 |
10.0 |
67.1 |
12.9 |
16.1 |
15.2 |
68.7 |
0.9 |
13 |
Jan-mar 01 |
43.3 |
5.8 |
50.9 |
37.5 |
19.1 |
13.1 |
67.8 |
6.0 |
14 |
Apr-Jun 01 |
32.0 |
10.9 |
57.1 |
21.1 |
37.7 |
7.0 |
55.3 |
30.7 |
15 |
Jul-Sep 01 |
28.8 |
7.2 |
64.0 |
21.6 |
27.1 |
11.4 |
61.5 |
15.7 |
16 |
Oct-Dec 01 |
82.4 |
1.5 |
16.1 |
80.9 |
25.0 |
6.8 |
68.2 |
18.2 |
17 |
Jan-Mar 02 |
24.9 |
10.1 |
65.0 |
14.8 |
80.0 |
1.4 |
18.6 |
78.6 |
18 |
Apr-Jun 02 |
23.2 |
10.0 |
66.8 |
13.2 |
24.5 |
8.2 |
51.0 |
16.3 |
19 |
Jul-Sep 02 |
29.4 |
9.6 |
61.0 |
19.8 |
22.3 |
8.6 |
69.1 |
13.7 |
20 |
Oct-Dec02 |
29.9 |
11.8 |
58.3 |
18.1 |
24.5 |
10.9 |
51.0 |
13.6 |
21 |
Jan-Mar 03 |
32.4 |
10.1 |
57.5 |
22.3 |
29.7 |
10.9 |
59.4 |
18.8 |
22 |
Apr-Jun 03 |
31.7 |
9.1 |
59.1 |
22.6 |
27.4 |
10.2 |
45.2 |
17.2 |
23 |
Jul-Sep 03 |
28.4 |
10.6 |
60.9 |
17.8 |
29.7 |
9.5 |
60.8 |
20.2 |
24 |
Oct-Dec03 |
26.6 |
11.1 |
62.3 |
15.5 |
25.8 |
9.2 |
64.9 |
16.6 |
25 |
Jan-Mar 04 |
24.4 |
12.1 |
63.5 |
12.3 |
23.9 |
9.4 |
66.8 |
14.5 |
26 |
Apr-Jun 04 |
23.7 |
11.0 |
65.3 |
12.7 |
22.7 |
11.0 |
66.3 |
11.7 |
27 |
Jul-Sep 04 |
26.5 |
10.6 |
62.9 |
15.9 |
20.3 |
11.7 |
68.0 |
8.6 |
28 |
Oct-Dec 04 |
23.8 |
12.5 |
63.7 |
11.3 |
20.9 |
11.0 |
68.1 |
9.9 |
29 |
Jan-Mar 05 |
25.5 |
10.5 |
64.0 |
15.0 |
20.9 |
12.7 |
66.3 |
8.2 |
30 |
Apr-Jun 05 |
22.7 |
11.8 |
65.5 |
10.9 |
23.2 |
9.7 |
67.1 |
13.5 |
31 |
Jul-Sep 05 |
25.3 |
7.9 |
66.8 |
17.4 |
22.3 |
8.3 |
69.4 |
14.0 |
32 |
Oct-Dec 05 |
26.6 |
6.2 |
67.2 |
20.4 |
23.2 |
6.6 |
70.2 |
16.6 |
33 |
Jan-Mar 06 |
24.7 |
11.2 |
64.1 |
13.5 |
23.3 |
7.0 |
69.7 |
16.3 |
34 |
Apr-Jun 06 |
25.0 |
12.2 |
62.8 |
12.8 |
23.5 |
11.5 |
65.0 |
12.0 |
35 |
Jul-Sep 06 |
27.0 |
9.7 |
63.3 |
17.3 |
24.0 |
13.5 |
62.5 |
10.5 |
36 |
Oct-Dec 06 |
23.9 |
9.5 |
66.5 |
14.4 |
23.8 |
9.3 |
67.0 |
14.5 |
37 |
Jan-Ma r07 |
24.3 |
9.6 |
66.0 |
14.7 |
21.2 |
10.7 |
68.1 |
10.5 |
38 |
Apr-Jun 07 |
25.8 |
10.5 |
63.7 |
15.3 |
22.7 |
10.6 |
66.7 |
12.1 |
39 |
Jul-Sep 07 |
22.1 |
19.5 |
58.4 |
2.6 |
22.7 |
12.3 |
65.0 |
10.4 |
40 |
Oct-Dec 07 |
25.1 |
8.9 |
66.0 |
16.2 |
22.4 |
18.7 |
58.9 |
3.7 |
41 |
Jan-Mar 08 |
24.4 |
15.5 |
60.1 |
8.9 |
23.3 |
10.0 |
66.7 |
13.3 |
42 |
Apr-Jun 08 |
20.3 |
22.7 |
57.0 |
-2.4 |
22.5 |
13.5 |
64.0 |
9.0 |
43 |
Jul-Sep 08 |
23.5 |
24.0 |
52.4 |
-0.5 |
20.8 |
17.8 |
61.3 |
3.0 |
44 |
Oct-Dec 08 |
21.9 |
20.7 |
57.4 |
1.2 |
23.0 |
22.4 |
54.7 |
0.6 |
45 |
Jan-Mar 09 |
39.1 |
7.4 |
53.5 |
31.7 |
23.5 |
22.6 |
54.0 |
0.9 |
46 |
Apr-Jun 09 |
28.0 |
17.0 |
55.0 |
11.0 |
34.2 |
8.3 |
53.5 |
25.9 |
|
Jul-Sep 09 |
|
|
|
|
0.0 |
100.0 |
0.0 |
-100.0 |
Statement I : Quarter-wise number of responses (per cent) under three options pertaining to assessment for current quarter and expectations for next quarter (Concld.) |
Parameter: 19. Profit margin (Gross profits as percentage of net sales) |
Round No. |
Survey Quarter |
Assessment for Current Quarter |
Expectation for Next Quarter |
Increase |
Decrease |
No change |
Net response |
Increase |
Decrease |
No change |
Net response |
1 |
2 |
148 |
149 |
150 |
151 |
152 |
153 |
154 |
155 |
10 |
Apr-Jun 00 |
25.7 |
25.1 |
49.2 |
0.6 |
35.9 |
15.1 |
49.0 |
20.8 |
11 |
Jul-Sep 00 |
26.9 |
23.6 |
49.5 |
3.3 |
31.0 |
13.5 |
55.5 |
17.5 |
12 |
Oct-Dec 00 |
26.5 |
23.2 |
50.3 |
3.3 |
32.7 |
13.6 |
53.7 |
19.1 |
13 |
Jan-mar 01 |
27.3 |
23.4 |
49.3 |
3.9 |
31.2 |
12.8 |
56.0 |
18.4 |
14 |
Apr-Jun 01 |
22.6 |
26.3 |
51.1 |
-3.7 |
29.8 |
16.9 |
53.3 |
12.9 |
15 |
Jul-Sep 01 |
23.0 |
26.9 |
50.1 |
-3.9 |
29.0 |
15.1 |
55.9 |
13.9 |
16 |
Oct-Dec 01 |
16.7 |
35.1 |
48.2 |
-18.4 |
29.4 |
14.8 |
55.8 |
14.6 |
17 |
Jan-Mar 02 |
18.8 |
27.9 |
53.3 |
-9.1 |
19.7 |
30.6 |
49.7 |
-10.9 |
18 |
Apr-Jun 02 |
19.8 |
24.6 |
55.6 |
-4.8 |
20.6 |
22.7 |
56.7 |
-2.1 |
19 |
Jul-Sep 02 |
20.7 |
24.9 |
54.4 |
-4.2 |
23.5 |
18.8 |
57.7 |
4.7 |
20 |
Oct-Dec02 |
21.5 |
24.8 |
53.7 |
-3.3 |
24.3 |
16.5 |
59.2 |
7.8 |
21 |
Jan-Mar 03 |
23.5 |
22.5 |
54.0 |
1.0 |
24.5 |
16.7 |
58.8 |
7.8 |
22 |
Apr-Jun 03 |
16.5 |
27.3 |
56.2 |
-10.8 |
23.6 |
18.8 |
57.6 |
4.8 |
23 |
Jul-Sep 03 |
20.5 |
22.1 |
57.4 |
-1.6 |
22.1 |
19.9 |
58.0 |
2.2 |
24 |
Oct-Dec03 |
20.3 |
19.8 |
59.9 |
0.5 |
22.3 |
16.1 |
61.6 |
6.2 |
25 |
Jan-Mar 04 |
24.1 |
21.2 |
54.7 |
2.9 |
21.1 |
14.2 |
64.7 |
6.9 |
26 |
Apr-Jun 04 |
20.6 |
19.7 |
59.7 |
0.9 |
22.6 |
16.7 |
60.7 |
5.9 |
27 |
Jul-Sep 04 |
19.1 |
24.3 |
56.6 |
-5.2 |
21.6 |
16.8 |
61.6 |
4.8 |
28 |
Oct-Dec 04 |
21.0 |
21.8 |
57.2 |
-0.8 |
21.0 |
16.6 |
62.4 |
4.4 |
29 |
Jan-Mar 05 |
23.3 |
21.5 |
55.2 |
1.8 |
22.6 |
17.0 |
60.4 |
5.6 |
30 |
Apr-Jun 05 |
20.7 |
19.4 |
59.9 |
1.3 |
22.5 |
16.2 |
61.3 |
6.3 |
31 |
Jul-Sep 05 |
19.5 |
20.6 |
59.9 |
-1.1 |
20.7 |
13.6 |
65.7 |
7.1 |
32 |
Oct-Dec 05 |
22.3 |
16.5 |
61.2 |
5.8 |
21.7 |
12.1 |
66.2 |
9.6 |
33 |
Jan-Mar 06 |
22.4 |
18.8 |
58.8 |
3.6 |
25.6 |
13.0 |
61.4 |
12.6 |
34 |
Apr-Jun 06 |
22.3 |
18.0 |
59.7 |
4.3 |
23.2 |
13.9 |
62.9 |
9.3 |
35 |
Jul-Sep 06 |
20.4 |
20.9 |
58.7 |
-0.5 |
23.1 |
12.0 |
64.9 |
11.1 |
36 |
Oct-Dec 06 |
22.5 |
18.1 |
59.4 |
4.4 |
24.3 |
15.1 |
60.6 |
9.2 |
37 |
Jan-Ma r07 |
21.9 |
18.3 |
59.8 |
3.6 |
25.0 |
13.4 |
61.6 |
11.6 |
38 |
Apr-Jun 07 |
19.3 |
20.1 |
60.6 |
-0.8 |
23.7 |
13.8 |
62.5 |
9.9 |
39 |
Jul-Sep 07 |
20.8 |
21.9 |
57.3 |
-1.1 |
22.4 |
15.0 |
62.6 |
7.4 |
40 |
Oct-Dec 07 |
19.3 |
22.8 |
57.9 |
-3.5 |
25.0 |
15.4 |
59.6 |
9.6 |
41 |
Jan-Mar 08 |
24.1 |
20.8 |
55.1 |
3.3 |
22.7 |
17.3 |
60.0 |
5.4 |
42 |
Apr-Jun 08 |
21.1 |
26.4 |
52.5 |
-5.3 |
23.1 |
15.9 |
61.0 |
7.2 |
43 |
Jul-Sep 08 |
18.1 |
32.8 |
49.0 |
-14.7 |
22.0 |
18.2 |
59.8 |
3.8 |
44 |
Oct-Dec 08 |
14.4 |
41.0 |
44.6 |
-26.6 |
20.8 |
24.4 |
54.7 |
-3.6 |
45 |
Jan-Mar 09 |
11.3 |
48.8 |
39.8 |
-37.5 |
16.9 |
29.8 |
53.3 |
-12.9 |
46 |
Apr-Jun 09 |
13.4 |
38.5 |
48.1 |
-25.1 |
15.4 |
34.0 |
50.6 |
-18.6 |
|
Jul-Sep 09 |
|
|
|
|
16.0 |
29.4 |
54.5 |
-13.4 |
Block 3: Paid-up capital, Annual Production and Current level of Capacity Utilisation Please tick(√))the appropriate size-class in which your company currently falls:
301 |
Paid-up Capital |
Up to
Rs. 1 Crore |
Rs. 1 Crore to Rs. 10 Crore |
Rs. 10 Crore to Rs. 25 Crore |
Rs. 25 Crore to Rs. 50 Crore |
Rs. 50 Crore to Rs. 100 Crore |
Above
Rs. 100 Crore |
302 |
Annual Production (All products) |
Up to
Rs. 100 Crore |
Rs. 100 Crore to Rs.250 Crore |
Rs. 250 Crore to Rs. 500 Crore |
Rs. 500 Crore to Rs. 750 Crore |
Rs. 750 Crore to Rs. 1000 Crore |
Above
Rs. 1000 Crore |
303 |
Current level of Capacity Utilisation * |
Up to 50% |
50% - 60% |
60% - 70% |
70% - 80% |
80% - 90% |
Above 90% |
* Compared to installed capacity |
Block 4: Is your company’s normal production level expected to face any constraints during the Current Quarter (April-June 2009) (Please tick (√) the relevant column)
If ‘Yes’ to item 400 indicate the possible reasons thereof
(please tick (√) the relevant column for each reason)
Code |
Reasons |
Current Quarter (April-June 2009) |
Most Important |
Moderately Important |
Less Important |
Not Important |
|
|
(1) |
(2) |
(3) |
(4) |
401 |
Technology constraints |
|
|
|
|
402 |
Shortage of Raw Materials |
|
|
|
|
403 |
Shortage of Power |
|
|
|
|
404 |
Equipment / Machinery not working |
|
|
|
|
405 |
Industrial Relations / Labour Problems |
|
|
|
|
406 |
Inadequate transport facilities |
|
|
|
|
407 |
Shortage of Working Capital Finance |
|
|
|
|
408 |
Lack of Domestic Demand |
|
|
|
|
409 |
Lack of Export Demand |
|
|
|
|
410 |
Competitive Imports |
|
|
|
|
411 |
Uncertainty of economic environment |
|
|
|
|
412 |
Any others (Please specify): |
|
|
|
|
Block 5. Assessment for the current quarter (April-June 2009) and Expectations for the next quarter (July-September 2009)
Code |
Parameter |
Current Quarter (April-June 2009) |
Next Quarter (July-September 2009) |
Please tick (√) changes over January-March 2009 quarter |
Please tick (√) changes over April-June 2009 quarter |
(1) |
(2) |
(3) |
(4) |
(5) |
(6) |
501 |
Overall business situation |
Better |
No change |
Worsen |
Better |
No change |
Worsen |
502 |
Financial situation (overall) |
Better |
No change |
Worsen |
Better |
No change |
Worsen |
503 |
Working Capital Finance Requirement (excluding internal sources of funds) |
Increase |
No change |
Decrease |
Increase |
No change |
Decrease |
504 |
Availability of Finance (both internal and external sources) |
Improve |
No change |
Worsen |
Improve |
No change |
Worsen |
505 |
Production (in quantity terms) (All products) |
Increase |
No change |
Decrease |
Increase |
No change |
Decrease |
506 |
Order Books (in quantity terms), if applicable |
Increase |
No change |
Decrease |
Increase |
No change |
Decrease |
507 |
Pending Orders, if applicable |
Above normal |
Normal |
Below Normal |
Above normal |
Normal |
Below Normal |
508 |
Cost of raw materials |
Increase |
No change |
Decrease |
Increase |
No change |
Decrease |
509 |
Inventory of raw materials (in quantity terms) @ |
Above average |
Average |
Below Average |
Above average |
Average |
Below Average |
510 |
Inventory of Finished Goods (in quantity terms) @ |
Above average |
Average |
Below Average |
Above Average |
average |
Below Average |
511 |
Capacity utilisation (main product) |
Increase |
No change |
Decrease |
Increase |
No change |
Decrease |
512 |
Level of capacity utilisation (compared to the average in preceding four quarters) |
Above normal |
Normal |
Below Normal |
Above normal |
Normal |
Below Normal |
513 |
Assessment of the production capacity with regard to expected demand in next six months |
More than adequate |
Adequate |
Less than Adequate |
More than adequate |
Adequate |
Less than Adequate |
514 |
Employment in the company (All cadres including part-time / full-time/casual labour) |
Increase |
No change |
Decrease |
Increase |
No change |
Decrease |
515 |
Exports, if applicable |
Increase |
No change |
Decrease |
Increase |
No change |
Decrease |
516 |
Imports, if any |
Increase |
No change |
Decrease |
Increase |
No change |
Decrease |
517 |
Selling prices (ex-factory unit prices) are expected to @@ |
Increase |
No change |
Decrease |
Increase |
No change |
Decrease |
518 |
If increase expected in selling prices, rate of such increase |
Increase at higher rate |
Increase at about same rate |
Increase
at
lower rate |
Increase at higher rate |
Increase at about same rate |
Increase
at
lower rate |
519 |
Profit Margin (Gross profits as percentage of net sales) @@@ |
Increase |
No change |
Decrease |
Increase |
No change |
Decrease |
Block 6. Investment Intentions
Perceptions on state of Investment in Fixed Capital i.e., buildings, plant & machinery, etc., in your
company for the financial (April-March) years 2008-09 and 2009-10 (please tick (√) in relevant box):
610 |
Did you make any investment in fixed capital during 2008-09 |
Yes |
No |
620 |
Do you plan any investment in fixed capital during 2009-10 |
Yes |
No |
630 |
If the investment is planned for 2009-10, will it be, compared to the previous year, |
Higher |
Lower |
About same |
640 |
Factors which influenced / are likely to influence investment climate for the years 2008-09 and 2009-10 (please tick in relevant box): |
|
wYear |
2008-09 |
2009-10 |
|
|
Encouraging |
Discouraging |
No Influence |
Encouraging |
Discouraging |
No Influence |
641 |
Existing demand |
|
|
|
|
|
|
642 |
Cost of capital |
|
|
|
|
|
|
643 |
Availability of internal finance |
|
|
|
|
|
|
644 |
Ability to raise external finance |
|
|
|
|
|
|
645 |
Net return on investment |
|
|
|
|
|
|
646 |
Technical factors |
|
|
|
|
|
|
647 |
Availability of manpower |
|
|
|
|
|
|
648 |
Others(Please specify): |
|
|
|
|
|
|
Notes to Block 5: @: Average level may be obtained as the average of level at the end of four quarters during the corresponding preceding year. @@: In the case of multi product companies, the average of the price changes may be taken into account. @@@: Gross profits are defined as total income minus manufacturing expenses, salaries and wages, other expenses and depreciation and other provisions (except tax provision). In other words, profits are gross of interest and tax provision (PBIT). ‘Net Sales’ are sales net of ‘rebates and discounts’ and ‘excise duty and cess’. Annex II Methodology for Computing Business Expectations Index The schedule canvassed with the companies from the ninth round (quarter ended December 1999) of the survey predominantly consists of qualitative/judgmental type of questions, requiring the respondent to select the suitable option among the given choices. Further, the qualitative questions relate both to the current quarter and the next quarter. These questions enquire the assessment/prospects, in respect of the overall business situation, production, order books, inventory levels, working capital finance, profitability, employment, exports, imports, capacity utilization and price levels requiring the respondent to indicate improvement/worsening/ no change for each of the questions. An index-Business Expectations Index (BEI) has been constructed, using the assessment and expectations/perceptions of companies reported in the survey. The following procedure is adopted for computation of the Index.
To compute the Index, 9 variables have been selected on which the companies report data. The selected variables are:
- Overall business situation.
- Production.
- Order books.
- Inventory of raw materials.
- Inventory of finished goods.
- Profit Margin.
- Employment in the company.
- Exports.
- Capacity utilization.
The Indicator Indices are computed for both the current quarter and the next quarter, for each of the 9 variables selected. For this purpose, a measure, ‘net value’, defined as the proportion of balance between positive and negative replies to the total number of replies, ignoring the ‘no-change’ replies, is considered for each of the variable. In the cases of inventory of raw materials and of finished goods, inventory levels ‘below average level’ are taken to represent positive aspect of the variable. As the first step, ‘net value’ is computed for each variable at industry level. The ‘net value’, expressed in percentage terms, is used as the Indicator Index for the variable at industry level. Each industry is assigned weights based on their share in Gross Value Added (GVA) of all industries, and the weighted average proportion of the ‘net values’ is worked out as the Indicator Index (II) for each variable.
Indicator Index for ith variable is defined as:
where, Wj is the weight assigned to the jth industry and as stated, the weights represent the share of industries in the Gross Value Added (GVA) of all industry groups, as available from Company Finance Studies on Public Limited Companies (conducted by the Bank), and Pij, Nij and Tij are the number of positive, negative and total responses for the ith variable for jth industry. The indicator indices thus obtained, take a maximum value of +100 (when all the companies report positive outlook) and a minimum value of –100 (when all companies report negative outlook). The BEI is defined as
where, IIi s are the indicator indices of the selected variables and i= 1, 2,……, n (number of variables) The BEI so computed, will lie in the range of 0 and 200, the extreme values may be attained when all companies report negative or positive outlook on all the variables considered.
The BEI confirms the assessment for the current quarter and expectations for the next quarter. The BEI based on the data reported by the companies has been computed separately for the assessments and expectations.
* Prepared in the Survey Division of the Department of Statistics and Information Management. 1 The Report of the Working Group on Surveys has been brought out as a supplement to the RBI Bulletin, September 2009. 3 In the case of Net Responses (NR), the percentage of the respondents reporting a decrease is subtracted from the percentage reporting an increase; while, Diffusion Index (DI) is defined as the fraction of favourable answers plus half of the fraction of no change answers. Let A, B and C be respectively the fraction of increase, no change and decrease replies in the total, then
NR = 100 ( A – C ),while
DI = 100 (A + B/2).
It can be shown algebraically that NR = 2 (DI – 50) or DI = (100 + NR) / 2. |