Quick Estimates of National Income, 2007-08 and Revised Estimates of National Income, 2008-09: A Review* The ‘Quick Estimates of National Income, Consumption Expenditure, Saving and Capital Formation, 2007-08’ were released by the Central Statistical Organisation (CSO) on January 30, 2009. These estimates provide data on various macro-economic aggregates for the years 1999-2000 to 2007-08. Subsequently, the ‘Revised Estimates of National Income, 2008-09’ were also released by the CSO on May 29, 2009. This article reviews the trends in various macro-economic aggregates as given in the Quick and Revised Estimates. 1. Gross Domestic Product Indian economy had grown robustly at an annual average rate of 8.9 per cent during 2003-04 to 2007-08. The strong Indian growth performance, based on its structural strengths of young population, rising savings and investment rates, large unfulfilled domestic demand and globally competitive firms attracted significant investor attention in recent years. Higher rates of economic growth during this period have been the result of high levels of investment, rise in productivity supported by technological upgradation and greater integration with global flows of trade, finance and technology. However, this high growth phase was soon followed by a cyclical slowdown which got accentuated by the global financial sector meltdown precipitated by collapse of Lehman Brothers in September 2008. Global developments impacted investment, consumption and other segments of India’s real economy through trade as well as financial channels of transmission. As per the Quick Estimates of National Income 2007-08, the real Gross Domestic Product (GDP) at factor cost registered a growth of 9.0 per cent in 2007-08 as compared with 9.7 per cent in 2006-07. Subsequently, for the year 2008-09, the Revised Estimates placed the growth of real GDP at 6.7 per cent (Table 1, Chart 1) revising downwards the Advance Estimate of 7.1 per cent, released in February 2009. 1.1 Sectoral Growth and Composition of Real Gross Domestic Product A marked slowdown that occurred in the real GDP growth for the year 2008-09 vis-à-vis 2007-08 was evident he sectors, though decline has been quite steep in industrial sector. The growth rate of GDP originating from industry is estimated at 2.6 per cent in 2008-09 lower than that of 7.4 per cent in 2007-08, mainly reflecting deceleration in the growth of its two sub-sectors viz., ‘manufacturing’ and ‘electricity, gas and water supply’. ‘Mining and quarrying’, on the other hand, has witnessed some rise in the growth rate (Table 1).
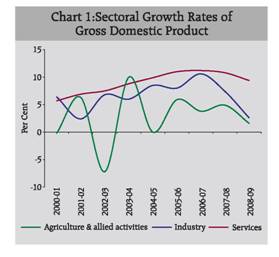
Table 1: Sectoral Growth Rates of Gross Domestic Product at Factor Cost (at 1999-00 Prices) |
( Per cent) |
Sector |
2000-01 |
2001-02 |
2002-03 |
2003-04 |
2004-05 |
2005-06 |
2006-07@ |
2007-08* |
2008-09# |
1 |
2 |
3 |
4 |
5 |
6 |
7 |
8 |
9 |
10 |
I. |
Agriculture, forestry & fishing |
-0.2 |
6.3 |
-7.2 |
10.0 |
0.0 |
5.8 |
4.0 |
4.9 |
1.6 |
II. |
Industry |
6.4 |
2.4 |
6.8 |
6.0 |
8.5 |
8.1 |
10.7 |
7.4 |
2.6 |
| |
(i) |
Mining & quarrying |
2.4 |
1.8 |
8.8 |
3.1 |
8.2 |
4.9 |
8.8 |
3.3 |
3.6 |
| |
(ii) |
Manufacturing |
7.7 |
2.5 |
6.8 |
6.6 |
8.7 |
9.1 |
11.8 |
8.2 |
2.4 |
| |
(iii) |
Electricity, gas & water supply |
2.1 |
1.7 |
4.7 |
4.8 |
7.9 |
5.1 |
5.3 |
5.3 |
3.4 |
III. |
Services |
5.7 |
6.9 |
7.5 |
8.8 |
9.9 |
11.2 |
11.3 |
10.8 |
9.4 |
| |
(i) |
Construction |
6.2 |
4.0 |
7.9 |
12.0 |
16.1 |
16.2 |
11.8 |
10.1 |
7.2 |
| |
(ii) |
Trade, hotels & restaurant |
5.2 |
9.6 |
6.9 |
10.1 |
7.7 |
10.3 |
10.4 |
12.4^ |
9.0^ |
| |
(iii) |
Transport, storage & communication |
11.2 |
8.4 |
14.1 |
15.3 |
15.6 |
14.9 |
16.3 |
.. |
. . |
| |
(iv) |
Financing, insurance, real estate & business services |
4.1 |
7.3 |
8.0 |
5.6 |
8.7 |
11.4 |
13.8 |
11. 7 |
7.8 |
| |
(v) |
Community, social & personal services |
4.7 |
4.1 |
3.9 |
5.4 |
6.8 |
7.1 |
5.7 |
6.8 |
13.1 |
IV. |
Gross domestic product at factor cost |
4.4 |
5.8 |
3.8 |
8.5 |
7.5 |
9.5 |
9.7 |
9.0 |
6.7 |
@ : Provisional * : Quick Estimates. # : Revised Estimates. ^ : Includes ‘Transport, storage and communication ’. .. : Not available.Source: Central Statistical Organisation. |
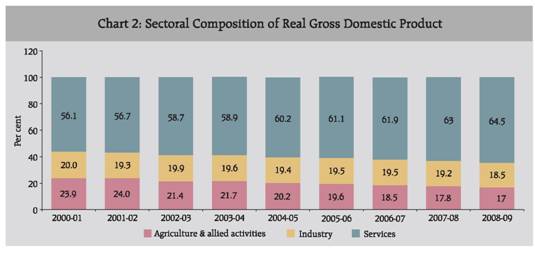
Agriculture and allied activities registered a growth rate of 1.6 per cent in 2008-09 as compared with 4.9 per cent in 2007-08. The fact that agricultural output during 2007-08 has been at a record level, lower growth is partly attributable to higher base. The services sector is estimated to decelerate in 2008-09. While the ‘construction’ sub-sector has recorded a slower growth in 2008-09, the sub-sector ‘community, social and personal services’ grew at double digit level in 2008-09, mainly due to Sixth Pay Commission award (Table 1 and Statement 1). As per the Revised Estimates, the shares of ‘agriculture and allied activities’ and industry are estimated to decline fractionally while that of services in real GDP is estimated to rise. This rise in the share of services is mainly reflective of increase in the share of ‘community, social and personal services’.This relative movement in shares of major sectors in GDP has been persisting since the beginning of current decade.The share of ‘agriculture and allied activities’ has been showing continuous decline while the services sector is witnessing a rise during the period 2000-01 to 2008-09 (Table 2 and Chart 2). 1.2 Sectoral Contribution to the Growth of Real Gross Domestic Product In 2008-09, the sectoral contributions to growth worked out to be 4.5 per cent for ‘agriculture and allied activities’, 7.5 per cent for industry and 88.1 per cent for the services sector as against the contributions of 10.0 per cent, 15.6 per cent and 74.4 per cent, respectively in 2007-08 (Chart 3, Table 3).
Table 2: Sectoral Composition of Gross Domestic Product at Factor Cost |
( Per cent) |
| |
2000-01 |
2001-02 |
2002-03 |
2003-04 |
2004-05 |
2005-06 |
2006-07@ |
2007-08* |
2008-09# |
1 |
2 |
3 |
4 |
5 |
6 |
7 |
8 |
9 |
10 |
I. |
Agriculture and allied activities |
23.9 |
24.0 |
21.4 |
21.7 |
20.2 |
19.5 |
18.5 |
17.8 |
17.0 |
II. |
Industry |
20.0 |
19.3 |
19.9 |
19.4 |
19.6 |
19.4 |
19.5 |
19.2 |
18.5 |
| |
(i) |
Mining & quarrying |
2.3 |
2.2 |
2.3 |
2.2 |
2.2 |
2.1 |
2.1 |
2.0 |
1.9 |
| |
(ii) |
Manufacturing |
15.3 |
14.8 |
15.2 |
15.0 |
15.1 |
15.1 |
15.3 |
15.2 |
14.6 |
| |
(iii) |
Electricity, gas & water supply |
2.4 |
2.3 |
2.4 |
2.3 |
2.3 |
2.2 |
2.1 |
2.0 |
2.0 |
III. |
Services |
56.1 |
56.7 |
58.7 |
58.9 |
60.2 |
61.1 |
62.0 |
63.0 |
64.5 |
| |
(i) |
Construction |
5.8 |
5.7 |
5.9 |
6.1 |
6.6 |
7.0 |
7.2 |
7.2 |
7.3 |
| |
(ii) |
Trade, hotels & restaurant |
14.3 |
14.9 |
15.3 |
15.5 |
15.5 |
15.6 |
15.7 |
28.0^ |
28.6^ |
| |
(iii) |
Transport, storage & communication |
8.0 |
8.2 |
9.0 |
9.5 |
10.2 |
10.7 |
11.4 |
-- |
-- |
| |
(iv) |
Financing, insurance, real estate & business services |
13.0 |
13.2 |
13.7 |
13.4 |
13.5 |
13.8 |
14.3 |
14.6 |
14.8 |
| |
(v) |
Community, social & personal services |
15.0 |
14.7 |
14.8 |
14.3 |
14.2 |
13.9 |
13.4 |
13.1 |
13.9 |
IV. |
Gross domestic product at factor cost |
100.0 |
100.0 |
100.0 |
100.0 |
100.0 |
100.0 |
100.0 |
100.0 |
100.0 |
@ : Provisional * : Quick Estimates. # :Revised Estimates. ^ : Includes ‘Transport, storage and communication ’.
.. : Not Available. Source: Central Statistical Organisation. |
2. Trends in Domestic Saving Fiscal consolidation, particularly following the enactment of FRBM Act coupled with strong growth performance led to distinct improvement in public and private sector savings during the recent years. As per the Quick Estimates, the Gross Domestic Savings (GDS) in India at current market prices have increased to 37.7 per cent of GDP in 2007-08 from 35.7 per cent in 2006-07, mainly due to improvement in saving performance of the private corporate and public sectors. There was also a modest increase in household sectors saving during the same period (Table 4). It is significant to note that the Indian economy has witnessed a continuous increase in the rate of GDS, particularly 2001-02 onwards. During this period, the public sector saving has witnessed a turn-around since 2003-04, with the rate of saving increasing to 4.5 per cent in 2007-08 from (-) 2.0 per cent in 2001-2002.
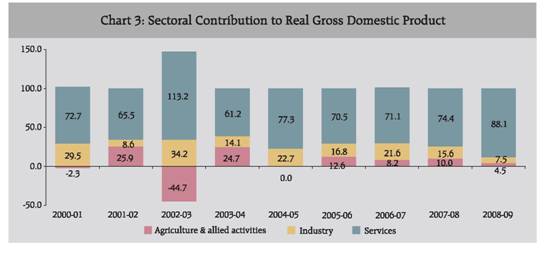
Table 3: Sectoral Contribution to the Growth of Gross Domestic Product at factor cost |
( Per cent) |
| |
2000-01 |
2001-02 |
2002-03 |
2003-04 |
2004-05 |
2005-06 |
2006-07@ |
2007-08* |
2008-09# |
1 |
2 |
3 |
4 |
5 |
6 |
7 |
8 |
9 |
10 |
I. |
Agriculture & allied activities |
-0.1 |
1.5 |
-1.7 |
2.1 |
0.0 |
1.2 |
0.8 |
0.9 |
0.3 |
II. |
Industry |
1.3 |
0.5 |
1.3 |
1.2 |
1.7 |
1.6 |
2.1 |
1.4 |
0.5 |
| |
(i) |
Mining & quarrying |
0.1 |
0.0 |
0.2 |
0.1 |
0.2 |
0.1 |
0.2 |
0.1 |
0.1 |
| |
(ii) |
Manufacturing |
1.1 |
0.4 |
1.0 |
1.0 |
1.3 |
1.4 |
1.8 |
1.3 |
0.4 |
| |
(iii) |
Electrical, gas & water supply |
0.1 |
0.0 |
0.1 |
0.1 |
0.2 |
0.1 |
0.1 |
0.1 |
0.1 |
III. |
Services |
3.2 |
3.8 |
4.3 |
5.2 |
5.8 |
6.7 |
6.9 |
6.7 |
5.9 |
| |
(i) |
Construction |
0.4 |
0.2 |
0.5 |
0.7 |
1.0 |
1.1 |
0.8 |
0.7 |
0.5 |
| |
(ii) |
Trade, hotels & restaurant |
0.7 |
1.4 |
1.0 |
1.5 |
1.2 |
1.6 |
1.6 |
3.5^ |
2.6^ |
| |
(iii) |
Transport, storage |
|
|
|
|
|
|
|
|
|
| |
|
& communication |
0.8 |
0.7 |
1.2 |
1.4 |
1.5 |
1.5 |
1.8 |
.. |
… |
| |
(iv) |
Financing, insurance, real |
|
|
|
|
|
|
|
|
|
| |
|
estate & business services |
0.5 |
0.9 |
1.1 |
0.8 |
1.2 |
1.5 |
1.9 |
1.7 |
1.1 |
| |
(v) |
Community, social & |
|
|
|
|
|
|
|
|
|
| |
|
personal services |
0.7 |
0.6 |
0.6 |
0.8 |
1.0 |
1.0 |
0.8 |
0.9 |
1.7 |
IV. |
Gross Domestic Product |
4.4 |
5.8 |
3.8 |
8.5 |
7.5 |
9.5 |
9.7 |
9.0 |
6.7 |
@ : Provisional * : Quick Estimates. # : Revised Estimates.
^ : Includes ‘Transport, storage and communication’.
.. : Not Available. Sectoral rates may not add up to GDP growth due to rounding off.
Source: Central Statistical Organisation. |
Table 4: Saving and Capital Formation by Institutions |
(Per cent of GDP at Current Market Prices) |
Item |
2001-02 |
2002-03 |
2003-04 |
2004-05 |
2005-06 |
2006-07* |
2007-08# |
1 |
2 |
3 |
4 |
5 |
6 |
7 |
8 |
1. |
Gross Domestic Saving |
23.5 |
26.3 |
29.8 |
31.7 |
34.2 |
35.7 |
37.7 |
| |
(i) |
Household Sector |
22.1 |
22.9 |
24.1 |
22.8 |
24.1 |
24.1 |
24.3 |
| |
|
(a) Financial Assets |
10.9 |
10.3 |
11.4 |
10.1 |
11.7 |
11.7 |
11.7 |
| |
|
(b) Physical Assets |
11.3 |
12.6 |
12.7 |
12.7 |
12.4 |
12.4 |
12.6 |
| |
(ii) |
Private Corporate Sector |
3.4 |
4.0 |
4.6 |
6.7 |
7.7 |
8.3 |
8.8 |
| |
|
of which: Joint Stock Companies |
3.1 |
3.5 |
4.1 |
6.2 |
7.2 |
7.8 |
8.4 |
| |
(iii) |
Public Sector |
-2.0 |
-0.6 |
1.1 |
2.2 |
2.4 |
3.3 |
4.5 |
| |
|
of which : Non-department |
|
|
|
|
|
|
|
| |
|
commercial Enterprises |
3.5 |
4.0 |
4.2 |
4.2 |
4.1 |
4.2 |
4.0 |
2. |
Gross Capital Formation |
24.2 |
25.2 |
26.8 |
31.6 |
34.8 |
36.4 |
38.7 |
| |
i) |
Household Sector |
11.3 |
12.6 |
12.7 |
12.7 |
12.4 |
12.4 |
12.6 |
| |
ii) |
Private Corporate Sector |
5.4 |
5.9 |
6.8 |
10.8 |
13.7 |
14.8 |
15.9 |
| |
iii) |
Public Sector |
6.9 |
6.1 |
6.3 |
6.9 |
7.6 |
8.0 |
9.1 |
| |
iv) |
Valuables |
0.6 |
0.6 |
0.9 |
1.3 |
1.2 |
1.2 |
1.1 |
3. |
Gross Domestic Capital |
|
|
|
|
|
|
|
| |
Formation (GDCF)## |
22.8 |
25.2 |
27.6 |
32.1 |
35.5 |
36.9 |
39.1 |
4. |
Saving -Investment Balance |
-0.7 |
1.1 |
3.0 |
0.1 |
-0.6 |
-0.7 |
-1.0 |
| |
i) |
Household Sector |
10.8 |
10.3 |
11.4 |
10.1 |
11.7 |
11.7 |
11.7 |
| |
ii) |
Private Corporate Sector |
-2.0 |
-1.9 |
-2.2 |
-4.0 |
-6.0 |
-6.5 |
-7.0 |
| |
iii) |
Public Sector |
-8.9 |
-6.7 |
-5.3 |
-4.7 |
-5.2 |
-4.6 |
-4.6 |
* : Provisional estimates. # : Quick Estimates. ## : Adjusted for errors and omissions.
Source : Central Statistical Organisation. |
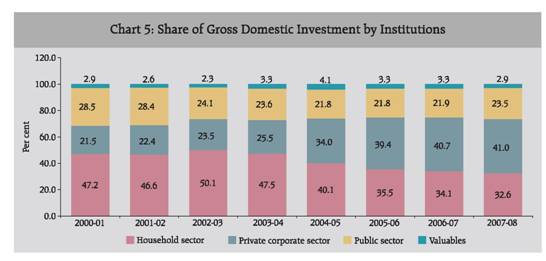
The household sector has been the largest contributor to the GDS, though its share has been declining overtime. An analysis of the composition of GDS shows that the share of household sector has decreased to 64.6 per cent in 2007-08 from 91.1 per cent in 2000-01. On the other hand, the private corporate sector, which occupied the second largest share in the GDS, increased its share during the same period on account of rise in its profitability. As mentioned earlier, the public sector turned from dis-savings to a savings generating sector constituting 11.9 per cent of GDS in 2007-08 from (-) 7.4 per cent in 2000-01 (Chart 4). 3. Trends in Domestic Capital Formation The rate of Gross Domestic Capital Formation (GDCF) continued its rising trend and rose to 39.1 per cent in 2007-08 from 36.9 per cent in 2006-07 induced by high growth performance of Indian economy. The saving-investment gap (i.e. rate of GDS less rate of GDCF) increased further in 2007-08. Of the three contributing sectors, the rate of capital formation in the household sector, a corollary of household sector saving in physical assets, increased modestly in 2007-08. The rate of capital formation in private corporate sector also increased modestly in 2007-08. Similarly, public sector also witnessed an increase in rate of capital formation during the same period mainly on account of higher investment in public sector enterprises coupled with a revival in investment in agriculture sector in the area of irrigation, rural infrastructure and incentivisation of state governments for the same (Table 4 and Statement 3). The saving-investment gaps at the sectoral level are indicated in Table 4. The composition of Gross Capital Formation (GCF) by type of institution reveals that while the share of public as well as private sector in gross capital formation have increased in 2007-08 in comparison to 2006-07, the share of household sector decreased during the same period (Chart 5).
In terms of type of economic activity, capital formation was highest in the industrial sector. It increased to 50.1 per cent in 2007-08 from 37.0 per cent in 2000-01. On the other hand, the share of capital formation in the services as well as agricultural sector continuously declined during the same period. The share of capital formation in ‘agriculture and allied activities’ continued to be the lowest among all the three sectors (Chart 6, Statement 4). 4. Other Macro-economic Aggregates As a share of GDP at current market prices, total final consumption expenditure has increased in 2008-09 mainly on account of an increase in the share of Government final consumption expenditure (GFCE). Gross fixed capital formation as a proportion of GDP increased marginally in 2008-09, while ‘change in stock’ remained unchanged at the previous year’s level. The share of ‘valuables’ as per cent to GDP increased to 1.3 per cent in 2008-09 from 1.1 per cent in 2007-08. The shares of exports and imports in GDP have increased in 2008-09 vis-a-vis 2007-08. As a result, net exports as a proportion of GDP at current market prices declined further (Statement 5a).

Similar trends could be observed in other macro-economic aggregates, such as Net Domestic Product (NDP), Net National Product (NNP), Gross National Product (GNP), etc. which are basically variants of Gross Domestic Product at factor cost. The real Net National Product at factor cost, which is defined as National Income, grew at 9.1 per cent in 2007-08, more than double of 3.7 per cent in 2000-01. Accordingly, the per capita income (i.e. per capita Net National Product at factor cost) showed a growth of 7.6 per cent in 2007-08 from 1.8 per cent in 2000-01. However, national income and per capita income both registered lower growth of 6.4 and 4.9, respectively in 2008-09 (Statement 5b). It may be mentioned that some ‘Discrepancies’ arise due to the difference between the GDP estimated by economic activity marked up by net indirect taxes (indirect taxes less subsidies) to arrive at GDP at market prices and the GDP estimated from the expenditure side. Discrepancies during 2008-09 are estimated at 0.7 per cent of GDP at current market prices as against the corresponding rate of 0.3 per cent in 2007-08. To sum up, after averaging a high growth rate of 8.9 per cent during the five years period of 2003-04 to 2007-08, India’s real GDP growth declined sharply to 6.7 per cent in 2008-09, reflecting a cyclical downturn and contagion of global financial crisis. However, despite the moderation in growth, India continues to be one of the fastest growing economies in the world reaffirming its inherent strength and strong macroeconomic fundamentals led by strong domestic demand base.
Statement 1 : Trends in Sectoral Growth and Share of Gross Domestic Product at Factor cost (Contd.) |
(Amount in Rs. crore and growth rate in per cent) |
Item |
2000-01 |
2001-02 |
2002-03 |
2003-04 |
2004-05 |
Amount |
Growth Rate |
Amount |
Growth Rate |
Amount |
Growth Rate |
Amount |
Growth Rate |
Amount |
Growth Rate |
1 |
2 |
3 |
4 |
5 |
6 |
7 |
8 |
9 |
10 |
11 |
I. |
Agriculture & allied |
445403 |
-0.2 |
473249 |
6.3 |
438966 |
-7.2 |
482676 |
10.0 |
482910 |
0.0 |
| |
activities |
(23.9) |
|
(24.0) |
|
(21.4) |
|
(21.7) |
|
(20.2) |
|
II. |
Industry |
372599 |
6.4 |
381366 |
2.4 |
407276 |
6.8 |
431724 |
6.0 |
468451 |
8.5 |
| |
|
(20.0) |
|
(19.3) |
|
(19.9) |
|
(19.4) |
|
(19.6) |
|
| |
i) |
Mining & |
42589 |
2.4 |
43335 |
1.8 |
47168 |
8.8 |
48626 |
3.1 |
52591 |
8.2 |
| |
|
quarrying |
(2.3) |
|
(2.2) |
|
(2.3) |
|
(2.2) |
|
(2.2) |
|
| |
ii) |
Manufacturing |
284571 |
7.7 |
291803 |
2.5 |
311685 |
6.8 |
332363 |
6.6 |
361115 |
8.7 |
| |
|
|
(15.3) |
|
(14.8) |
|
(15.2) |
|
(15.0) |
|
(15.1) |
|
| |
iii) |
Electricity, gas & |
45439 |
2.1 |
46228 |
1.7 |
48423 |
4.7 |
50735 |
4.8 |
54745 |
7.9 |
| |
|
water supply |
(2.4) |
|
(2.3) |
|
(2.4) |
|
(2.3) |
|
(2.3) |
|
III. |
Services |
1046299 |
5.7 |
1117991 |
6.9 |
1202045 |
7.5 |
1308358 |
8.8 |
1437407 |
9.9 |
| |
|
(56.1) |
|
(56.7) |
|
(58.7) |
|
(58.9) |
|
(60.2) |
|
| |
i) |
Construction |
108362 |
6.2 |
112692 |
4.0 |
121650 |
7.9 |
136224 |
12.0 |
158212 |
16.1 |
| |
|
|
(5.8) |
|
(5.7) |
|
(5.9) |
|
(6.1) |
|
(6.6) |
|
| |
ii) |
Trade, hotels & |
267326 |
5.2 |
293075 |
9.6 |
313221 |
6.9 |
344743 |
10.1 |
371155 |
7.7 |
| |
|
restaurant |
(14.3) |
|
(14.9) |
|
(15.3) |
|
(15.5) |
|
(15.5) |
|
| |
iii) |
Transport, |
148324 |
11.2 |
160772 |
8.4 |
183471 |
14.1 |
211627 |
15.3 |
244694 |
15.6 |
| |
|
storage & communication |
(8.0) |
|
(8.2) |
|
(9.0) |
|
(9.5) |
|
(10.2) |
|
| |
iv) |
Financing,ins., |
243048 |
4.1 |
260737 |
7.3 |
281550 |
8.0 |
297250 |
5.6 |
323080 |
8.7 |
| |
|
real estate & business services |
(13.0) |
|
(13.2) |
|
(13.7) |
|
(13.4) |
|
(13.5) |
|
| |
v) |
Community, |
279239 |
4.7 |
290715 |
4.1 |
302153 |
3.9 |
318514 |
5.4 |
340266 |
6.8 |
| |
|
social & personal services |
(15.0) |
|
(14.7) |
|
(14.8) |
|
(14.3) |
|
(14.2) |
|
IV. |
GDP at factor cost |
1864300 |
4.4 |
1972606 |
5.8 |
2048287 |
3.8 |
2222758 |
8.5 |
2388768 |
7.5 |
| |
|
(100.0) |
|
(100.0) |
|
(100.0) |
|
(100.0) |
|
(100.0) |
|
Statement 1: Trends in Sectoral Growth and Share of Gross Domestic Product at Factor cost (Concld.) |
(Amount in Rs. crore and growth rate in per cent) |
Item |
2005-06 |
2006-07 |
2007-08 * |
2008-09 # |
Amount |
Growth Rate |
Amount |
Growth Rate |
Amount |
Growth Rate |
Amount |
Growth Rate |
1 |
12 |
13 |
14 |
15 |
16 |
17 |
18 |
19 |
I. |
Agriculture & allied activities |
511114 |
5.8 |
531315 |
4.0 |
557122 |
4.9 |
566045 |
1.6 |
| |
|
(19.5) |
|
(18.5) |
|
(17.8) |
|
(17.0) |
|
II. |
Industry |
506519 |
8.1 |
560775 |
10.7 |
602032 |
7.4 |
617882 |
2.6 |
| |
|
(19.4) |
|
(19.5) |
|
(19.2) |
|
(18.5) |
|
| |
i) |
Mining & quarrying |
55164 |
4.9 |
60038 |
8.8 |
61999 |
3.3 |
64244 |
3.6 |
| |
|
|
(2.1) |
|
(2.1) |
|
(2.0) |
|
(1.9) |
|
| |
ii) |
Manufacturing |
393842 |
9.1 |
440193 |
11.8 |
476303 |
8.2 |
487739 |
2.4 |
| |
|
|
(15.1) |
|
(15.3) |
|
(15.2) |
|
(14.6) |
|
| |
iii) |
Electricity, gas & water supply |
57513 |
5.1 |
60544 |
5.3 |
63730 |
5.3 |
65899 |
3.4 |
| |
|
(2.2) |
|
(2.1) |
|
(2.0) |
|
(2.0) |
|
III. |
Services |
1598468 |
11.2 |
1779028 |
11.3 |
1970563 |
10.8 |
2155448 |
9.4 |
| |
|
(61.1) |
|
(62.0) |
|
(63.0) |
|
(64.5) |
|
| |
i) |
Construction |
183868 |
16.2 |
205543 |
11.8 |
226325 |
10.1 |
242577 |
7.2 |
| |
|
|
(7.0) |
|
(7.2) |
|
(7.2) |
|
(7.3) |
|
| |
ii) |
Trade, hotels & restaurant |
409255 |
10.3 |
451910 |
10.4 |
497685 |
10.1 |
954589 ^ |
9.0 |
| |
|
|
(15.6) |
|
(15.7) |
|
(15.9) |
|
(28.6) |
|
| |
iii) |
Transport, storage & |
281144 |
14.9 |
326985 |
16.3 |
377713 |
15.5 |
— |
— |
| |
|
communication |
(10.7) |
|
(11.4) |
|
(12.1) |
|
|
|
| |
iv) |
Financing,ins.,real estate & |
359888 |
11.4 |
409472 |
13.8 |
457584 |
11.7 |
493356 |
7.8 |
| |
|
business services |
(13.8) |
|
(14.3) |
|
(14.6) |
|
(14.8) |
|
| |
v) |
Community, social & |
364313 |
7.1 |
385118 |
5.7 |
411256 |
6.8 |
464926 |
13.1 |
| |
|
personal services |
(13.9) |
|
(13.4) |
|
(13.1) |
|
(13.9) |
|
IV. |
GDP at factor cost |
2616101 |
9.5 |
2871120 |
9.7 |
3129717 |
9.0 |
3339375 |
6.7 |
| |
|
(100.0) |
|
(100.0) |
|
(100.0) |
|
(100.0) |
|
* : Quick Estimates. # : Revised Estimates. .. : Not Available.^ : Includes ‘Transport, storage and communication’.
Note : Figures in the parentheses are share as a per cent of GDP.
Source : Central Statistical Organisation. |
Statement 2 : Domestic Saving by Type of Institution (At Current Prices) |
(Amount in Rs. crore) |
Item |
2001-02 |
2002-03 |
2003-04 |
2004-05 |
2005-06 |
2006-07 |
2007-08* |
1 |
2 |
3 |
4 |
5 |
6 |
7 |
8 |
I. |
Household sector |
504165 |
563240 |
664064 |
716874 |
864653 |
994898 |
1150134 |
| |
|
(22.1) |
(22.9) |
(24.1) |
(22.8) |
(24.1) |
(24.1) |
(24.3) |
| |
(i) |
Financial saving |
247476 |
253255 |
313260 |
317546 |
420974 |
482822 |
553288 |
| |
|
(10.9) |
(10.3) |
(11.4) |
(10.1) |
(11.7) |
(11.7) |
(11.7) |
| |
(ii) |
Physical Saving |
256689 |
309985 |
350804 |
399328 |
443679 |
512076 |
596846 |
| |
|
(11.3) |
(12.6) |
(12.7) |
(12.7) |
(12.4) |
(12.4) |
(12.6) |
II. |
Private corporate sector |
76906 |
99217 |
127100 |
212048 |
276550 |
342284 |
416936 |
| |
|
(3.4) |
(4.0) |
(4.6) |
(6.7) |
(7.7) |
(8.3) |
(8.8) |
III. |
Public sector |
-46186 |
-15936 |
29521 |
68951 |
86823 |
137926 |
212543 |
| |
|
-(2.0) |
-(0.6) |
(1.1) |
(2.2) |
(2.4) |
(3.3) |
(4.5) |
IV. |
Gross Domestic Saving |
534885 |
646521 |
820685 |
997873 |
1228026 |
1475108 |
1779613 |
| |
|
(23.5) |
(26.3) |
(29.8) |
(31.7) |
(34.2) |
(35.7) |
(37.7) |
* : Quick Estimates.
Note : Figures in parantheses are rate as a percentage of GDP
Source : Central Statistical Organisation. |
Statement 3: Capital Formation by Type of Institution |
(Amount in Rs.crore) |
Item |
2000-01 |
2001-02 |
2002-03 |
2003-04 |
2004-05 |
2005-06 |
2006-07 |
2007-08* |
1 |
2 |
3 |
4 |
5 |
6 |
7 |
8 |
9 |
(At current prices) |
I. |
Gross capital formation (GCF) |
508009 |
551042 |
618807 |
738221 |
996099 |
1248899 |
1502508 |
1829346 |
| |
|
(24.2) |
(24.2) |
(25.2) |
(26.8) |
(31.6) |
(34.8) |
(36.4) |
(38.7) |
| |
(i) |
Public sector |
144638 |
156537 |
149399 |
174579 |
216962 |
271835 |
329679 |
429014 |
| |
|
|
(6.9) |
(6.9) |
(6.1) |
(6.3) |
(6.9) |
(7.6) |
(8.0) |
(9.1) |
| |
(ii) |
Private corporate sector |
109013 |
123628 |
145466 |
188266 |
338755 |
491983 |
611044 |
749894 |
| |
|
|
(5.2) |
(5.4) |
(5.9) |
(6.8) |
(10.8) |
(13.7) |
(14.8) |
(15.9) |
| |
(iii) |
Household sector |
239634 |
256689 |
309985 |
350804 |
399328 |
443679 |
512076 |
596846 |
| |
|
|
(11.4) |
(11.3) |
(12.6) |
(12.7) |
(12.7) |
(12.4) |
(12.4) |
(12.6) |
| |
(iv) |
Valuables |
14724 |
14187 |
13957 |
24572 |
41054 |
41392 |
49709 |
53591 |
| |
|
|
(0.7) |
(0.6) |
(0.6) |
(0.9) |
(1.3) |
(1.2) |
(1.2) |
(1.1) |
II. |
Gross fixed capital formation |
477818 |
538180 |
585010 |
687890 |
895980 |
1112602 |
1343843 |
1605440 |
| |
|
(22.7) |
(23.6) |
(23.8) |
(25.0) |
(28.4) |
(31.0) |
(32.5) |
(34.0) |
III. |
Change in stock |
15467 |
-1325 |
19840 |
25759 |
59065 |
94895 |
108956 |
170315 |
| |
|
(0.7) |
-(0.1) |
(0.8) |
(0.9) |
(1.9) |
(2.6) |
(2.6) |
(3.6) |
IV. |
Valuables |
14724 |
14187 |
13957 |
24572 |
41054 |
41392 |
49709 |
53591 |
| |
|
(0.7) |
(0.6) |
(0.6) |
(0.9) |
(1.3) |
(1.2) |
(1.2) |
(1.1) |
V. |
Errors & omissions |
3779 |
-30386 |
-772 |
21104 |
15113 |
23741 |
19297 |
16167 |
| |
|
(0.2) |
-(1.3) |
(0.0) |
(0.8) |
(0.5) |
(0.7) |
(0.5) |
(0.3) |
VI. |
Gross domestic capital |
511788 |
520656 |
618035 |
759325 |
1011212 |
1272630 |
1521805 |
1845513 |
| |
formation # (II+III+IV+V) |
(24.3) |
(22.8) |
(25.2) |
(27.6) |
(32.1) |
(35.5) |
(36.9) |
(39.1) |
(At constant prices) |
I. |
Gross capital formation (GCF) |
485049 |
502116 |
554734 |
633105 |
781622 |
930738 |
1060108 |
1220412 |
| |
|
(23.9) |
(23.5) |
(25.0) |
(26.3) |
(30.0) |
(32.7) |
(34.0) |
(35.9) |
| |
(i) |
Public sector |
140315 |
144540 |
134468 |
145578 |
166989 |
202935 |
232844 |
290032 |
| |
|
(6.9) |
(6.8) |
(6.1) |
(6.1) |
(6.4) |
(7.1) |
(7.5) |
(8.5) |
| |
(ii) |
Private corporate sector |
102912 |
111726 |
130848 |
163091 |
274130 |
373165 |
441866 |
513210 |
| |
|
(5.1) |
(5.2) |
(5.9) |
(6.8) |
(10.5) |
(13.1) |
(14.2) |
(15.1) |
| |
(iii) |
Household sector |
227566 |
232360 |
276489 |
302895 |
306630 |
321498 |
347307 |
378052 |
| |
|
(11.2) |
(10.9) |
(12.5) |
(12.6) |
(11.8) |
(11.3) |
(11.1) |
(11.1) |
| |
(iv) |
Valuables |
14256 |
13489 |
12930 |
21541 |
33873 |
33140 |
38091 |
39118 |
| |
|
(0.7) |
(0.6) |
(0.6) |
(0.9) |
(1.3) |
(1.2) |
(1.2) |
(1.1) |
II. |
Gross fixed capital formation |
456380 |
490009 |
523310 |
594552 |
706906 |
831470 |
952344 |
1075632 |
| |
|
(22.5) |
(22.9) |
(23.6) |
(24.7) |
(27.2) |
(29.2) |
(30.5) |
(31.6) |
III. |
Change in stock |
14413 |
-1383 |
18495 |
17012 |
40843 |
66128 |
69673 |
105662 |
| |
|
(0.7) |
-(0.1) |
(0.8) |
(0.7) |
(1.6) |
(2.3) |
(2.2) |
(3.1) |
IV. |
Valuables |
14256 |
13489 |
12930 |
21541 |
33873 |
33140 |
38091 |
39118 |
| |
|
(0.7) |
(0.6) |
(0.6) |
(0.9) |
(1.3) |
(1.2) |
(1.2) |
(1.1) |
V. |
Errors & omissions |
3609 |
-27667 |
-691 |
18241 |
11924 |
17742 |
13675 |
10832 |
| |
|
(0.2) |
-(1.3) |
(0.0) |
(0.8) |
(0.5) |
(0.6) |
(0.4) |
(0.3) |
VI. |
Gross domestic capital |
488658 |
474449 |
554044 |
651346 |
793545 |
948480 |
1073783 |
1231244 |
| |
formation # (II+III+IV+V) |
(24.1) |
(22.2) |
(25.0) |
(27.1) |
(30.5) |
(33.3) |
(34.4) |
(36.2) |
* : Quick Estimates. # : Adjsuted for errors and omissions.
Notes : Figures in parentheses are rate as percentage of GDP. Source : Central Statistical Organisation. |
Statement 4: Gross Capital Formation by Industry at Constant Prices (Contd.) |
(Amount in Rs. crore and rate as percentage of GDP) |
Item |
2000-01 |
2001-02 |
2002-03 |
2003-04 |
Amount |
Rate |
Amount |
Rate |
Amount |
Rate |
Amount |
Rate |
1 |
2 |
3 |
4 |
5 |
6 |
7 |
8 |
9 |
I. |
Agriculture & allied activities |
45480 |
2.2 |
56978 |
2.7 |
55668 |
2.5 |
53542 |
2.2 |
| |
|
(9.7) |
|
(11.7) |
|
(10.3) |
|
(8.8) |
|
II. |
Industry |
174369 |
8.6 |
158479 |
7.4 |
207313 |
9.4 |
257954 |
10.7 |
| |
|
(37.0) |
|
(32.4) |
|
(38.3) |
|
(42.2) |
|
| |
(i) |
Mining & quarrying |
5810 |
0.3 |
8384 |
0.4 |
8385 |
0.4 |
14185 |
0.6 |
| |
|
(1.2) |
|
(1.7) |
|
(1.5) |
|
(2.3) |
|
| |
(ii) |
Manufacturing |
128988 |
6.4 |
106206 |
5.0 |
158580 |
7.2 |
194206 |
8.1 |
| |
|
(27.4) |
|
(21.7) |
|
(29.3) |
|
(31.8) |
|
| |
(iii) |
Electricity, gas & water supply |
39571 |
1.9 |
43889 |
2.1 |
40348 |
1.8 |
49563 |
2.1 |
| |
|
|
(8.4) |
|
(9.0) |
|
(7.4) |
|
(8.1) |
|
III. |
Services |
250944 |
12.4 |
273170 |
12.8 |
278824 |
12.6 |
300068 |
12.5 |
| |
|
(53.3) |
|
(55.9) |
|
(51.5) |
|
(49.1) |
|
| |
(i) |
Construction |
9074 |
0.4 |
15846 |
0.7 |
16711 |
0.8 |
21324 |
0.9 |
| |
|
(1.9) |
|
(3.2) |
|
(3.1) |
|
(3.5) |
|
| |
(ii) |
Trade, hotels & restaurants |
27921 |
1.4 |
16437 |
0.8 |
9317 |
0.4 |
24916 |
1.0 |
| |
|
(5.9) |
|
(3.4) |
|
(1.7) |
|
(4.1) |
|
| |
(iii) |
Transport, storage |
76297 |
3.8 |
60348 |
2.8 |
73205 |
3.3 |
71098 |
3.0 |
| |
|
& communication |
(16.2) |
|
(12.4) |
|
(13.5) |
|
(11.6) |
|
| |
(iv) |
Financing, insurance, real |
79976 |
3.9 |
109136 |
5.1 |
101311 |
4.6 |
102148 |
4.3 |
| |
|
estate & business services |
(17.0) |
|
(22.3) |
|
(18.7) |
|
(16.7) |
|
| |
(v) |
Community, social & |
57676 |
2.8 |
71403 |
3.3 |
78280 |
3.5 |
80582 |
3.4 |
| |
|
personal services |
(12.3) |
|
(14.6) |
|
(14.4) |
|
(13.2) |
|
IV. |
Gross capital formation |
470793 |
23.2 |
488627 |
22.9 |
541805 |
24.4 |
611564 |
25.5 |
| |
by industry of use |
(100.0) |
|
(100.0) |
|
(100.0) |
|
(100.0) |
|
Statement 4: Gross Capital Formation by Industry at Constant Prices (Concld.) |
(Amount in Rs. crore and rate as percentage of GDP) |
Item |
2004-05 |
2005-06 |
2006-07 |
2007-08* |
Amount |
Rate |
Amount |
Rate |
Amount |
Rate |
Amount |
Rate |
1 |
10 |
11 |
12 |
13 |
14 |
15 |
16 |
17 |
I. |
Agriculture & allied activities |
57849 |
2.2 |
66065 |
2.3 |
73285 |
2.3 |
79328 |
2.3 |
| |
|
(7.7) |
|
(7.4) |
|
(7.2) |
|
(6.7) |
|
II. |
Industry |
367583 |
14.1 |
452263 |
15.9 |
525943 |
16.9 |
591731 |
17.4 |
| |
|
(49.2) |
|
(50.4) |
|
(51.5) |
|
(50.1) |
|
| |
(i) |
Mining & quarrying |
21832 |
0.8 |
21956 |
0.8 |
20681 |
0.7 |
25945 |
0.8 |
| |
|
(2.9) |
|
(2.4) |
|
(2.0) |
|
(2.2) |
|
| |
(ii) |
Manufacturing |
300336 |
11.5 |
368492 |
13.0 |
434076 |
13.9 |
492005 |
14.5 |
| |
|
(40.2) |
|
(41.1) |
|
(42.5) |
|
(41.6) |
|
| |
(iii) |
Electricity, gas & water supply |
45415 |
1.7 |
61815 |
2.2 |
71186 |
2.3 |
73781 |
2.2 |
| |
|
|
(6.1) |
|
(6.9) |
|
(7.0) |
|
(6.2) |
|
III. |
Services |
322315 |
12.4 |
379269 |
13.3 |
422791 |
13.6 |
510236 |
15.0 |
| |
|
(43.1) |
|
(42.3) |
|
(41.4) |
|
(43.2) |
|
| |
(i) |
Construction |
25577 |
1.0 |
33217 |
1.2 |
41667 |
1.3 |
48366 |
1.4 |
| |
|
(3.4) |
|
(3.7) |
|
(4.1) |
|
(4.1) |
|
| |
(ii) |
Trade, hotels & restaurants |
26127 |
1.0 |
24817 |
0.9 |
32502 |
1.0 |
34079 |
1.0 |
| |
|
|
(3.5) |
|
(2.8) |
|
(3.2) |
|
(2.9) |
|
| |
(iii) |
Transport, storage & communication |
81387 |
3.1 |
115288 |
4.1 |
128611 |
4.1 |
166617 |
4.9 |
| |
|
|
(10.9) |
|
(12.8) |
|
(12.6) |
|
(14.1) |
|
| |
(iv) |
Financing, insurance, |
90465 |
3.5 |
108041 |
3.8 |
109250 |
3.5 |
126282 |
3.7 |
| |
|
real estate & business services |
(12.1) |
|
(12.0) |
|
(10.7) |
|
(10.7) |
|
| |
(v) |
Community, social & personal services |
98759 |
3.8 |
97906 |
3.4 |
110761 |
3.5 |
134892 |
4.0 |
| |
|
|
(13.2) |
|
(10.9) |
|
(10.8) |
|
(11.4) |
|
IV. |
Gross capital formation |
747749 |
28.7 |
897598 |
31.6 |
1022017 |
32.8 |
1181294 |
34.7 |
| |
by industry of use |
(100.0) |
|
(100.0) |
|
(100.0) |
|
(100.0) |
|
* : Quick Estimates.
Notes : Figures in parentheses are share of Gross Capital Formation.
Source : Central Statistical Organisation. |
Statement 5a: Select Macroeconomic Aggregates (at current prices) (Contd.) |
(Amount in Rs. crore and growth rate in per cent) |
Item |
2000-01 |
2001-02 |
2002-03 |
2003-04 |
2004-05 |
Amount |
Growth rate |
Amount |
Growth rate |
Amount |
Growth rate |
Amount |
Growth rate |
Amount |
Growth rate |
1 |
2 |
3 |
4 |
5 |
6 |
7 |
8 |
9 |
10 |
11 |
I. |
Product Aggregates |
|
|
|
|
|
|
|
|
|
|
1. |
GDP at factor cost |
1925017 |
7.8 |
2097726 |
9.0 |
2261415 |
7.8 |
2538170 |
12.2 |
2877701 |
13.4 |
2. |
GDP at market prices |
2102314 |
7.7 |
2278952 |
8.4 |
2454561 |
7.7 |
2754620 |
12.2 |
3149407 |
14.3 |
3. |
NDP at market prices |
1900496 |
7.3 |
2050655 |
7.9 |
2204053 |
7.5 |
2474572 |
12.3 |
2820366 |
14.0 |
4. |
GNP at factor cost |
1902284 |
7.4 |
2077658 |
9.2 |
2244725 |
8.0 |
2517462 |
12.2 |
2855326 |
13.4 |
5. |
NNP at factor cost |
1700466 |
7.0 |
1849361 |
8.8 |
1994217 |
7.8 |
2237414 |
12.2 |
2526285 |
12.9 |
6. |
GNP at market prices |
2079581 |
7.4 |
2258884 |
8.6 |
2437871 |
7.9 |
2733912 |
12.1 |
3127032 |
14.4 |
7. |
NNP at market prices |
1877763 |
7.0 |
2030587 |
8.1 |
2187363 |
7.7 |
2453864 |
12.2 |
2797991 |
14.0 |
8. |
Per capita GNP at factor cost |
18668 |
5.5 |
19977 |
7.0 |
21257 |
6.4 |
23484 |
10.5 |
26220 |
11.6 |
9. |
Per capita NNP at factor cost |
16688 |
5.1 |
17782 |
6.6 |
18885 |
6.2 |
20871 |
10.5 |
23198 |
11.1 |
II. |
Demand Aggregates |
|
|
|
|
|
|
|
|
|
|
1. |
Total Final Consumption |
1604362 |
6.5 |
1748981 |
9.0 |
1842343 |
5.3 |
2009782 |
9.1 |
2178078 |
8.4 |
| |
Expenditure |
(76.3) |
|
(76.7) |
|
(75.1) |
|
(73.0) |
|
(69.2) |
|
2. |
Private Final Consumption |
1339274 |
6.8 |
1467195 |
9.6 |
1551365 |
5.7 |
1699485 |
9.5 |
1840026 |
8.3 |
| |
Expenditure |
(63.7) |
|
(64.4) |
|
(63.2) |
|
(61.7) |
|
(58.4) |
|
3. |
Governement Final |
265088 |
4.9 |
281786 |
6.3 |
290978 |
3.3 |
310297 |
6.6 |
338052 |
8.9 |
| |
Consumption Expenditure |
(12.6) |
|
(12.4) |
|
(11.9) |
|
(11.3) |
|
(10.7) |
|
4. |
Exports of Goods |
278126 |
22.1 |
290757 |
4.5 |
355556 |
22.3 |
417425 |
17.4 |
569051 |
36.3 |
| |
& Services |
(13.2) |
|
(12.8) |
|
(14.5) |
|
(15.2) |
|
(18.1) |
|
5. |
Imports of Goods |
297523 |
12.0 |
311050 |
4.5 |
379981 |
22.2 |
436878 |
15.0 |
625945 |
43.3 |
| |
& Services |
(14.2) |
|
(13.6) |
|
(15.5) |
|
(15.9) |
|
(19.9) |
|
6. |
Gross Fixed Capital |
477818 |
4.7 |
538180 |
12.6 |
585010 |
8.7 |
687890 |
17.6 |
895980 |
30.3 |
| |
Formation |
(22.7) |
|
(23.6) |
|
(23.8) |
|
(25.0) |
|
(28.4) |
|
7. |
Change in stock |
15467 |
|
-1325 |
|
19840 |
|
25759 |
|
59065 |
|
| |
|
(0.7) |
|
-(0.1) |
|
(0.8) |
|
(0.9) |
|
(1.9) |
|
8. |
Valuables |
14724 |
|
14187 |
|
13957 |
|
24572 |
|
41054 |
|
| |
|
(0.7) |
|
(0.6) |
|
(0.6) |
|
(0.9) |
|
(1.3) |
|
9. |
Discrepancies |
9340 |
|
–777 |
|
17153 |
|
42961 |
|
31905 |
|
| |
|
(0.4) |
|
(0.0) |
|
(0.7) |
|
(1.6) |
|
(1.0) |
|
Statement 5a: Select Macroeconomic Aggregates (at current prices) (Concld.) |
(Amount in Rs. crore and growth rate in per cent) |
Item |
2005-06 |
2006-07 |
2007-08* |
2008-09 # |
Amount |
Growth Rate |
Amount |
Growth Rate |
Amount |
Growth Rate |
Amount |
Growth Rate |
1 |
12 |
13 |
14 |
15 |
16 |
17 |
18 |
19 |
I. |
Product Aggregates |
|
|
|
|
|
|
|
|
1. |
GDP at factor cost |
3282385 |
14.1 |
3779384 |
15.1 |
4320892 |
14.3 |
4933183 |
14.2 |
2. |
GDP at market prices |
3586743 |
13.9 |
4129173 |
15.1 |
4723400 |
14.4 |
5321753 |
12.7 |
3. |
NDP at market prices |
3206432 |
13.7 |
3692136 |
15.1 |
4213949 |
14.1 |
.. |
.. |
4. |
GNP at factor cost |
3256269 |
14.0 |
3749606 |
15.2 |
4297047 |
14.6 |
4906167 |
14.2 |
5. |
NNP at factor cost |
2875958 |
13.8 |
3312568 |
15.2 |
3787597 |
14.3 |
4326384 |
14.2 |
6. |
GNP at market prices |
3560627 |
13.9 |
4099396 |
15.1 |
4699555 |
14.6 |
.. |
.. |
7. |
NNP at market prices |
3180316 |
13.7 |
3662358 |
15.2 |
4190104 |
14.4 |
.. |
.. |
8. |
Per capita GNP at factor cost |
29442 |
12.3 |
33419 |
13.5 |
37660 |
12.7 |
.. |
.. |
9. |
Per capita NNP at factor cost |
26003 |
12.1 |
29524 |
13.5 |
33283 |
12.7 |
37490 |
12.6 |
II. |
Demand Aggregates |
|
|
|
|
|
|
|
|
1. |
Total Final Consumption |
2433023 |
11.7 |
2729368 |
12.2 |
3075183 |
12.7 |
3529833 |
14.8 |
| |
Expenditure |
(67.8) |
|
(66.1) |
|
(65.1) |
|
(66.3) |
|
2. |
Private Final Consumption |
2057461 |
11.8 |
2307822 |
12.2 |
2596084 |
12.5 |
2913386 |
12.2 |
| |
Expenditure |
(57.4) |
|
(55.9) |
|
(55.0) |
|
(54.7) |
|
3. |
Government Final |
375562 |
11.1 |
421546 |
12.2 |
479099 |
13.7 |
616447 |
28.7 |
| |
Consumption Expenditure |
(10.5) |
|
(10.2) |
|
(10.1) |
|
(11.6) |
|
4. |
Exports of Goods |
712087 |
25.1 |
916804 |
28.7 |
999441 |
9.0 |
1206600 |
20.7 |
| |
& Services |
(19.9) |
|
(22.2) |
|
(21.2) |
|
(22.7) |
|
5. |
Imports of Goods |
813466 |
30.0 |
1042263 |
28.1 |
1167786 |
12.0 |
1491375 |
27.7 |
| |
& Services |
(22.7) |
|
(25.2) |
|
(24.7) |
|
(28.0) |
|
6. |
Gross Fixed Capital |
1112602 |
24.2 |
1343843 |
20.8 |
1605440 |
19.5 |
1852354 |
15.4 |
| |
Formation |
(31.0) |
|
(32.5) |
|
(34.0) |
|
(34.8) |
|
7. |
Change in stock |
94895 |
|
108956 |
|
170315 |
|
187548 |
|
| |
|
(2.6) |
|
(2.6) |
|
(3.6) |
|
(3.5) |
|
8. |
Valuables |
41392 |
|
49709 |
|
53591 |
|
71656 |
|
| |
|
(1.2) |
|
(1.2) |
|
(1.1) |
|
(1.3) |
|
9. |
Discrepancies |
16460 |
|
22756 |
|
-12784 |
|
-34864 |
|
| |
|
(0.5) |
|
(0.6) |
|
-(0.3) |
|
-(0.7) |
|
* : Quick Estimates. # : Revised Estimates.
Note : Figures in parentheses are percentage of GDP at constant market prices.
Source : Central Statistical Organisation. |
Statement 5b: Select Macroeconomic Aggregates ( at constant prices) (Contd.) |
(Amount in Rs. crore and growth rate in per cent) |
Item |
2000-01 |
2001-02 |
2002-03 |
2003-04 |
2004-05 |
Amount |
Growth rate |
Amount |
Growth rate |
Amount |
Growth rate |
Amount |
Growth rate |
Amount |
Growth rate |
1 |
2 |
3 |
4 |
5 |
6 |
7 |
8 |
9 |
10 |
11 |
I. |
Product Aggregates |
|
|
|
|
|
|
|
|
|
|
1. |
GDP at factor cost |
1864301 |
4.4 |
1972606 |
5.8 |
2048286 |
3.8 |
2222758 |
8.5 |
2388768 |
7.5 |
2. |
GDP at market prices |
2030711 |
4.0 |
2136651 |
5.2 |
2217133 |
3.8 |
2402727 |
8.4 |
2602065 |
8.3 |
3. |
NDP at market prices |
1836856 |
3.7 |
1928182 |
5.0 |
1993482 |
3.4 |
2161286 |
8.4 |
2339566 |
8.2 |
4. |
GNP at factor cost |
1841873 |
4.0 |
1952467 |
6.0 |
2030419 |
4.0 |
2203258 |
8.5 |
2367683 |
7.5 |
5. |
NNP at factor cost |
1648018 |
3.7 |
1743998 |
5.8 |
1806734 |
3.6 |
1961817 |
8.6 |
2105184 |
7.3 |
6. |
GNP at market prices |
2008283 |
3.7 |
2116512 |
5.4 |
2199266 |
3.9 |
2383227 |
8.4 |
2580980 |
8.3 |
7. |
NNP at market prices |
1814313 |
3.4 |
1907511 |
5.1 |
1974677 |
3.5 |
2141786 |
8.5 |
2318481 |
8.2 |
8. |
per capita GNP at factor cost |
18074 |
2.2 |
18769 |
3.8 |
19219 |
2.4 |
20553 |
6.9 |
21742 |
5.8 |
9. |
per capita NNP at factor cost |
16173 |
1.8 |
16769 |
3.7 |
17109 |
2.0 |
18301 |
7.0 |
19331 |
5.6 |
II. |
Demand Aggregates |
|
|
|
|
|
|
|
|
|
|
1. |
Total final consumption |
1548909 |
2.8 |
1634234 |
5.5 |
1669920 |
2.2 |
1763745 |
5.6 |
1850690 |
4.9 |
| |
Expenditure |
(76.3) |
|
(76.5) |
|
(75.3) |
|
(73.4) |
|
(71.1) |
|
2. |
Private final consumption |
1293822 |
3.2 |
1373355 |
6.1 |
1409960 |
2.7 |
1497146 |
6.2 |
1574565 |
5.2 |
| |
Expenditure |
(63.7) |
|
(64.3) |
|
(63.6) |
|
(62.3) |
|
(60.5) |
|
3. |
Govt. final consumption |
255087 |
0.9 |
260879 |
2.3 |
259960 |
-0.4 |
266599 |
2.6 |
276125 |
3.6 |
| |
Expenditure |
(12.6) |
|
(12.2) |
|
(11.7) |
|
(11.1) |
|
(10.6) |
|
4. |
Exports of goods |
269241 |
18.2 |
284498 |
5.7 |
346546 |
21.8 |
372356 |
7.4 |
473549 |
27.2 |
| |
& services |
(13.3) |
|
(13.3) |
|
(15.6) |
|
(15.5) |
|
(18.2) |
|
5. |
Imports of goods |
274975 |
3.5 |
284324 |
3.4 |
313775 |
10.4 |
364824 |
16.3 |
445870 |
22.2 |
| |
& services |
(13.5) |
|
(13.3) |
|
(14.2) |
|
(15.2) |
|
(17.1) |
|
6. |
Gross fixed capital |
456380 |
-9.8 |
490009 |
7.4 |
523310 |
6.8 |
594552 |
13.6 |
706906 |
18.9 |
| |
formation |
(22.5) |
|
(22.9) |
|
(23.6) |
|
(24.7) |
|
(27.2) |
|
7. |
Change in stock |
14413 |
|
-1383 |
|
18495 |
|
17012 |
|
40843 |
|
| |
|
(0.7) |
|
-(0.1) |
|
(0.8) |
|
(0.7) |
|
(1.6) |
|
8. |
Valuables |
14256 |
|
13489 |
|
12930 |
|
21541 |
|
33873 |
|
| |
|
(0.7) |
|
(0.6) |
|
(0.6) |
|
(0.9) |
|
(1.3) |
|
9. |
Discrepancies |
2486 |
|
127 |
|
-40848 |
|
11185 |
|
-67869 |
|
| |
|
(0.1) |
|
(0.0) |
|
-(1.8) |
|
(0.5) |
|
-(2.6) |
|
Statement 5b: Select Macroeconomic Aggregates (at constant prices) (Concld.) |
(Amount in Rs. crore and growth rate in per cent) |
Item |
2005-06 |
2006-07 |
2007-08 * |
2008-09 # |
Amount |
Growth Rate |
Amount |
Growth Rate |
Amount |
Growth Rate |
Amount |
Growth Rate |
1 |
10 |
11 |
12 |
13 |
14 |
15 |
16 |
17 |
I. |
Product Aggregates |
|
|
|
|
|
|
|
|
1. |
GDP at factor cost |
2616101 |
9.5 |
2871120 |
9.7 |
3129717 |
9.0 |
3339375 |
6.7 |
2. |
GDP at market prices |
2844942 |
9.3 |
3120031 |
9.7 |
3402716 |
9.1 |
3609425 |
6.1 |
3. |
NDP at market prices |
2557516 |
9.3 |
2803623 |
9.6 |
3052647 |
8.9 |
.. |
.. |
4. |
GNP at factor cost |
2595441 |
9.6 |
2849838 |
9.8 |
3114864 |
9.3 |
3323648 |
6.7 |
5. |
NNP at factor cost |
2308015 |
9.6 |
2533432 |
9.8 |
2764795 |
9.1 |
2941971 |
6.4 |
6. |
GNP at market prices |
2824282 |
9.4 |
3098767 |
9.7 |
3387863 |
9.3 |
.. |
.. |
7. |
NNP at market prices |
2536856 |
9.4 |
2782361 |
9.7 |
3037794 |
9.2 |
.. |
.. |
8. |
Per capita GNP at factor cost |
23467 |
7.9 |
25400 |
8.2 |
27371 |
7.8 |
.. |
.. |
9. |
Per capita NNP at factor cost |
20868 |
8.0 |
22580 |
8.2 |
24295 |
7.6 |
25494 |
4.9 |
II. |
Demand Aggregates |
|
|
|
|
|
|
|
|
1. |
Total Final Consumption |
1980383 |
7.0 |
2102984 |
6.2 |
2277701 |
8.3 |
2400750 |
5.4 |
| |
Expenditure |
(69.6) |
|
(67.4) |
|
(66.9) |
|
(66.5) |
|
2. |
Private Final |
1687118 |
7.1 |
1793691 |
6.3 |
1945668 |
8.5 |
2001488 |
2.9 |
| |
Consumption Expenditure |
(59.3) |
|
(57.5) |
|
(57.2) |
|
(55.5) |
|
3. |
Govt. Final Consumption |
293265 |
6.2 |
309293 |
5.5 |
332033 |
7.4 |
399262 |
20.2 |
| |
Expenditure |
(10.3) |
|
(9.9) |
|
(9.8) |
|
(11.1) |
|
4. |
Exports of goods & services |
556893 |
17.6 |
674670 |
21.1 |
689003 |
2.1 |
777380 |
12.8 |
| |
|
(19.6) |
|
(21.6) |
|
(20.2) |
|
(21.5) |
|
5. |
Imports of goods & services |
628983 |
41.1 |
782976 |
24.5 |
837015 |
6.9 |
986440 |
17.9 |
| |
|
(22.1) |
|
(25.1) |
|
(24.6) |
|
(27.3) |
|
6. |
Gross Fixed Capital Formation |
831470 |
17.6 |
952344 |
14.5 |
1075632 |
12.9 |
1163503 |
8.2 |
| |
|
(29.2) |
|
(30.5) |
|
(31.6) |
|
(32.2) |
|
7. |
Change in stock |
66128 |
|
69673 |
|
105662 |
|
108739 |
|
| |
|
(2.3) |
|
(2.2) |
|
(3.1) |
|
(3.0) |
|
8. |
Valuables |
33140 |
|
38091 |
|
39118 |
|
49859 |
|
| |
|
(1.2) |
|
(1.2) |
|
(1.1) |
|
(1.4) |
|
9. |
Discrepancies |
3597 |
|
65245 |
|
52615 |
|
95634 |
|
| |
|
(0.1) |
|
(2.1) |
|
(1.5) |
|
(2.6) |
|
# : Quick Estimates. * : Revised Estimates. .. : Not Available.
Note : Figures in parentheses are share in GDP at Market Prices
Source : Central Statistical Organisation. |
* Prepared in the Division of National Income, Savings and Flow of Funds of Department of Economic Analysis and Policy, Reserve Bank of India, Mumbai. |