|
by Shivangee Misra, Rajendra Raghumanda and Sanjay Singh^
This article presents the seasonal factors of 79 select monthly indicators from the economic/financial time series covering six broad sectors. COVID-led economic disruptions added extremely high volatility in macro-financial data, necessitating revisiting the seasonal adjustment approach. Different approaches were explored to address this volatility in data and the best-suited approach for seasonal adjustment was adopted. The results suggest that the seasonal variation, compared to the pre-COVID period, has accentuated for vegetable prices, mining, production of primary goods and consumer goods and moderated for production of capital goods, food products and beverages, retail electronic clearing and real time gross settlement.
Introduction
Seasonality in macroeconomic indicators refers to the regular and predictable cyclical patterns exhibited over the course of a year. It is one of the important components of a time series along with the trend, cyclical variations and random fluctuations. Seasonal variations occur due to various factors, such as, climatic conditions, production cycle characteristics, seasonal nature of economic activity, festivals and vacation practices. Seasonal adjustment is the process of removing seasonal and calendar effects from a time series data to capture the underlying long-term trend, cycle and short-run innovations in the series. It allows for a more accurate assessment of economic conditions and helps in making informed decisions. The Reserve Bank has been publishing monthly seasonal factors for a set of major macroeconomic variables since 1980.1
The incidence of COVID-19 pandemic had a devastating effect on the economic situation and added extremely high volatility in macro-financial data which vitiated the regular seasonal adjustment process and hence the seasonal pattern. This forced several countries to revisit the seasonal adjustment approach being used before onset of COVID-19 led disruptions. For example, the Bank of England reduced the scope of regular annual reviews of its seasonally adjusted (SA) series, to allow for more time to assess and estimate the impacts of pandemic on the seasonally adjusted series.2 Against this backdrop, this article explores different approaches including user-defined regressors to control for COVID-19 extremities and identifies the most suitable approach to adjust for the impact of pandemic while carrying out seasonal adjustment and presents updated seasonal factors(SFs) of select economic indicators.
The rest of the article is organised as follows. A review of the major literature, focusing mainly on seasonal adjustment amid pandemic induced disturbances is presented in Section II. The data and methodology followed in the article is presented in Section III. Section IV brings out the analyses of empirical results of seasonal patterns in the indicators based on average monthly seasonal factors. Section V investigates the changes in seasonal pattern by evaluating the latest seasonal factors vis-à-vis pre-COVID factors. Finally, Section VI concludes by summarising inferences from the study.
II. Review of the Major Literature
This section focuses on the literature that has evolved to address the impact of COVID-19 on the seasonality of economic indicators. The US Bureau of Labor Statistics while addressing the seasonal adjustment in nonfarm employment series of the Current Employment Statistics survey for its 2020 Annual Review, split the series into two parts: pre-pandemic and post-pandemic period. For the pre-pandemic period, the seasonal factors were estimated by taking the data till February 2020, whereas, for the post-pandemic period, seasonal factors were calculated by taking into account the entire data including the post pandemic period. As more data became available, for the 2021 Annual Review, it formalised its approach by using additional intervention [using all the three types of outliers - Additive Outlier (AO), Level Shift (LS) and Transitory Change (TC)] to mitigate the effects of the pandemic. The results showed that the three outliers (AO, LS, TC) based treatment performed better in most cases as compared to the normal treatment which included only the AO (Hudson et al., 2022). Tiller et al. (2021) while analysing seasonal adjustment for local unemployment series in 421 metro areas of the US explored several options in terms of the sequence and mix of outlier types allowed in the automated modelling process. The F-adjusted Akaike’s Information Criterion (corrected for sample size) (AICC) was used to select the most parsimonious model. The three outliers - LS, TC, AO based model performed best in over half of the series; if the TC was excluded, the percentage dropped to 19 per cent.
Bogalo et al. (2022) ran a set of simulations contaminating time series with shocks in the trend and seasonal components to emulate the type of shock that the COVID-19 might have created and compared three approaches – projection of the estimated seasonal factors for 2019 in the subsequent months, X-13ARIMA-SEATS3 with outlier detection and a newly introduced non-parametric technique Circulant Singular Spectrum Analysis (CiSSA). They concluded that projecting the estimated seasonality in 2019 in the following months gives the worst results for any of the procedures used for seasonal adjustment. On the contrary, the usual X-13 ARIMA-SEATS with outlier detection seems a better option. Moreover, if the type of shock is a total disruption in seasonality combined with a shock in the trend, the non-parametric CiSSA seems to render better results.
Central Statistics Office, Ireland has used manually identified series of LS outliers for the pandemic period based on expert knowledge of the data and then testing for significance of the outlier at 5 per cent level of significance (Foley, 2021). Australian Bureau of Statistics (ABS) suspended publishing trend estimates during the COVID period. For publishing seasonal factors, if the time series had significant and prolonged impact of COVID, fixed forward factors were adopted (i.e., seasonal factors were fixed for the next twelve months). The concurrent seasonal adjustment was continued only for times series that are not significantly impacted.4
III. Data and Methodology
The macroeconomic series covered in this article include: monetary and banking statistics, price indices, industrial production statistics, service sector indicators, merchandise trade and payment system indicators. As compared to the last edition of this article5, two series viz., production of commercial motor vehicles and sales of commercial motor vehicles were dropped as these series are now available only at quarterly frequency, whereas passenger vehicle sales (wholesale) was added to the list. The complete list of 79 indicators covered under these broad categories is given in Annex Table A1. Seasonal factors, mostly derived for the period April 1994 to March 2023, have been estimated under multiplicative model by using the X13-ARIMA-SEATS software of the US Census Bureau, after configuring it to suit Indian conditions, e.g., incorporating the Diwali and Indian trading day effects.
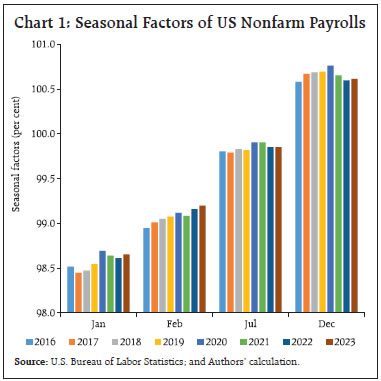
The onset of the pandemic has posed a challenge to the statistical community around the world with a sharp slowdown in economic activity and a gradual recovery impacting the major macroeconomic series. These abrupt changes in the series posed a challenge for seasonal adjustment. The approaches adopted during COVID period such as using the forecasted factors or fixed forward factors6 based on pre-COVID data are a temporary solution at best, as these fail to incorporate the new information becoming available subsequently. While using the data of the COVID period, the seasonal factors can get severely impacted by the COVID led extreme volatility. Therefore, a careful and calibrated approach is needed to make seasonal adjustment based on full sample data. Despite best efforts, one has to understand and appreciate the provisional nature of the seasonal factors, which are unobserved. The permanent impact of COVID on seasonal factors could be assessed satisfactorily only when a few years of post-COVID data become available. For example, in the case of US nonfarm payroll data compiled by the US Labor bureau, the seasonal factors showed variation, especially in the month of July, December and January, the crucial months of first and second waves of COVID-19 pandemic (Chart 1). It clearly depicts the uncertainty in the pandemic period and insufficiency in estimating reliable seasonal factors. Therefore, it becomes important to carefully monitor these developments to better understand the evolving economic landscape during the pandemic. In this article, the seasonal factors were computed after formalising the approach suitable to incorporate the COVID-19 disruptions.
 In order to formalise the approach to be adopted to address the COVID impact, various options have been explored to generate reliable seasonal factors. In the preliminary phase, these approaches/specifications were performed on select macroeconomic indicators and the preferred approach was then applied to the entire set of economic variables.
As the sample period covered in this article includes the COVID period, to avoid the COVID led disturbances muddling the significance of calendar effects, the trading day and holiday effects were tested for significance based on the pre-pandemic data i.e., data till Dec 2019. If found significant, they were included in the model for the alternate specifications covering the full sample period till March 2023.
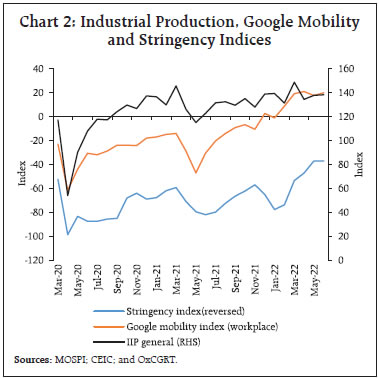
COVID-19 pandemic and the restrictions imposed to contain the pandemic have impacted the economic activity. Sampi et al. (2020) used Google mobility data for nowcasting GDP growth. Cross et al. (2020) used the stringency index to show that government restrictions are a trade-off between economic growth and healthcare. Google mobility and stringency index were found to have an impact in economic activities also in the case of India (Chart 2). Accordingly, drawing from the recent literature related to seasonal adjustment during COVID and a close association between Google mobility and stringency index with economic activities, four different specifications by combining set of outliers with Google mobility and stringency indices as user-defined regressors were explored to address COVID-19 led extreme volatility in data (Table 1).
In order to assess the model performance and select the best approach for further analysis, AICC was observed for all the specifications for 22 major select indicators. A lower AICC value is an indicator of a better fit. In majority of the select indicators, AICC was least under the Specification-2 (AO, LS, TC) as compared to the other three specifications (Table 2). Therefore, the specification-2 has been adopted for carrying out seasonal adjustment of all the economic indicators selected for this study. Test statistics confirm the presence of statistically significant seasonality in the original series, while residual seasonality in all the 79 seasonally adjusted series (by using specification-2) was not statistically significant at the conventional level of significance. Furthermore, the Q-statistics9 for all the series were within the acceptable range of zero to one (Annex, Table A2).
| Table 1: Alternate Specifications Considered |
| Series |
Specification Description |
| Pre-pandemic series |
AO, LS |
| Post-pandemic series |
Specification-1: AO, LS |
| Specification-2: AO, LS, TC |
| Specification-3: AO, LS, GMW |
| Specification-4: AO, LS, Str |
Note: AO: Additive Outlier, LS: Level Shift, TC: Transitory Change,
GMW7: Google Mobility Workplace, Str8: Stringency Index |
| Table 2: AICC |
| Indicator |
pre-COVID |
spec1 |
spec2 |
spec3 |
spec4 |
| Industrial production indices (IIP) |
| IIP Mining |
1296.0 |
1526.6 |
1513.2 |
1533.8 |
1543.8 |
| IIP Manufacturing |
1120.4 |
1327.2 |
1339.8 |
1354.1 |
1356.0 |
| IIP Electricity |
1287.7 |
1586.2 |
1533.6 |
1533.1 |
1603.2 |
| IIP General Index |
1051.7 |
1266.4 |
1266.0 |
1276.5 |
1283.2 |
| IIP Primary goods |
396.0 |
650.7 |
615.2 |
633.9 |
623.3 |
| IIP Capital goods |
501.9 |
765.0 |
732.5 |
752.6 |
732.6 |
| IIP Intermediate goods |
389.3 |
618.8 |
585.5 |
625.7 |
620.2 |
| IIP Infrastructure/ construction goods |
476.0 |
713.2 |
713.2 |
747.9 |
741.4 |
| IIP Consumer durables |
461.3 |
692.0 |
702.5 |
741.8 |
700.4 |
| IIP Consumer non-durables |
473.3 |
753.3 |
745.3 |
748.4 |
755.9 |
| Consumer price indices (CPI) |
| CPI Food & Beverages |
245.9 |
403.4 |
390.7 |
404.8 |
404.2 |
| CPI Clothing & Footwear |
-33.2 |
-5.1 |
-10.1 |
19.7 |
-2.9 |
| CPI Housing |
86.9 |
114.6 |
76.3 |
116.7 |
116.7 |
| CPI Headline |
151.9 |
214.5 |
213.9 |
262.7 |
247.4 |
| CPI Miscellaneous |
65.1 |
133.3 |
120.1 |
130.7 |
133.4 |
| Money supply |
| Broad Money (M3) |
4221.2 |
4942.1 |
4938.5 |
4944.1 |
4943.7 |
| Currency in circulation |
3178.4 |
3785.9 |
3675.9 |
3759.6 |
3746.1 |
| Services sector |
| Port cargo |
1069.0 |
1271.4 |
1260.8 |
1265.1 |
1252.0 |
| Rail freight |
1078.1 |
1271.0 |
1259.4 |
1244.8 |
1280.9 |
| Passenger flown (km)-Domestic |
3667.0 |
4277.3 |
4233.1 |
4270.8 |
4281.6 |
| Passenger flown (km)-International |
3718.8 |
4353.7 |
4277.7 |
4254.8 |
4374.2 |
| Passenger vehicle sales (wholesale) |
3844.0 |
4683.5 |
4681.3 |
4737.1 |
4700.1 |
Note: Cells in bold indicate the lowest AICC amongst specifications 1 to 4 (spec1 to spec4).
Source: Authors’ calculation. |
IV. Analysis of Empirical Results
The macroeconomic variables considered for this study exhibit varied seasonality (Annex, Tables A3 and A4). Out of the 14 major monetary and banking indicators, 10 have recorded peak in the month of March or April (around the financial year closure), whereas majority of the indicators witnessed seasonal troughs during the month of August or December. Bank credit, non-food credit, demand deposits, etc. were at their peak in March, while investments of the banks were at their trough. Among all the monetary and banking indicators, demand deposits registered the highest average seasonal variation in the last ten years (average SF range10 at 9.0) followed by cash in hand and balances with RBI (average SF range at 5.0) and narrow money (average SF range at 4.9). On the other hand, time deposits of scheduled commercial banks (SCBs), recorded the least seasonal variation (average SF range at 1.1) (Annex Tables A4 and A5).
Turning to price statistics, the headline Consumer Price Index (CPI) experiences seasonal upside pressure between July and November, largely driven by the prices of food and beverages, which is in turn driven by the seasonal patterns of vegetable prices. Prices of fruits peak during the summer (April - August) and those of vegetables around the monsoon (July - November) (Chart 3).
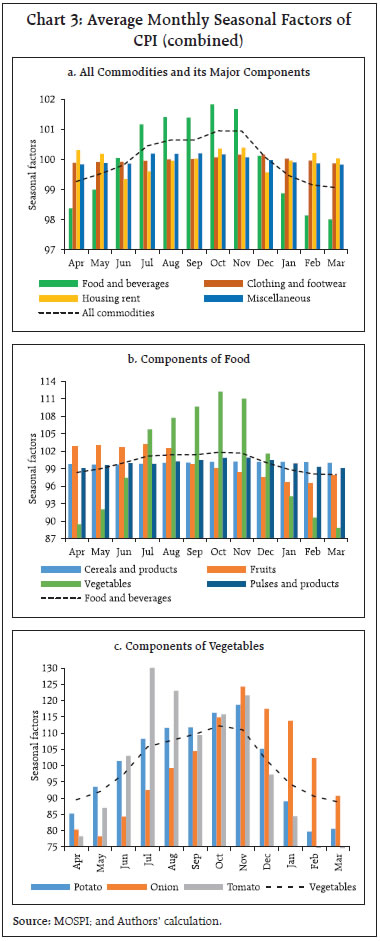 Among the major groups of CPI, food and beverages which account for around 45 per cent share, showed high seasonal variation (average SF range at 3.8) when compared to other components such as clothing & footwear, housing and miscellaneous. Among the sub-groups of food and beverages, CPI vegetables displayed the highest seasonal variation (average SF range at 23.4). Among vegetables, prices of tomatoes, onions and potatoes recorded average SF range of 58.0, 46.1 and 39.0, respectively. Seasonal variation in fruit prices (average SF range of 6.8) was relatively lower than vegetables. The least seasonal variation is observed in series such as non-alcoholic beverages, milk and its products and prepared meals, snacks, sweets (average SF range at 0.3). Further, the seasonal variation in prices of cereals and products (average SF range at 0.6) was lower than that of pulses and products (average SF range at 1.8). Amongst the other major components of CPI, clothing and footwear (weight of 6.5 per cent in the CPI Combined basket) also exhibits low seasonal variation (average SF range at 0.3) (Chart 3).
Expectedly, seasonality in the aggregate CPI series [CPI Combined, CPI for Industrial Workers (CPI-IW), CPI for Agricultural Labourers (CPI-AL) and CPI for Rural Labourers (CPI-RL)] is low while it is pronounced in some of the components, mainly food items. Out of 21 CPI series, 19 registered a seasonal trough around February to May, aligned with the rabi harvest (Annex, Table A4).
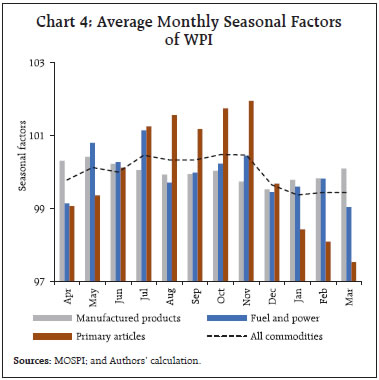
In the wholesale price index (WPI), seasonal troughs were concentrated during the months of December, January and March relative to the scattered distribution of seasonal peaks. Seasonal fluctuations in the WPI-all commodities were largely driven by primary articles, especially food, which have a seasonal pattern similar to CPI-food and beverages. Primary articles recorded the highest seasonal variation (average SF range at 4.4) while the manufactured products which account for the largest share in WPI recorded the lowest seasonal variation (average SF range at 0.9) (Chart 4 and Annex, Tables A5 & A6).
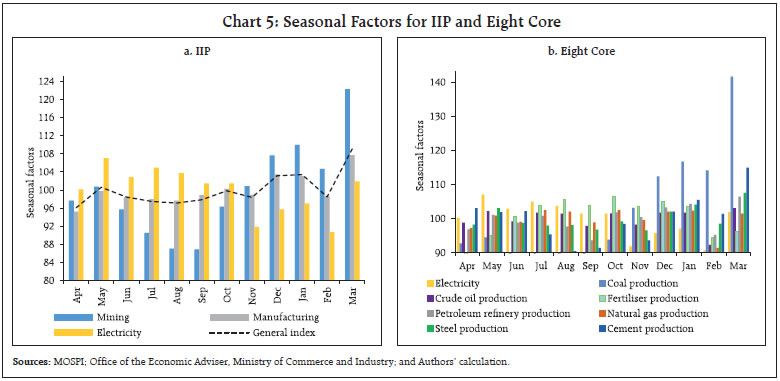
As regards seasonality in output, industrial production is highly seasonal - the index of industrial production (IIP) showed an average SF range of 13.0. Seasonal peaks in the industrial production mostly (14 out of 23 series) occurred in March, the last month of the financial year, which could be due to achieving annual targets; seasonal troughs, on the other hand, were scattered.
Among the major sectors, mining had the highest seasonal variation (average SF range at 35.4) with low activity during monsoon months and peak in March. Manufacturing, which has the maximum share in overall IIP, exhibits seasonal peak in the month of March. Electricity production peaked during the hot summer month of May with seasonal troughs observed during the winter months. Among the components of manufacturing, food products and textiles witnessed seasonal peak in December, whereas beverages peaked during the summer months with high seasonal variation (average SF range of 37.7). Under the use-based classification, all categories observed peak in March except consumer goods. While consumer durables peaked during October reflecting the festival demand, consumer non-durables peaked during the winter month of December. Indicators of eight core industries recorded seasonal peak during March except fertilisers and natural gas. Coal production recorded the highest seasonal variation with SF range at 61.9 mainly driven by high seasonal production in the month of March. Fertiliser production registered a seasonal decline between February to May, which is the harvesting time of rabi crops and a lean season for agricultural activity (Chart 5).
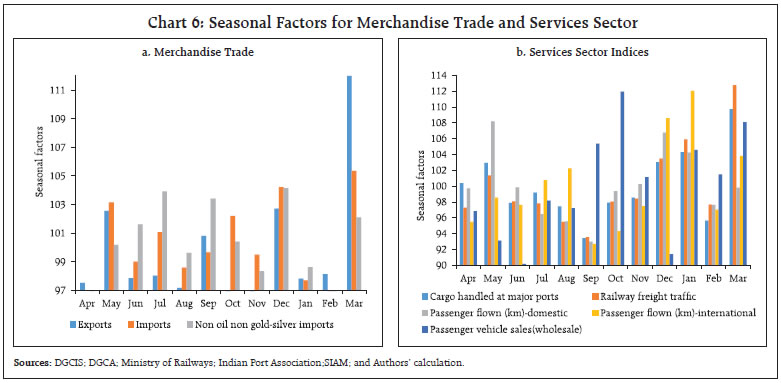
 Four of the five services sector indicators recorded seasonal trough in September. Port cargo traffic and railway freight traffic recorded peak in the month of March, reflecting increased activity at the end of the financial year. In the case of domestic and international passenger traffic, the seasonal peak coincided with the holiday seasons in May and January, respectively. Wholesale passenger vehicle sales recorded seasonal peak in October owing to festival demand. The seasonal variation observed in all the five service sector indicators was broadly similar (average SF range 15.2 - 21.8) (Chart 6).
Merchandise exports recorded a seasonal peak in March, coinciding with the peak in the industrial production. Imports also registered a seasonal peak in March, whereas non-oil non-gold imports peaked in December. Seasonal variation in exports is higher than that of imports (Chart 6).
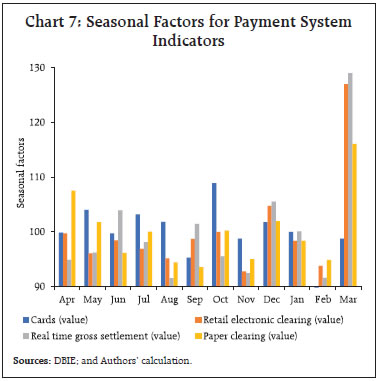
The analysis of payment system indicators shows that Real Time Gross Settlement (RTGS), paper clearing and retail electronic clearance recorded high seasonal variations and peaked during March, indicating heightened usage of online transfers on account of annual financial year closing, whereas the seasonal peak of usage of card payments mode was found to be during October, coinciding with elevated consumption demand around the festival season. The seasonal troughs, on the other hand, were found to be scattered (Chart 7).
V. Has the seasonality changed on account of COVID-19 impact?
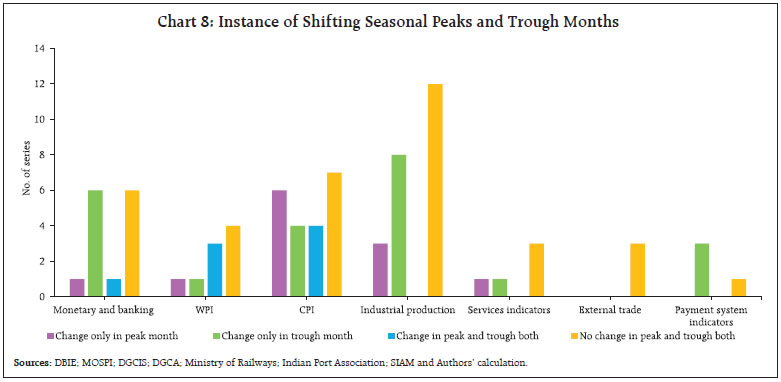
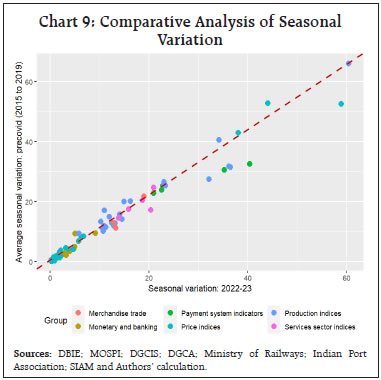
To examine whether the seasonal fluctuations differ from the pre-COVID period or exhibit nearly the same pattern, the seasonal factors for 2022-23 were compared with the average seasonal factors for the last five years of the pre-COVID period (2015 to 2019). Out of 79 indicators, the seasonal peak and trough months remain unchanged for 36 series, whereas 8 series recorded change in both peak and trough months. Out of 8 series which recorded changes in both peak and trough months, 4 were the components of CPI. There were 23 series which experienced change in the trough month, while peak month changed for 12 series. The majority of IIP series did not notice change in both seasonal peak and trough (Chart 8).
 The seasonal peak in CPI-all commodities shifted to November in 2022-23 from October earlier, mainly driven by change in the prices of food and beverages. Convergence in the trough month to November is seen in the case of demand, time and aggregate deposits. Peak month of consumer goods in 2022-23 has aligned with the consumer non-durables in December as against March in the pre-COVID period (Annex, Table A6).
The impact of pandemic on the seasonality of various economic indicators varied by sectors. On the production front, IIP-Mining, production of petroleum refinery, coal production, IIP-Primary good and IIP-Consumer goods recorded an increase in the seasonal variation. Payment system indicators recorded increased seasonal fluctuation in the usage of cards and decreased fluctuation in RTGS and Retail electronic clearing. In the Service sector indicators, passenger flown (international) observed decline in the variation, whereas passenger vehicle sales (wholesale) observed increase in the change in seasonal variation. In merchandise trade, there is an increased variation in exports (Chart 9).
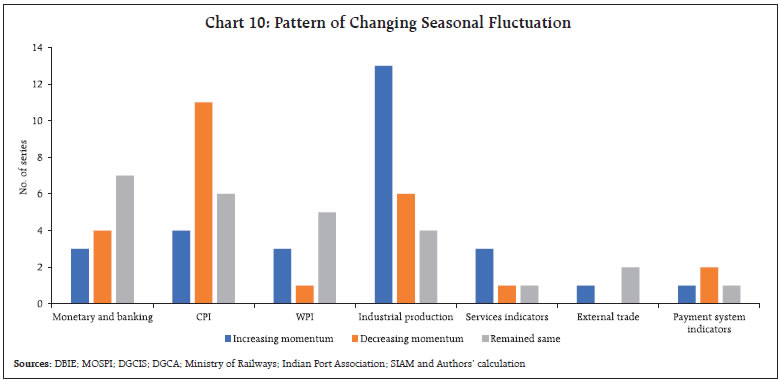
Empirical evidence suggests that seasonal fluctuations became more pronounced for 28 series over longer time horizon of last 10 years while these moderated in another 25 series (Annex, Table A9). Seasonal fluctuations in majority of the monetary and banking aggregates either moderated or remained broadly unchanged during last 10 years. Mining and electricity recorded a rise in seasonal variation. Coal is a major driver for increased seasonal variation in mining activity as rising demand for coal is met by higher production during the active season amid continuing low production during the monsoon season. Although seasonal variation moderated for the majority of CPI-combined elements, retail prices of fruits, meat & fish and that of the vegetables such as onion and potato exhibited rise in seasonal variation. Tomato, on the other hand, witnessed a moderation in seasonal variation. In the wholesale market, prices of manufactured products showed rise in the seasonal variation while the fluctuations in the prices of primary articles and fuel and power, remained unchanged. Freight traffic and exports witnessed a rise in seasonal variation (Chart 10 and Annex, Table A9).
 VI. Conclusion
COVID pandemic induced shocks to the macroeconomic data has made seasonal adjustment a challenge for practitioners. To tackle this in the context of India, different approaches of seasonal adjustment were explored and it was observed that X-13-ARIMA-SEATS method allowing for automatic outlier detection of three kinds of outliers – Additive outlier, Level Shift and Transitory Change is best suited to adjust data amidst the volatility induced by Covid-19 pandemic.
The seasonal variation observed in terms of range in seasonal factors has increased for cash in hand and balances with RBI, production of primary goods, consumer goods, textiles, petroleum products, electricity production, passenger vehicle sales and merchandise exports. Among the series which observed a change in peak/trough month, most have witnessed a change in the trough month. A considerable number of production indices and banking and monetary aggregate indicators have experienced a shift in the trough month. Among banking indicators, bank credit, non-food credit, demand deposits peak in March while investments were at their trough. Driven by the prices of vegetables, CPI witnesses pressures during the monsoon season, i.e., July to November. Prices of fruits touch their highest during summer months. Most items in industrial production peak in March, whereas the production of consumer durables reaches its maximum in October reflecting festival demand. Both exports and imports peak in March, with exports showing high seasonal variation than imports.
References
Bógalo, J., Llada, M., Poncela, P., & Senra, E. (2022). Seasonality in COVID-19 times. Economics Letters, 211, 110206.
Cross, M., Ng, S. K., & Scuffham, P. (2020). Trading health for wealth: the effect of COVID-19 response stringency. International Journal of Environmental Research and Public Health, 17(23), 8725.
Foley, P. (2021). Seasonal adjustment of Irish official statistics during the COVID-19 crisis. Statistical Journal of the IAOS, 37(1), 57-66.
Hudson, N., Mercurio, J., & Kropf, J. (2022). The challenges of seasonal adjustment for the Current Employment Statistics survey during the COVID-19 pandemic. Monthly Labor Review.
Sampi Bravo, J. R. E., & Jooste, C. (2020). Nowcasting economic activity in times of COVID-19: An approximation from the Google Community Mobility Report. World Bank Policy Research Working Paper, (9247).
Tiller, R., Oh, J., & Liu, L. (2021). Adapting the Seasonal Adjustment of Local Area Unemployment Statistics to the COVID-19 Pandemic December.
U.S. Census Bureau (2017). “X-13-ARIMA-SEATS Reference Manual”, Version 1.1, Time Series Research Staff, Center for Statistical Research and Methodology. Available at https://www.census.gov/ts/x13as/docX13AS.pdf
Annex
| Table A1: Time Period Used for Estimating Seasonal Factors |
| Name of Sectors/Variables |
Time Period |
Name of Sectors/Variables |
Time Period |
| Monetary and Banking Indicators (14 series) |
Index of Industrial Production (23 series) |
| A.1.1 Broad Money (M3) |
April 1994 to March 2023 |
E. IIP (Base 2011-12 = 100) General Index |
April 1994 to March 2023 |
| A.1.1.1 Net Bank Credit to Government |
E.1.1 IIP - Primary goods |
April 2012 to March 2023 |
| A.1.1.2 Bank Credit to Commercial Sector |
E.1.2 IIP - Capital goods |
| A.1.2 Narrow Money (M1) |
E.1.3 IIP - Intermediate goods |
| A.1.3 Reserve Money (RM) |
E.1.4 IIP - Infrastructure/ construction goods |
| A.1.3.1 Currency in Circulation |
E.1.5 IIP - Consumer goods |
| A.2.1 Aggregate Deposits (SCBs) |
E.1.5.1 IIP - Consumer durables |
| A.2.1.1 Demand Deposits (SCBs) |
E.1.5.2 IIP - Consumer non-durables |
| A.2.1.2 Time Deposits (SCBs) |
E.2.1 IIP - Mining |
April 1994 to March 2023 |
| A.3.1 Cash in Hand and Balances with RBI (SCBs) |
E.2.2 IIP - Manufacturing |
| A.3.2 Bank Credit (SCBs) |
E.2.2.1 IIP - Manufacture of food products |
April 2012 to March 2023 |
| A.3.2.1 Loans, Cash Credits and Overdrafts (SCBs) |
E.2.2.2 IIP - Manufacture of beverages |
| A.3.2.2 Non-Food Credit (SCBs) |
E.2.2.3 IIP - Manufacture of textiles |
| A.3.3 Investments (SCBs) |
E.2.2.4 IIP - Manufacture of chemicals and chemical products |
| Price Indices[CPI: 21 series and WPI: 9 series] |
E.2.2.5 IIP - Manufacture of motor vehicles, trailers and semi-trailers |
| B. CPI (Base: 2012 = 100) All Commodities |
January 2011 to March 2023 |
E.2.3 IIP - Electricity |
April 1994 to March 2023 |
| B.1 CPI - Food and beverages |
E.3 Cement Production |
April 2004 to March 2023 |
| B.1 .1 CPI - Cereals and products |
E.4 Steel Production |
| B.1 .2 CPI - Meat and fish |
E.5 Coal Production |
| B.1 .3 CPI – Egg |
E.6 Crude Oil Production |
| B.1 .4 CPI - Milk and products |
E.7 Petroleum Refinery Production |
| B.1 .5 CPI – Fruits |
E.8 Fertiliser Production |
| B.1 .6 CPI - Vegetables |
E.9 Natural Gas Production |
| B.1 .6.1 CPI – Potato |
Service sector Indicators (5 series) |
| B.1 .6.2 CPI – Onion |
F.1 Cargo handled at Major Ports |
April 1994 to March 2023 |
| B.1 .6.3 CPI – Tomato |
F.2 Railway Freight Traffic |
| B.1 .7 CPI - Pulses and products |
F.3 Passenger flown (Km) - Domestic |
| B.1 .8 CPI – Spices |
F.4 Passenger flown (Km) - International |
| B.1 .9 CPI - Non-alcoholic beverages |
F.5 Passenger Vehicle Sales (wholesale) |
April 2004 to March 2023 |
| B.1 .10 CPI - Prepared meals, snacks, sweets etc. |
Merchandise Trade (3 series) |
| B.2 CPI - Clothing and footwear |
G.1 Exports |
April 1994 to March 2023 |
| B.3 CPI – Housing |
G.2 Imports |
| B.4 CPI - Miscellaneous |
G.3 Non-Oil Non-Gold Imports |
| C.1 Consumer Price Index for Industrial Workers (Base: 2001=100) |
January 2000 to March 2023 |
Payment System Indicators (4 Series) |
| C.2 Consumer Price Index for Agricultural Labourers (Base: 1986-87=100) |
H.1 Real Time Gross Settlement |
April 2004 to March 2023 |
| C.3 Consumer Price Index for Rural Labourers (Base: 1986- 87=100) |
H.2 Paper Clearing |
April 2005 to March 2023 |
| D. WPI (Base: 2011-12=100) All Commodities |
April 1994 to March 2023 |
H.3 Retail Electronic Clearing |
April 2004 to March 2023 |
| D.1 WPI - Primary Articles |
H.4 Cards |
| D.1.1 WPI - Food Articles |
|
|
| D.2 WPI- Fuel & Power |
|
|
| D.3 WPI-Manufactured Products |
|
|
| D.3.1 WPI - Manufacture of Food Products |
April 2012 to March 2023 |
|
|
| D.3.2 WPI - Manufacture of Chemicals & Chemical Products |
|
|
| D.3.3 WPI - Manufacture of Basic Metals |
|
|
| D.3.4 WPI - Manufacture of Machinery and Equipment |
|
|
| Table A2: Major Diagnostics of all the Indicators (Contd.) |
| Name of variable |
Seasonality in Original Series |
Residual Seasonality |
Quality diagnostics |
| F test p-value |
KW test p-value |
F test p-value |
F test 3 yr p-value |
M7 |
Q |
| A.1.1 Broad Money (M3) |
0.00 |
0.00 |
1.00 |
0.38 |
0.38 |
0.26 |
| A.1.1.1 Net Bank Credit to Government |
0.00 |
0.00 |
1.00 |
0.99 |
0.39 |
0.31 |
| A.1.1.2 Bank Credit to Commercial Sector |
0.00 |
0.00 |
1.00 |
0.99 |
0.33 |
0.23 |
| A.1.2 Narrow Money (M1) |
0.00 |
0.00 |
0.93 |
0.24 |
0.28 |
0.27 |
| A.1.3 Reserve Money (RM) |
0.00 |
0.00 |
0.53 |
0.84 |
0.30 |
0.23 |
| A.1.3.1 Currency in Circulation |
0.00 |
0.00 |
0.52 |
0.99 |
0.20 |
0.16 |
| A.2.1 Aggregate Deposits (SCBs) |
0.00 |
0.00 |
1.00 |
0.93 |
0.59 |
0.38 |
| A.2.1.1 Demand Deposits (SCBs) |
0.00 |
0.00 |
0.98 |
0.78 |
0.49 |
0.54 |
| A.2.1.2 Time Deposits (SCBs) |
0.00 |
0.00 |
1.00 |
0.99 |
0.60 |
0.29 |
| A.3.1 Cash in Hand and Balances with RBI (SCBs) |
0.00 |
0.02 |
0.96 |
1.00 |
1.31 |
0.92 |
| A.3.2 Bank Credit (SCBs) |
0.00 |
0.00 |
1.00 |
1.00 |
0.40 |
0.25 |
| A.3.2.1 Loans, Cash, Credits and Overdrafts (SCBs) |
0.00 |
0.00 |
1.00 |
1.00 |
0.40 |
0.27 |
| A.3.2.2 Non-Food Credit (SCBs) |
0.00 |
0.00 |
1.00 |
1.00 |
0.71 |
0.41 |
| A.3.3 Investments (SCBs) |
0.00 |
0.00 |
0.71 |
1.00 |
0.43 |
0.34 |
| B. CPI (Base: 2012 = 100) All Commodities |
0.00 |
0.00 |
1.00 |
0.98 |
0.25 |
0.29 |
| B.1 CPI - Food and beverages |
0.00 |
0.00 |
1.00 |
0.99 |
0.25 |
0.29 |
| B.1 .1 CPI - Cereals and products |
0.00 |
0.00 |
1.00 |
1.00 |
0.90 |
0.46 |
| B.1 .2 CPI - Meat and fish |
0.00 |
0.00 |
0.88 |
0.56 |
0.45 |
0.46 |
| B.1 .3 CPI - Egg |
0.00 |
0.00 |
1.00 |
1.00 |
0.42 |
0.27 |
| B.1 .4 CPI - Milk and products |
0.00 |
0.00 |
0.99 |
0.95 |
1.44 |
0.68 |
| B.1 .5 CPI - Fruits |
0.00 |
0.00 |
0.98 |
0.81 |
0.35 |
0.30 |
| B.1 .6 CPI - Vegetables |
0.00 |
0.00 |
0.99 |
0.97 |
0.26 |
0.32 |
| B.1 .6.1 CPI - Potato |
0.00 |
0.00 |
1.00 |
0.80 |
0.19 |
0.25 |
| B.1 .6.2 CPI - Onion |
0.00 |
0.00 |
0.50 |
0.50 |
0.62 |
0.50 |
| B.1 .6.3 CPI - Tomato |
0.00 |
0.00 |
1.00 |
0.94 |
0.42 |
0.71 |
| B.1 .7 CPI - Pulses and products |
0.00 |
0.00 |
0.98 |
0.60 |
0.93 |
0.62 |
| B.1 .8 CPI - Spices |
0.00 |
0.00 |
1.00 |
1.00 |
1.32 |
0.69 |
| B.1 .9 CPI - Non-alcoholic beverages |
0.00 |
0.00 |
1.00 |
1.00 |
1.07 |
0.57 |
| B.1 .10 CPI - Prepared meals, snacks, sweets etc. |
0.00 |
0.00 |
0.97 |
0.77 |
1.46 |
0.74 |
| B.2 CPI - Clothing and footwear |
0.00 |
0.00 |
0.98 |
0.97 |
1.12 |
0.66 |
| B.3 CPI - Housing |
0.00 |
0.00 |
0.90 |
0.91 |
0.33 |
0.36 |
| B.4 CPI - Miscellaneous |
0.00 |
0.00 |
1.00 |
0.63 |
0.86 |
0.47 |
| C.1 Consumer Price Index for Industrial Workers (Base: 2001=100) |
0.00 |
0.00 |
1.00 |
0.99 |
0.23 |
0.27 |
| C.2 Consumer Price Index for Agricultural Labourers (Base: 1986-87=100) |
0.00 |
0.00 |
1.00 |
0.98 |
0.26 |
0.31 |
| C.3 Consumer Price Index for Rural Labourers (Base: 1986-87=100) |
0.00 |
0.00 |
1.00 |
0.98 |
0.26 |
0.29 |
| D. WPI (Base: 2011-12=100) All Commodities |
0.00 |
0.00 |
1.00 |
1.00 |
0.47 |
0.44 |
| D.1 WPI- Primary Articles |
0.00 |
0.00 |
1.00 |
1.00 |
0.33 |
0.41 |
| D.1.1 WPI - Food Articles |
0.00 |
0.00 |
1.00 |
1.00 |
0.30 |
0.36 |
| D.2 WPI- Fuel & Power |
0.00 |
0.00 |
1.00 |
1.00 |
1.44 |
0.74 |
| D.3 WPI- Manufactured Products |
0.00 |
0.00 |
1.00 |
1.00 |
0.73 |
0.58 |
| D.3.1 WPI - Manufacture of Food Products |
0.00 |
0.00 |
1.00 |
0.96 |
0.98 |
0.70 |
| D.3.2 WPI - Manufacture of Chemicals & Chemical Products |
0.00 |
0.00 |
1.00 |
1.00 |
1.19 |
0.73 |
| D.3.3 WPI - Manufacture of Basic Metals |
0.00 |
0.00 |
0.99 |
0.98 |
1.02 |
0.63 |
| D.3.4 WPI - Manufacture of Machinery and Equipment |
0.09 |
0.07 |
0.99 |
1.00 |
1.94 |
0.93 |
| Table A2: Major Diagnostics of all the Indicators (Concld.) |
| Name of variable |
Seasonality in Original Series |
Residual Seasonality |
Quality diagnostics |
| F test p-value |
KW test p-value |
F test p-value |
F test 3 yr p-value |
M7 |
Q |
| E. IIP (Base 2011-12 = 100) General Index |
0.00 |
0.00 |
0.26 |
0.32 |
0.16 |
0.24 |
| E.1.1 IIP - Primary goods |
0.00 |
0.00 |
0.25 |
0.44 |
0.31 |
0.81 |
| E.1.2 IIP - Capital goods |
0.00 |
0.00 |
0.29 |
0.13 |
0.32 |
0.49 |
| E.1.3 IIP - Intermediate goods |
0.00 |
0.00 |
0.56 |
0.39 |
0.37 |
0.46 |
| E.1.4 IIP - Infrastructure/ construction goods |
0.00 |
0.00 |
0.26 |
0.25 |
0.46 |
0.56 |
| E.1.5 IIP - Consumer goods |
0.00 |
0.00 |
0.29 |
0.19 |
0.38 |
0.48 |
| E.1.5.1 IIP - Consumer durables |
0.00 |
0.00 |
0.14 |
0.03 |
0.42 |
0.46 |
| E.1.5.2 IIP - Consumer non-durables |
0.00 |
0.00 |
0.61 |
0.66 |
0.39 |
0.70 |
| E.2.1 IIP - Mining |
0.00 |
0.00 |
0.73 |
0.51 |
0.24 |
0.39 |
| E.2.2 IIP - Manufacturing |
0.00 |
0.00 |
0.19 |
0.30 |
0.21 |
0.26 |
| E.2.2.1 IIP - Manufacture of food products |
0.00 |
0.00 |
1.00 |
0.99 |
0.19 |
0.43 |
| E.2.2.2 IIP - Manufacture of beverages |
0.00 |
0.00 |
0.24 |
0.12 |
0.55 |
0.39 |
| E.2.2.3 IIP - Manufacture of textiles |
0.00 |
0.00 |
0.37 |
0.34 |
0.66 |
0.66 |
| E.2.2.4 IIP - Manufacture of chemicals and chemical products |
0.00 |
0.00 |
0.62 |
0.45 |
0.55 |
0.77 |
| E.2.2.5 IIP - Manufacture of motor vehicles, trailers and semi-trailers |
0.00 |
0.00 |
0.29 |
0.13 |
0.51 |
0.60 |
| E.2.3 IIP - Electricity |
0.00 |
0.00 |
0.53 |
0.56 |
0.50 |
0.58 |
| E.3 Cement Production |
0.00 |
0.00 |
0.49 |
0.45 |
0.22 |
0.32 |
| E.4 Steel Production |
0.00 |
0.00 |
0.48 |
0.27 |
0.49 |
0.64 |
| E.5 Coal Production |
0.00 |
0.00 |
0.56 |
0.21 |
0.13 |
0.31 |
| E.6 Crude Oil Production |
0.00 |
0.00 |
0.87 |
0.94 |
0.18 |
0.32 |
| E.7 Petroleum Refinery Production |
0.00 |
0.00 |
0.96 |
0.68 |
0.49 |
0.72 |
| E.8 Fertiliser Production |
0.00 |
0.00 |
0.78 |
0.15 |
0.28 |
0.58 |
| E.9 Natural Gas Production |
0.00 |
0.00 |
0.92 |
1.00 |
0.26 |
0.41 |
| F.1 Cargo handled at Major Ports |
0.00 |
0.00 |
0.93 |
0.81 |
0.31 |
0.52 |
| F.2 Railway Freight Traffic |
0.00 |
0.00 |
0.53 |
0.56 |
0.13 |
0.32 |
| F.3 Passenger flown (Km) - Domestic |
0.00 |
0.00 |
0.21 |
0.22 |
0.30 |
0.32 |
| F.4 Passenger flown (Km) - International |
0.00 |
0.00 |
0.68 |
0.64 |
0.36 |
0.48 |
| F.5 Passenger Vehicle Sales (wholesale) |
0.00 |
0.00 |
0.79 |
0.23 |
0.40 |
0.41 |
| G.1 Exports |
0.00 |
0.00 |
0.75 |
0.70 |
0.37 |
0.54 |
| G.2 Imports |
0.00 |
0.00 |
0.99 |
0.51 |
0.84 |
0.76 |
| G.3 Non-Oil Non-Gold Imports |
0.00 |
0.00 |
0.99 |
0.49 |
0.59 |
0.67 |
| RTGS |
0.00 |
0.00 |
0.18 |
0.41 |
0.36 |
0.42 |
| Paper Clearing |
0.00 |
0.00 |
0.08 |
0.02 |
0.31 |
0.71 |
| REC |
0.00 |
0.00 |
0.68 |
0.17 |
0.55 |
0.43 |
| Cards |
0.00 |
0.00 |
0.05 |
0.04 |
0.43 |
0.39 |
Notes: 1. Test for seasonality in original series: F-test for the presence of seasonality assuming stability and Kruskall and Wallis (KW) test (a nonparametric test for stable seasonality).
2. Test for seasonality in seasonally adjusted series: F-test for the presence of seasonality assuming stability for full sample and for latest 3 years.
3. M7 corresponds to the amount of moving seasonality present relative to the amount of stable seasonality (acceptable range is between 0 and 1). However, M Diagnostics are aggregated in a single quality control indicator - Q, which gives the overall assessment of the adjustment (acceptable range is between 0 and 1). |
| Table A3: No. of Peaks and Troughs Observed Over Different Months |
| Sectors/sub-sectors |
Apr |
May |
Jun |
Jul |
Aug |
Sep |
Oct |
Nov |
Dec |
Jan |
Feb |
Mar |
Total |
| Monetary and Banking |
Peak |
3 |
1 |
1 |
1 |
1 |
|
|
|
|
|
|
7 |
14 |
| Trough |
|
|
|
|
5 |
1 |
1 |
1 |
4 |
|
1 |
1 |
14 |
| CPI |
Peak |
|
|
1 |
2 |
1 |
1 |
4 |
9 |
2 |
1 |
|
|
21 |
| Trough |
3 |
3 |
1 |
|
|
|
|
|
1 |
|
2 |
11 |
21 |
| WPI |
Peak |
|
3 |
1 |
1 |
|
1 |
2 |
1 |
|
|
|
|
9 |
| Trough |
|
|
|
|
|
|
|
|
2 |
3 |
1 |
3 |
9 |
| Industrial Production |
Peak |
|
2 |
|
2 |
|
|
2 |
|
3 |
|
|
14 |
23 |
| Trough |
6 |
|
3 |
|
2 |
3 |
|
3 |
1 |
|
5 |
|
23 |
| Services Indicators |
Peak |
|
1 |
|
|
|
|
1 |
|
|
1 |
|
2 |
5 |
| Trough |
|
|
1 |
|
|
4 |
|
|
|
|
|
|
5 |
| External Trade |
Peak |
|
|
|
|
|
|
|
|
1 |
|
|
2 |
3 |
| Trough |
|
|
|
|
|
|
|
1 |
|
|
2 |
|
3 |
| Payment System Indicators |
Peak |
|
|
|
|
|
|
1 |
|
|
|
|
3 |
4 |
| Trough |
|
|
|
|
1 |
1 |
|
1 |
|
|
1 |
|
4 |
Notes: 1. In general, seasonal peaks and troughs have been decided based on the average seasonal factors of last 10 years.
2. Blank cells indicate no peak or trough observed. |
| Table A4: Average* Monthly Seasonal Factors of Selected Economic Time Series (Contd.) |
| Series/Month |
Apr |
May |
Jun |
Jul |
Aug |
Sep |
Oct |
Nov |
Dec |
Jan |
Feb |
Mar |
| 1 |
2 |
3 |
4 |
5 |
6 |
7 |
8 |
9 |
10 |
11 |
12 |
13 |
| Monetary and Banking Indicators(14 series) |
| A.1.1 Broad Money (M3) |
101.1 |
100.7 |
100.1 |
100.3 |
100.0 |
99.7 |
99.8 |
99.3 |
99.2 |
99.5 |
99.7 |
100.6 |
| A.1.1.1 Net Bank Credit to Government |
101.1 |
100.9 |
100.6 |
101.7 |
101.2 |
99.8 |
99.7 |
99.8 |
98.0 |
99.0 |
99.4 |
99.0 |
| A.1.1.2 Bank Credit to Commercial Sector |
100.8 |
100.2 |
100.0 |
99.6 |
99.0 |
99.4 |
99.3 |
99.4 |
100.1 |
100.1 |
100.4 |
101.8 |
| A.1.2 Narrow Money (M1) |
101.9 |
101.4 |
100.8 |
99.7 |
99.1 |
99.1 |
98.6 |
98.3 |
98.7 |
99.0 |
100.2 |
103.2 |
| A.1.3 Reserve Money (RM) |
101.5 |
101.8 |
101.5 |
100.2 |
99.1 |
98.4 |
98.4 |
98.9 |
99.2 |
99.1 |
99.0 |
102.9 |
| A.1.3.1 Currency in Circulation |
102.6 |
102.7 |
101.9 |
100.2 |
99.1 |
98.1 |
98.3 |
98.7 |
98.8 |
99.3 |
99.9 |
100.4 |
| A.2.1 Aggregate Deposits (SCBs) |
100.8 |
100.2 |
99.9 |
100.2 |
99.8 |
100.2 |
100.0 |
99.6 |
99.6 |
99.7 |
99.6 |
100.4 |
| A.2.1.1 Demand Deposits (SCBs) |
100.7 |
98.6 |
99.4 |
98.2 |
98.1 |
103.0 |
98.6 |
98.6 |
100.3 |
98.5 |
99.1 |
107.1 |
| A.2.1.2 Time Deposits (SCBs) |
100.7 |
100.3 |
99.9 |
100.3 |
99.9 |
100.0 |
100.1 |
99.8 |
99.6 |
99.8 |
99.7 |
100.0 |
| A.3.1 Cash in Hand and Balances with RBI (SCBs) |
100.9 |
100.1 |
102.2 |
100.6 |
100.4 |
100.4 |
99.5 |
100.3 |
101.8 |
97.5 |
97.2 |
98.8 |
| A.3.2 Bank Credit (SCBs) |
100.7 |
100.2 |
100.0 |
99.2 |
98.8 |
99.9 |
99.4 |
99.3 |
100.2 |
100.1 |
100.3 |
101.9 |
| A.3.2.1 Loans, Cash, Credits and Overdrafts (SCBs) |
100.6 |
100.1 |
100.0 |
99.2 |
98.9 |
100.0 |
99.5 |
99.3 |
100.2 |
100.1 |
100.2 |
101.8 |
| A.3.2.2 Non-Food Credit (SCBs) |
100.8 |
100.1 |
100.0 |
99.3 |
98.9 |
100.2 |
99.4 |
99.2 |
100.1 |
100.0 |
100.2 |
102.0 |
| A.3.3 Investments (SCBs) |
99.6 |
100.3 |
100.3 |
101.2 |
101.6 |
101.0 |
100.8 |
100.1 |
98.9 |
98.9 |
99.1 |
98.1 |
| Price Indices [ CPI: 21 series and WPI: 9 series ] |
| B. CPI (Base: 2012 = 100) All Commodities |
99.3 |
99.5 |
99.8 |
100.5 |
100.6 |
100.6 |
100.9 |
100.9 |
100.1 |
99.5 |
99.2 |
99.1 |
| B.1 CPI - Food and beverages |
98.4 |
99.0 |
100.0 |
101.2 |
101.4 |
101.4 |
101.8 |
101.7 |
100.1 |
98.9 |
98.1 |
98.0 |
| B.1 .1 CPI - Cereals and products |
99.8 |
99.7 |
99.7 |
99.8 |
100.0 |
100.1 |
100.2 |
100.2 |
100.2 |
100.2 |
100.1 |
100.0 |
| B.1 .2 CPI - Meat and fish |
99.6 |
101.0 |
102.2 |
101.8 |
100.5 |
99.8 |
99.7 |
99.1 |
98.9 |
99.2 |
98.9 |
98.9 |
| B.1 .3 CPI - Egg |
96.8 |
96.9 |
98.6 |
100.4 |
99.1 |
98.7 |
99.2 |
101.6 |
103.8 |
104.0 |
101.9 |
98.9 |
| B.1 .4 CPI - Milk and products |
99.8 |
100.0 |
100.0 |
100.1 |
100.1 |
100.1 |
100.1 |
100.1 |
100.0 |
99.9 |
99.9 |
99.8 |
| B.1 .5 CPI - Fruits |
102.8 |
103.0 |
102.6 |
103.3 |
102.5 |
99.7 |
99.0 |
98.5 |
97.5 |
96.6 |
96.5 |
97.8 |
| B.1 .6 CPI - Vegetables |
89.5 |
92.0 |
97.4 |
105.8 |
107.8 |
109.7 |
112.2 |
111.1 |
101.6 |
94.3 |
90.6 |
88.8 |
| B.1 .6.1 CPI - Potato |
85.2 |
93.5 |
101.4 |
108.2 |
111.6 |
111.8 |
116.2 |
118.7 |
105.2 |
89.0 |
79.7 |
80.5 |
| B.1 .6.2 CPI - Onion |
80.3 |
78.2 |
84.3 |
92.5 |
99.3 |
104.4 |
114.9 |
124.3 |
117.5 |
113.7 |
102.3 |
90.7 |
| B.1 .6.3 CPI - Tomato |
78.2 |
87.0 |
103.0 |
132.4 |
123.0 |
109.4 |
115.8 |
121.6 |
97.2 |
84.4 |
74.7 |
74.4 |
| B.1 .7 CPI - Pulses and products |
99.1 |
99.6 |
100.0 |
99.8 |
100.3 |
100.5 |
100.9 |
100.9 |
100.5 |
99.9 |
99.3 |
99.1 |
| B.1 .8 CPI - Spices |
99.5 |
99.6 |
99.7 |
100.0 |
100.1 |
100.1 |
100.2 |
100.3 |
100.3 |
100.3 |
100.0 |
99.8 |
| B.1 .9 CPI - Non-alcoholic beverages |
99.9 |
100.0 |
99.9 |
100.0 |
100.0 |
100.1 |
100.0 |
100.1 |
100.1 |
100.0 |
100.0 |
99.9 |
| B.1 .10 CPI - Prepared meals, snacks, sweets etc. |
99.9 |
99.9 |
99.9 |
100.0 |
100.1 |
100.0 |
100.0 |
100.2 |
100.1 |
100.0 |
100.0 |
99.9 |
| B.2 CPI - Clothing and footwear |
99.9 |
99.9 |
99.9 |
100.0 |
100.0 |
100.0 |
100.1 |
100.2 |
100.2 |
100.0 |
100.0 |
99.9 |
| B.3 CPI - Housing |
100.3 |
100.2 |
99.3 |
99.6 |
99.9 |
100.0 |
100.4 |
100.4 |
99.6 |
100.0 |
100.2 |
100.0 |
| B.4 CPI - Miscellaneous |
99.8 |
99.9 |
99.9 |
100.2 |
100.2 |
100.2 |
100.2 |
100.1 |
100.0 |
99.9 |
99.9 |
99.8 |
| C.1 Consumer Price Index for Industrial Workers (Base: 2001=100) |
99.4 |
99.6 |
99.9 |
100.8 |
100.6 |
100.5 |
100.9 |
100.7 |
99.9 |
99.6 |
99.0 |
99.0 |
| C.2 Consumer Price Index for Agricultural Labourers (Base: 1986-87=100) |
99.2 |
99.4 |
99.7 |
100.1 |
100.5 |
100.6 |
101.0 |
101.0 |
100.5 |
99.8 |
99.3 |
99.0 |
| C.3 Consumer Price Index for Rural Labourers (Base: 1986-87=100) |
99.2 |
99.5 |
99.8 |
100.1 |
100.5 |
100.6 |
100.9 |
101.0 |
100.4 |
99.8 |
99.3 |
99.0 |
| D. WPI (Base: 2011-12=100) All Commodities |
99.8 |
100.1 |
100.0 |
100.5 |
100.3 |
100.3 |
100.5 |
100.5 |
99.7 |
99.4 |
99.4 |
99.4 |
| D.1 WPI - Primary Articles |
99.1 |
99.4 |
100.1 |
101.3 |
101.6 |
101.2 |
101.8 |
102.0 |
99.7 |
98.4 |
98.1 |
97.5 |
| D.1.1 WPI - Food Articles |
98.6 |
98.9 |
100.1 |
101.3 |
101.7 |
101.8 |
102.8 |
102.7 |
99.5 |
98.6 |
97.3 |
96.8 |
| D.2 WPI - Fuel & Power |
99.1 |
100.8 |
100.3 |
101.1 |
99.7 |
100.0 |
100.2 |
100.5 |
99.5 |
99.6 |
99.8 |
99.0 |
| D.3 WPI - Manufactured Products |
100.3 |
100.4 |
100.2 |
100.1 |
99.9 |
100.0 |
100.0 |
99.7 |
99.5 |
99.8 |
99.8 |
100.1 |
| D.3.1 WPI - Manufacture of Food Products |
100.2 |
100.2 |
100.3 |
100.2 |
100.5 |
100.6 |
100.2 |
99.9 |
99.6 |
99.5 |
99.3 |
99.4 |
| D.3.2 WPI - Manufacture of Chemicals & Chemical Products |
100.2 |
100.5 |
100.3 |
100.3 |
100.1 |
100.0 |
100.0 |
99.8 |
99.6 |
99.4 |
99.7 |
100.0 |
| D.3.3 WPI - WPI-Manufacture of Basic metals |
100.8 |
101.3 |
100.8 |
99.7 |
99.3 |
99.7 |
99.6 |
99.2 |
98.8 |
99.9 |
100.1 |
100.6 |
| D.3.4 WPI- Manufacture of Machinery and Equipment |
100.1 |
100.1 |
100.1 |
100.0 |
100.0 |
100.1 |
100.1 |
100.1 |
99.9 |
99.8 |
99.9 |
100.0 |
| Table A4: Average* Monthly Seasonal Factors of Selected Economic Time Series (Concld.) |
| Series/Month |
Apr |
May |
Jun |
Jul |
Aug |
Sep |
Oct |
Nov |
Dec |
Jan |
Feb |
Mar |
| 1 |
2 |
3 |
4 |
5 |
6 |
7 |
8 |
9 |
10 |
11 |
12 |
13 |
| Industrial Production (23 series) |
| E. IIP (Base 2011-12 =A51:A72 100) General Index |
96.1 |
100.6 |
98.5 |
97.5 |
97.1 |
97.8 |
99.9 |
98.4 |
103.2 |
103.4 |
98.5 |
109.1 |
| E.1.1 IIP - Primary goods |
98.1 |
102.9 |
99.8 |
98.7 |
96.3 |
94.2 |
98.5 |
97.7 |
102.6 |
104.1 |
96.8 |
110.4 |
| E.1.2 IIP - Capital goods |
89.6 |
97.5 |
100.2 |
95.8 |
96.3 |
102.1 |
97.7 |
97.2 |
101.0 |
99.7 |
101.7 |
120.7 |
| E.1.3 IIP - Intermediate goods |
97.3 |
99.4 |
97.7 |
101.1 |
99.7 |
99.0 |
99.1 |
97.8 |
102.4 |
102.0 |
97.1 |
107.6 |
| E.1.4 IIP - Infrastructure/ construction goods |
98.9 |
102.9 |
100.7 |
98.0 |
97.0 |
95.8 |
99.2 |
95.3 |
101.7 |
103.9 |
99.4 |
107.9 |
| E.1.5 IIP - Consumer goods |
94.6 |
98.2 |
94.3 |
97.5 |
96.4 |
101.0 |
100.6 |
102.8 |
104.8 |
103.7 |
100.2 |
106.1 |
| E.1.5.1 IIP - Consumer durables |
95.7 |
99.2 |
97.4 |
100.3 |
99.2 |
106.0 |
107.3 |
99.0 |
97.2 |
98.4 |
95.9 |
104.0 |
| E.1.5.2 IIP - Consumer non-durables |
94.3 |
97.8 |
96.5 |
96.7 |
96.1 |
97.2 |
96.8 |
100.8 |
108.5 |
106.6 |
102.6 |
106.2 |
| E.2.1 IIP - Mining |
97.7 |
100.8 |
95.8 |
90.5 |
87.1 |
86.9 |
96.3 |
100.8 |
107.7 |
110.0 |
104.7 |
122.3 |
| E.2.2 IIP - Manufacturing |
95.2 |
99.8 |
98.4 |
98.0 |
97.7 |
98.9 |
100.3 |
99.0 |
103.5 |
103.1 |
98.6 |
107.7 |
| E.2.2.1 IIP - Manufacture of food products |
95.4 |
88.6 |
86.2 |
90.9 |
89.1 |
89.5 |
93.9 |
105.1 |
121.5 |
118.7 |
110.9 |
109.6 |
| E.2.2.2 IIP - Manufacture of beverages |
115.4 |
125.1 |
106.9 |
91.9 |
87.8 |
90.9 |
90.1 |
87.4 |
91.9 |
96.6 |
98.8 |
118.1 |
| E.2.2.3 IIP - Manufacture of textiles |
98.5 |
98.9 |
96.4 |
100.4 |
101.4 |
101.0 |
101.0 |
100.1 |
102.7 |
101.2 |
96.5 |
102.1 |
| E.2.2.4 IIP - Manufacture of chemicals and chemical products |
94.8 |
100.3 |
99.7 |
104.3 |
102.2 |
101.3 |
100.5 |
97.9 |
101.1 |
101.0 |
93.4 |
103.3 |
| E.2.2.5 IIP - Manufacture of motor vehicles, trailers and semi- trailers |
99.7 |
100.1 |
96.9 |
100.3 |
98.7 |
100.1 |
101.6 |
99.7 |
93.9 |
100.5 |
100.7 |
108.3 |
| E.2.3 IIP - Electricity |
100.2 |
107.0 |
102.9 |
105.0 |
103.7 |
101.5 |
101.5 |
91.9 |
95.7 |
97.1 |
90.7 |
101.9 |
| E.3 Cement Production |
103.1 |
101.9 |
102.2 |
95.4 |
90.5 |
91.4 |
98.5 |
93.6 |
102.0 |
105.5 |
101.4 |
114.9 |
| E.4 Steel Production |
98.2 |
103.1 |
98.7 |
97.9 |
98.1 |
96.8 |
99.2 |
96.5 |
102.1 |
104.1 |
98.5 |
107.6 |
| E.5 Coal Production |
92.8 |
94.5 |
89.3 |
81.9 |
79.7 |
80.3 |
93.8 |
103.2 |
112.3 |
116.7 |
114.1 |
141.7 |
| E.6 Crude Oil Production |
98.8 |
102.2 |
99.2 |
101.8 |
101.4 |
97.9 |
101.5 |
98.3 |
101.7 |
101.7 |
92.3 |
103.1 |
| E.7 Petroleum Refinery Production |
96.9 |
101.1 |
98.8 |
100.8 |
97.6 |
93.6 |
101.8 |
100.4 |
103.3 |
104.3 |
95.2 |
106.4 |
| E.8 Fertiliser Production |
81.9 |
95.0 |
100.6 |
103.8 |
105.5 |
103.7 |
106.5 |
103.7 |
105.0 |
103.5 |
94.5 |
96.1 |
| E.9 Natural Gas Production |
97.3 |
100.9 |
99.0 |
102.5 |
102.1 |
98.9 |
102.5 |
99.5 |
102.0 |
102.3 |
91.4 |
101.5 |
| Service Sector Indicators (5 series) |
| F.1 Cargo handled at Major Ports |
100.4 |
102.9 |
97.9 |
99.2 |
97.4 |
93.4 |
97.9 |
98.5 |
103.0 |
104.3 |
95.7 |
109.7 |
| F.2 Railway Freight Traffic |
97.3 |
101.4 |
98.1 |
97.8 |
95.5 |
93.6 |
98.1 |
98.4 |
103.5 |
105.9 |
97.7 |
112.8 |
| F.3 Passenger flown (Km) - Domestic |
99.7 |
108.2 |
99.8 |
96.5 |
95.5 |
93.0 |
99.4 |
100.3 |
106.8 |
104.2 |
97.6 |
99.8 |
| F.4 Passenger flown (Km) - International |
95.5 |
98.6 |
97.6 |
100.8 |
102.3 |
92.7 |
94.3 |
97.5 |
108.6 |
112.0 |
97.0 |
103.8 |
| F.5 Passenger Vehicle Sales (wholesale) |
96.8 |
93.1 |
90.2 |
98.2 |
97.2 |
105.4 |
112.0 |
101.1 |
91.4 |
104.6 |
101.5 |
108.1 |
| Merchandise Trade (3 series) |
| G.1 Exports |
97.5 |
102.6 |
97.8 |
98.0 |
97.2 |
100.8 |
96.5 |
95.2 |
102.7 |
97.8 |
98.1 |
115.6 |
| G.2 Imports |
97.0 |
103.2 |
99.0 |
101.1 |
98.6 |
99.6 |
102.2 |
99.5 |
104.2 |
97.7 |
92.8 |
105.4 |
| G.3 Non-Oil Non-Gold Imports |
96.5 |
100.2 |
101.6 |
103.9 |
99.6 |
103.4 |
100.4 |
98.3 |
104.1 |
98.6 |
91.2 |
102.1 |
| Payment System Indicators (4 series) |
| H.1 RTGS |
94.9 |
96.2 |
103.9 |
98.1 |
91.5 |
101.5 |
95.5 |
92.4 |
105.5 |
100.1 |
91.6 |
129.0 |
| H.2 Paper Clearing |
107.5 |
101.8 |
96.2 |
100.0 |
94.4 |
93.5 |
100.2 |
95.0 |
101.9 |
98.3 |
94.8 |
116.1 |
| H.3 REC |
99.7 |
96.0 |
98.4 |
96.9 |
95.1 |
98.7 |
100.0 |
92.8 |
104.7 |
98.3 |
93.7 |
127.0 |
| H.4 Cards |
99.8 |
104.0 |
99.7 |
103.1 |
101.8 |
95.3 |
108.9 |
98.8 |
101.7 |
100.0 |
87.6 |
98.7 |
| *: Average of last ten years’ monthly seasonal factors, in general. Here, the average monthly seasonal factors have been computed on the basis of last 10 years (i.e., April 2013 to March 2023). Numbers marked in ‘bold’ are peaks and troughs of respective series. |
| Table A5: Range (Difference Between Peak and Trough) of Seasonal Factors (Contd.) |
| Series/Year |
2013-14 |
2014-15 |
2015-16 |
2016-17 |
2017-18 |
2018-19 |
2019-20 |
2020-21 |
2021-22 |
2022-23 |
Average Range |
| 1 |
2 |
3 |
4 |
5 |
6 |
7 |
8 |
9 |
10 |
11 |
12 |
| Monetary and Banking Indicators(14 series) |
| A.1.1 Broad Money (M3) |
1.8 |
1.9 |
2.0 |
2.2 |
2.3 |
2.2 |
2.1 |
1.8 |
1.7 |
1.7 |
1.9 |
| A.1.1.1 Net Bank Credit to Government |
3.7 |
3.7 |
3.8 |
4.0 |
4.0 |
4.1 |
4.0 |
3.7 |
3.4 |
3.5 |
3.7 |
| A.1.1.2 Bank Credit to Commercial Sector |
2.9 |
2.9 |
2.9 |
3.1 |
3.2 |
3.2 |
3.0 |
2.8 |
2.6 |
2.4 |
2.9 |
| A.1.2 Narrow Money (M1) |
3.8 |
3.9 |
4.3 |
4.9 |
5.6 |
5.9 |
5.9 |
5.6 |
5.3 |
5.0 |
4.9 |
| A.1.3 Reserve Money (RM) |
4.4 |
4.7 |
4.9 |
4.9 |
4.8 |
4.7 |
4.5 |
4.3 |
4.1 |
4.1 |
4.5 |
| A.1.3.1 Currency in Circulation |
5.0 |
5.0 |
5.0 |
5.0 |
5.0 |
4.7 |
4.4 |
4.1 |
4.0 |
4.1 |
4.6 |
| A.2.1 Aggregate Deposits (SCBs) |
1.6 |
1.3 |
1.1 |
1.1 |
1.2 |
1.3 |
1.2 |
1.2 |
1.3 |
1.4 |
1.2 |
| A.2.1.1 Demand Deposits (SCBs) |
5.0 |
5.6 |
7.3 |
9.5 |
11.5 |
12.2 |
11.8 |
10.7 |
9.8 |
9.5 |
9.0 |
| A.2.1.2 Time Deposits (SCBs) |
1.6 |
1.3 |
1.1 |
1.0 |
1.0 |
1.0 |
1.1 |
1.0 |
1.0 |
1.1 |
1.1 |
| A.3.1 Cash in Hand and Balances with RBI (SCBs) |
5.7 |
4.5 |
4.9 |
5.4 |
5.6 |
6.1 |
6.8 |
7.1 |
8.2 |
9.4 |
5.0 |
| A.3.2 Bank Credit (SCBs) |
2.6 |
2.6 |
2.8 |
3.1 |
3.4 |
3.5 |
3.4 |
3.2 |
2.9 |
2.8 |
3.0 |
| A.3.2.1 Loans, Cash, Credits and Overdrafts (SCBs) |
2.5 |
2.5 |
2.7 |
3.0 |
3.3 |
3.3 |
3.2 |
2.9 |
2.7 |
2.6 |
2.9 |
| A.3.2.2 Non-Food Credit (SCBs) |
2.6 |
2.5 |
3.0 |
3.5 |
3.8 |
3.9 |
3.5 |
3.1 |
2.6 |
2.2 |
3.0 |
| A.3.3 Investments (SCBs) |
4.2 |
3.9 |
3.7 |
3.7 |
3.6 |
3.5 |
3.3 |
3.4 |
3.5 |
3.6 |
3.5 |
| Price Indices [ CPI: 21 series and WPI: 9 series ] |
| B. CPI (Base: 2012 = 100) All Commodities |
2.1 |
2.0 |
1.9 |
1.8 |
1.8 |
1.9 |
1.9 |
2.0 |
2.0 |
2.0 |
1.9 |
| B.1 CPI - Food and beverages |
4.1 |
4.0 |
3.8 |
3.7 |
3.5 |
3.6 |
3.8 |
4.0 |
4.0 |
4.1 |
3.8 |
| B.1 .1 CPI - Cereals and products |
0.8 |
0.7 |
0.7 |
0.7 |
0.6 |
0.6 |
0.5 |
0.5 |
0.5 |
0.6 |
0.6 |
| B.1 .2 CPI - Meat and fish |
3.2 |
3.2 |
3.2 |
3.1 |
3.1 |
3.4 |
3.6 |
3.9 |
4.3 |
4.5 |
3.3 |
| B.1 .3 CPI - Egg |
7.8 |
7.3 |
7.0 |
6.8 |
6.6 |
6.7 |
6.9 |
7.5 |
8.0 |
8.4 |
7.3 |
| B.1 .4 CPI - Milk and products |
0.7 |
0.7 |
0.6 |
0.5 |
0.3 |
0.2 |
0.2 |
0.2 |
0.2 |
0.2 |
0.3 |
| B.1 .5 CPI - Fruits |
6.4 |
6.3 |
6.2 |
6.2 |
6.2 |
6.5 |
6.9 |
7.4 |
7.8 |
8.1 |
6.8 |
| B.1 .6 CPI - Vegetables |
24.2 |
23.8 |
22.8 |
22.2 |
21.9 |
22.8 |
24.0 |
25.2 |
25.5 |
25.4 |
23.4 |
| B.1 .6.1 CPI - Potato |
36.2 |
36.1 |
36.4 |
36.7 |
37.5 |
39.0 |
40.6 |
41.9 |
42.8 |
43.0 |
39.0 |
| B.1 .6.2 CPI - Onion |
39.7 |
37.8 |
36.9 |
38.8 |
42.9 |
48.5 |
53.3 |
55.1 |
54.7 |
52.8 |
46.1 |
| B.1 .6.3 CPI - Tomato |
63.3 |
62.7 |
61.4 |
60.1 |
59.2 |
57.8 |
56.6 |
55.6 |
54.2 |
52.6 |
58.0 |
| B.1 .7 CPI - Pulses and products |
2.9 |
2.8 |
2.6 |
2.3 |
1.9 |
1.5 |
1.2 |
1.1 |
1.3 |
1.4 |
1.8 |
| B.1 .8 CPI - Spices |
1.4 |
1.3 |
1.2 |
1.1 |
1.0 |
0.8 |
0.7 |
0.5 |
0.4 |
0.3 |
0.8 |
| B.1 .9 CPI - Non-alcoholic beverages |
0.4 |
0.4 |
0.3 |
0.3 |
0.2 |
0.3 |
0.3 |
0.3 |
0.3 |
0.3 |
0.3 |
| B.1 .10 CPI - Prepared meals, snacks, sweets etc. |
0.6 |
0.6 |
0.5 |
0.4 |
0.4 |
0.3 |
0.2 |
0.2 |
0.3 |
0.3 |
0.3 |
| B.2 CPI - Clothing and footwear |
0.6 |
0.5 |
0.4 |
0.4 |
0.4 |
0.4 |
0.3 |
0.2 |
0.2 |
0.2 |
0.3 |
| B.3 CPI - Housing |
1.0 |
1.0 |
1.0 |
1.1 |
1.2 |
1.1 |
1.1 |
1.1 |
1.0 |
1.0 |
1.0 |
| B.4 CPI - Miscellaneous |
0.7 |
0.6 |
0.5 |
0.4 |
0.4 |
0.3 |
0.3 |
0.4 |
0.4 |
0.4 |
0.4 |
| C.1 Consumer Price Index for Industrial Workers (Base: 2001=100) |
2.3 |
2.3 |
2.3 |
2.2 |
2.0 |
1.8 |
1.7 |
1.8 |
1.8 |
1.8 |
1.9 |
| C.2 Consumer Price Index for Agricultural Labourers (Base: 1986-87=100) |
2.5 |
2.5 |
2.4 |
2.2 |
2.0 |
2.0 |
1.9 |
1.9 |
1.9 |
1.9 |
2.1 |
| C.3 Consumer Price Index for Rural Labourers (Base: 1986-87=100) |
2.4 |
2.4 |
2.2 |
2.0 |
1.9 |
1.8 |
1.8 |
1.8 |
1.8 |
1.8 |
2.0 |
| D. WPI (Base: 2011-12=100) All Commodities |
1.5 |
1.6 |
1.5 |
1.4 |
1.2 |
1.1 |
1.1 |
1.1 |
1.1 |
1.1 |
1.1 |
| D.1 WPI - Primary Articles |
4.7 |
4.9 |
5.0 |
4.8 |
4.7 |
4.9 |
4.9 |
4.8 |
4.5 |
4.2 |
4.4 |
| D.1.1 WPI - Food Articles |
5.5 |
5.6 |
5.5 |
5.5 |
5.8 |
6.3 |
6.5 |
6.8 |
6.9 |
6.8 |
6.0 |
| D.2 WPI - Fuel & Power |
2.5 |
2.9 |
3.0 |
2.6 |
2.0 |
1.6 |
1.4 |
1.9 |
2.5 |
3.2 |
2.1 |
| D.3 WPI - Manufactured Products |
0.8 |
0.8 |
0.7 |
0.6 |
0.6 |
0.7 |
0.9 |
1.1 |
1.3 |
1.5 |
0.9 |
| D.3.1 WPI - Manufacture of Food Products |
1.9 |
1.7 |
1.5 |
1.3 |
1.2 |
1.2 |
1.3 |
1.4 |
1.6 |
2.0 |
1.3 |
| D.3.2 WPI - Manufacture of Chemicals & Chemical Products |
1.5 |
1.3 |
1.0 |
1.0 |
1.0 |
1.0 |
1.1 |
1.4 |
1.6 |
1.7 |
1.2 |
| D.3.3 WPI - Manufacture of Basic Metals |
1.5 |
1.6 |
1.8 |
2.0 |
2.2 |
2.4 |
2.8 |
3.2 |
3.5 |
3.7 |
2.4 |
| D.3.4 WPI- Manufacture of Machinery And Equipment |
0.8 |
0.7 |
0.5 |
0.4 |
0.3 |
0.2 |
0.4 |
0.5 |
0.5 |
0.5 |
0.3 |
| Table A5: Range (Difference Between Peak and Trough) of Seasonal Factors (Concld.) |
| Series/Year |
2013-14 |
2014-15 |
2015-16 |
2016-17 |
2017-18 |
2018-19 |
2019-20 |
2020-21 |
2021-22 |
2022-23 |
Average Range |
| 1 |
2 |
3 |
4 |
5 |
6 |
7 |
8 |
9 |
10 |
11 |
12 |
| Industrial Production (23 series) |
| E. IIP (Base 2011-12 = 100) General Index |
12.7 |
12.7 |
12.8 |
13.0 |
13.3 |
13.4 |
13.3 |
13.2 |
13.0 |
12.8 |
13.0 |
| E.1.1 IIP - Primary goods |
13.3 |
13.5 |
13.9 |
14.4 |
15.4 |
16.5 |
17.6 |
18.5 |
19.5 |
20.0 |
16.2 |
| E.1.2 IIP - Capital goods |
37.8 |
36.1 |
34.4 |
32.1 |
30.5 |
29.1 |
28.3 |
27.8 |
27.5 |
27.5 |
31.1 |
| E.1.3 IIP - Intermediate goods |
10.7 |
10.9 |
10.9 |
10.8 |
10.9 |
10.8 |
10.6 |
10.5 |
10.3 |
10.1 |
10.5 |
| E.1.4 IIP - Infrastructure/ construction goods |
12.0 |
12.3 |
12.7 |
13.0 |
13.3 |
13.6 |
13.7 |
13.5 |
13.1 |
12.9 |
12.6 |
| E.1.5 IIP - Consumer goods |
12.7 |
12.4 |
12.1 |
11.5 |
11.2 |
11.7 |
12.2 |
13.3 |
14.3 |
14.9 |
11.8 |
| E.1.5.1 IIP - Consumer durables |
13.9 |
13.5 |
12.8 |
11.8 |
11.0 |
11.2 |
11.2 |
11.3 |
11.3 |
11.5 |
11.6 |
| E.1.5.2 IIP - Consumer non-durables |
14.1 |
13.0 |
13.0 |
13.5 |
14.2 |
14.7 |
15.2 |
15.5 |
15.7 |
15.7 |
14.3 |
| E.2.1 IIP - Mining |
30.4 |
31.1 |
32.0 |
33.1 |
35.1 |
36.8 |
38.3 |
39.1 |
39.9 |
40.5 |
35.4 |
| E.2.2 IIP - Manufacturing |
12.7 |
12.6 |
12.6 |
12.6 |
12.8 |
12.8 |
12.6 |
12.3 |
12.1 |
12.0 |
12.5 |
| E.2.2.1 IIP - Manufacture of food products |
36.5 |
36.2 |
36.2 |
36.6 |
36.7 |
36.3 |
35.2 |
34.3 |
32.8 |
31.7 |
35.3 |
| E.2.2.2 IIP - Manufacture of beverages |
54.3 |
51.3 |
45.9 |
39.6 |
34.9 |
32.0 |
30.7 |
30.6 |
30.7 |
31.5 |
37.7 |
| E.2.2.3 IIP - Manufacture of textiles |
8.3 |
7.4 |
6.4 |
5.3 |
5.4 |
6.6 |
7.7 |
8.5 |
9.0 |
9.3 |
6.2 |
| E.2.2.4 IIP - Manufacture of chemicals and chemical products |
11.1 |
10.9 |
10.6 |
11.3 |
11.6 |
11.3 |
10.7 |
11.4 |
11.6 |
11.9 |
10.9 |
| E.2.2.5 IIP - Manufacture of motor vehicles, trailers and semi-trailers |
13.2 |
13.9 |
14.8 |
15.1 |
15.3 |
14.9 |
14.6 |
14.0 |
14.1 |
14.1 |
14.4 |
| E.2.3 IIP - Electricity |
12.4 |
13.5 |
14.6 |
15.8 |
17.0 |
17.9 |
18.4 |
19.0 |
19.9 |
20.2 |
16.4 |
| E.3 Cement Production |
23.4 |
22.5 |
22.4 |
22.9 |
24.1 |
25.4 |
26.3 |
26.4 |
25.9 |
25.3 |
24.5 |
| E.4 Steel Production |
10.1 |
9.7 |
9.6 |
10.2 |
11.0 |
12.0 |
12.9 |
13.2 |
13.2 |
13.3 |
11.0 |
| E.5 Coal Production |
55.0 |
55.1 |
56.6 |
59.1 |
62.4 |
65.2 |
66.8 |
67.2 |
66.8 |
66.0 |
61.9 |
| E.6 Crude Oil Production |
10.2 |
10.3 |
10.5 |
10.6 |
10.8 |
10.8 |
10.9 |
11.0 |
11.1 |
11.2 |
10.8 |
| E.7 Petroleum Refinery Production |
10.8 |
10.4 |
9.8 |
10.1 |
11.0 |
12.5 |
14.2 |
15.6 |
16.8 |
17.1 |
12.8 |
| E.8 Fertiliser Production |
27.2 |
26.4 |
24.5 |
22.8 |
22.4 |
22.7 |
23.6 |
24.8 |
25.8 |
26.5 |
24.6 |
| E.9 Natural Gas Production |
10.8 |
10.9 |
10.8 |
11.0 |
11.2 |
11.4 |
11.5 |
11.8 |
11.7 |
11.8 |
11.1 |
| Service Sector Indicators (5 series) |
| F.1 Cargo handled at Major Ports |
14.8 |
14.9 |
15.5 |
15.8 |
16.3 |
16.7 |
17.0 |
17.2 |
17.3 |
17.5 |
16.3 |
| F.2 Railway Freight Traffic |
18.7 |
18.2 |
18.0 |
18.2 |
18.9 |
19.4 |
19.9 |
20.1 |
20.3 |
20.4 |
19.2 |
| F.3 Passenger flown (Km) - Domestic |
22.2 |
19.7 |
17.3 |
15.0 |
13.1 |
12.2 |
12.0 |
12.8 |
13.7 |
14.5 |
15.2 |
| F.4 Passenger flown (Km) - International |
19.0 |
19.5 |
20.1 |
20.5 |
21.1 |
20.9 |
20.4 |
19.2 |
18.3 |
17.2 |
19.3 |
| F.5 Passenger Vehicle Sales (wholesale) |
21.3 |
18.6 |
18.4 |
19.2 |
20.4 |
23.0 |
24.7 |
25.7 |
25.6 |
24.7 |
21.8 |
| Merchandise Trade (3 series) |
| G.1 Exports |
20.6 |
18.9 |
18.1 |
18.2 |
19.9 |
21.2 |
21.8 |
21.9 |
22.2 |
21.7 |
20.4 |
| G.2 Imports |
11.6 |
12.8 |
13.7 |
13.7 |
13.5 |
13.0 |
13.0 |
12.6 |
11.9 |
11.2 |
12.6 |
| G.3 Non-Oil Non-Gold Imports |
12.5 |
12.7 |
13.2 |
13.4 |
13.3 |
13.1 |
13.0 |
13.1 |
13.0 |
13.0 |
13.0 |
| Payment System Indicators (4 series) |
| RTGS |
47.0 |
44.6 |
42.8 |
40.7 |
38.8 |
37.0 |
35.2 |
33.3 |
33.0 |
32.5 |
37.5 |
| Paper Clearing |
25.7 |
24.3 |
23.1 |
22.2 |
22.3 |
22.2 |
22.0 |
22.6 |
23.5 |
23.9 |
22.5 |
| REC |
35.5 |
36.5 |
36.9 |
36.6 |
35.9 |
35.0 |
33.6 |
31.9 |
30.9 |
30.6 |
34.2 |
| Cards |
19.3 |
19.6 |
20.1 |
20.4 |
21.1 |
21.8 |
22.5 |
22.7 |
22.9 |
22.8 |
21.3 |
| Note: Average seasonal factor range is the range of average seasonal factors for last ten years; range is calculated as the difference between maximum and minimum of monthly seasonal factors. |
| Table A6: Change in Seasonal Peaks and Troughs in 2022-23 vis-à-vis previous 5-years of Pre-Covid (2015-2019) (Contd.) |
| Series |
Based on SF of Pre-Covid (2015 to 2019) |
Based on SF of 2022-23 |
| Peak Month |
Peak Value |
Trough Month |
Trough Value |
Peak Month |
Peak Value |
Trough Month |
Trough Value |
| Monetary and Banking Indicators(14 series) |
| A.1.1 Broad Money (M3) |
Apr |
101.2 |
Dec |
99 |
Apr |
100.9 |
Nov |
99.2 |
| A.1.1.1 Net Bank Credit to Government |
Jul |
101.8 |
Dec |
97.8 |
Apr |
101.8 |
Dec |
98.3 |
| A.1.1.2 Bank Credit to Commercial Sector |
Mar |
101.9 |
Aug |
98.9 |
Mar |
101.6 |
Aug |
99.2 |
| A.1.2 Narrow Money (M1) |
Mar |
103.2 |
Nov |
98.2 |
Mar |
103.1 |
Nov |
98 |
| A.1.3 Reserve Money (RM) |
Mar |
103.2 |
Oct |
98.4 |
Mar |
102.3 |
Sep |
98.2 |
| A.1.3.1 Currency in Circulation |
May |
102.8 |
Sep |
98 |
May |
102.5 |
Sep |
98.3 |
| A.2.1 Aggregate Deposits (SCBs) |
Apr |
100.7 |
Feb |
99.6 |
Apr |
100.8 |
Nov |
99.4 |
| A.2.1.1 Demand Deposits (SCBs) |
Mar |
106.9 |
Aug |
97.8 |
Mar |
107.1 |
Nov |
97.6 |
| A.2.1.2 Time Deposits (SCBs) |
Apr |
100.6 |
Dec |
99.5 |
Apr |
100.7 |
Nov |
99.6 |
| A.3.1 Cash in Hand and Balances with RBI (SCBs) |
Dec |
102.6 |
Jan |
97.5 |
Jul |
104.6 |
Feb |
95.2 |
| A.3.2 Bank Credit (SCBs) |
Mar |
102.0 |
Aug |
98.9 |
Mar |
101.6 |
Aug |
98.8 |
| A.3.2.1 Loans, Cash Credits and Overdrafts (SCBs) |
Mar |
101.9 |
Aug |
98.9 |
Mar |
101.4 |
Aug |
98.8 |
| A.3.2.2 Non-Food Credit (SCBs) |
Mar |
102.2 |
Aug |
98.9 |
Mar |
101.3 |
Aug |
99.1 |
| A.3.3 Investments (SCBs) |
Aug |
101.5 |
Mar |
97.8 |
Aug |
101.7 |
Jan |
98.2 |
| Price Indices [ CPI: 21 series and WPI: 9 series ] |
| B. CPI (Base: 2012 = 100) All Commodities |
Oct |
100.9 |
Mar |
99.1 |
Nov |
101.1 |
Mar |
99.1 |
| B.1 CPI - Food and beverages |
Oct |
101.7 |
Mar |
98 |
Nov |
102.1 |
Mar |
98 |
| B.1 .1 CPI - Cereals and products |
Nov |
100.3 |
May |
99.7 |
Nov |
100.2 |
Jun |
99.7 |
| B.1 .2 CPI - Meat and fish |
Jun |
102.2 |
Dec |
99 |
Jun |
102.7 |
Feb |
98.2 |
| B.1 .3 CPI - Egg |
Jan |
103.8 |
Apr |
96.9 |
Jan |
104.6 |
Apr |
96.2 |
| B.1 .4 CPI - Milk and products |
Aug |
100.2 |
Mar |
99.8 |
Sep |
100.1 |
Jan |
99.9 |
| B.1 .5 CPI - Fruits |
Jul |
102.9 |
Feb |
96.7 |
Jul |
104.0 |
Feb |
95.9 |
| B.1 .6 CPI - Vegetables |
Oct |
111.5 |
Mar |
88.7 |
Oct |
114.2 |
Apr |
88.7 |
| B.1 .6.1 CPI - Potato |
Nov |
117.9 |
Feb |
79.8 |
Nov |
122.7 |
Feb |
79.6 |
| B.1 .6.2 CPI - Onion |
Nov |
123.8 |
May |
79.7 |
Nov |
127.9 |
May |
75.1 |
| B.1 .6.3 CPI - Tomato |
Jul |
133.2 |
Mar |
74.3 |
Jul |
126.8 |
Mar |
74.2 |
| B.1 .7 CPI - Pulses and products |
Oct |
100.9 |
Mar |
98.9 |
Nov |
100.8 |
Mar |
99.4 |
| B.1 .8 CPI - Spices |
Dec |
100.4 |
Apr |
99.5 |
Jan |
100.1 |
Apr |
99.8 |
| B.1 .9 CPI - Non-alcoholic beverages |
Dec |
100.1 |
Mar |
99.8 |
Dec |
100.2 |
Apr |
99.9 |
| B.1 .10 CPI - Prepared meals, snacks, sweets etc. |
Nov |
100.2 |
Jun |
99.8 |
Jul |
100.1 |
Mar |
99.8 |
| B.2 CPI - Clothing and footwear |
Nov |
100.2 |
Mar |
99.9 |
May |
100.1 |
Mar |
99.8 |
| B.3 CPI - Housing |
Nov |
100.4 |
Jun |
99.3 |
Apr |
100.4 |
Dec |
99.5 |
| B.4 CPI - Miscellaneous |
Sep |
100.2 |
Mar |
99.8 |
Jul |
100.2 |
Mar |
99.9 |
| C.1 Consumer Price Index for Industrial Workers (Base: 2001=100) |
Jul |
100.9 |
Mar |
98.9 |
Oct |
100.9 |
Feb |
99.1 |
| C.2 Consumer Price Index for Agricultural Labourers (Base: 1986-87=100) |
Nov |
101.0 |
Mar |
98.9 |
Nov |
101.0 |
Mar |
99.1 |
| C.3 Consumer Price Index for Rural Labourers (Base: 1986-87=100) |
Nov |
100.9 |
Mar |
98.9 |
Nov |
100.9 |
Mar |
99.1 |
| D. WPI (Base: 2011-12=100) All Commodities |
Nov |
100.6 |
Mar |
99.3 |
May |
100.4 |
Jan |
99.2 |
| D.1 WPI - Primary Articles |
Nov |
102 |
Mar |
97.3 |
Nov |
102.2 |
Mar |
98 |
| D.1.1 WPI - Food Articles |
Nov |
102.7 |
Mar |
96.8 |
Oct |
103.7 |
Mar |
96.9 |
| D.2 WPI - Fuel & Power |
Jul |
100.9 |
Apr |
98.9 |
Jul |
101.8 |
Jan |
98.6 |
| D.3 WPI - Manufactured Products |
May |
100.3 |
Dec |
99.6 |
May |
100.8 |
Dec |
99.3 |
| D.3.1 WPI - Manufacture of Food Products |
Sep |
100.6 |
Mar |
99.3 |
May |
101.0 |
Feb |
99 |
| D.3.2 WPI - Manufacture of Chemicals & Chemical Products |
May |
100.5 |
Jan |
99.4 |
May |
100.9 |
Jan |
99.2 |
| D.3.3 WPI - Manufacture of Basic Metals |
May |
101.2 |
Dec |
98.9 |
May |
102.1 |
Dec |
98.4 |
| D.3.4 WPI- Manufacture of Machinery And Equipment |
Jun |
100.1 |
Jan |
99.8 |
Aug |
100.3 |
Feb |
99.7 |
| Table A6: Change in Seasonal Peaks and Troughs in 2022-23 vis-à-vis previous 5-years of Pre-Covid (2015-2019) (Concld.) |
| Series |
Based on SF of Pre-Covid (2015 to 2019) |
Based on SF of 2022-23 |
| Peak Month |
Peak Value |
Trough Month |
Trough Value |
Peak Month |
Peak Value |
Trough Month |
Trough Value |
| Industrial Production (23 series) |
| E. IIP (Base 2011-12 =A51:A72 100) General Index |
Mar |
109.2 |
Apr |
96.1 |
Mar |
108.6 |
Apr |
95.7 |
| E.1.1 IIP - Primary goods |
Mar |
109.6 |
Sep |
94.6 |
Mar |
112.6 |
Sep |
92.6 |
| E.1.2 IIP - Capital goods |
Mar |
121.9 |
Apr |
89.7 |
Mar |
117.2 |
Apr |
89.7 |
| E.1.3 IIP - Intermediate goods |
Mar |
108.0 |
Apr |
97.2 |
Mar |
106.5 |
Feb |
96.3 |
| E.1.4 IIP - Infrastructure/ construction goods |
Mar |
107.5 |
Nov |
95.0 |
Mar |
109.0 |
Jul |
96.0 |
| E.1.5 IIP - Consumer goods |
Mar |
106.6 |
Jun |
94.6 |
Dec |
106.7 |
Jun |
91.8 |
| E.1.5.1 IIP - Consumer durables |
Oct |
107.2 |
Apr |
95.9 |
Oct |
106.8 |
Feb |
95.3 |
| E.1.5.2 IIP - Consumer non-durables |
Dec |
108.1 |
Apr |
94.0 |
Dec |
109.6 |
Apr |
93.9 |
| E.2.1 IIP - Mining |
Mar |
121.4 |
Aug |
87.2 |
Mar |
124.8 |
Sep |
84.3 |
| E.2.2 IIP - Manufacturing |
Mar |
108.1 |
Apr |
95.2 |
Mar |
106.5 |
Apr |
94.5 |
| E.2.2.1 IIP - Manufacture of food products |
Dec |
122.1 |
Jun |
85.9 |
Dec |
119.3 |
Jun |
87.6 |
| E.2.2.2 IIP - Manufacture of beverages |
May |
124.4 |
Nov |
87.9 |
May |
119.6 |
Oct |
88.1 |
| E.2.2.3 IIP - Manufacture of textiles |
Dec |
102.4 |
Feb |
96.5 |
Dec |
104.3 |
Jun |
95.0 |
| E.2.2.4 IIP - Manufacture of chemicals and chemical products |
Mar |
104.5 |
Feb |
93.5 |
Jul |
105.1 |
Feb |
93.2 |
| E.2.2.5 IIP - Manufacture of motor vehicles, trailers and semi-trailers |
Mar |
108.1 |
Dec |
93.5 |
Mar |
108.6 |
Dec |
94.5 |
| E.2.3 IIP - Electricity |
May |
106.9 |
Feb |
90.7 |
May |
108.2 |
Nov |
88.0 |
| E.3 Cement Production |
Mar |
113.9 |
Aug |
90.5 |
Mar |
116.3 |
Aug |
90.9 |
| E.4 Steel Production |
Mar |
106.8 |
Nov |
96.6 |
Mar |
109.1 |
Jul |
95.8 |
| E.5 Coal Production |
Mar |
140.3 |
Aug |
79.9 |
Mar |
144.0 |
Aug |
78.0 |
| E.6 Crude Oil Production |
Mar |
103.0 |
Feb |
92.3 |
Mar |
103.4 |
Feb |
92.2 |
| E.7 Petroleum Refinery Production |
Mar |
105.4 |
Sep |
94.4 |
Mar |
108.6 |
Sep |
91.5 |
| E.8 Fertiliser Production |
Oct |
105.9 |
Apr |
82.8 |
Oct |
106.6 |
Apr |
80.1 |
| E.9 Natural Gas Production |
Jul |
102.7 |
Feb |
91.6 |
Oct |
102.7 |
Feb |
90.9 |
| Service Sector Indicators (5 series) |
| F.1 Cargo handled at Major Ports |
Mar |
109.4 |
Sep |
93.5 |
Mar |
110.8 |
Sep |
93.3 |
| F.2 Railway Freight Traffic |
Mar |
112.6 |
Sep |
93.9 |
Mar |
113.2 |
Sep |
92.8 |
| F.3 Passenger flown (Km) - Domestic |
May |
107.8 |
Sep |
93.9 |
Dec |
107.4 |
Sep |
92.9 |
| F.4 Passenger flown (Km) - International |
Jan |
112.9 |
Sep |
92.5 |
Jan |
109.5 |
Apr |
92.4 |
| F.5 Passenger Vehicle Sales (wholesale) |
Oct |
111.4 |
Jun |
90.4 |
Oct |
113.8 |
Jun |
89.1 |
| Merchandise Trade (3 series) |
| G.1 Exports |
Mar |
115.0 |
Nov |
96.1 |
Mar |
115.6 |
Nov |
93.8 |
| G.2 Imports |
Mar |
105.3 |
Feb |
92.0 |
Mar |
105.6 |
Feb |
94.4 |
| G.3 Non-Oil Non-Gold Imports |
Dec |
104.1 |
Feb |
91.2 |
Dec |
104.1 |
Feb |
91.1 |
| Payment System Indicators (4 series) |
| H.1 RTGS |
Mar |
131.2 |
Feb |
90.7 |
Mar |
123.5 |
Apr |
91.0 |
| H.2 Paper Clearing |
Mar |
115.7 |
Sep |
93.1 |
Mar |
116.2 |
Aug |
92.3 |
| H.3 REC |
Mar |
128.0 |
Nov |
92.7 |
Mar |
125.2 |
Apr |
94.6 |
| H.4 Cards |
Oct |
108.6 |
Feb |
87.7 |
Oct |
109.9 |
Feb |
87.1 |
| Table A7: Change in seasonal variation in 2022-23 vis-à-vis previous 5-years of Pre-COVID (2015-2019) |
| Name of Variable |
2022-23 |
Average Range |
Change |
Name of Variable |
2022-23 |
Average Range |
Change |
| Monetary and Banking Indicators (14 series) |
Industrial Production (23 series) |
| A.1.1 Broad Money (M3) |
1.7 |
2.2 |
-0.5 |
E. IIP (Base 2011-12 = 100) General Index |
12.8 |
13.2 |
-0.3 |
| A.1.1.1 Net Bank Credit to Government |
3.5 |
4.0 |
-0.5 |
E.1.1 IIP - Primary goods |
20.0 |
15.0 |
5.0 |
| A.1.1.2 Bank Credit to Commercial Sector |
2.4 |
3.0 |
-0.6 |
E.1.2 IIP - Capital goods |
27.5 |
32.2 |
-4.7 |
| A.1.2 Narrow Money (M1) |
5.0 |
5.0 |
0.0 |
E.1.3 IIP - Intermediate goods |
10.1 |
10.8 |
-0.7 |
| A.1.3 Reserve Money (RM) |
4.1 |
4.8 |
-0.8 |
E.1.4 IIP - Infrastructure/ construction goods |
12.9 |
12.5 |
0.4 |
| A.1.3.1 Currency in Circulation |
4.1 |
4.8 |
-0.7 |
E.1.5 IIP - Consumer goods |
14.9 |
12.0 |
3.0 |
| A.2.1 Aggregate Deposits (SCBs) |
1.4 |
1.1 |
0.3 |
E.1.5.1 IIP - Consumer durables |
11.5 |
11.3 |
0.1 |
| A.2.1.1 Demand Deposits (SCBs) |
9.5 |
9.2 |
0.3 |
E.1.5.2 IIP - Consumer non-durables |
15.7 |
14.1 |
1.6 |
| A.2.1.2 Time Deposits (SCBs) |
1.1 |
1.1 |
0.0 |
E.2.1 IIP - Mining |
40.5 |
34.2 |
6.3 |
| A.3.1 Cash in Hand and Balances with RBI (SCBs) |
9.4 |
5.1 |
4.3 |
E.2.2 IIP - Manufacturing |
12.0 |
12.9 |
-0.9 |
| A.3.2 Bank Credit (SCBs) |
2.8 |
3.1 |
-0.3 |
E.2.2.1 IIP - Manufacture of food products |
31.7 |
36.2 |
-4.4 |
| A.3.2.1 Loans, Cash, Credits and Overdrafts (SCBs) |
2.6 |
3.0 |
-0.4 |
E.2.2.2 IIP - Manufacture of beverages |
31.5 |
36.5 |
-5.0 |
| A.3.2.2 Non-Food Credit (SCBs) |
2.2 |
3.3 |
-1.2 |
E.2.2.3 IIP - Manufacture of textiles |
9.3 |
5.9 |
3.4 |
| A.3.3 Investments (SCBs) |
3.6 |
3.7 |
-0.2 |
E.2.2.4 IIP - Manufacture of chemicals and chemical products |
11.9 |
10.9 |
1.0 |
| Price Indices [CPI: 21 series and WPI: 9 series] |
| E.2.2.5 IIP - Manufacture of motor vehicles, trailers and semi-trailers |
14.1 |
14.6 |
-0.5 |
| B. CPI (Base: 2012 = 100) All Commodities |
2.0 |
1.9 |
0.1 |
E.2.3 IIP - Electricity |
20.2 |
16.3 |
3.9 |
| B.1 CPI - Food and beverages |
4.1 |
3.7 |
0.4 |
E.3 Cement Production |
25.3 |
23.4 |
1.9 |
| B.1 .1 CPI - Cereals and products |
0.6 |
0.6 |
0.0 |
E.4 Steel Production |
13.3 |
10.3 |
3.0 |
| B.1 .2 CPI - Meat and fish |
4.5 |
3.2 |
1.3 |
E.5 Coal Production |
66.0 |
60.4 |
5.6 |
| B.1 .3 CPI – Egg |
8.4 |
6.8 |
1.5 |
E.6 Crude Oil Production |
11.2 |
10.6 |
0.6 |
| B.1 .4 CPI - Milk and products |
0.2 |
0.4 |
-0.2 |
| E.7 Petroleum Refinery Production |
17.1 |
11.0 |
6.1 |
| B.1 .5 CPI - Fruits |
8.1 |
6.3 |
1.8 |
| E.8 Fertiliser Production |
26.5 |
23.1 |
3.4 |
| B.1 .6 CPI - Vegetables |
25.4 |
22.8 |
2.7 |
E.9 Natural Gas Production |
11.8 |
11.1 |
0.7 |
| B.1 .6.1 CPI - Potato |
43.0 |
38.1 |
4.9 |
Service sector Indicators (6 series) |
| B.1 .6.2 CPI - Onion |
52.8 |
44.1 |
8.7 |
F.1 Cargo handled at Major Ports |
17.5 |
15.9 |
1.6 |
| B.1 .6.3 CPI - Tomato |
52.6 |
58.9 |
-6.3 |
F.2 Railway Freight Traffic |
20.4 |
18.7 |
1.7 |
| B.1 .7 CPI - Pulses and products |
1.4 |
2.0 |
-0.6 |
| F.3 Passenger flown (Km) - Domestic |
14.5 |
13.9 |
0.6 |
| B.1 .8 CPI - Spices |
0.3 |
1.0 |
-0.7 |
F.4 Passenger flown (Km) - International |
17.2 |
20.4 |
-3.2 |
| B.1 .9 CPI - Non-alcoholic beverages |
0.3 |
0.3 |
0.1 |
F.5 Passenger Vehicle Sales (wholesale) |
24.7 |
21.0 |
3.8 |
| B.1 .10 CPI - Prepared meals, snacks, sweets etc. |
0.3 |
0.4 |
0.0 |
Merchandise Trade (3 series) |
| B.2 CPI - Clothing and footwear |
0.2 |
0.3 |
-0.1 |
G.1 Exports |
21.7 |
19.0 |
2.8 |
| B.3 CPI - Housing |
1.0 |
1.1 |
-0.1 |
G.2 Imports |
11.2 |
13.3 |
-2.1 |
| B.4 CPI - Miscellaneous |
0.4 |
0.4 |
0.0 |
G.3 Non-Oil Non-Gold Imports |
13.0 |
12.9 |
0.1 |
| C.1 Consumer Price Index for Industrial Workers (Base: 2001=100) |
1.8 |
2.0 |
-0.2 |
| Payment System Indicators (4 series) |
| C.2 Consumer Price Index for Agricultural Labourers (Base: 1986-87=100) |
1.9 |
2.2 |
-0.3 |
H.1 RTGS |
32.5 |
40.4 |
-7.9 |
| C.3 Consumer Price Index for Rural Labourers (Base: 1986-87=100) |
1.8 |
2.0 |
-0.2 |
H.2 Paper Clearing |
23.9 |
22.6 |
1.3 |
| D. WPI (Base: 2011-12=100) All Commodities |
1.1 |
1.3 |
-0.1 |
H.3 REC |
30.6 |
35.3 |
-4.7 |
| D.1 WPI - Primary Articles |
4.2 |
4.7 |
-0.4 |
H.4 Cards |
22.8 |
21.0 |
1.8 |
| D.1.1 WPI - Food Articles |
6.8 |
5.8 |
1.0 |
|
|
|
|
| D.2 WPI - Fuel & Power |
3.2 |
2.0 |
1.3 |
|
|
|
|
| D.3 WPI - Manufactured Products |
1.5 |
0.7 |
0.8 |
|
|
|
|
| D.3.1 WPI - Manufacture of Food Products |
2.0 |
1.4 |
0.6 |
|
|
|
|
| D.3.2 WPI - Manufacture of Chemicals & Chemical Products |
1.7 |
1.1 |
0.6 |
|
| D.3.3 WPI - Manufacture of Basic Metals |
3.7 |
2.2 |
1.5 |
| D.3.4 WPI- Manufacture of Machinery and Equipment |
0.5 |
0.3 |
0.2 |
| Table A8: List of Top-Twenty and Bottom-Twenty Series based on Average Range of Monthly Seasonal Factors during Last Ten Years (Apr 2013 – Mar 2023) |
| Top-Twenty Series (Name) |
Average Range |
Peak Month |
Trough Month |
Bottom-Twenty Series (Name) |
Average Range |
Peak Month |
Trough Month |
| 1 |
2 |
3 |
4 |
5 |
6 |
7 |
8 |
| Coal production |
61.9 |
Jun |
Nov |
CPI-Non-alcoholic beverages |
0.3 |
Mar |
Jul |
| CPI-Tomato |
58.0 |
Oct |
Jun |
CPI-Clothing and Footwear |
0.3 |
Feb |
Jun |
| CPI-onion |
46.1 |
Feb |
Aug |
CPI-Prepared meals, snacks, sweets etc. |
0.3 |
Feb |
Aug |
| CPI-Potato |
39.0 |
Feb |
May |
CPI-Milk & Products |
0.3 |
Nov |
Jun |
| IIP-Manufacture of beverages |
37.7 |
Aug |
Feb |
WPI- Manufacture of Machinery And Equipment |
0.3 |
Sep |
Apr |
| Real Time Gross Settlement |
37.5 |
Jun |
Nov |
CPI-Miscellaneous |
0.4 |
Dec |
Jun |
| IIP-Mining |
35.4 |
Jun |
Dec |
CPI-Cereals & Products |
0.6 |
Feb |
Aug |
| IIP-Manufacture of food products |
35.3 |
Mar |
Sep |
CPI-Spices |
0.8 |
Mar |
Jul |
| Retail Electronic Cleaning |
34.2 |
Jun |
Feb |
WPI- Manufactured Products |
0.9 |
Aug |
Mar |
| IIP-Capital goods |
31.1 |
Jun |
Jul |
CPI-Housing |
1.0 |
Feb |
Sep |
| Fertiliser Production |
24.6 |
Jan |
Jul |
Time deposits (SCBs) |
1.1 |
Jul |
Mar |
| Cement production |
24.5 |
Jun |
Nov |
WPI-All commodities |
1.1 |
Jan |
Apr |
| CPI-Vegetables |
23.4 |
Jan |
Jun |
WPI-Manufacture of Chemicals and Chemical Products |
1.2 |
Aug |
Apr |
| Paper Clearing |
22.5 |
Jun |
Dec |
Aggregate deposits (SCBs) |
1.2 |
Jul |
Mar |
| Passenger vehicle sales (wholesale) |
21.8 |
Jan |
Sep |
WPI-Manufacture of Food products |
1.3 |
Dec |
May |
| Cards |
21.3 |
Jan |
May |
CPI-Pulses & Products |
1.8 |
Feb |
Jun |
| Exports |
20.4 |
Jun |
Feb |
CPI-All commodities |
1.9 |
Jan |
Jun |
| Passenger flown (km)-International |
19.3 |
Apr |
Dec |
M3 |
1.9 |
Jul |
Mar |
| Railway Freight Traffic |
19.2 |
Jun |
Dec |
CPI-Industrial Workers |
1.9 |
Jan |
Jun |
| IIP-Electricity |
16.4 |
Aug |
May |
CPI-Rural Labourers |
2.0 |
Feb |
Jun |
| Table A9: Regression Estimates |
| Name of Variable |
Coefficient Estimate* |
p-value$ |
Name of Variable |
Coefficient Estimate* |
p-value$ |
| Monetary and Banking Indicators (14 series) |
Index of Industrial Production (23 series) |
| A.1.1 Broad Money (M3) |
-0.023 |
0.352 |
E. IIP (Base 2011-12 = 100) General Index |
0.035 |
0.252 |
| A.1.1.1 Net Bank Credit to Government |
-0.024 |
0.388 |
E.1.1 IIP - Primary goods |
0.822 |
0.000 |
| A.1.1.2 Bank Credit to Commercial Sector |
-0.046 |
0.110 |
E.1.2 IIP - Capital goods |
-1.203 |
0.000 |
| A.1.2 Narrow Money (M1) |
0.187 |
0.019 |
E.1.3 IIP - Intermediate goods |
-0.079 |
0.002 |
| A.1.3 Reserve Money (RM) |
-0.065 |
0.045 |
E.1.4 IIP - Infrastructure/ construction goods |
0.124 |
0.034 |
| A.1.3.1 Currency in Circulation |
-0.127 |
0.000 |
E.1.5 IIP - Consumer goods |
0.253 |
0.049 |
| A.2.1 Aggregate Deposits (SCBs) |
-0.008 |
0.647 |
E.1.5.1 IIP - Consumer durables |
-0.286 |
0.005 |
| A.2.1.1 Demand Deposits (SCBs) |
0.569 |
0.030 |
E.1.5.2 IIP - Consumer non-durables |
0.309 |
0.001 |
| A.2.1.2 Time Deposits (SCBs) |
-0.044 |
0.027 |
E.2.1 IIP - Mining |
1.242 |
0.000 |
| A.3.1 Cash in Hand and Balances with RBI (SCBs) |
0.454 |
0.000 |
E.2.2 IIP - Manufacturing |
-0.068 |
0.017 |
| A.3.2 Bank Credit (SCBs) |
0.040 |
0.302 |
E.2.2.1 IIP - Manufacture of food products |
-0.489 |
0.002 |
| A.3.2.1 Loans, Cash, Credits and Overdrafts (SCBs) |
0.025 |
0.498 |
E.2.2.2 IIP - Manufacture of beverages |
-2.758 |
0.000 |
| A.3.2.2 Non-Food Credit (SCBs) |
-0.020 |
0.784 |
E.2.2.3 IIP - Manufacture of textiles |
0.229 |
0.154 |
| A.3.3 Investments (SCBs) |
-0.069 |
0.005 |
E.2.2.4 IIP - Manufacture of chemicals and chemical products |
0.085 |
0.044 |
| Price Indices [CPI: 21 series and WPI: 9 series] |
| E.2.2.5 IIP - Manufacture of motor vehicles, trailers and semi-trailers |
0.028 |
0.717 |
| B. CPI (Base: 2012 = 100) All Commodities |
-0.002 |
0.860 |
E.2.3 IIP - Electricity |
0.884 |
0.000 |
| B.1 CPI - Food and beverages |
0.007 |
0.765 |
E.3 Cement Production |
0.444 |
0.003 |
| B.1 .1 CPI - Cereals and products |
-0.029 |
0.001 |
E.4 Steel Production |
0.485 |
0.000 |
| B.1 .2 CPI - Meat and fish |
0.151 |
0.001 |
E.5 Coal Production |
1.572 |
0.000 |
| B.1 .3 CPI - Egg |
0.077 |
0.263 |
E.6 Crude Oil Production |
0.113 |
0.000 |
| B.1 .4 CPI - Milk and products |
-0.071 |
0.000 |
E.7 Petroleum Refinery Production |
0.882 |
0.000 |
| B.1 .5 CPI - Fruits |
0.209 |
0.001 |
E.8 Fertiliser Production |
-0.035 |
0.870 |
| B.1 .6 CPI - Vegetables |
0.250 |
0.081 |
E.9 Natural Gas Production |
0.130 |
0.000 |
| B.1 .6.1 CPI - Potato |
0.907 |
0.000 |
Service sector Indicators (5 series) |
| B.1 .6.2 CPI - Onion |
2.274 |
0.000 |
F.1 Cargo handled at Major Ports |
0.325 |
0.000 |
| B.1 .6.3 CPI - Tomato |
-1.191 |
0.000 |
F.2 Railway Freight Traffic |
0.282 |
0.000 |
| B.1 .7 CPI - Pulses and products |
-0.214 |
0.000 |
F.3 Passenger flown (Km) - Domestic |
-0.871 |
0.010 |
| B.1 .8 CPI - Spices |
-0.128 |
0.000 |
F.4 Passenger flown (Km) - International |
-0.183 |
0.202 |
| B.1 .9 CPI - Non-alcoholic beverages |
-0.009 |
0.197 |
F.5 Passenger Vehicle Sales (wholesale) |
0.817 |
0.003 |
| B.1 .10 CPI - Prepared meals, snacks, sweets etc. |
-0.043 |
0.001 |
Merchandise Trade (3 series) |
| B.2 CPI - Clothing and footwear |
-0.042 |
0.000 |
| G.1 Exports |
0.387 |
0.014 |
| B.3 CPI - Housing |
0.001 |
0.891 |
G.2 Imports |
-0.103 |
0.306 |
| B.4 CPI - Miscellaneous |
-0.038 |
0.003 |
G.3 Non-Oil Non-Gold Imports |
0.028 |
0.395 |
| C.1 Consumer Price Index for Industrial Workers (Base: 2001=100) |
-0.070 |
0.001 |
Payment System Indicators (4 series) |
| C.2 Consumer Price Index for Agricultural Labourers (Base: 1986-87=100) |
-0.082 |
0.000 |
H.1 RTGS |
-1.680 |
0.000 |
| C.3 Consumer Price Index for Rural Labourers (Base: 1986-87=100) |
-0.077 |
0.000 |
H.2 Paper Clearing |
-0.153 |
0.260 |
| D. WPI (Base: 2011-12=100) All Commodities |
-0.057 |
0.002 |
H.3 REC |
-0.715 |
0.001 |
| D.1 WPI - Primary Articles |
-0.048 |
0.060 |
H.4 Cards |
0.453 |
0.000 |
| D.1.1 WPI - Food Articles |
0.186 |
0.000 |
|
|
|
| D.2 WPI - Fuel & Power |
-0.039 |
0.591 |
|
|
|
| D.3 WPI - Manufactured Products |
0.079 |
0.008 |
|
|
|
| D.3.1 WPI - Manufacture of Food Products |
-0.004 |
0.898 |
|
|
|
| D.3.2 WPI - Manufacture of Chemicals & Chemical Products |
0.038 |
0.217 |
|
|
|
| D.3.3 WPI - Manufacture of Basic Metals |
0.256 |
0.000 |
|
|
|
| D.3.4 WPI- Manufacture of Machinery And Equipment |
-0.022 |
0.266 |
|
|
|
*: A series is found to have moderation (rise) in seasonal fluctuation if the coefficient is statistically significant at 5 per cent level of significance with ‘-‘ve sign (‘+’ve sign). However, seasonal fluctuation of a series is unchanged if corresponding coefficient is not statistically significant at 5 per cent level of significance.
$: p-value is also known as observed level of significance. A coefficient is found to be statistically significant at 5 per cent level of significance if its p-value is less than or equal to 0.05. |
|
 IST,
IST,