South-West Monsoon 2009 :A Review*
(June 1 to September 30, 2009) The performance of the South-West monsoon 2009, with a shortfall of 23 per cent in precipitation, is the weakest since 1972. Although Indian agriculture is more capable today to withstand drought conditions than in 1972, kharif agricultural production would get adversely affected, particularly for paddy and oilseeds, in view of lower yields and acreage consequent on lower precipitation in the current year. The agricultural sector, however, is expected to derive support from the rabi crops, the prospects for which remain promising on account of delayed withdrawal of South-West monsoon, the strong and large ‘allied sector’ and the various Government policies supporting rural sector. The progress of the North-East monsoon too will have a bearing on overall agricultural output for 2009-10. Introduction
The Indian subcontinent is predominantly characterised by a tropical monsoon climate. There are two monsoon seasons viz., South-West or the summer monsoon covering the period from June-September and North-East or the winter monsoon from October to December. The summer monsoon accounts for about 70-80 per cent of the annual rainfall in the country. The spatial and temporal distribution of rainfall during the SouthWest monsoon is crucial for the success or failure of the Kharif crops that are essentially sown in July-August. The performance of South-West monsoon had remained close to normal during the four years from 2005 to 2008, thus, contributing positively to the overall foodgrains production. However, the 2009 South-West (SW) monsoon recorded a deficiency of 27 per cent resulting in drought in several states. This article provides a detailed review of the performance of South-West Monsoon 2009.
South-West Monsoon 2009: Highlights
- The long term mean date for the onset of South-West monsoon over Kerala is June 1 with a standard deviation of about one week. During the year 2009, the South-West monsoon arrived over Kerala on May 23, 2009, one week ahead of the normal date.
- Monsoon generally covers the whole country by July 15. During the current season, after setting in on May 23, 2009, there was hiatus in the advance of the monsoon till third week of June. After that, the monsoon advanced rapidly and covered the entire country by 3rd July.
- For the country as a whole, the rainfall for the season (June – September 2009) was 77 per cent of its Long Period Average (LPA), i.e., 23 per cent below normal. The LPA of South-West monsoon rainfall averaged over the country as a whole was about 689.9 mm as against normal of 892.5 mm.
- Seasonal rainfall was close to normal for the Southern Peninsula (96 per cent of its LPA), while it remained largely deficient in other regions, viz., 64 per cent of its LPA over North-West India, 80 per cent of its LPA over Central India and 73 per cent of its LPA over North East India.
- Monthly rainfall was close to normal for July (96 per cent of LPA) while it remained eficient during June (53 per cent of LPA), August (73 per cent of LPA) and September (79 per cent of LPA).
- Out of 526 meteorological districts for which data were available, 215 districts (41 per cent) of the meteorological districts received xcess/normal rainfall and the remaining 311 districts (59 per cent) received deficient/scanty rainfall uring the season.
- At 23 per cent deficiency, the 2009 South-West monsoon season rainfall over the country as a whole was the lowest recorded rainfall in the current decade. Drought was declared by 12 States in about 300 districts. In 2002 (a drought year) the shortfall in SouthWest monsoon rainfall was 19 per cent and there was 13 per cent shortfall in 2004.
- The uneven temporal rainfall distribution caused flood situation in many states, viz., Karnataka, Assam, Meghalaya, Arunachal Pradesh, West Bengal, Orissa, Bihar, Jharkhand, Uttar Pradesh, Gujarat, Maharashtra, Madhya Pradesh, Kerela and Andhra Pradesh.
- The withdrawal of monsoon from west Rajasthan was delayed and it commenced only on 25th September compared to its normal date of 1st September (a delay of more than 3 weeks). Subsequently, it withdrew from most parts of the northwestern states and from the northern parts of Gujarat on September 28, 2009.
Forecast of South-West Monsoon India Meteorological Department (IMD) has been adopting a two-stage forecast strategy for the South-West monsoon rainfall since 2003. The first forecast for South-West monsoon rainfall comes out in the month of April using the data up to March. It also issues updated forecasts using the data up to May in the month of June, which also includes forecast for the July rainfall over the country as a whole and seasonal rainfall over the four broad homogeneous regions of India.
IMD in its first stage Long Range Forecast issued on April 17, 2009 had indicated that the rainfall during the South-West Monsoon season (June-September) 2009 for the country as a whole was likely to be 96 per cent of the Long Period Average (LPA) with a model error +/-5 per cent. Subsequently, in the update issued on June 24, 2009, the forecast for the country as a whole was revised to a lower value of 93 per cent of LPA with a model error of +/ - 4 per cent. However, the forecast turned out to be incorrect as the actual area-weighted rainfall for the country as a whole was 77 per cent of LPA, well below the lower limit of forecast value (Table 1). On a temporal basis, only the rainfall forecast for July came out to be correct. On a spatial basis, the actual rainfall in South Peninsula was closest to the forecast. In the rest three regions, actual rainfall remained very much less than the lower forecast limits.
Cumulative Rainfall during SouthWest Monsoon 2009
The season ended with the area-weighted rainfall for the country as a whole at 77 per cent of the LPA, less than even the lower bound of the IMD’s long range forecast. The shortfall in rainfall during the current year marks the lowest since 1972.
Table 1: South-West Monsoon Rainfall and Kharif Production |
Year |
IMD’s
Forecast
(% of LPA) |
Actual
Rainfall
(% of LPA) |
Kharif foodgrains production
(% change) |
1 |
2 |
3 |
4 |
1997 |
92 |
102 |
-2.4 |
1998 |
99 |
106 |
0.5 |
1999 |
111 |
96 |
2.5 |
2000 |
99 |
92 |
-3.2 |
2001 |
98 |
92 |
9.8 |
2002* |
101 |
81 |
-22.2 |
2003 |
96 |
102 |
34.1 |
2004 |
100 |
87 |
-11.7 |
2005 |
98 |
99 |
6.3 |
2006 |
92 |
99 |
0.6 |
2007 |
93 |
105 |
1.6 |
2008 |
99 |
98 |
-2.8 |
2009* |
93 |
77 |
NA |
* : Drought year. NA: Not Available.
Source: India Meteorological Department (IMD), Ministry of Agriculture, Government of India. |
Spatial Distribution The spatial distribution of rainfall during South-West monsoon 2009 remained uneven. Of the 36 meteorological subdivisions, cumulative rainfall was excess/ normal in 13 sub-divisions (32 sub-divisions during last year) and deficient/scanty/no rain in 23 sub-divisions (4 sub-divisions during last year) (Chart 1, Table 2 and Statement I). Excess rainfall in some subdivisions resulted in floods while large deficiency resulted in drought in several districts.
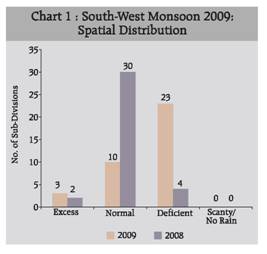 |
Table 2: Distribution of Sub-divisions According to Category of Rainfall |
Category of Rainfall |
Sub-divisions |
1 |
2 |
Excess |
Saurashtra and Kutch, North Interior Karnataka and South Interior Karnataka. |
Normal |
Andaman and Nicobar Islands, Gangetic West Bengal, Orissa , Konkan and Goa, Madhya Maharashtra, Rayalaseema, Tamilnadu and Puducherry, Coastal Karnataka, Kerala and Lakshadweep. |
Deficient |
Arunachal Pradesh, Assam and Meghalaya, Nagaland, Manipur, Mizoram and Tripura, Sub-Himalayan West Bengal and Sikkim, Jharkhand, Bihar, East Uttar Pradesh, West Uttar Pradesh, Uttarakhand, Haryana, Chandigarh and Delhi, Punjab, Himachal Pradesh, Jammu and Kashmir, West Rajasthan, East Rajasthan, West Madhya Pradesh, East Madhya Pradesh, Gujarat Region, Daman, Dadra and Nagar Haveli, Marathwada, Vidarbha , Chhattisgarh, Coastal Andhra Pradesh and Telangana. |
Note:Excess: + 20 per cent or more; Normal: + 19per cent to –19 per cent; Deficient: -20 percent to – 59 per cent; Scanty: –60 per cent to –99 per cent; No Rain: -100 per cent (All withrespect to the Long Period Average).
Source:India Meteorological Department. |
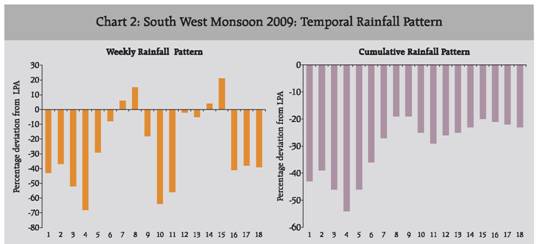
Among the four broad homogeneous regions1 , the South-West monsoon rainfall was normal over Southern Peninsular Region. It was deficient over North-West India, Central India and North-East India (Table 3). Districtwise, out of 526 meteorological districts for which data were available, 41 per cent of the meteorological districts received excess/normal rainfall and the remaining 59 per cent received deficient/scanty rainfall during the season (Statement II). The temporal rainfall distribution caused flood situation in the states of Karnataka, Assam, Meghalaya, Arunachal Pradesh, West Bengal, Orissa, Bihar, Jharkhand, Uttar Pradesh, Gujarat, Maharashtra, Madhya Pradesh, Kerela and Andhra Pradesh. Temporal Distribution The temporal distribution of monsoon rainfall over the country as a whole reveals that the cumulative rainfall remained below the LPA throughout the season. The rainfall during July at 96 per cent of LPA was, however, within the normal limits of +/- 19 per cent and was higher than corresponding month last year. Monsoon rainfall over the country as a whole was 53 per cent of LPA during June, 73 per cent of LPA during August and 79 per cent of LPA during September (Chart 2 and Table 4).
Table 3: Region-wise Rainfall during the South-West Monsoon 2009 |
Region |
Normal (mm) |
Actual (mm) |
Percentage Departure |
2008 |
2009 |
2008 |
2009 |
1 |
2 |
3 |
4 |
5 |
6 |
All-India |
892.5 |
873.2 |
689.9 |
-2 |
-23 |
North-West India |
611.7 |
651.7 |
392.1 |
7 |
-36 |
Central India |
995.1 |
956.9 |
795.4 |
-4 |
-20 |
South Peninsula |
722.5 |
692.5 |
692.9 |
-4 |
-4 |
North-East India |
1427.3 |
1346.0 |
1037.7 |
-6 |
-27 |
Source: India Meteorological Department. |
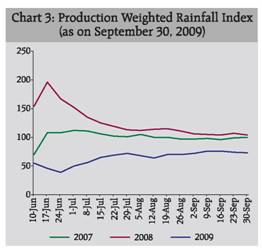
Production Weighted Rainfall Index The foodgrains production weighted index (PRN) is constructed by the Reserve Bank based on the weighted average of actual rainfall received by the States where weights are taken as the average share of food grains production by a particular State in the overall foodgrains production2 . As per this index, the rainfall during South-West monsoon 2009 was 27 per cent deficient, which is higher than that of the deficiency shown by IMD data, thus indicating a relatively higher deficiency in the foodgrains producing states. The foodgrains weighted rainfall index was 4 per cent above normal during last year (Chart 3).
Table 4: Month-wise Rainfall during S-W Monsoon |
Month |
Per cent Departure from Normal |
2008 |
2009 |
1 |
2 |
3 |
June |
24 |
-47 |
July |
-17 |
-4 |
August |
-3 |
-27 |
September |
-1 |
-21 |
Source : India Meteorological Department. |
Drought 2009
With more than 73 per cent of annual rainfall in India being received during the South-West monsoon season, a major shortfall in SW monsoon generally culminates into a drought. Drought connotes a situation of water shortage for human, cattle and agriculture consumption resulting in economic losses, primarily in agriculture sector. Drought is classified as Meteorological, Hydrological and Agricultural3. Unlike the Hydrological and Agricultural droughts, the Meteorological drought may not necessarily have any serious impact if the departure from normal is not significant and the rainfall is sufficient enough to sustain the soil moisture. Available data indicate that on an average 16 per cent of the country’s total area is drought prone and about 50 million people in the country are annually exposed to the adverse impact of drought. The possibility of drought occurrence in India varies from once in 2 years in Western Rajasthan to once in 15 years in Assam.
 |
 |
In the post independence period, the country has experienced about 10 to 11 droughts, of which, 5 were of relatively large scale with significant declines in agricultural output – 1965, 1972, 1979, 1987 and 2002 (Table 5). While the droughts of 1965 and 1979 were ‘late season droughts’ (rainfall deficiency mostly in September), droughts in 1972, 1987 and 2002 were ‘early season droughts’ with rainfall deficiency being maximum during the month of July. In the current year, the rainfall deficiency has been the maximum in the month of June.
Table 5: Droughts in Independent India, Monsoon and Agriculture GDP |
Drought years |
South-West
Monsoon
shortfall
(in per cent) |
Agricultural
GDP
growth
(per cent) |
Overall
GDP
growth
(per cent) |
2009 |
23 |
- |
- |
2004 |
13 |
0.0 |
7.5 |
2002 |
19 |
-7.2 |
3.8 |
1987 |
19 |
-1.6 |
3.5 |
1986 |
13 |
-0.4 |
4.3 |
1982 |
15 |
-0.3 |
2.9 |
1979 |
19 |
-12.8 |
-5.2 |
1974 |
12 |
-1.5 |
1.2 |
1972 |
24 |
-5.0 |
-0.3 |
1966 |
13 |
-1.4 |
1.0 |
1965 |
18 |
-11.0 |
-3.7 |
1951 |
19 |
1.5 |
2.3 |
Source: IMD, RBI, Ministry of Agriculture. |
As regards the impact of drought on GDP, while in the 1960s and 1970s, droughts that resulted in a decline in foodgrains production generally culminated into negative GDP growth, e.g., 1965-66, 1972-73 and 1979-80. The 1990s, however, revealed a different picture where by Indian economy continued to register positive growth despite decline in agriculture. This is attributed to the decline in the share of agriculture in national income from 57 per cent in 1961 and 35 per cent in 1987-88 to 22 per cent in 2002-03 and further to 17 per cent in 2008-09. Even within the manufacturing sector, the share of agro-based industries has come down from 44 per cent in 1961 to 13.4 per cent in 2002 and further to 12.8 per cent in 2007. Besides, agriculture today is substantially diversified with more than 60 per cent of the income coming from allied activities. Kharif crops that are grown in the South-West monsoon season contribute 20 per cent to the overall agricultural GDP. Besides, Government has also been taking more proactive initiatives towards supplementing rural incomes in drought stricken years. While assessing the impact of drought on Indian agricultural output, the above factors need to be taken into account.
During the current season, around 300 districts have been declared as drought hit, partially or wholly in 12 States. In view of drought conditions, the GoI had formulated a Comprehensive Drought Management Plan as early as in July 2009. It has also initiated several timely measures to compensate for the likely decline in Kharif production. These include: provision of supplemental irrigation facilities via the diesel subsidy in states with more than 50 per cent deficiency in rainfall, planned efforts to increase Rabi production through ensuring availability of seeds, fertilisers and other inputs to farmers, issuing several policies/advisories with regard to crop substitution, water conservation techniques, providing the flexibility to states in the use of funds under various central schemes and lastly providing the assurance as well as actually going in for import of foodgrains and open market release of stocks. As per Government advisories, several districts in the eastern region have taken up short duration Boro rice cultivation that would compensate for shortfall in paddy. The shortfall in groundnut sowing is being partly offset by Toria and Taramira that could be sown even in late kharif season.
Reservoir Status In India, the Central Water Commission monitors the total live water storage in the 81 major reservoirs having full reservoir level (FRL) of 151.77 billion cubic metres (BCM), which accounts for around 67 per cent of the total reservoir capacity of the country. As on October 1, 2009 water stock in these 81 major reservoirs was 60 per cent of the FRL, lower than 75 per cent during the corresponding period of the previous year and the average of 67 per cent during the last 10 years (Table 6).
Progress of Sowing The deficient South-West monsoon has impacted the kharif sowing, which is about 5.3 per cent below that of the last year. Latest sowing position indicates that sowing of all crops during the current kharif season as on October 30, 2009 was 92 per cent of the normal level (Table 7). Sowing of most pulses and cotton are higher than last year levels, while the sowing of coarse cereals and jute remained the same as last year, though paddy sowing has been substantially affected (15.5 per cent below last year’s level). Other crops whose sowing has been affected somewhat include oilseeds and sugarcane. Considering that Kharif paddy is an important crop accounting for about 86 per cent of total rice production and 36 per cent of total foodgrains production in India, the shortfall in its sowing could be expected to depress the overall foodgrains production during 2009-10.
Table 6: Reservoir Status |
Status As On |
1.10.2005 |
1.10.2006 |
1.10.2007 |
1.10.2008 |
1.10.2009 |
1 |
2 |
3 |
4 |
5 |
6 |
Total Live Storage (BCM) |
108.06 |
120.45 |
124.80 |
113.74 |
90.48 |
Percentage to Live Capacity at FRL |
81 |
91 |
82 |
75 |
60 |
Source: Central Water Commission. |
Table 7: Summary of Progress of Kharif Crops (Area coverage) |
(Area in Million Hectares) |
Crop |
Normal Area |
Area Coverage
(as on October 30, 2009) |
2008 |
2009 |
Variation |
Percentage |
1 |
2 |
3 |
4 |
5 |
6 |
Rice |
39.2 |
38.9 |
32.9 |
-6.1 |
-15.5 |
Coarse Cereals |
23.0 |
20.7 |
20.7 |
0.1 |
0.3 |
of which: |
|
|
|
|
|
Bajra |
9.7 |
8.5 |
8.5 |
0.0 |
0.2 |
Jowar |
3.9 |
2.9 |
3.1 |
0.2 |
6.6 |
Maize |
6.8 |
7.1 |
7.1 |
0.1 |
0.9 |
Total Pulses |
11.2 |
9.6 |
10.1 |
0.5 |
5.6 |
Total Oilseeds |
16.9 |
18.4 |
17.5 |
-1.0 |
-5.2 |
of which: |
|
|
|
|
|
Groundnut |
5.4 |
5.3 |
4.4 |
-0.9 |
-16.6 |
Soyabean |
7.8 |
9.6 |
9.6 |
0.0 |
-0.2 |
Sugarcane |
4.4 |
4.4 |
4.3 |
-0.1 |
-2.9 |
Cotton |
8.7 |
8.5 |
9.6 |
1.1 |
13.4 |
Jute |
0.8 |
0.7 |
0.7 |
0.0 |
-2.0 |
All Crops |
104.2 |
101.2 |
95.8 |
-5.4 |
-5.3 |
Source : Ministry of Agriculture, Government of India. |
Statement I : Basic Rainfall Data (Cumulative) |
Sub-Divisions |
June 1 to September 30 , 2009 |
June 1 to September 30 , 2008 |
Actual (mm) |
Normal (mm) |
%deviation from Normal |
Actual (mm) |
Normal (mm) |
%deviation from Normal |
1 |
2 |
3 |
4 |
5 |
6 |
7 |
8 |
9 |
1. |
Andaman & Nicobar Islands |
1671.8 |
1755.2 |
N |
N |
1752.0 |
1755.2 |
0 |
N |
2. |
Arunachal Pradesh |
1323.9 |
1834.9 |
-28 |
D |
1658.4 |
1834.9 |
-10 |
N |
3. |
Assam & Meghalaya |
1320.9 |
1885.3 |
-30 |
D |
1601.2 |
1885.3 |
-15 |
N |
4. |
Nagaland, Manipur, Mizoram & Tripura |
822.5 |
1240.9 |
-34 |
D |
983.8 |
1240.9 |
-21 |
D |
5. |
Sub-Himalayan West Bengal and Sikkim |
1529.5 |
1955.4 |
-22 |
D |
2098.0 |
1955.4 |
7 |
N |
6. |
Gangetic West Bengal |
973.7 |
1136.3 |
-14 |
N |
1288.8 |
1136.3 |
13 |
N |
7. |
Orissa |
1167.3 |
1164.9 |
0 |
N |
1418.7 |
1164.9 |
22 |
E |
8. |
Jharkhand |
799.6 |
1092.5 |
-27 |
D |
1075.1 |
1092.5 |
-2 |
N |
9. |
Bihar |
736.3 |
1039.2 |
-29 |
D |
1104.4 |
1039.2 |
6 |
N |
10. |
East Uttar Pradesh |
563.1 |
913.6 |
-38 |
D |
1062.8 |
913.6 |
16 |
N |
11. |
West Uttar Pradesh |
442.6 |
772.8 |
-43 |
D |
864.0 |
772.8 |
12 |
N |
12. |
Uttarakhand |
864.9 |
1223.1 |
-29 |
D |
1198.8 |
1223.1 |
-2 |
N |
13. |
Haryana, Chandigarh & Delhi |
290.7 |
470.0 |
-38 |
D |
538.3 |
470.0 |
15 |
N |
14. |
Punjab |
323.6 |
501.8 |
-36 |
D |
600.2 |
501.8 |
20 |
E |
15. |
Himachal Pradesh |
494.2 |
773.7 |
-36 |
D |
738.5 |
773.7 |
-5 |
N |
16. |
Jammu & Kashmir |
337.6 |
513.6 |
-34 |
D |
524.8 |
513.6 |
2 |
N |
17. |
West Rajasthan |
155.4 |
262.8 |
-41 |
D |
287.7 |
262.8 |
9 |
N |
18. |
East Rajasthan |
436.8 |
623.6 |
-30 |
D |
607.1 |
623.6 |
-3 |
N |
19. |
West Madhya Pradesh |
657.0 |
904.3 |
-27 |
D |
709.6 |
904.3 |
-22 |
D |
20. |
East Madhya Pradesh |
738.2 |
1097.4 |
-33 |
D |
948.9 |
1097.4 |
-14 |
N |
21. |
Gujarat Region, Daman, Dadra & Nagar Haveli |
613.4 |
933.6 |
-34 |
D |
918.3 |
933.6 |
-2 |
N |
22. |
Saurashtra & Kutch |
612.8 |
485.7 |
26 |
E |
558.5 |
485.7 |
15 |
N |
23. |
Konkan and Goa |
2316.4 |
2802.1 |
-17 |
N |
2982.9 |
2802.1 |
6 |
N |
24. |
Madhya Maharashtra |
683.6 |
700.1 |
-2 |
N |
755.3 |
700.1 |
8 |
N |
25. |
Marathwada |
529.7 |
704.3 |
-25 |
D |
587.5 |
704.3 |
-17 |
N |
26. |
Vidarbha |
661.9 |
976.2 |
-32 |
D |
782.7 |
976.2 |
-20 |
D |
27. |
Chhattisgarh |
796.3 |
1205.8 |
-34 |
D |
1061.0 |
1205.8 |
-12 |
N |
28. |
Coastal Andhra Pradesh |
429.6 |
575.2 |
-25 |
D |
599.0 |
575.2 |
4 |
N |
29. |
Telangana |
497.9 |
767.3 |
-35 |
D |
797.5 |
767.2 |
4 |
N |
30. |
Rayalaseema |
390.1 |
380.9 |
2 |
N |
387.6 |
380.9 |
2 |
N |
31. |
Tamil Nadu & Puducherry |
314.8 |
315.6 |
0 |
N |
324.4 |
315.6 |
3 |
N |
32. |
Coastal Karnataka |
3469.1 |
3173.9 |
9 |
N |
2663.3 |
3173.9 |
-16 |
N |
33. |
North Interior Karnataka |
601.3 |
490.9 |
22 |
E |
430.6 |
490.9 |
-12 |
N |
34. |
South Interior Karnataka |
855.3 |
659.3 |
30 |
E |
720.8 |
659.3 |
9 |
N |
35. |
Kerala |
1959.4 |
2143.0 |
-9 |
N |
1678.5 |
2143.0 |
-22 |
D |
36. |
Lakshadweep |
1026.4 |
985.2 |
4 |
N |
933.9 |
985.2 |
-5 |
N |
E : |
Excess, i.e.,+20% or more |
|
|
3 |
|
|
2 |
|
N : |
Normal, i.e.,+19% to -19% |
|
|
10 |
|
|
30 |
|
D : |
Deficient, i.e.,-20% to -59% |
|
|
23 |
|
|
4 |
|
S : |
Scanty, i.e.,-60% to -99% |
|
|
0 |
|
|
0 |
|
NR: |
No Rain, i.e. -100% |
|
|
0 |
|
|
0 |
|
TOTAL |
36 |
|
36 |
|
Source : India Meteorological Department. |
Statement II : Statewise Distribution of No. of Districts with Excess, Normal, Deficient, Scanty and No Rainfall during South-West Monsoon 2009 |
S. No. |
State/UT |
E |
N |
D |
S |
NR |
ND |
Total |
1 |
2 |
3 |
4 |
5 |
6 |
7 |
8 |
9 |
1. |
A & N Island (UT) |
0 |
1 |
1 |
0 |
0 |
0 |
2 |
2. |
Arunachal Pradesh |
2 |
3 |
5 |
2 |
0 |
1 |
13 |
3. |
Assam |
1 |
12 |
7 |
1 |
0 |
1 |
22 |
4. |
Meghalaya |
1 |
1 |
0 |
0 |
0 |
1 |
3 |
5. |
Nagaland |
0 |
0 |
2 |
2 |
0 |
0 |
4 |
6. |
Manipur |
0 |
0 |
1 |
1 |
0 |
1 |
3 |
7. |
Mizoram |
0 |
0 |
1 |
0 |
0 |
1 |
2 |
8. |
Tripura |
0 |
2 |
1 |
0 |
0 |
0 |
3 |
9. |
Sikkim |
0 |
0 |
1 |
0 |
0 |
0 |
1 |
10. |
West Bengal |
1 |
10 |
6 |
0 |
0 |
0 |
17 |
11. |
Orissa |
8 |
17 |
5 |
0 |
0 |
0 |
30 |
12. |
Jharkhand |
0 |
7 |
4 |
3 |
0 |
1 |
15 |
13. |
Bihar |
0 |
10 |
20 |
2 |
0 |
0 |
32 |
14. |
Uttar Pradesh |
1 |
10 |
38 |
15 |
0 |
0 |
64 |
15. |
Uttarakhand |
1 |
3 |
5 |
3 |
0 |
0 |
12 |
16. |
Haryana |
0 |
4 |
11 |
4 |
0 |
0 |
19 |
17. |
Chandigarh (UT) |
0 |
1 |
0 |
0 |
0 |
0 |
1 |
18. |
Delhi |
0 |
0 |
1 |
0 |
0 |
0 |
1 |
19. |
Punjab |
1 |
3 |
8 |
4 |
0 |
0 |
16 |
20. |
Himachal Pradesh |
2 |
3 |
6 |
1 |
0 |
0 |
12 |
21. |
Jammu & Kashmir |
0 |
2 |
7 |
1 |
0 |
1 |
11 |
22. |
Rajasthan |
0 |
5 |
27 |
0 |
0 |
0 |
32 |
23. |
Madhya Pradesh |
0 |
11 |
32 |
2 |
0 |
0 |
45 |
24. |
Chhattisgarh |
0 |
3 |
13 |
0 |
0 |
0 |
16 |
25. |
Gujarat |
4 |
5 |
16 |
0 |
0 |
0 |
25 |
26. |
DNH & Daman (UTD) |
0 |
1 |
0 |
0 |
0 |
0 |
1 |
27. |
Diu (UT) |
1 |
0 |
1 |
0 |
0 |
0 |
1 |
28. |
Goa |
0 |
1 |
0 |
0 |
0 |
0 |
1 |
29. |
Maharashtra |
2 |
14 |
17 |
0 |
0 |
0 |
33 |
30. |
Andhra Pradesh |
0 |
8 |
15 |
0 |
0 |
0 |
23 |
31. |
Tamilnadu |
4 |
13 |
13 |
2 |
0 |
0 |
30 |
32. |
Puducherry |
0 |
0 |
1 |
0 |
0 |
0 |
1 |
33. |
Karnataka |
17 |
9 |
1 |
0 |
0 |
0 |
27 |
34. |
Kerala |
0 |
9 |
5 |
0 |
0 |
0 |
14 |
35. |
Lakshadweep (UT) |
0 |
1 |
0 |
0 |
0 |
0 |
1 |
Total |
46 |
169 |
270 |
41 |
0 |
7 |
533 |
E: Excess. N: Normal. D: Deficient. S: Scanty. NR: No Rain.ND: No Data.
Source: India Meteorological Department. |
* Prepared in the Division of Rural Economics, Department of Economic Analysis and Policy, Reserve Bank of India.
1 The four broad homogeneous regions are: 1) North-West India (Uttar Pradesh, Rajasthan, Haryana, Chandigarh and Delhi, Punjab, Uttaranchal, Himachal Pradesh and Jammu and Kashmir); 2) Central India (Madhya Pradesh, Chhattisgarh, Maharashtra, Orissa, Gujarat and Goa); 3) South Peninsula (Andhra Pradesh, Karnataka, Tamil Nadu and Puducherry, Kerala, Lakshadweep and Andaman and Nicobar Islands); and 4) North-East India (Bihar, Jharkhand, West Bengal, Sikkim, Assam, Arunachal Pradesh, Meghalaya, Nagaland, Manipur, Mizoram, Tripura).
2 A PRN of 100 indicates normal rainfall, where normal represents average of last 10 years’ weighted rainfall.
3 Meteorological Drought connotes rainfall reduction below 19 per cent of normal rainfall; Hydrological drought refers to large depletion of surface water leading to drying up of lakes, rivers and reservoirs; Agricultural drought refers to a more severe situation whereby inadequate moisture leads to acute crop stress and decline in crop productivity. As per IMD, shortfall of 11 per cent to 25 per cent in south-west rainfall is considered as “mild drought”, a deficiency of 26 per cent to 50 per cent is regarded as “moderate” drought and above 50 per cent shortfall in south-west monsoon precipitation is treated as “severe drought”. |


