South-west Monsoon 2012 : A Review (June 1 to September 30, 2012) - RBI - Reserve Bank of India
South-west Monsoon 2012 : A Review (June 1 to September 30, 2012)
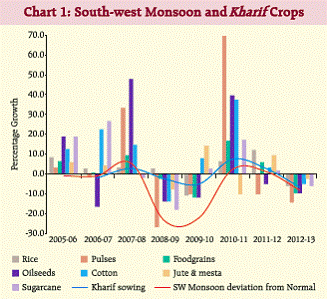
South-west Monsoon 2012 : A Review (June 1 to September 30, 2012)* The South-west monsoon during June-September 2012 was 8 per cent below the long period average (LPA) of 89 cm (average of 1951-2000) as against 1 per cent above LPA during June-September 2011. This is the second highest level by which rainfall during the period has fallen short of the LPA in the past eight years. The India Meteorological Department (IMD) had initially forecasted normal rainfall during the season. Less than expected precipitation along with uneven and slow progress of monsoon during the initial period, in particular, June- July, which coincided with the sowing period for most kharif crops resulted in delayed sowing for the crops. With recovery of rainfall during the second half of the season sowing of some kharif crops picked up though some area under crops like coarse cereals and pulses remained unsown. The result being lesser area sown under most kharif crops which has been reflected in a decline in production of foodgrains by around 10 per cent compared with last year as per the First Advance Estimates. However, the late recovery of rainfall, especially during September augured well for standing kharif crops and has improved soil moisture content and reservoir levels, thus improving the prospects for winter and rabi crops which could help in compensating for the loss of kharif crops. Introduction Indian agriculture continues to remain predominantly rain-fed. With merely 45.3 per cent (2008-09) of the total cropped area under assured irrigation, rainfall continues to be an important factor determining the performance of agriculture in India. About 16 per cent of the country’s geographical area is drought prone. This is mostly in the arid, semi-arid and sub-humid areas. Rain-fed agriculture accounts for around 56 per cent of the total cropped area, with 77 per cent of pulses, 66 per cent of oilseeds and 45 per cent of cereals grown under rain-fed conditions. The pattern of rainfall in India can be broadly classified into two seasons viz., South-west monsoon or the summer rainfall covering the period June- September and North-East monsoon during October to December. The summer monsoon accounts for about 70-80 per cent of the annual rainfall in the country. Therefore, the quantum, spatial and temporal distribution of summer rainfall has a significant impact on the prospects of kharif crops most of which are sown during June-July till early August. Even though Indian agriculture has become more resilient in recent past and there has been resurgence in its performance, rainfall continues to affect the performance of the sector. In the more recent years, in particular, during 2008-09 and 2009-10 including the current year, growth in the production of most kharif crops were either negative or lower than the previous years. These were the years when the South-west monsoon happened to be much below the LPA (Chart 1). In the backdrop of these developments, this article provides a detailed review of the performance of Southwest monsoon during June-September 2012. South-west Monsoon 2012: Highlights
Forecast: South-west Monsoon 2012 The IMD in April 2012 predicted a normal onset of South-west monsoon. As predicted, there was no undue delay in the onset of monsoon. Rainfall set in over Kerala on June 5th. This has been the eighth consecutive correct forecast for the onset South-west monsoon over Kerala since the issuing of the operational forecast for the event started in 2005. The IMD in its First Long Range Forecast in April, predicted rainfall of 89 cm during June-September which was 99 per cent of the LPA of 1951-2000 with a model error of ± 5 per cent. The Second Long Range Forecast during June revised rainfall for the country as a whole for the period to be 96 per cent of LPA with a model error of ±4 per cent. The actual rainfall for the country as a whole during the period which was 92 per cent of the LPA was within the range of the second forecast. The second forecast has estimated rainfall for the month of July to be 98 per cent of its LPA and that for August to be 96 per cent of its LPA with a model error of ± 9 per cent. Based on the progress and distribution of rainfall, the August forecast for the second half of the season i.e., August-September was placed at 91 per cent of LPA with a model error of ±8 per cent, that for August at 96 of LPA and for the season to be deficient at less than 90 per cent of LPA. The long range forecasts and the actual rainfall for the country as a whole and the four broad geographical regions are set out in Table 1. Most of the operational long range forecasts of season rainfall (except for Northeast India) were accurate. The forecast for August rainfall over the country as a whole was also correct. However, the forecast for July was an overestimate and that for the second half of the season was an underestimate. The main reason for the underestimation of the forecast for the second half of the monsoon season was delay in the establishment of El Nino conditions in the Pacific and sudden emergence of positive phase of India Ocean Dipole during later part of the monsoon season.
Distribution of Rainfall: South-west Monsoon 2012 The season ended with the area-weighted rainfall for the country as a whole at 92 per cent of the LPA which was 8 per cent below normal. Likewise as in all India level, the four homogeneous regions also received rainfall which was less than the LPA for the season. The extent of shortfall in rainfall in the Northeast region which received the least rainfall was 11 per cent below its LPA, 10 per cent below LPA in South Peninsula, 7 per cent below LPA in Northwest and 4 per cent below LPA in Central India (Table 2).
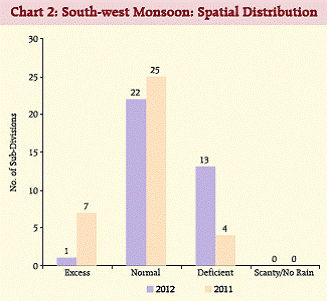
Spatial Distribution The cumulative season rainfall from 1st June to 30th September 2012 was excess/normal in 67 per cent and deficient in 33 per cent of the total area of the country. Of the total 36 meteorological subdivisions, 23 subdivisions received excess/normal rainfall and the remaining 13 subdivisions received deficient rainfall (Chart 2, Table 3 and Statement I). Temporal Distribution Rainfall remained below the respective monthly LPA during June and July and was above the LPA during August and September. This showed that, temporally, the progress of monsoon during the season was slow which was also steady. This has been indicated by the progressive decline in the magnitude of deficiency in rainfall during June and July and the successive rise in magnitude of rainfall in excess of the monthly LPA afterward during August and September. This pattern of the progress of monsoon has also been reflected in the progressive decline in the magnitude of cumulative deviation below LPA during the period and the number of sub-division with deficient and scanty rainfalls (Table 4).
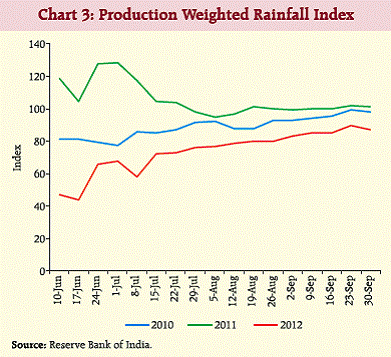
Production Weighted Rainfall Index The foodgrains production weighted rainfall index (PRN) is constructed by the Reserve Bank based on the weighted average of actual rainfall received by the States where weights are taken as the average share of foodgrains production by particular State in the overall foodgrains production1. As per this index, the rainfall during South-west monsoon 2012 was 13 per cent below normal as against 1 per cent above normal the previous year (Chart 3). Reservoir Status In India, the Central Water Commission monitors the total live water storage in the 84 major reservoirs with a full reservoir level (FRL) of 154.42 billion cubic meters (BCM). As on September 27, 2012 water stock (storage to live capacity) in 84 major reservoirs was 75 per cent of the FRL as against 87 per cent during the corresponding period last year; the average storage to live capacity during the last ten years was 71 per cent (Table 5).
Progress of Sowing and Kharif Production Estimates Kharif 2012 began with a subdued prospect due to delay in the onset of south-west monsoon which was accompanied by uneven progress and distribution of precipitations, especially during the crucial kharif sowing period of June and July. This resulted in delayed sowing of most kharif crops. However, rainfall improved during August-September. Accordingly, sowing under most kharif crops picked up though recovery in sowing was not complete, in particular, coarse cereals and pulses. Initial delay in sowing, particularly during July, therefore has adversely impacted the production of kharif crops as indicated by the First Advance Estimates (Table 6). The late recovery of rainfall, especially during September has improved soil moisture content and reservoir levels, thus improving the prospects for winter and rabi crops which could help in compensating for the loss of Kharif crops.
Conclusion The South-west monsoon during June-September 2012 was 8 per cent below LPA as against 1 per cent above LPA in June-September 2011. The cumulative season rainfall from 1st June to 30th September 2012 was excess/normal in 67 per cent and deficient in 33 per cent of the total area of the country. Deficient rainfall resulted in shortfall in area sown for several crops, notably coarse cereals and pulses. Notwithstanding an improvement in rainfall position during August- September, the production of kharif foodgrains in 2012 is estimated to be lower at 117.2 million tonnes as against 129.9 million tonnes last year as indicated by the First Advance Estimates. However, revival of monsoon during the latter half of the season augured well for standing kharif crops and is expected to improve the prospects for rabi crops. Overall, the growth of agricultural sector is likely to remain subdued during 2012-13.
* Prepared in the Development Studies Division, Department of Economic and Policy Research, Reserve Bank of India. 1A Production Weighted Rainfall Index of 100 indicates normal rainfall, where normal represents average of last 10 years’ production weighted rainfall. |
|||||||||||||||||||||||||||||||||||||||||||||||||||||||||||||||||||||||||||||||||||||||||||||||||||||||||||||||||||||||||||||||||||||||||||||||||||||||||||||||||||||||||||||||||||||||||||||||||||||||||||||||||||||||||||||||||||||||||||||||||||||||||||||||||||||||||||||||||||||||||||||||||||||||||||||||||||||||||||||||||||||||||||||||||||||||||||||||||||||||||||||||||||||||||||||||||||||||||||||||||||||||||||||||||||||||||||||||||||||||||||||||||||||||||||||||||||||||||||||||||||||||||||||||||||||||||||||||||||||||||||||||||||||||||||||||||||||||||||||||||||||||||||||||||||||||||||||||||||||||||||||||||||||||||||||||||||||||||||||||||||||||||||||||||||||||||||||||||||||||||||||||||||||||||||||||||||||||||||||||||||||||||||||||||||||||||||||||||||||||||||||||||||||||||||||||||||||||||||||||||||||||||||||||||||||||||||||||||||||||||||||||||||||||||||||||||||||||||||||||||||||||||||||||||||||||||||||||||||||||||||||||||||||||||||||||||||||||||||||||||||||||||||||||||||||||||||||||||||||||


