 IST,
IST,


State of the Economy
|
The global macroeconomic environment remained fluid in June and July so far amidst geo-political tensions and tariff policy uncertainties. Domestic economic activity held up, with improving kharif agricultural season prospects, continuation of strong momentum in the services sector and modest growth in industrial activity. Headline CPI inflation remained below 4 per cent for the fifth consecutive month in June driven by deflation in food prices. System liquidity remained in surplus to facilitate a faster transmission of policy rate cuts to the credit markets. The external sector remained resilient, backed by ample foreign exchange reserves and a moderate external debt-to-GDP ratio. Introduction The global macroeconomic environment remained fluid in June and July so far. In the first fortnight of June, concerns about the rapid escalation of geopolitical tensions between Iran and Israel led to a marked uptick in market volatility. The announcement of a ceasefire on June 23, however, restored normalcy in global markets. Progress on several bilateral trade deals provided further impetus to the overall optimism. By early July, however, concerns around fiscal health of the US, tariff policy uncertainties and their implication for growth and inflation weighed on the evolving economic outlook. High-frequency indicators of global economic activity point to a modest expansion in manufacturing activity in June, after two months of contraction, alongside a robust expansion in services activity. Weak consumer and business confidence, however, raises apprehensions about the strength of the economic rebound, especially in view of the lingering global trade policy uncertainties.1 While food and other commodity prices rose, crude oil prices ebbed from their mid-June peak as geo-political tensions eased. Rally in global equity markets, which commenced following the ceasefire agreement between Iran and Israel, continued into July fuelled by optimism arising from progress on trade deals and strong early corporate results. Treasury yields, however, firmed up on concerns regarding the fiscal health of the US following the passage of the “One Big Beautiful Bill” and higher June CPI inflation data. US dollar recovered some of its earlier losses in the first half of July following the better than expected economic data release. Central banks in many advanced economies (AEs) kept policy rates unchanged, as the last mile of disinflation turned out to be stickier than expected, while also awaiting clarity on the trade tariff front and its implications for inflation. Mounting risks to growth in many economies, on the other hand, have also led central banks across AEs and emerging market economies (EMEs) to pre-emptively reduce key policy rates. Domestic economic activity held up in June, with high-frequency indicators pointing to improving prospects of kharif agricultural season and continuation of strong momentum in the services sector. High-frequency indicators for industrial activity recorded modest growth in June. Growth in rural demand remained resilient and was accompanied by a recovery in urban economic activity. Amidst global economic uncertainties, the front-loading of spending by the central and state governments, with a focus on higher capex, is helping to offset some slowdown witnessed in private capex expenditure. India’s merchandise trade deficit narrowed in June 2025, due to contraction in both oil and non-oil trade deficit. Headline CPI inflation remained below the 4 per cent target for the fifth consecutive month in June, to fall to the second lowest inflation reading in the current CPI series. This was brought about by food moving into deflation – on the back of a broad-based shallower seasonal uptick in vegetable prices over last year and a marked moderation in prices of cereals, pulses and spices due to robust production. Core (CPI excluding food and fuel) inflation edged up primarily due to further increase in gold and silver prices and, at the margin, from an uptick in services inflation. Abstracting the impact of gold and silver prices, core inflation continued to remain benign. De-escalating geo-political tensions in the Middle East, optimism on trade deals and the easing of norms for infrastructure financing by the Reserve Bank buoyed up domestic financial market sentiments in the second half of June. In the first half of July, however, domestic markets traded with a negative bias as investor sentiment remained cautious amidst ongoing uncertainty over the potential India-US trade agreement and mixed corporate earnings results by companies in Q1:2025-26. On the credit side, bank credit growth moderated across key sectors in May 2025. This included a contraction in non-banking financial companies (NBFCs) bank credit on a year-on-year basis. NBFCs, however, raised a significant amount of debt from capital markets via private placements. While overall credit to the industrial sector witnessed subdued growth due to a decline in infrastructure lending, credit to the micro, small and medium enterprise (MSME) sector continued to remain strong. System liquidity remained in surplus, supported by a slew of liquidity augmenting measures by the Reserve Bank to ensure orderly market conditions while facilitating faster monetary policy transmission. The external sector remained resilient, backed by ample foreign exchange reserves and a moderate external debt-to-GDP ratio. Set against this backdrop, the remainder of the article is structured into four sections. Section II covers the rapidly evolving developments in the global economy. Section III provides an assessment of domestic macroeconomic conditions. Section IV encapsulates financial conditions in India, while Section V presents the concluding observations. Global economic activity, though registering an uptick in June, remains fragile pending clarity on trade tariffs. With just a handful of countries able to sign a trade agreement with the US by July 9, the further extension of the date of implementation of the new import tariff to August 1, 2025, has led to some momentary reprieve. Since then, Vietnam, Indonesia, Japan, and the Philippines have entered into trade deals with the US. The threat of new tariff hikes, in the absence of a trade deal, continues to loom over several countries (Chart II.1). Volatility and uncertainty receded, in general, tracking the progress in tariff negotiations of the US with several countries and the de-escalation in geo-political tensions (Chart II.2). Despite some moderation in overall uncertainty, persistent trade tensions and weak global geo-political environment continue to weigh on macroeconomic outlook.  The global composite purchasing managers’ index (PMI) rose to a three-month high in June, reflecting continued, albeit modest expansion in output and new business. The global manufacturing PMI returned to expansion territory after two months, driven by increased production in the intermediate and investment goods sectors. The services sector activity remained in expansion mode, notwithstanding a slight moderation, supported by financial services (Table II.1). PMI readings remained in the expansionary zone for major AEs and EMEs in June, signalling a sequential improvement in business activity. Major AEs, except Canada, Italy and Singapore experienced an uptick in June compared to the preceding month. Among major emerging market and developing economies (EMDEs), India and China showed improvement, but Brazil and Russia registered contraction in business activity (Chart II.3a). New export orders remained in contraction for most major economies, barring India, Germany and the US (Chart II.3b). The global supply chain pressure index eased to its historical average in June 2025 (Annex Chart A1).   Commodity prices witnessed a rebound in June, with both the World Bank commodity price index and the Bloomberg commodity index registering an increase. The uptick in global commodity prices was driven primarily by gains in energy, industrial metals, and precious metals on account of a slew of factors such as imposition of new trade tariffs by the US on imports and geo-political tensions, among others. Global food prices remained largely steady in June 2025, with an increase in the prices of vegetable oil, meat and dairy, partially offset by moderation in the prices of sugar and cereals (Chart II.4a).2 Oil prices surged in mid-June amidst escalating geopolitical conflict between Iran and Israel but later corrected following the announcement of a ceasefire and also from the decision of OPEC plus to increase production. Gold rallied in the first half of June on safe haven demand and a weakening US dollar but eased in the second half as geopolitical tensions subsided. In July so far, Bloomberg commodity price index moved with an upside bias amidst a range bound movement in crude oil prices and metals prices (Chart II.4b).  CPI inflation in major AEs registered an uptick in June, with the US, Euro area and the UK witnessing a pick-up due to increase in goods inflation amidst persistence in services inflation. Japan, however, saw some moderation in its inflation (Chart II.5a). Among EMEs, CPI inflation edged up marginally in Brazil, while it moderated in Russia. However, inflation remained elevated and above the target rate in both the countries. China moved out of the deflation zone after four months (Chart II.5b and Annex chart A2). Global stock indices rallied since end-June to record levels, driven by the Iran-Israel ceasefire agreement and improved earnings reported by large US companies (Chart II.6a). In June, the 10-year US G-Sec yield softened on rising expectations of a rate cut. Yields, however, began to rise in July following the passage of the new tax bill by the US Congress, on concerns about its implications for medium-term government debt trajectory. Treasury yields inched up further upon the release of higher June inflation data that showed signs of tariffs passthrough. EME bond spreads continued to widen on account of elevated global uncertainty raising risk premiums (Chart II.6b). The US dollar index weakened in June as investors grew wary of its safe haven appeal amidst increased debt concerns (Chart II.6c). Mirroring the dollar movement, the MSCI EME currency index increased with equity markets recording inflows (Chart II.6d). However, in July (up to July 18), the dollar strengthened, supported by stronger-than-expected non-farm payroll data, which helped ease investor concerns.    In their monetary policy meetings held in June and up to July 18, most AE central banks continued to hold or cut their policy rates, exercising caution amidst heightened uncertainties while supporting growth. In June, Canada, Japan, the UK and the US maintained status quo on rates, while the European Central Bank and Sweden lowered their policy rates by 25 basis points (bps) each in response to further moderation in inflation. Switzerland also reduced its key rate in June by 25 bps to zero amidst domestic deflation. Amongst EME central banks, Mexico, Philippines and Russia cut rates by 50 bps, 25 bps, and 100 bps, respectively. In contrast, Brazil raised its policy rate by 25 bps to its highest level since July 2006 in response to persistent inflationary pressures (Chart II.7). In July so far, while Australia, New Zealand, South Korea and China held policy rates steady, Malaysia and Indonesia reduced their rates by 25 bps each. Amidst a challenging global environment, the Indian economy showed resilience. High-frequency indicators suggest stability in aggregate demand. Growth momentum was buoyant for agriculture and services sector while the growth in industrial sector remained modest. Aggregate Demand The high-frequency indicators for overall economic activity showed mixed signals in June. E-way bills and toll collection showed strong growth, while growth in goods and services tax (GST) revenue collections moderated sharply in June (Table III.1). Petroleum consumption recorded a modest expansion, even as the growth of petrol, diesel, and air turbine fuel moderated.3 Electricity demand fell marginally, mainly due to reduced usage of cooling appliances amidst the early onset of monsoon.4 Volume of digital transactions exhibited robust growth in June. In value terms, digital transactions growth registered a pickup, despite a slowdown in unified payments interface (UPI) growth, on account of an uptick in the growth of real time gross settlements (RTGS).   High-frequency indicators for June signalled steady demand conditions. Urban demand witnessed a revival in June, recovering from the moderation in May. Rural demand remained resilient. Retail automobile sales growth moderated marginally but stayed above the average level5, while tractor sales recorded stronger growth. Household demand for employment under the Mahatma Gandhi National Rural Employment Guarantee Scheme (MGNREGS) remained elevated during June, indicative of continued reliance on alternative livelihood options during the pre-sowing lean agricultural period (Table III.2).  Employment indicators in June presented a mixed picture. The all-India unemployment rate remained unchanged from previous month at 5.6 per cent with rural areas faring better as compared to their urban counterparts.6 The labour force participation rate and worker population ratio declined marginally, driven by rural areas. The decline was influenced by seasonal agricultural patterns, intense summer heat limiting outdoor work, and a shift of unpaid helpers–particularly from higher-income rural households–towards domestic duties. Organised job listings, as per the Naukri JobSpeak Index, recorded strong growth, led by robust hiring in artificial intelligence/machine learning, insurance, hospitality, business process outsourcing/ information technology enabled services and real estate. PMI employment indices showed a pick-up in manufacturing employment index, to reach an all-time high in June. PMI employment index for the services sector also picked-up in June, though at a lower rate than May (Table III.3). Government Finances The key deficit indicators of the union government, viz., gross fiscal deficit (GFD), revenue deficit and primary deficit witnessed an improvement during April-May 2025 over the corresponding period of the previous year. While GFD was at 0.8 per cent of its 2025-26 BE as against 3.1 per cent of its BE during the corresponding period of the previous year, revenue surplus and primary surplus, in absolute terms, were higher than their corresponding levels during the same period in the previous year (Chart III.1a). On the receipts side, revenue receipts expanded by 24.0 per cent during April-May 2025-26 over April-May 2024-25, driven by growth in both indirect and direct taxes.7 The non-tax revenue recorded a growth of 41.8 per cent, led by higher growth in dividends and profits. The non-debt capital receipts recorded a higher growth in April-May 2025-26 as compared to the corresponding period of the previous year.   During April-May 2025, total expenditure grew by 19.7 per cent on a y-o-y basis, accounting for 14.7 per cent of the budget estimates for 2025-26. Revenue expenditure growth during April-May was largely on account of an increase in interest payments, though expenditure on major subsidies was lower compared to a year ago. Capital expenditure recorded robust growth during the first two months of 2025-26 and was at 19.7 per cent of the budgeted capital expenditure vis-à-vis 12.9 per cent during the same period a year ago, indicative of front-loading of capital spending by the central government (Chart III.1b). Key deficit indicators of states during April-May 2025, on the other hand, were higher than last year’s level (Chart III.2a). This was on account of a subdued growth in states’ revenue receipts (0.6 per cent y-o-y) while at the same time registering significantly higher expenditure growth. Muted growth was observed in both tax and non-tax revenue categories, alongside a sharp decline in grants from the union government (Chart III.2b). Among key tax components, growth in states’ goods and services tax (SGST)8 and state excise tax moderated, while sales tax/value added tax registered a pickup in growth as compared to last year. States’ revenue expenditure increased by 7.7 per cent, while capital expenditure witnessed a stronger growth of 13.5 per cent, buoyed by the ₹1.5 lakh crore outlay for 50-year interest-free loans in the Union Budget 2025-26.  Trade India’s merchandise exports contracted by 0.1 per cent (y-o-y) to US$ 35.1 billion in June, partly due to contraction in the price of petroleum, oil and lubricants exports (Chart III.3). Exports of 14 out of 30 major commodities (accounting for 30.5 per cent of the export basket in 2024-25) contracted on a y-o-y basis in June. Petroleum products, gems and jewellery, iron ore, cotton yarn/fabrics/made-ups, handloom products etc., and tobacco contributed negatively while, electronic goods, drugs and pharmaceuticals, engineering goods, marine products, meat, dairy and poultry products supported export growth in June. Exports to 12 out of 20 major destinations contracted in June 2025, including those to the UAE, Netherlands and the UK. However, exports to the US, China and Singapore expanded during the month. Mirroring exports, merchandise imports at US$ 53.9 billion declined by 3.7 per cent (y-o-y) in June, mainly due to a decline in gold imports volume and oil imports price (Chart III.4). Imports of 17 out of 30 commodities (accounting for 62.2 per cent of the import basket in 2024-25) registered contraction on a y-o-y basis in June. Petroleum, crude and products, gold, coal, coke and briquettes, etc., transport equipment, pearls, precious and semi-precious stones dragged imports down, while electronic goods, chemical material and products, machinery, electrical and non-electrical, metalliferous ores and other minerals, and vegetable oil supported import growth during the month. Imports from 10 out of 20 major source countries contracted in June. Among major trading partners, imports from the UAE, Russia and the US contracted while imports from China, Saudi Arabia, and Singapore expanded in June.   Merchandise trade deficit narrowed to US$ 18.8 billion in June 2025 from US$ 20.8 billion in June 2024. Oil deficit narrowed to US$ 9.2 billion in June from US$ 9.6 billion a year ago, whereas non-oil deficit narrowed to US$ 9.6 billion in June 2025 from US$ 11.3 billion a year ago. Consequently, its share in total trade deficit increased to 48.9 per cent in June from 45.9 per cent a year ago. In May, net services export earnings expanded by 23.7 per cent (y-o-y) to US$ 15.8 billion. While imports contracted by 1.1 per cent to US$16.7 billion, exports rose by 9.6 per cent to US$32.5 billion (Chart III.5).  Aggregate Supply Agriculture The south-west monsoon has covered the entire country nine days ahead of its usual date of July 8. The cumulative rainfall during June 1- July 21, 2025 at the all-India level stands at 6 per cent above its normal (Chart III.6). Reservoir levels have surged to a record high of 57 per cent of the full capacity (as on July 17, 2025), as compared to the corresponding period of the preceding years (Chart III.7). Early onset and timely progress of southwest monsoon have helped to boost kharif sowing to 708 lakh hectares (as on July 18, 2025), registering 4.1 per cent growth compared to the corresponding period of last year (Chart III.8). Among the major crops, rice, coarse cereals, moongbean and sugarcane showed higher sowing than previous year while oilseeds, arhar, uradbean and cotton recorded lower sowing. Kharif sowing has so far covered 65 per cent of the total normal kharif area.    Wheat procurement during 2025-26 has been significantly higher than last year, resulting in the largest wheat stockpile in four years with the Food Corporation of India (FCI).9 Stock of rice with FCI also remains well above the buffer norms.10 Industry and Services Industrial activity, as measured by the Index of Industrial Production (IIP), moderated to a nine-month low in May, driven by a contraction in mining and electricity output, while manufacturing registered modest growth. Among the use-based categories, primary goods, consumer durables, and consumer non-durables recorded a decline, whereas capital, infrastructure and construction goods posted robust growth. In June, index of Eight Core Industries edged up, driven by increase in production of steel and cement. Available high-frequency indicators for June point to modest industrial activity, with steady expansion in PMI manufacturing and strong growth in capital goods and steel output. Automobile production moderated in June, dragged down by passenger vehicle and two-wheeler. Conventional electricity generation remained subdued for the third consecutive month, driven by early rains and softer industrial output. In contrast, renewable energy generation sustained its pace [Table III.4]. Supply chain pressures eased in June 2025, falling below their historical average levels and reversing the brief uptick observed in May (Annex Chart A3).  According to the Report of the World Economic Forum on ‘Fostering Effective Transition 2025’, India is leading the clean energy investments in emerging markets.11 Reflecting India’s commitment under its Nationally Determined Contributions to achieve around 50 per cent of cumulative installed electric power capacity from non-fossil fuel sources by 2030, the country has reached a significant milestone in its energy transition journey. As of June 2025, non-fossil fuel sources account for 50.1 per cent of India’s installed power capacity—achieving the target five years ahead of schedule (Chart III.9). India’s services sector sustained its strong growth momentum in June, with PMI services recording the highest expansion in 10 months, driven by new business activity and hiring (Table III.5). Port traffic expanded for the seventh consecutive month in June, led by a higher growth in petroleum, oil and lubricants, other liquids and containerised cargo. Growth in construction sector indicators – steel consumption and cement production – remained robust in June.   Inflation Headline inflation, as measured by y-o-y changes in the all-India consumer price index (CPI)12, declined to 2.1 per cent in June 2025 (the lowest since January 2019) from 2.8 per cent in May (Chart III.10). The fall in headline inflation by 72 bps came from a favourable base effect of 133 bps, which more than offset a positive price momentum (m-o-m change) of 62 bps (Chart III.11). For the first time since February 2019, food group registered a deflation of (-) 0.2 per cent (y-o-y) in June as against an inflation of 1.5 per cent in May. This was driven by a deflation within vegetables, pulses, and meat and fish sub-groups. Inflation in cereals, fruits, milk and products, oils and fats, sugar and confectionery, and prepared meals moderated while that in eggs edged up (Chart III.12). Fuel and light inflation moderated to 2.6 per cent in June from 2.8 per cent in May. Inflation continued to remain elevated for LPG, while it moderated for firewood and chips. Kerosene prices continued to record deflation albeit at a lower rate.   Core inflation inched up higher to 4.4 per cent in June 2025 from 4.2 per cent in May. The increase in core inflation was primarily due to a sharp rise in inflation in the personal care and effects sub-group. Sub-groups such as recreation and amusement, household goods and services, health, transport and communication and education also recorded an increase in inflation. While clothing and footwear recorded lower inflation, that of pan, tobacco and intoxicants, and housing remained unchanged.  In terms of regional distribution, both rural and urban inflation eased further to 1.7 per cent and 2.6 per cent, respectively, in June, with a greater fall witnessed in rural inflation. While state-level inflation rates varied between (-) 0.93 per cent and 6.71 per cent, majority of the states experienced inflation of less than 4 per cent (Chart III.13). ") High frequency food price data for July so far (up to 18th) indicate a further decline in the prices of pulses and some pick-up in prices of cereals. Edible oil prices firmed up in July so far vis-à-vis June, mainly due to an increase in mustard and sunflower oil prices. The prices of palm oil, however, continued to soften. Among key vegetables, potato and tomato prices edged up further in July so far. Onion prices also registered a pickup reversing the trend of correction witnessed since December 2024 (Chart III.14). Retail selling prices of petrol and diesel remained broadly unchanged in July (up to 18th). Kerosene prices firmed up after witnessing a fall last month, while LPG prices remained unchanged (Table III.6). The PMIs for June recorded a deceleration in the rate of expansion of input prices for manufacturing and services. Selling price pressures also moderated for both services and manufacturing firms (Annex Chart A4).  Rural labour wage growth continued to increase in May 2025, driven by occupations in the non-agricultural sector. Increase in non-agricultural wage growth was primarily driven by occupations including sweeping/cleaning, light motor vehicle and tractor drivers, and mason workers. Agricultural wage growth, however, has remained unchanged compared to April 2025 (Chart III.15). Overall financial conditions remained relatively easy in July (till July 18, 2025), with easier financial conditions prevailing across the money, G-sec and forex markets (Chart IV.1). System liquidity remained in surplus during June and July (up to July 18, 2025), driven by higher government spending, lower-than-expected GST collections and a decline in currency in circulation. Reflecting these developments, the average daily net absorption under the liquidity adjustment facility (LAF) stood at ₹3.13 lakh crore during the period June 16 to July 18, 2025, exhibiting a significant increase over ₹2.39 lakh crore during the period May 16 to June 15, 2025 (Chart IV.2). On a review of the evolving liquidity dynamics, the Reserve Bank conducted six variable rate reverse repo (VRRR) auctions of varying maturities (2-day to 7-day), absorbing a cumulative amount of ₹6.91 lakh crore from the banking system. In general, the auctions had a bid-offer ratio14 below 1, i.e., the offered amount was lower than the notified amount, except for the two 7-day VRRR auctions, conducted on July 4 and July 18, which elicited strong response from banks with bid-offer ratios of 1.71 and 1.04, respectively.    With liquidity conditions remaining easy, the banks’ recourse to the marginal standing facility (MSF) averaged ₹0.01 lakh crore during the second half of June till mid-July, broadly similar to that during the period May 16 to June 15. Meanwhile, with liquidity absorbed through VRRR auctions, the average deployment in the standing deposit facility (SDF) moderated to ₹2.26 lakh crore during June 16 to July 18, 2025 from ₹2.55 lakh crore during the period May 16 to June 15, 2025. Money Market Amidst large surplus liquidity, the weighted average call rate (WACR) – the operating target of monetary policy – hovered near the floor of the LAF corridor. The spread of WACR over the policy repo rate averaged (-) 19 bps during the period June 16 to July 18, 2025, similar to the spread recorded during the period May 16 to June 15, 2025 (Chart IV.3a). Although there was a slight uptick in the WACR at the end of June due to month-end and quarter-end demand for liquidity, it subsequently eased in early July and remained in the range of 5.26-5.33 per cent. It again rose momentarily in mid-July following the Reserve Bank’s VRRR auctions. Overnight rates in the collateralised segments − the triparty and market repo − moved in tandem with the WACR. Following the recommendations of the Working Group set up to undertake a comprehensive review of trading and settlement timings of various markets regulated by it, the Reserve Bank, on June 25, 2025, announced changes in the market timings of both the collateralised and uncollateralised segment of the money market, to facilitate market development, enhance price discovery, and optimise liquidity requirements15.  Interest rates in the term money market also eased, with yields on 3-month treasury bills (T-bills), certificates of deposit, and 3-month commercial papers issued by NBFCs moderating during the period June 16 to July 18, 2025, as compared to the previous month (Chart IV.3b). The average risk premium in the money market – measured as the spread between 3-month commercial paper and 91-day T-bill yields – rose marginally to 81 bps during the current period from 77 bps in the preceding period. Government Securities (G-Sec) Market In the fixed income segment, bond yields moved with a moderate hardening bias especially across the longer tenors during the period June 16 to July 18, 2025, as compared to the period May 16 to June 15, 2025. During the same time, the average term spread (10-year G-sec yield minus 91-day T-bills yield) increased by 30 bps over the period May 16 to June 15, 2025, indicating a steepening of the yield curve (Chart IV.4a and IV.4b). Corporate Bond Market Corporate bond issuances remained high at ₹1.87 lakh crore up to May 2025, nearly twice the funds raised up to May 2024. Corporate bond yields generally rose while the corresponding risk premia exhibited mixed trends across tenors and rating spectrums during June 16 to July 11, 2025 (Table IV.1). Money and Credit Reserve Money, adjusted for the first-round impact of change in the cash reserve ratio (CRR), witnessed marginally higher growth when compared to a month ago.16 On the components side (liabilities), the growth in currency in circulation, the largest component of reserve money, remained strong. On the sources side (assets), growth in foreign currency assets decelerated.17 Gold – the other major component of net foreign assets– grew, mainly due to revaluation gains on gold prices. The pace of expansion (y-o-y) in money supply (M3) was marginally higher than a month ago (Chart IV.5).18,19  Credit growth of scheduled commercial banks20 accelerated to 10.4 per cent (y-o-y) as on June 27, 2025 (9.9 per cent (y-o-y) a month ago), mainly due strong momentum effect (Chart IV.6 and Annex Chart A5a). Scheduled commercial banks’ deposit growth21 accelerated to 10.3 per cent (y-o-y) as on June 27, 2025 (10.1 per cent (y-o-y) a month ago), mainly due to strong momentum effect (Chart IV.6 and Annex Chart A5b).  Average bank credit growth continued to moderate across key sectors of the economy in May 2025.22 As at end-May 2025, growth in non-food bank credit eased to 9.8 per cent (y-o-y) from 11.2 per cent (y-o-y) a month ago. Credit flows to all sectors moderated on a y-o-y basis during May 2025 compared to April 2025 (Annex Chart A6). Bank credit to NBFCs, on a y-o-y basis, contracted in May 2025; however, NBFCs raised significant amount of debt from the capital markets via private placements. Personal loans, the main driver of banks’ credit growth, also recorded a sharp deceleration, largely due to a decline in the growth of other personal loans, vehicle loans and credit card outstanding. The major contributor to the growth in personal loans has been housing loans. While overall credit to the industrial sector recorded a subdued growth due to a decline in credit growth to infrastructure, credit to the MSME sector continued to remain buoyant.  Deposit and Lending Rates In response to the 100-bps reduction in the policy repo rate since February 2025, banks have adjusted their repo-linked external benchmark-based lending rates downward by 100 bps and marginal cost of funds-based lending rate by 10 bps. Consequently, the weighted average lending rates on fresh and outstanding rupee loans of scheduled commercial banks declined by 26 bps (domestic banks - 24 bps) and 18 bps (domestic banks - 16 bps), respectively, during February-May 2025 (Table IV.2). On the deposit side, the weighted average domestic term deposit rates on fresh and outstanding deposits moderated by 51 bps and 2 bps, respectively, during the same period. During the current easing cycle (February-May 2025), the decline in weighted average lending rates on both fresh and outstanding rupee loans was higher for Public Sector Banks (PSBs) as compared to Private Sector Banks (PVBs) [Chart IV.7a]. On deposit side, the weighted average domestic term deposit rates for fresh deposits declined significantly for both PSBs and PVBs (Chart IV.7b). Banks have also reduced their rates on savings deposit. Currently, the savings deposit rates of some PSBs are prevailing at a historical low, since their de-regulation in 2011 (Chart IV.7c). The rates on small savings schemes were kept unchanged by the Government of India during Q2:2025-26.23 The prevailing rates on these instruments are higher than the formula-based rates by 33 - 118 bps. Equity Markets Notwithstanding intermittent volatility in the first half of June due to the Iran-Israel conflict, Indian equity markets sustained gains in the second half of June 2025 on positive global cues amidst de-escalation of geopolitical tensions in the Middle East and the easing of norms for infrastructure financing by the Reserve Bank. In July, however, domestic markets traded with a negative bias as investor sentiment remained cautious amidst ongoing uncertainty over the potential India-US trade agreement and mixed corporate earnings results by companies in Q1:2025-26 (Chart IV.8). ")   Resource mobilisation through initial public offerings showed a pick-up in recent months with improved sentiment in the secondary market, supporting a recovery in primary market activity (Annex Chart A7). Balance of Payments India’s current account balance recorded a surplus of US$ 13.5 billion (1.3 per cent of GDP) in Q4:2024-25 as compared with a surplus of US$ 4.6 billion (0.5 per cent of GDP) in Q4:2023-24 owing to higher net services exports in business and computer services, and higher remittances (Chart IV.9). For the full year 2024-25, the current account deficit moderated to US$ 23.3 billion (0.6 per cent of GDP) from US$ 26.0 billion (0.7 per cent of GDP) during 2023-24. Higher net invisibles receipts in services and personal transfers primarily drove this improvement. In terms of external financing needs, net capital flows fell short of financing the current account deficit owing to lower net inflows in foreign direct investment (FDI) and foreign portfolio investment (FPI). This led to a depletion of US$ 5.0 billion in foreign exchange reserves (on a BoP basis) during 2024-25. External Sources of Finance Gross inward FDI amounted to US$ 7.2 billion in May 2025, lower than US$ 8.7 billion in April 2025 and US$8.1 billion in May 2024 (Chart IV.10a). Singapore, Mauritius, the UAE and the US together accounted for more than three-fourths of total FDI inflows in May 2025, with manufacturing, financial and computer services being the top recipient sectors. On the other hand, both repatriation of FDI and outward FDI increased on a y-o-y basis. Top sectors for outward FDI included transport, storage and communication services, manufacturing, and financial, insurance and business services, and the major destinations included Mauritius, the US and the UAE (Chart IV.10b). Together, these movements resulted in muted net FDI inflows of US$ 0.04 billion in May 2025, as against US$ 2.2 billion in May 2024. Foreign portfolio investment registered net inflows of US$2.4 billion in June 2025, driven by the equity segment (Chart IV.11). Equity inflows rose due to enhanced global and domestic liquidity, a weakening US dollar, alongside easing geopolitical tensions. Financial services, oil, gas and consumable fuels, as well as automobile and auto components, emerged as the top recipient sectors. The debt segment remained flat due to a global risk-off sentiment and a weakening Indian Rupee (INR).  External Commercial Borrowing registrations slowed to US$5.7 billion during April-May 2025, down from US$ 8.3 billion during April-May 2024. Despite the slowdown, inflows outpaced outflows, resulting in positive net inflows of US$ 4.4 billion during April-May 2025 (Chart IV.12). Notably, nearly 48 per cent of the total external commercial borrowings registered during this period were intended for capital expenditure (capex), including on-lending and sub-lending for capex. 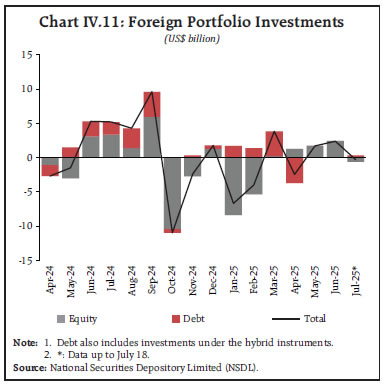  As on July 11, 2025, India’s foreign exchange reserves stood at US$696.7 billion, providing a cover for more than 11 months of goods imports24 and for 95 per cent of the external debt outstanding at end-March 2025 (Chart IV.13). India’s external debt rose by US$ 67.5 billion from end-March 2024 to US$ 736.3 billion at end-March 2025, with the external debt-to-GDP ratio increasing marginally to 19.1 per cent from 18.5 per cent a year ago (Chart IV.14a). India’s key external vulnerability indicators fared well relative to other large emerging markets (Chart IV.14b). India’s net International Investment Position improved to US$ (-) 330 billion during Q4:2024-25 from US$ (-) 364 billion during Q3:2024-25, on the back of an expansion in reserves, outward FDI, and currency and deposits, which was partially offset by an increase in inward FDI and external debt liabilities (Chart IV.15). As a result, the ratio of India’s international assets to international liabilities improved to 77.5 per cent as of March 2025.    Foreign Exchange Market The Indian Rupee (INR) depreciated by 0.8 per cent (m-o-m) vis-à-vis the US dollar in June, due to the escalation of geopolitical tensions following the Iran-Israel conflict, even as most EME currencies strengthened (Chart IV.16). Nevertheless, the INR remained among the least volatile major EME currencies.   In June 2025, India’s inflation (on a m-o-m basis) was 0.9 percentage points higher than the weighted average inflation of its major trading partners. Despite this, the INR depreciated (m-o-m) in real effective terms by 0.7 per cent as depreciation of the INR in nominal effective terms more than offset positive relative price differentials (Chart IV.17). As intense negotiations are underway for closing trade deals before the new import tariff rates kick in from August 1, 2025, the focus is back on US trade policies and their spillover effects globally. Financial markets, however, seem to have taken trade policy uncertainties in their stride, possibly reflecting optimism on reaching trade deals that are less disruptive to the global economy.25 Even so, under-pricing of macroeconomic risk by financial markets remains a concern. The average trade tariff rates are set to touch levels unseen since the 1930s. Moreover, risk of imposition of new high tariffs looms large for additional sectors. The evolving pattern of global trade flows and supply chains are far from settled. These uncertainties pose considerable headwinds to global economic prospects. Despite global uncertainties, the Indian economy remains largely resilient, supported by strong macroeconomic fundamentals. Easing inflation, improving kharif season prospects, front-loading of government expenditure, targeted fiscal measures and congenial financial conditions for faster transmission of rate reductions should support aggregate demand in the economy, going forward. Amidst rising trade uncertainties and geo economic fragmentation, building more resilient trade partnerships presents a strategic opportunity for India to deepen its integration with global value chains. In addition, measures to accelerate domestic investment in infrastructure and structural reforms aimed at improving competitiveness and productivity would build resilience while supporting the growth momentum.26 ") ")      * This article has been prepared by Rekha Misra, Asish Thomas George, Shashi Kant, Rajni Dahiya, Biswajeet Mohanty, Shreya Kansal, Yamini Jhamb, Bajrangi Lal Gupta, Harendra Kumar Behera, Gautam, Akash Raj, Ettem Abhignu Yadav, Radhika Singh, Alice Sebastian, Satyendra Kumar, Suganthi D, Pratibha Kedia, Paras, Nilava Das, Anjaly Maria Jose, Snigdha Yogindran, Ujjwal Kanti Manna, Shreya Gupta, Athira C A, Sai Dheeraj Vayugundla Chenchu, Satyam Kumar, Rajas Saroy, Samridhi and Avnish Kumar. The guidance and comments provided by Dr. Poonam Gupta, Deputy Governor, is gratefully acknowledged. Peer review by Jang Bahadur Singh, Atri Mukherjee and Abhinav Narayan is also acknowledged. Views expressed in this article are those of the authors and do not represent the views of the Reserve Bank of India. 1 As per the University of Michigan Consumer Sentiment Index and Conference Board Measure of CEO Confidence. 2 As per the Food and Agriculture Organization’s Food Price Index for the month of June 2025. 3 Growth in petroleum consumption was driven by coke, which recorded a growth of 18.9 per cent (y-o-y) in June 2025 vis-à-vis 6.0 per cent in May 2025. 4 Power consumption dips slightly by 1.5 pc to 150.04 bn units in June. 5 Average during the last 12 months, i.e., June 2024 to May 2025. 6 PLFS Monthly Bulletin June 2025. 7 Indirect taxes grew by 19.3 per cent (y-o-y) led by GST, while direct taxes grew by 5.1 per cent (y-o-y) driven by income tax collections. 8 States’ GST is the total of the GST revenues of the States/UTs and their share of IGST. During April 2025, ₹23,000 crore was settled to clear an old IGST shortfall, resulting in a decline in GST revenue of the States. https://tutorial.gst.gov.in/downloads/news/approved_monthly_gst_data_for_publishing_apr_2025.pdf 9 Procurement of 300 lakh tonnes as on July 1, 2025. 10 557 lakh tonnes as on July 1, 2025. 11 World Economic Forum. (n.d.). Fostering Effective Energy Transition 2025. https://reports.weforum.org/docs/WEF_Fostering_Effective_Energy_Transition_2025.pdf 12 As per the provisional data released by the National Statistical Office (NSO) on July 14, 2025. 13 The Financial Conditions Index (FCI) for India assesses the degree of relatively tight or easy financial market conditions with reference to its historical average since 2012. An FCI for India is constructed by using twenty financial market indicators at daily frequency for the period January 1, 2012, to July 9, 2025. The chosen indicators represent five market segments, namely (i) the money market; (ii) the G-sec market; (iii) the corporate bond market; (iv) the forex market; and (v) the equity market. For detailed methodology, refer to Bandyopadhyay, P., Kumar, A., Kumar, P. and Bhattacharyya, I. (2025), ‘Financial Condition Index for India: A High-frequency Approach’; Reserve Bank of India Bulletin, June, VOLUME LXXIX NUMBER 6. https://rbi.org.in/web/rbi/-/publications/rbi-bulletin/financial-conditions-index-for-india-a-high-frequency-approach-28142. 14 Amount of offers received/notified amount. 15 The market timings for call money transactions have been extended to 7:00 PM with effect from July 1, 2025. Accordingly, the revised market hours are from 9:00 AM to 7:00 PM. The trading hours for market repo and triparty repo (Triparty Repo Dealing System or TREPS) transactions will be extended to 4:00 PM with effect from August 1, 2025. Consequently, the revised trading hours will be from 9:00 AM to 4:00 PM. 16 7.7 per cent (y-o-y) as on July 11, 2025 (7.4 per cent (y-o-y) as on June 27, 2025). 17 Decelerated to 3.2 per cent (y-o-y) as on July 11, 2025, from 6.3 per cent (y-o-y) as on June 27, 2025. 18 Excluding the impact of the merger of a non-bank with a bank (with effect from July 1, 2023). 19 9.6 per cent (y-o-y) as on June 27, 2025, (9.5 per cent (y-o-y) a month ago). 20 Data are based on fortnightly Section 42 return. 21 Excluding the impact of the merger. 22 Sectoral non-food credit data are based on sector-wise and industry-wise bank credit (SIBC) return, which covers select banks accounting for about 95 per cent of total non-food credit extended by all scheduled commercial banks, pertaining to the last reporting Friday of the month. Data exclude the impact of the merger of a non-bank with a bank. 23 Department of Economic Affairs (Budget Division) - Ministry of Finance. (2025, June 30). Office Memorandum: Revision of interest rates for Small Savings Schemes - reg. https://dea.gov.in/sites/default/files/notification%2030.06.2025.pdf 24 The import cover for goods and services was around nine months. 25 Smith, I., and Herbert, E. (2025, July 10). Market Volatility Recedes as Investors Brush Off Donald Trump’s Tariff Threats. Financial Times. 26 India Tapping New Markets, Taking to Reforms to Fight Trade Curbs: Nirmala Sitharaman. (2025, July 8). The Economic Times. |

Share this page:


Install the RBI mobile application and get quick access to the latest news!
Scan the QR code to install our app


Page Last Updated on:


