State of the Economy - RBI - Reserve Bank of India


State of the Economy
|
Persistent geopolitical tensions, rekindled fears of a potential recession in key economies and financial market volatility in response to monetary policy divergence cast a shadow on global economic prospects even as inflation moderated grudgingly across countries. In India, aggregate demand conditions are gathering momentum with revival in rural consumption on the back of growing incomes. This stimulus to demand is expected to reinvigorate the hitherto subdued participation of the private sector in total investment. Headline inflation moderated from its spike in June to 3.5 per cent in July, but this was primarily due to the downward statistical pull of base effects. Introduction August 2024 arrived at the end of a defining week for central banks and for the global economy. Monetary policy divergence finally materialised to sum up the varied trade-offs facing the sentinels of stability. In the week ended August 2, the Bank of England (BoE) cut interest rates for the first time since 2020, joining the European Central Bank (ECB) which had reduced rates in June. The decision to cut rates with inflation on target made sense, while cautioning against expectations of consecutive cuts and echoing the ECB’s guidance given earlier that its September meeting was “wide open”.1 The day before, the US Federal Reserve held rates for the eighth time since September 2023 but signalled it is on the cusp of making its first cut - “We’re getting closer to the point at which it’ll be appropriate to reduce our policy rate”2. The Fed’s preferred measure of inflation – the personal consumption expenditure (PCE) deflator – was at 2.5 per cent in June, but unemployment, credit card delinquencies and jobless claims have risen under the pressure of elevated interest rates. On the previous day, the Bank of Japan (BoJ) responded to a weak yen and raised rates firmly into positive territory - for only the second time since 2007 – having ended eight years of negative interest rates and other remnants of its unorthodox policy in March. In that fateful week, the central banks of Brazil, Chile and Australia maintained status quo while those of the Czech Republic and Romania reduced policy rates. On Monday the week after, a bloodbath ensued in global financial markets, reminiscent of Black Monday of 1987. The rout began in Asia, with Japan’s Nikkei tumbling 12 per cent alongside a surging yen, following the rate decision of the week before. It was the worst single day drop since Black Monday. Incoming data sparking fears of imminent recession in the US sent gold prices to a record high and stoked a widespread sell-off, unleashing a global unwinding of high risk trade. The tech-heavy Nasdaq led the way, and equity prices slumped across the world. The Financial Times reported that Warren Buffett’s Berkshire Hathaway had sold half of its Apple shares. Prices of crude oil, other precious metals and bitcoin fell sharply while Wall Street’s fear gauge – the CBOE Volatility Index or VIX – jumped more than 50 per cent, its highest level since 2020, as set out in greater detail in Section II. Elsewhere too, VIXs soared. Benchmark yields ended lower than their previous week’s close and the mighty US dollar wobbled albeit with little relief for other currencies. The unwinding of the world’s biggest carry trade – borrowing in yen to fund investments in assets elsewhere that offer higher returns - severely jolted markets. The size of the trade is difficult to estimate because of its extensive use across hedge funds, companies and households. Built up since 2011, rough guesstimates place it at US$ 500 billion of which about two-fifths was liquidated.3 Evenahead of the unwind, commodity prices from copper to corn had been tumbling on flagging Chinese demand. The sell-off in copper, a bellwether for the global economy because of its wide-ranging use, has been particularly stark. On Tuesday (August 6), stock markets rebounded in a broad-based recovery on dovish guidance from the BoJ, suggesting that Monday’s events may have been a one-off although bearish sentiment has continued to prevail. The VIX dropped 23.7 points. Bond markets regained calm and companies of various credit ratings began issuing debt. Crude prices increased as tensions ran high in the Middle East. With US jobless claims coming in lower than expected, the US dollar rose along with US yields. Market views range from believing that the majority of the speculative bets have been liquidated to a more sombre opinion that there is still some way to go. On August 8, US equities surged, European stocks pared losses and equity prices in Asia were mixed. US treasuries hit their highest levels of the week as recession fears subsided and investors moved back to riskier assets. The yen weakened further against the US dollar. Just days before, the International Monetary Fund (IMF) presented a cautiously optimistic outlook for the global economy. In its view as explained in the following section, varied momentum of activity in 2024 is narrowing divergences across economies. As cyclical factors wane, output is getting better aligned with its potential. World trade is firming up; the growth of global trade is expected to align with the pace of global growth in 2024-25, thus keeping the trade/gross domestic product (GDP) ratio stable over the medium-term. At the same time, however, cross-border trade restrictions have increased and retailers are pulling forward overseas orders to get ahead of deepening shipping disruptions. Notably, rising shipping costs are not deterring US importers even though they face the risk of excess inventories ahead of the peak shopping season. The momentum of global disinflation is slowing, however, warranting caution in easing monetary policy. Financial conditions have been accommodative despite the upward drift in longer-term yields. The forecast for global growth for 2024 was maintained at the April 2024 assessment (of 3.2 per cent) while for 2025 it was raised by 10 basis points (to 3.3 per cent). For advanced economies (AEs), the projections remained broadly unchanged while for emerging market economies (EMEs) it was revised slightly upwards. Risks to the outlook were judged to be balanced although in the near-term, stickiness in inflation could destabilise the return to price stability. This, in turn, increases external, fiscal and financial risks due to higher for longer interest rates. Over the medium-term, productivity differentials warrant labour boosting reforms that better integrate women and immigrants. Domestically oriented inward-looking policies, including trade-distorting measures, could compromise the ability to tackle global challenges such as climate change. Accordingly, multilateral cooperation assumes crucial importance. On August 1, the World Bank warned of the gravitational pull of the middle-income trap as the prospects of over a 100 middle income countries – including India and other BRICS economies – face serious obstacles that could hinder their efforts to become high-income countries in the next few decades: rapidly aging populations; rising protectionism in AEs; and the need to speed up the energy transition. These countries are home to six billion people or 75 per cent of the global population and two out of every three people living in extreme poverty reside in them. The World Bank recommends that a fresh approach is needed: “first focus on investment; then add an emphasis on infusion of new technologies from abroad; and, finally, adopt a three-pronged strategy that balances investment, infusion, and innovation.”4 In its view, with growing demographic, ecological and geopolitical pressures, there is no room for error. In July, the United Nations drew attention to the evolving global demographic landscape. There is an 80 per cent probability that the world’s population will continue growing for another 50 or 60 years, reaching a peak of around 10.3 billion people in the mid-2080s, up from 8.2 billion in 2024. Rapid fertility declines in populous countries are likely to cause the global population to start declining thereafter, gradually falling to 10.2 billion people by the end of the century. One in four people globally lives in a country whose population has already peaked in size. In 63 countries containing 28 per cent of the world’s population in 2024, the size of the population has already peaked. In 48 countries and areas with 10 per cent of the world’s population in 2024, population size is projected to peak between 2025 and 2054. In the remaining 126 countries and areas, the population is likely to continue growing through 2054, potentially reaching a peak later in the century or beyond 2100. The number of women at ages 15–49 is projected to grow from nearly 2 billion in 2024 to a peak of around 2.2 billion in the late 2050s, driving continued growth even if the number of births per woman falls to the replacement level. Women today bear one child fewer, on average, than they did around 1990. Currently, the global fertility rate stands at 2.3 live births per woman, down from 3.3 births in 1990. More than half of all countries and areas globally have fertility below 2.1 births per woman, the level required for a population to maintain a constant size in the long run without migration. Early childbearing has harmful effects on young mothers and their children. In 2024, 4.7 million babies or about 3.5 per cent of the total worldwide, were born to mothers under age 18 and some 340,000 to girls under age 15 with serious consequences for the health and well-being of both the young mothers and their children. Investing in the education of youth, especially girls, and increasing the ages at marriage and first childbearing in countries where these milestone events tend to occur early will have positive effects on women’s health, educational attainment and labour force participation. Following the COVID-19 pandemic, global life expectancy is rising once again, having reached 73.3 years in 2024, an increase of 8.4 years since 1995. Since 2022, life expectancy has returned to pre-COVID-19 levels in nearly all countries and areas. Further reductions in mortality are projected to result in an average longevity of around 77.4 years globally in 2054. The main driver of global population increase up to the mid-century peak will be the momentum created by growth in the past. Today’s youthful age structure will account for 79 per cent of the population increase through 2054, adding about 1.4 billion people. Countries with youthful populations and declining fertility have a limited time to benefit economically from an increasing concentration of population in the working ages. In about 100 countries or areas, the working-age population (between 20 and 64 years) will grow through 2054, offering a window of opportunity in the form of the demographic dividend. To capitalise on this opportunity, countries must invest in education, health, and infrastructure, and implement reforms to create jobs and improve efficiency. By 2080, persons aged 65 or older is projected to reach 2.2 billion, outnumbering children under 18. By the mid-2030s, those aged 80 and over will reach 265 million and outnumber infants (1 year of age or less). Hence, countries that are at more advanced stages in the process of demographic ageing should consider the use of technology to improve productivity at all ages. They should also design more opportunities for lifelong learning and re-training, support multigenerational workforces and create opportunities to extend working lives for those who can and want to continue working. For some populations, immigration will be the main driver of future growth. In 50 countries and areas, immigration is projected to attenuate the decline in population size due to sustained low levels of fertility and an older age structure. However, in 14 countries and areas already experiencing ultra-low fertility, emigration is likely to contribute to reducing population size through 2054. Gender equality and women’s empowerment help to counter rapid population growth or decline. Raising the legal marriage age and integrating family planning into primary health care can enhance women’s education, economic participation, and reduce childbearing. In countries where populations have peaked already or are likely to peak in the next three decades, policies providing paid parental leave and flexible working arrangements, supporting affordable, high-quality childcare, providing comprehensive care for an ageing population; and encouraging an equal distribution of caregiving and household responsibilities between men and women can improve women’s labour participation, support families, encourage childbearing and increase economic security for men and women at older ages. The global average temperature for July 2024 at 16.91 degrees Celsius – the second warmest July on record after July 2023 – ended a streak of 13 monthly records.5 July 22 and 23 were the two hottest days on record for earth. During January-July 2024, the average temperature was 0.27 degrees higher than a year ago. Accordingly, climate scientists are warning that 2024 is on track to be the hottest year since 1901. After 15 months of consecutive records, sea surface temperatures also plateaued at high levels. This is consistent with the switch from El Nino to the cooling La Nina cycle that is expected to take over in the coming months, the implications of which for rainfall are discussed in Section III. India experienced 181 heatwave days in June, according to the India Meteorological Department (IMD), surpassing the previous high of 177 days in the year 2010.6 In the summer of 2024, India has undergone a total of 536 heatwave days,7 the highest after 2010. In its wake, cumulative precipitation in the southwest monsoon (SWM) season has achieved normalcy and is, in fact, above the long period average (LPA) since end-July, improving water storage and soil moisture. The flip side is that it has been unusually heavy in southern and central India but deficient in the east and north east. Meanwhile kharif sowing acreage has been higher year-on-year (y-o-y) in almost all crops barring cotton. An influential view has pointed out that agriculture has been the key focus of India’s development strategy, with the country achieving the highest annual growth rate of 5 per cent in the farm sector in the last seven years. Globally, the share of agriculture in GDP has risen from 3.2 per cent in 2006 to 4.3 per cent in recent years, saving many countries from economic collapse and bringing focus on to the issue of remunerative employment in the sector. These challenges necessitate a fresh appreciation of the role of sustainable agriculture in economic and human development in the face of threats of climate change, natural resource degradation and rising production costs.8 These issues also assume significance in the context of depressed conditions surrounding India’s agricultural exports, which recorded only a modest expansion by 0.7 per cent (y-o-y) in the first quarter of 2024-25. Apart from constraints in the form of logistics due to high shipping costs and air freight on account of geopolitical reasons, India’s agricultural exports are facing an erosion of cost competitiveness, including due to non-tariff barriers imposed by key markets. Turning to the manufacturing and service sectors, as set out in Section IV, early indicators of corporate performance in the first quarter of 2024-25 point to moderation in sales growth of manufacturing companies in both nominal and real terms, although excluding the petroleum sector, a better outturn emerges. Sales growth was resilient in the case of electrical machinery, automobiles, food products, pharmaceuticals and non-ferrous metals but muted in respect of iron and steel, cement, chemicals and textiles. Sales growth also remained low for information technology (IT) and non-IT service sector companies. Staff costs inched up in the manufacturing sector but debt servicing capability measured in terms of the interest coverage ratio9 remained stable. Against this backdrop, profit margins remained stable in both manufacturing and services sector. Moving away from the heat and dust around the recent release of the KLEMS10 database for the period 1980-2024, it is worthwhile to focus on some important insights into the sources of gross value added (GVA)/ gross value of output (GVO) in the Indian economy. The central purpose of the KLEMS exercise is to track the contribution of multi-factor productivity in the economy across sectors and over time. With this objective in the fore, GVA/GVO has to be ‘cleaned’ of the contributions of the primary factors of production, i.e., labour and capital, and those of intermediate inputs such as energy, materials and services to obtain a measure of total factor productivity growth. Information on primary and intermediate factors are obtained from national accounts statistics (NAS), periodic labour force survey (PLFS) and input-output transaction tables. The recent release shows that India’s total factor productivity (TFP) growth has remained higher than that of the rest of the world. In fact, TFP growth has emerged as one of the key drivers of aggregate GVA growth since 2007-08. Among the factors of production, capital contributed about 40 per cent and labour 33 per cent to GVA growth on an average during 2021-22 to 2023-24. The remaining 27 per cent of GVA growth was explained by TFP growth. In the manufacturing sector, the growth of the capital stock was the highest in industries such as electrical and optical equipment, machinery, rubber and plastic products, and chemicals. Among services, the growth of capital stock was highest in hotels and restaurants, health and social work, and education. Labour quality measured by workers’ skill content has grown and sustained across all sectors, with the composition of workers shifting towards higher educated categories with more remunerative jobs. Notably, labour’s contribution to gross output growth has improved in eight manufacturing industries, i.e., food products, leather and textile products, wood products, non-metallic mineral products, electrical and optical equipment, transport equipment, chemical products, and miscellaneous manufacturing including recycling. In recent years, rapid advancements in artificial intelligence (AI), including machine learning (ML), and large language models (LLMs), have unveiled the transformative potential of emerging technologies. By 2030, the global economy could witness a gain of US$ 15.7 trillion through the integration of AI technologies in business processes, labour augmentation, and product enhancement. It is projected that out of this sum, US$ 6.6 trillion will come from increased productivity and US$ 9.1 trillion from consumption-side effects (PWC, 2024)11. Projections for India suggest that AI could contribute around US$1 trillion to the economy by 2035 (Niti Aayog, 2020)12. Analysis of the AI use cases for India suggests that more than one-third relate to intelligent assistance. Another 25 per cent are directed towards marketing automation using various tools enabled by text generation and multimodal capabilities such as text-to-image and text-to-video, followed by 20 per cent for document summarisation, enterprise knowledge management and search. Companies are also interested in using GenAI to develop customer-facing chatbots for service and/or improved experience, coding assistants, and automating internal processes. In 2024, there has been an upsurge of activity relating to mergers and acquisitions (M&A) deals in the Indian AI market. This is indicative of a maturing and dynamic industry, driven by heightened investor interest, technological advancements and the increasing recognition of AI’s potential across various sectors. A significant portion of investments have been in early-stage companies (EY, 2024). Aggregate demand conditions are gathering momentum after some slack in the first quarter of 2024-25. Rural consumption spending on the back of growing incomes is beginning to drive volume growth in fast moving consumer goods (FMCG), reflecting strengthening fundamentals.13 Utility penetration – LPG; electricity; two-wheelers - is bringing with it additional spends alongside newly adopted categories, including toilet and floor cleaners, bottled soft drinks and insecticide. Rural saving is also on the rise as evident in rising number and outstanding amounts of savings bank accounts.14 Receding of inflation pressures appear to be the most important metric in rural spending resurgence, driving a catch-up with urban consumption volumes. The average rural consumer is getting increasingly price conscious. Reflecting these forces of turnaround, FMCG companies are starting to see green shoots of revival, portending a seismic shift in their markets as price stability sets in and expectations of a better monsoon as well as higher budgetary allocations for the rural economy push up volume growth. These factors which act as stimuli to demand are expected to reinvigorate the hitherto subdued participation of the private sector in total investment, a key accelerator of overall growth of the economy in view of higher levels of productivity and innovation. There are some lead indications already of new capacity creation in a few industries and a pick-up in investment intentions. Overall business sentiment has also shown an improvement as reflected in the rising business confidence index of the National Council of Applied Economic Research (NCAER), with an increase in the share of polled firms expecting overall economic conditions to improve in the next six months. Overseas fund raising by Indian companies is experiencing a revival, driven by international investor interest, improving liquidity conditions and reduced hedging costs. Several banks and non-banking financial companies (NBFCs) have also started diversifying funding sources by recourse to bond issuances overseas in order to cater to the upturn in demand for funding by corporates. In particular, the offshore syndicated loan route is turning lucrative for corporates on expectations of an imminent rate cutting cycle. While existing borrowers are making large size issuances, the market is also seeing debut borrowers. The shift in fund raising to overseas markets is also reflecting the changing dynamics of domestic credit markets. Banks are preparing to raise equity funds-including through qualified institutional placements-of nearly ₹40,000 crore in the second half of the current financial year in order to reinforce balance sheets and support capital expansion.15 In the quarter ending June 2024, banks have been impelled to increase mobilisation of funds through certificates of deposit and through high value saving accounts and fixed deposits. Going forward, the low share of low-cost current and saving deposits in total deposits may curb domestic fund raising efforts of banks through high cost funding options, due to a likely squeeze on banks’ net margins. This may also force banks to align loan growth more closely with deposit growth and normalise incremental credit-deposit ratios. In part, this behavioural shift may be induced by signs of stress in the unsecured loan segments, especially in personal loans and credit cards portfolios. There are reports of banks monitoring signs of over-leveraging in these segments more closely.16 As presciently pointed out, “The Indian financial system remains resilient and is gaining strength from broader macroeconomic stability. Its well-capitalised and unclogged balance sheet is reflective of higher risk absorption capacity….. Even in such stable financial sector conditions, the emphasis cannot shift away from proactive identification of potential risks and challenges…”17 Moreover, favourable demand-supply dynamics, comfortable liquidity and recent volatility in stocks has led to a rally in gilt prices, bringing the benchmark 10-year yield to its lowest level in two years. This, in turn, is reducing funding costs for corporates taking the bond route for raising resources. Banks too are ramping up infrastructure bond issuances at attractive coupons relative to interest rates on fixed deposits. Apart from the cost advantage, funds raised by banks through bonds are free of reserve requirements and can be fully deployed for lending activities, besides helping to manage asset-liability mismatches in view of the relatively long tenure of bonds. Infrastructure bonds offer attractive spreads and have strong appeal among long-term investors. There are also signs of revival of net exports as a lever of India’s growth. After the contraction in 2023-24, outbound shipments from India are undergoing an expansion in 2024-25 so far. Barring China, nine of the top 10 destinations accounting for about half of the total value of exports are recording growing demand. India’s export basket is also undergoing a shift towards electronics and engineering goods even as traditional products such as gems and jewellery, textiles, garments, leather products and marine products are losing competitiveness. Business services that support operations such as consulting, engineering, research and design are rapidly becoming India’s export powerhouse, surpassing software and information technology. They also cover advertising, public relations, logistics, accounting, auditing, architectural and legal services. The rising demand for specialised services and the integration of services into manufacturing are forces driving this growth. Global capability centres are setting the next steps in this export drive, including in the evolution of business and knowledge process outsourcing. Logistics are also improving as India’s ports and shipping are experiencing strategic infrastructure development, technological advancements and transformation. In particular, port development is expanding cargo handling capacity and connectivity. RFID-based port access control is stepping up security and operational efficiency while public-private partnerships are helping to drive growth. Of the 166 projects initiated at major ports under Sagarmala,18 90 have been completed resulting in capacity increase of over 230 million tonnes per annum. Access to 100 per cent foreign direct investment (FDI) and a 10-year tax holiday is also incentivising the development, maintenance and operation of ports. As anticipated, headline consumer price index (CPI) inflation moderated from its spike in June to below the target of 4 per cent in July, but this was primarily due to the downward statistical pull of large base effects that concealed the strong price build-up in the food category. The price momentum in the food category in the CPI in July was much higher than long period averages. This has also propelled CPI headline momentum above trend. The vegetable price shocks that started in June 2024 continued unabated in July, reflecting the sustained impact of heat wave conditions and supply disruptions due to floods. Key food items like pulses are exhibiting double digit inflation along with elevated cereals inflation. Core inflation registered an uptick after registering a period of sustained sequential softening between June 2023 to May 2024, primarily reflecting the impact of mobile tariff revisions. These developments impart an upside to the overall inflation outlook. The monetary policy committee (MPC), in its latest meeting during August 06-08, 2024, retained its forecast of real GDP growth for 2024-25 at 7.2 per cent and inflation at 4.5 per cent while maintaining status quo on the policy rate at 6.5 per cent and the stance of withdrawal of accommodation.19 Expecting domestic growth to hold up on the strength of investment and consumption demand, the committee flagged risks from volatile and elevated food prices adversely impacting inflation expectations and potentially spilling over to core inflation which showed indications of bottoming out. The MPC decided to stay resolute in its commitment to aligning inflation to the 4 per cent target on a durable basis. In its view, enduring price stability sets strong foundations for a sustained period of high growth. Set against this backdrop, the remainder of the article is structured into four sections. Section II covers the rapidly evolving developments in the global economy. An assessment of domestic macroeconomic conditions is set out in Section III. Section IV encapsulates financial conditions in India, while the last Section sets out concluding remarks. The global economic outlook remains uncertain. Persistent geopolitical tensions, rekindled fears of a potential recession on signs of weaker than expected labour market outcomes in key economies and financial market volatility in response to monetary policy divergence to cast a shadow on prospects even as inflation moderated grudgingly across countries. Our model-based nowcast points towards global growth momentum remaining stable in Q2:2024 (Chart II.1).   The global supply chain pressures index (GSCPI) increased in July 2024 for the third consecutive month, bringing it closer to its historical average (Chart II.2a). The global container cost index remained elevated in July 2024, indicating persisting supply chain disruptions (Chart II.2b). Geopolitical risks continue to remain significant, driven by escalating tensions in the Middle East (Chart II.2c). In July 2024, consumer confidence in the US declined to an eight-month low whereas sentiment in the Eurozone and the United Kingdom (UK) showed signs of improvement (Chart II.3a). Financial conditions tightened in AEs like the UK and the Eurozone, while they eased in EMEs (Chart II.3b).   The global composite purchasing managers’ index (PMI) moderated for the second month in a row although it remained in expansionary zone for the ninth consecutive month. The manufacturing PMI slipped below the neutral threshold, after remaining in expansion for five consecutive months, due to a slowdown in output growth and a decline in new orders. The services PMI, however, increased in July as services providers saw an increase in new work intake for the ninth successive month (Chart II.4). The composite PMI for export orders remained unchanged in July, with a slowdown in services export orders offset by a marginal increase in manufacturing export orders (Chart II.5).   Global commodity prices recorded significant declines in July, driven by softening prices of base metals, agricultural products, and energy. The Bloomberg commodity index declined by 4.5 per cent (m-o-m) in July (Chart II.6a). Brent crude oil prices declined by 6.0 per cent in July over demand concerns, fuelled by lower than expected Chinese GDP data and signs of the cooling US labour market. The loss of momentum continued into the first week of August, but crude oil prices recovered in the following week, hovering around US$ 80 per barrel (Chart II.6b). The Food and Agriculture Organization’s (FAO’s) food price index registered a marginal decline in July 2024 as a reduction in the price of cereals more than offset the increases in the prices of vegetable oils and dairy (Chart II.6c). Gold prices increased by 3.0 per cent in July due to increased optimism about the US Fed’s rate cuts, weakening of the US dollar, and safe haven flight in response to escalation of global geopolitical tensions (Chart II.6d). Headline inflation continued to recede across major economies, although services inflation remained high. In the US, CPI inflation moderated to 2.9 per cent (y-o-y) in July from 3.0 per cent in June. Inflation in terms of the PCE deflator softened to 2.5 per cent in June from 2.6 per cent in May. As per flash estimates, euro area inflation edged up to 2.6 per cent in July from 2.5 per cent in June. Inflation in Japan (CPI excluding fresh food) edged up to 2.6 per cent in June, while in the UK, headline inflation rose to 2.2 per cent in July (Chart II.7a). Among EMEs, inflation increased in China, Brazil and Russia while it softened in South Africa (Chart II.7b). Core and services inflation trended downwards in AEs although they remained higher than the headline in most of them (Chart II.7c and 7d).  Reflecting recessionary concerns in the US, global equity markets declined sharply in the first week of August. However, they recovered in the following week due to better than expected weekly jobless claims data (Chart II.8a). US government securities (G-secs) yields on both 10-year and 2-year bonds softened by 37 bps and 50 bps, respectively, in July. Yields continued to decline in the first week of August, dropping below 4 per cent for the first time in seven months in response to the release of underwhelming employment data. However, yields showed a hardening bias in the second week due to a partial reversal of negative sentiment (Chart II.8b). In the currency markets, the US dollar weakened by 1.7 per cent in July. On the other hand, the Morgan Stanley Capital International (MSCI) currency index for EMEs remained range bound in July due to volatile capital flows to the EMEs, mainly in the equity segment (Chart II.8c and II.8d). India’s share in the MSCI emerging markets index has been increasing in recent years, driven by strong macro fundamentals and robust growth in earnings of Indian companies. This growth has elevated India’s share to close to 20 per cent, narrowing the gap with China which has a weight of 24.2 per cent (Chart II.9).   The US stock market volatility index (VIX), commonly known as the Wall Street’s “fear gauge” shot up in early August due to weaker employment data in the US and the disorderly unwinding of Yen carry trade after the Bank of Japan hiked its policy rate on July 31, 2024 (Chart II.10). Subsequently, markets recouped part of the losses as sentiments normalised which was also reflected in a decline in the VIX post August 5. Among AE central banks, the US Federal Open Market Committee (FOMC) on July 31, 2024 decided to maintain the target range for the federal funds rate at 5.25 to 5.50 per cent and indicated that the Committee will carefully assess incoming data, the evolving outlook and the balance of risks while considering any future adjustments to this target range. The UK cut its benchmark rate by 25 bps to 5.0 per cent in its July meeting. Canada cut its policy rate for the second consecutive meeting by 25 bps to 4.5 per cent in July. Japan hiked its key rate to around 0.25 per cent from a range of 0.0-0.1 per cent as inflation continued to remain above the target (Chart II.11a). In case of EME central banks, China lowered its 1-year loan prime lending rate by 10 bps to 3.35 per cent amidst an economic slowdown. In contrast, Russia hiked its benchmark rate by 200 bps to 18 per cent due to inflation level ruling well above the target (Chart II.11b).   The Indian economy remained resilient despite headwinds from supply chain pressures due to the rise in global freight and container costs, and semiconductor shortages (Chart III.1a). According to the latest round of the Reserve Bank’s survey of households, consumer confidence reflected a sequential moderation in expectation within the optimism zone and the assessment of the current situation remained pessimistic (Chart III.1b). Capacity utilisation (CU) in the manufacturing sector recorded an increase during Q4:2023-24, although it remained flat on a seasonally adjusted basis. There was a tempering of manufacturers’ optimism on aggregate demand conditions (Annex 1). Our economic activity index (EAI), based on a range of high frequency indicators, projects GDP growth of 7.2 per cent in Q2:2024-25 (Charts III.1c and III.1d). Aggregate Demand High frequency indicators suggested that demand conditions remained firm in July 2024 with e-way bills recording a growth of 19.2 per cent (y-o-y) [Chart III.2a]. Toll collections increased by 9.4 per cent (y-o-y) in July 2024 (Chart III.2b). Automobile sales recorded a growth of 9.5 per cent (y-o-y) in July 2024, led by two-wheeler segment (Chart III.3a). Domestic tractor sales registered a modest rise in July (Chart III.3b). Vehicle registrations recorded robust double digit growth in July, driven by both transport and non-transport segments (Chart III.3c). Average daily petroleum consumption grew by 7.4 per cent (y-oy) in July 2024, driven by motor spirits (petrol) and aviation turbine fuel (ATF) [Chart III.3d].   India added 12,156 MW of solar capacity in H1:2024, which is 21 per cent higher than the entire installations during the year 2023. With this, 2024 is expected to be the eighth consecutive year of renewables dominated capacity addition, with solar contributing to more than 50 per cent of the total installed capacity addition since 2020 (Chart III.4). The significant rise in solar additions is attributable to the falling cost of solar panels and exemption from the approved list of models and manufacturers (ALMM) until March 2024.   As per the PMI employment indices, organised manufacturing employment recorded its fifth consecutive month of expansion in July 2024, driven by strong demand, albeit with a sequential moderation from a 19 year high in June. The rate of job creation in services sector remained among the strongest in two years (Chart III.5). Household’s demand for work under the Mahatma Gandhi National Rural Employment Guarantee Act (MGNREGA) declined by 28.4 per cent (m-o-m) and 19.5 per cent (y-o-y) in July, reflecting higher demand for labour for kharif sowing (Chart III.6).   India’s merchandise exports at US$ 34.0 billion contracted by 1.5 per cent (y-o-y) in July 2024 on account of a sequential (m-o-m) moderation by 3.4 per cent (Chart III.7). Although the overall exports contracted, only 12 out of 30 major commodities (accounting for 42.1 per cent of export basket) witnessed a decline on a y-o-y basis. Petroleum products, gems and jewellery, chemicals, rice, ceramic products and glassware contributed to the contraction in the month of July, while electronic goods, engineering goods, drugs and pharmaceuticals, meat, dairy and poultry products, and ready-made garment (RMG) of all textiles contributed positively to export growth (Chart III.8). However, on a cumulative basis, during April-July 2024, India’s merchandise exports expanded by 4.1 per cent to US$ 144.1 billion, primarily led by electronic goods, engineering goods, drugs and pharmaceuticals, RMG of all textiles, and plastic and linoleum.   Destination wise, exports to 13 out of 20 major destinations contracted in July, although exports to top 3 destinations, viz., the US, the UAE and the Netherlands recorded an expansion. During 2024-25 so far (April-July), exports to 12 out of 20 major destinations witnessed an expansion. Merchandise imports at US$ 57.5 billion expanded by 7.5 per cent (y-o-y) in July, driven by a positive momentum (Chart III.9). Out of 30 major commodities, 19 commodities (accounting for 75.2 per cent of import basket) registered growth on a y-o-y basis.   Petroleum, crude and products, electronic goods, non-ferrous metals, coal, coke and briquettes, and vegetable oil contributed positively, while pearls, precious and semi-precious stones, gold, chemical material and products, fertilisers, and transport equipment were the main drags (Chart III.10). During April-July 2024, India’s merchandise imports increased by 7.6 per cent (y-o-y) to US$ 229.7 billion, mainly led by petroleum, crude and products, electronic goods, non-ferrous metals, vegetable oil, and pulses. Imports from 13 out of 20 major source countries expanded in July and April-July 2024, with robust growth for top 3 source countries, viz., China, Russia, and the UAE. The merchandise trade deficit widened to US$ 23.5 billion in July 2024, the highest in the last nine months, from US$ 19.0 billion in July 2023. The share of POL in total merchandise trade deficit increased to 36.8 per cent in July 2024 from 26.8 per cent a year ago (Chart III.11). During April-July 2024, India’s merchandise trade deficit widened to US$ 85.6 billion from US$ 75.1 billion a year ago. Petroleum products were the largest source of the deficit, followed by electronic goods (Chart III.12).   The Union Budget 2024-25 announced the rationalisation of customs duties to support domestic manufacturing, deepen local value addition, promote export competitiveness, and correct the inverted duty structure. The customs duties have been reduced on 52 major goods spanning multiple sectors such as aquafarming and products, critical minerals, precious metals, leather and textiles, metals, electronics, medical equipment, capital goods for petroleum exploration and the manufacture of solar cells and modules, shipping, etc. Other measures include supporting the mission for pulses and oilseeds, the development of e-commerce export hubs, reforms for the shipping industry, and trade facilitation. These measures are intended to strengthen India’s logistics, reduce imports, and boost exports in emerging areas. The announcement in the budget to reduce the customs duties on cellular mobile phones and certain inputs such as charger, adapter, etc., is expected to boost production and exports of mobile phones. With the introduction of Production Linked Incentive (PLI) scheme for mobile phones and electronics manufacturing in March 2020, the share of mobile phones in electronic goods exports increased from 3.3 per cent in 2017-18 to 53.5 per cent in 2023-24 (Chart III.13). Mobile phones exports expanded by 23.6 per cent (y-o-y) to US$ 29.1 billion in 2023-24. In 2024-25 (up to May), mobile phones exports increased by 35.4 per cent to US$ 3.3 billion. A study by the India Cellular and Electronics Association (ICEA)20 on tariff on smart phones across competing economies suggests that India continued to have the highest input tariffs, significantly higher than China and Vietnam. According to the ICEA, increasing participation in global value chains by maintaining low tariffs have proven to be effective strategies for enhancing a country’s export capabilities in the electronics sector. In June 2024, services exports at US$ 28.8 billion grew by 3.7 per cent (y-o-y), whereas services imports declined by 3.8 per cent (y-o-y) to US$ 15.0 billion (Chart III.14). Consequently, net services export earnings grew by 13.2 per cent (y-o-y) to US$ 13.8 billion.   All major key deficit indicators, viz., the gross fiscal deficit (GFD), the revenue deficit (RD) and the primary deficit (PD) of the Union government witnessed a moderation both in absolute terms as well as in relation to budget estimates (BE) during Q1:2024-25 relative to the corresponding period of the previous year (i.e., Q1:2023-24).21 The GFD was at 8.4 per cent of the BE during Q1:2024-25, the lowest in more than a decade (Chart III.15a). Moreover, revenue and primary surpluses were recorded (Chart III.15b). This improvement in the financial position occurred on the back of a strong and broad-based growth in the revenue receipts. The total expenditure of the Union government (at around ₹9.7 lakh crore), on the other hand, contracted by 7.7 per cent during Q1:2024-25 on a y-o-y basis.   On the receipts side, gross tax revenue recorded a growth of 23.7 per cent during Q1:2024-25, with direct and indirect taxes registering an increase of 41.5 per cent and 6.1 per cent, respectively, on a y-o-y basis. Under direct taxes, both corporation tax and income tax registered double digit growth. Under indirect taxes, GST collections recorded a growth rate of 9.1 per cent (Chart III.16a). With surplus transfer of ₹2.11 lakh crore from the Reserve Bank, non-tax revenue receipts recorded a growth of 80.7 per cent (y-o-y) [Chart III.16b]. On the other hand, the non-debt capital receipts registered a contraction of 57.8 per cent on a y-o-y basis. Overall, total receipts recorded a y-o-y growth of 39.2 per cent. The gross GST collections (Centre plus States) for the month of July 2024 stood at ₹1.82 lakh crore with a growth of 10.3 per cent (y-o-y) [Chart III.17]. After accounting for refunds, net GST collections grew by 14.4 per cent on a y-o-y basis. Gross GST collections during April-July 2024 grew by 10.2 per cent (y-o-y) to ₹7.39 lakh crore. The Union Budget 2024-25 announced on July 23, 2024 struck a balance between fiscal consolidation and macroeconomic stability. The budget continued with a thrust on capex and made proposals for boosting employment generation and skill development. For 2024-25, non-debt receipts are budgeted to rise to 9.8 per cent of GDP from 9.4 per cent in 2023-24 (provisional accounts or PA), whereas the total expenditure is budgeted to moderate to 14.8 per cent of GDP from 15.0 per cent of the GDP a year ago. Concomitantly, the GFD is budgeted at 4.9 per cent of GDP in 2024-25, lower than 5.6 per cent recorded for 2023-24 (PA).   As per the data available for Q1:2024-25, growth in States’ revenue receipts moderated on account of a slowdown in tax revenue growth and a contraction in grants from the Union government. Within States’ own tax revenue, the growth in States’ goods and services tax (SGST) and excise duties moderated, while sales tax/VAT increased over a year ago. Non-tax revenue, however, witnessed robust growth partly due to the low base effect. On the expenditure side, revenue expenditure growth decelerated in Q1:2024-25 and the growth in capital expenditure declined on a y-o-y basis (Chart III.18a and Chart III.18b). As per the Union Budget 2024-25, gross transfers to States are budgeted to increase, primarily due to higher tax devolution, special assistance for capital expenditure and transfers under centrally sponsored schemes. In contrast, finance commission grants are budgeted to decrease, mainly due to lower post devolution revenue deficit grants. Notably, a provision of ₹1.5 lakh crore for long-term interest-free loans has been made for 2024-25, which could assist States in boosting their capital expenditure (Chart III.19).   Aggregate Supply As on August 11, 2024, the cumulative SWM rainfall was 7 per cent above the LPA as against 1 per cent below the LPA during the same period last year (Chart III.20). The production weighted rainfall index (PRN) was at 103 per cent as on August 12, 2024 (Chart III.21). After a lacklustre performance in June, rainfall activity picked up from early July, closing the deficit. The PRN remained in surplus (above 100) for all the major crops (Chart III.22).   As per the IMD, out of 36 sub-divisions, 19 recorded rainfall of 5 per cent above the LPA as on August 12, 2024. The spatial dispersion of SWM rainfall was higher than in the previous year as well as for the last five years’ average. The spatial dispersion, however, narrowed in July from June indicating that the pick-up in monsoon activity was broad based (Chart III.23).   The rainfall during the second half of the season (August -September) is most likely to be above normal22, with normal to above normal rainfall activity predicted over most parts of the country23 (Chart III.24). The neutral El Nino-Southern Oscillation (ENSO) condition currently prevailing in the equatorial Pacific region is likely to develop into La Nina (which is typically associated with increased rainfall activity) towards the end of August. The reservoir levels (as of August 08, 2024) were 65 per cent of the full reservoir level, a significant increase from 22 per cent a month ago (July 04). Currently, the reservoir levels are 6.5 per cent and 20.6 per cent higher than the level during last year and the decadal average, respectively (Chart III.25). As on August 09, 2024 the total kharif sown area stood at 979.9 lakh hectares (89.4 per cent of full season normal area), which is 1.4 per cent higher than the corresponding period last year and 1.2 per cent above the normal level of sowing as on date.24 The area under all crops except cotton remained higher than last year (Chart III.26). The area sown under paddy25 progressed steadily despite below LPA rainfall in some of the key producing states in the eastern region.  India’s manufacturing PMI moderated marginally in July 2024 due to a slowdown in new orders and employment. However, future output in July 2024 was slightly better than in the previous month (Chart III.27a). The services sector PMI also moderated marginally in July. However, business expectations about future activity rebounded in July, driven by strong demand (Chart III.27b).   Freight transport continued its robust performance in July 2024. Port traffic increased by 6.0 per cent (y-o-y), boosted by thermal coal, container and other miscellaneous cargo (Chart III.28a). Railway freight traffic also accelerated in June led by coal and iron ore shipments (Chart III.28b). The construction sector exhibited a mixed outlook, with steel consumption expanding by 14.6 per cent in July and cement production rising by a modest 1.9 per cent in June (Chart III.29).   Available high frequency indicators for the services sector reflect the resilience of activity in July 2024 (Table III.1).  Inflation Headline inflation, as measured by y-o-y changes in the all-India CPI26, moderated sharply to 3.5 per cent in July 2024 from 5.1 per cent in June 2024 (Chart III.30). The 154 bps fall in inflation was on account of a favourable base effect of 2.9 per cent which more than offset a positive momentum of 1.4 per cent. Within overall CPI, prices increased by 2.5 per cent (m-o-m) in the food group and 0.5 per cent in the core group (i.e., excluding food and fuel) whereas the fuel group recorded a 0.2 per cent decline in prices over the previous month. Food inflation (y-o-y) declined to 5.1 per cent in July from 8.4 per cent in June, driven by a favourable base effect of 5.7 per cent which more than offset a strong momentum. In fact, the momentum of food prices at 2.5 per cent in July, over and above the momentum of 2.7 per cent recorded in June, indicates continuing build-up of underlying price pressures within the food group. In terms of sub-groups, inflation moderated in cereals, fruits, vegetables, pulses, sugar and non-alcoholic beverages but edged up in respect of meat, fish, eggs, and prepared meals. Spices prices slipped into deflation while edible oils and fats recorded a lower rate of deflation. Vegetable prices inflation declined precipitously to 6.8 per cent in July from 29.3 per cent in June, recording its first single digit print in nine months. This was disproportionately driven by tomato prices. Despite a m-o-m price increase of 41.8 per cent in July 2024, y-o-y inflation in tomato prices plummeted on account of the base effect of the unprecedented price increase of 214.3 per cent recorded a year ago (July 2023). Fuel and light deflation deepened to (-)5.5 per cent in July from (-)3.6 per cent in June. The CPI fuel group has been registering deflation for 11 consecutive months, reflecting the cumulative impact of sharp LPG price cuts in August 2023 and March 2024. This deflation deepened further in July due to kerosene prices slipping into deflation and a moderation in electricity and ‘firewood and chips’ inflation. Core inflation edged up to 3.3 per cent in July 2024 from its historic low (in the current CPI (2012=100) series) of 3.1 per cent in May and June. A strong pick-up in momentum to 0.5 per cent in July from 0.1 per cent in June contributed to the increase in core inflation. While inflation increased in the transport and communication sub-group (primarily on account of increase in mobile tariffs) and personal care and effects, it remained steady for sub-groups such as clothing and footwear, housing, and health. Pan, tobacco and intoxicants, recreation and amusement, household goods and services, and education, however, recorded a softening in inflation (Chart III.32).   In terms of regional distribution, inflation eased in both rural and urban areas in July, with rural inflation at 4.1 per cent being higher than urban inflation at 3.0 per cent. All the states registered inflation less than 6 per cent (Chart III.33). High frequency food price data for August so far (up to 12th) show that the price of cereals, pulses and edible oil recorded a broad-based moderation. Among key vegetables, potato prices continued to edge up, while onion and tomato prices declined (Chart III.34).   Despite the moderation in headline inflation and overall food inflation, y-o-y inflation in cereal prices remains high at 8.1 per cent in July. In order to address these price pressures, the government approved the sale of wheat and rice in the open market at ₹2325/quintal and ₹2800/quintal, respectively, from August 01, 2024.27 Also, the government announced that the grain-deficient states can directly purchase rice from FCI at ₹2800/quintal under the open market sale scheme (OMSS) without participating in the e-auction (w.e.f. August 01, 2024).  As on August 05, 2024 the government has procured 524 lakh tonnes of rice in the Kharif marketing season (KMS) 2023-24, which is 8 per cent lower than in the last season. However, the stock of rice, as on July 16, 2024 stood at 473 lakh tonnes, which was 21 per cent higher than the same period last year. Procurement of wheat at 266 lakh tonnes in the Rabi marketing season (RMS) 2024-25 was 2 per cent higher than last year. The stock of wheat as on July 16, 2024 stood at 276 lakh tonnes, sufficient to cover the buffer norm (Chart III.35). These measures and easing of monsoon disrupted supply chain and logistical problems have helped ease pressure on vegetables prices in recent weeks (Chart III.36). On July 29, 2024 the government announced procurement from the major mandis and distribution of tomatoes at major consumption centres at a rate of ₹60 per kg. Onion mandi prices have also moderated since mid-July. In case of potatoes, however, heatwave and untimely rains caused production losses in major producing regions leading to price pressures. Supply prospects for onions, tomatoes and potatoes have been further boosted by the satisfactory progress of monsoon rainfall this year, which is also reflected in higher target for kharif acreage under all the three crops.   Retail selling prices of petrol and diesel were kept unchanged in August so far (up to 12th). Both kerosene and LPG prices also remained unchanged in August so far (Table III.2). The PMIs for July 2024 indicated that input costs across both manufacturing and service firms increased significantly. Selling prices also firmed up in both manufacturing and services, with manufacturing output prices recording the highest level in eleven years (Chart III.37).  In the latest bi-monthly round of the RBI’s survey, perceptions and inflation expectations of households hardened by 20 bps each for 3-month and one-year ahead horizons (Chart III.38). System liquidity remained in surplus during July and August so far on the back of increase in government spending, return of currency to the banking system and the Reserve Bank’s forex operations. The average daily net absorption under the liquidity adjustment facility (LAF) increased to ₹1.52 lakh crore during July 16 to August 15, 2024 from ₹0.09 lakh crore during June 16 – July 15, 2024 (Chart IV.1). In response to the evolving liquidity conditions, the Reserve Bank conducted two main and seventeen fine-tuning variable rate reverse repo (VRRR) operations (overnight to 7 days maturity), cumulatively mopping up ₹5.54 lakh crore from the system. Additionally, open market sales through the NDS-OM28 amounting to ₹0.14 lakh crore were conducted during July-August (up to August 9).   During the second half of July through August 15, 2024, average total liquidity absorption stood at ₹1.61 lakh crore. Of this, the amount absorbed through the standing deposit facility (SDF) was 52 per cent as against 76 per cent during June 16 to July 15, 2024. Given the tepid response of banks in parking surplus liquidity for longer tenors – as reflected in the lower bid-offer ratio in the main VRRR operations – more fine-tuning operations were conducted in July and August. Given surplus liquidity conditions, the banking sector’s reliance on the marginal standing facility (MSF) waned, with average daily borrowings declining to ₹0.04 lakh crore during the period July 16 to August 15, 2024 as compared with ₹0.11 lakh crore during June 16 to July 15, 2024. Reflecting the easy liquidity conditions, the weighted average call rate (WACR) – the operating target of monetary policy – softened and averaged 6.51 per cent during July 16 to August 14, 2024 as compared with 6.57 per cent during June 16 to July 15, 2024 (Chart IV.2a). Rates in the collateralised segment moved in tandem with the WACR. On an average, the triparty repo rate and market repo rate traded 10 basis points basis points (bps) and 4 bps, respectively, below the policy repo rate during July 16 to August 14, 2024 (Chart IV.2b). In the short-term money market segment, rates on 3-month certificates of deposit (CDs) hardened while that on commercial paper (CP) for NBFCs remained broadly stable. The yields on 3-month treasury bills (T-bills) softened due to improved liquidity in the banking system amidst lower market borrowing requirements. With the moderation in the risk-free rate, the average risk premium in the money market (spread between 3-month CP and 91-day T-bill rates) increased to 103 bps during July 16 - August 14, 2024 from 100 bps in the preceding period.  In the primary market, CD issuances amounted to ₹3.49 lakh crore during 2024-25 (up to August 9), significantly higher than ₹1.89 lakh crore in the corresponding period of the previous year (Chart IV.3). This increase can be attributed to deposit growth lagging credit growth, prompting banks to rely on alternative sources of funding. CP issuances also increased to ₹4.86 lakh crore during 2024-25 (up to July 31), surpassing ₹4.72 lakh crore in the corresponding period of the previous year, driven by NBFCs’ higher borrowings in the CP market. In the fixed income segment, domestic bond yields eased sharply, reflecting positive sentiment following the inclusion of Indian government securities (G-sec) in the global bond index, the gross fiscal deficit - gross domestic product (GFD-GDP) ratio being budgeted lower and reduced market borrowing requirements announced in the Union Budget 2024-25. Additionally, falling US treasury yields exerted downward pressure.The yield on the 10-year Indian benchmark G-sec closed lower at 6.88 per cent on August 14, 2024 from 6.86 per cent on July 15, 2024 (Chart IV.4a).   With the easing of liquidity conditions, the yield curve shifted downward across the entire term structure, with the shift being more pronounced at the short to mid end of the curve in comparison to the longer end (Chart IV.4b). Resultantly, the yield curve steepened with improved liquidity and reduced T-bill supply. Corporate bonds yields eased across diverse ratings and issuer categories during mid-July and August so far (up to August 13), tracking the movements in G-sec yields. The risk premium in the corporate bond market declined for most tenors (Table IV.1). Overall, corporate bond issuances during 2024-25 (up to June) was lower at ₹1.58 lakh crore compared to ₹2.36 lakh crore during the same period of the previous year.  Reserve money (RM), excluding the first-round impact of changes in the cash reserve ratio (CRR), recorded a growth of 6.2 per cent (y-o-y) as on August 9, 2024 (5.9 per cent a year ago) [Chart IV.5]. Growth in currency in circulation (CiC), the largest component of RM, increased to 5.7 per cent (y-o-y) as on August 9, 2024 from 3.0 per cent as on May 17, 2024, on account of the base effect of the withdrawal of ₹2000 banknotes29 – 97.92 per cent has been returned to the banking system, mostly in the form of deposits (as on July 31, 2024). On the sources side (assets), foreign currency assets (accounting for more than 90 per cent of NFA) recorded growth of 11.6 per cent (y-o-y) as on August 9, 2024. Gold - the other major component of NFA - continued to grow over 35 per cent (y-o-y) during August 2024, which is the highest since January 2021, mainly due to revaluation gains on gold prices (Chart IV.6).   Money supply (M3) rose by 10.0 per cent (y-o-y) as on July 26, 2024 (10.6 per cent a year ago).30 Aggregate deposits with banks, the largest component of M3, increased by 10.5 per cent (11.5 per cent a year ago). Scheduled commercial banks’ (SCBs’) credit growth stood at 15.1 per cent as on July 26, 2024 (14.6 per cent a year ago) [Chart IV.7]. SCBs’ deposit growth (excluding the impact of the merger), which witnessed an increase in the wake of withdrawal of ₹2000 banknotes, has remained in double digits since April 2023 (Chart IV.8). As on July 26, 2024, SCBs’ incremental credit-deposit ratio was at 102.4 per cent (Chart IV.9). With the statutory requirements for CRR and SLR at 4.5 per cent and 18 per cent, respectively, around 77 per cent of deposits were available with the banking system for credit expansion as on July 26, 2024. Further, growth in SLR investments has accelerated while non-SLR investments have decelerated in the month of July 2024. The deposit base was supplemented by CDs issuances.   In response to the 250 bps policy rate hike since May 2022, SCBs have revised their repo-linked external benchmark-based lending rates (EBLRs) upwards by a similar magnitude. The 1-year median marginal cost of funds-based rate (MCLR) of SCBs increased by 170 bps during May 2022 to July 2024. Consequently, weighted average lending rates (WALRs) on fresh and outstanding rupee loans increased by 181 bps and 119 bps, respectively, during May 2022 to June 2024. The weighted average domestic term deposit rates (WADTDRs), which include retail and bulk deposits, on fresh and outstanding deposits increased by 243 bps and 188 bps, respectively, during the same period (Table IV.2). Across bank groups, the increase in lending rates on fresh and outstanding rupee loans was lower for public sector banks (PSBs) than for private banks. On the other hand, deposit rates were higher in the case of PSBs (Chart IV.10).  During Q1:2024-25, the listed Indian banking and financial sector companies31 maintained top-line and bottom-line growth (Chart IV.11). Revenues, primarily including interest income in case of banks, exhibited double digit growth, albeit with a sequential moderation. However, growth of other income, which includes income from fees, commissions, profit and loss from investments, remained modest during the quarter. An increase in interest expenses led to expenditure growth moderately outpacing revenue growth during the quarter. However, slower growth of provisioning costs resulted in net profits growing at a faster rate than operating profits.  Sales of early-reporting listed private non-financial companies32 grew by 7 per cent (y-o-y) in Q1:2024-25. In real terms, sales growth of manufacturing firms stood at 4.6 per cent (Chart IV.12a). Sales of manufacturing, information technology (IT) and non-IT service companies recorded a y-o-y growth of 6.2 per cent, 4.6 per cent and 7.5 per cent, respectively (Chart IV.12b). The operating profit margins of manufacturing, IT and non-IT service companies have been stable in recent quarters (Chart IV.12c). The private capex outlook remains upbeat, with the total cost of projects sanctioned/assisted33 during Q1:2024-25 of ₹ 1,01,433 crore exceeding the quarterly average total cost of projectssanctioned during 2023-24 (₹ 97,745 crore). Funds raised through initial public offerings (IPOs) that are earmarked for capex increased sequentially (q-o-q) during Q1 (Chart IV.13). During July-August 2024 so far, Indian equity markets remained volatile, tracking global cues. The BSE Sensex increased by 1.78 per cent to close at 80,437 on August 16, 2024 (Chart IV.14). After gaining around 2 per cent in the first half of July, markets declined as higher-than-expected US jobless claims and a global technical outage that affected several businesses dented investor sentiments globally. Markets, however, recovered partially towards end July, before correcting sharply in the first week of August on concerns regarding the health of the US economy. Further, escalating geopolitical tensions and sharp swings in the Japanese markets added to overall uncertainty. Subsequently, the domestic markets picked up as global markets stabilised following robust macroeconomic data releases from the US.   Gross inward FDI grew by 26.4 per cent (y-o-y) to US$ 22.5 billion during Q1:2024-25 (Chart IV.15a). Manufacturing, financial services, communication services, computer services, and electricity and other energy sectors accounted for about 80 per cent of the gross FDI inflows. With around 75 per cent of the flows, the major source countries were Singapore, Mauritius, the Netherlands, the US and Belgium. Net FDI rose to US$ 6.9 billion during Q1:2024-25 as compared to US$ 4.7 billion a year ago, due to an increase in gross FDI flows. During H1:2024, over US$635 billion worth of cross-border investment projects were announced globally, marking it the fourth-highest half-yearly global FDI since 2003, as reported by fDi Intelligence.34 Energy transition and digitisation continued to drive the global FDI landscape during the first half of 2024, with renewables, semiconductors, and communications sectors accounting for half of the announced FDI projects (Chart IV.15b). Supported by mega projects (worth more than US$ 1 billion), the semiconductor sector rose to the second rank during H1:2024 from the ninth position in 2023 in the global FDI ranking by sectors. On the other hand, the electronics sector slipped from the second to ninth position, reflecting concerns over weaker-than-expected demand for electric vehicles.   Foreign portfolio investors (FPIs) were buyers in July 2024, with net inflows amounting to US$ 5.2 billion (Chart IV.16a). Net inflows in the equity segment at US$ 3.3 billion rose to a four-month high during the month. Among sectors, information technology, metals and mining, and automobiles and auto components sectors attracted the highest FPI equity inflows during July 2024. The debt segment continued to attract FPI inflows, following the inclusion of Indian government bonds in the JP Morgan’s GBI-EM index starting June 28, 2024. Indian debt has remained attractive among emerging market peers during the current financial year (Chart IV.16b). In August 2024 (up to August 13), net FPI outflows to the tune of US$ 0.8 billion were recorded amidst concern over slowdown in the US economy and volatile Japanese market.  Non-resident deposits recorded net inflows of US$ 4.0 billion during Q1:2024-25 as compared with US$ 2.2 billion a year ago, with higher inflows in all three accounts namely, Non-Resident (External) Rupee Accounts [NR(E)RA], Non-Resident Ordinary (NRO) and Foreign Currency Non-Resident [FCNR(B)] accounts. With lower participation from large firms, registrations of new external commercial borrowings (ECBs) moderated to US$ 11.1 billion during Q1:2024-25. ECB inflows were to the tune of US$ 9.7 billion during the first quarter of 2024-25 as compared with US$15.2 billion in the corresponding period last year (Chart IV.17a). Net of principal repayments, ECB inflows have been positive for the second successive quarter. Of the total ECBs registered during Q1:2024-25, 46 per cent were earmarked for capital expenditure (including on-lending and sub-lending for capex) [Chart IV.17b]. The effective ECB rate remained relatively stable as there was a reduction in margins over the benchmark during Q1:2024-25, which partially offset the increase in benchmark rates (Chart IV.17c). Over three-fourth of the agreements were explicitly hedged (Chart IV.17d).   India’s foreign exchange reserves rose to an all-time high of US$ 674.9 billion on August 02, 2024. As on August 09, it stood at US$ 670.1 billion, equivalent of more than 11 months of imports for 2023-24 and more than 100 per cent of total external debt outstanding at end-March 2024 (Chart IV.18a). India’s foreign exchange reserves increased by US$ 47.7 billion during 2024 so far (as on August 09), the highest among major foreign exchange reserves holding countries (Chart IV.18b). The Indian rupee (INR) exhibited the least volatility among major currencies during July 2024, depreciating by 0.1 per cent (m-o-m) vis-à-vis the US dollar (Chart IV.19).   The INR appreciated by 0.9 per cent (m-o-m) in July 2024 in terms of the 40-currency real effective exchange rate (REER), as positive relative price differentials more than offset the depreciation of the INR in nominal effective terms (Chart IV.20). Digital payment system indicators across all the major categories recorded strong growth (y-o-y) in July 2024 (Table IV.3). The UPI registered the highest level of transactions in July 2024, recording over ₹20 lakh crore transactions for the third consecutive month with improved infrastructure. Digital payments infrastructure strengthened further in June 2024, driven by steady growth (y-o-y) in the number of credit cards (17.1 per cent), point-of-sale (PoS) terminals deployed (10.8 per cent), Bharat Quick Response (QR) codes (8.4 per cent) and UPI QR codes (25.0 per cent). This was corroborated by an increase in the Reserve Bank of India – Digital Payments Index (RBI-DPI) to 445.50 in March 2024 from 418.77 in September 2023. In the case of credit cards, the volume of transactions has been growing faster than the value of transactions since Februray 2024, indicating that consumers are increasingly swiping cards for small value transactions, which is culminating in a lower credit card leverage (Chart IV.21).   In order to ensure resilience of authorised non-bank Payment System Operators (PSOs) to existing and emerging information systems and cyber security risks, the Reserve Bank issued directions35 covering robust governance mechanisms for identification, assessment, monitoring and management of these risks on July 30, 2024. The Reserve Bank also released draft directions on ‘Due Diligence of Aadhaar enabled Payment System (AePS) Touchpoint Operators’36 to enhance the robustness of AePS, which would protect bank customers from AePS frauds and maintain trust and confidence in the safety and security of the system. Additionally, the Reserve Bank released a draft “Framework on Alternative Authentication Mechanisms for Digital Payment Transactions”37 to enable adoption of alternative authentication mechanisms by the ecosystem, which will widen the choice of authentication factors available to PSOs and users. The National Payments Corporation of India’s (NPCI) wholly owned subsidiary, NPCI International Payments Ltd. (NIPL), signed an agreement38 with Qatar National Bank (QNB) to launch QR code-based UPI payments enabling its acceptance in Qatar through the QNB merchant network, benefiting Indian travellers visiting and transiting through the country. Further, the NPCI announced39 the rollout of ‘UPI One World’ wallet for inbound travellers across all40 nations of the world, which would provide international visitors with a seamless, real-time digital payment experience. NPCI Bharat BillPay Limited (NBBL) expanded41 the scope of cross border bill payments through BBPS which is currently limited to foreign inward remittances, to foreign outward remittances. The RBI permitted all personal inward and outward non-trade bills of current account nature routed through any authorised payment system, subject to adherence to applicable rules/regulations/guidelines under Foreign Exchange Management Act (FEMA) and RBI’s Master Direction-Know Your Customer (KYC) Direction, 2016 dated February 25, 2016. In its statement on developmental and regulatory policies dated August 8, 202442, the Reserve Bank proposed creating a public repository of Digital Lending Apps (DLAs) deployed by Regulated Entities (REs), which will be available on its website to curb the presence of unscrupulous players in digital lending. With regards to payment systems, the Reserve Bank announced three important measures - enhancing the limit for tax payments through UPI from ₹1 lakh to ₹5 lakh per transaction; introduction of “Delegated Payments” in UPI which would allow an individual (primary user) to set a UPI transaction limit for another individual (secondary user) on the primary user’s bank account thereby enhancing the reach and usage of digital payments across the country; and transition of the cheque truncation system (CTS) from the current approach of batch processing to continuous clearing with ‘on-realisation-settlement’ in which cheques will be scanned, presented and passed in a few hours. Conclusion It has been pointed out recently that India stands at a momentous point in its journey, powered by significant progress in various spheres. This has ignited aspirations for securing the best living standards in the world. Capitalising on the demographic advantage, entrepreneurial talent, the expanding global footprint of the Indian diaspora, unique cultural heritage and geographical endowments, opportunities are opening up to make the 21 century India’s century. This path of ambition is not without global challenges: geoeconomic and geopolitical shifts that are underway; a more unequal world; climate change and in its train extreme weather events recurring with increasing disruptive impact and intensity; new technologies creating unpredictability about the future with unknown risks. Against this backdrop, India will have to strive for a developmental strategy that balances energy security, access, affordability and sustainability; builds world class manufacturing, logistics and R&D capabilities and competitiveness; and makes further progress towards creating a more inclusive society that affords opportunities for all. It is only by overcoming these challenges and harnessing these opportunities that India can hope to break out of the middle-income trap alluded to earlier in the context of the World Bank’s latest World Development Report by growing annually at a rate of 7-10 per cent to strike out towards a better future. This will involve a target for annual per capita income at US$ 18,000 by 2047; average life expectancy of around 84 years; a working age population of about 112 crore; universal literacy; very low infant mortality of 2 per 1000 live births, to name a few.43 This vision of transforming India is founded on each citizen at individual productive and opportunity potential frontiers. There are milestones to be passed and work to be done, but dedication and self-belief can realise this vision. According to the distinguished British economist, Angus Maddison, who specialised in the measurement and analysis of economic growth and development, India was the largest economy of the world with the highest share in world GDP during 1 to 1000 AD. Over the next 600 years, India intermittently fell to the second position, but reclaimed the position of the world’s largest economy by 1700 AD with a share of 24.4 per cent of world GDP. After that came the colonial rule and a long retrogression. Given the innate strengths…and the energies and transformation that are driving the nation to overcome its challenges and achieve its aspirational goals, it is possible to imagine India …..becoming the largest economy (in the world) by 2060.44 The time has come to repossess our rightful place on the world’s stage.45 Major Takeaways from the RBI’s Enterprise Surveys
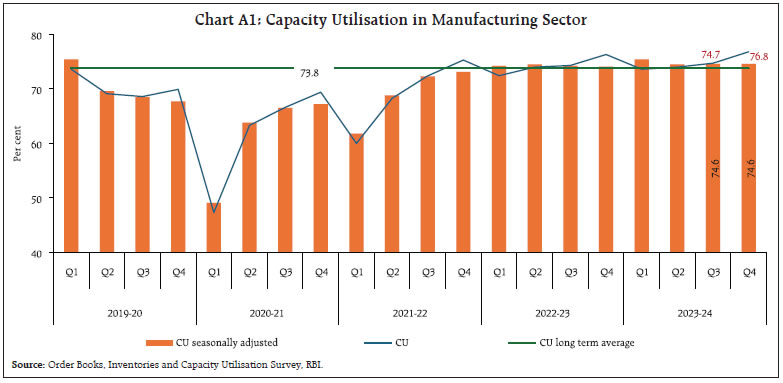 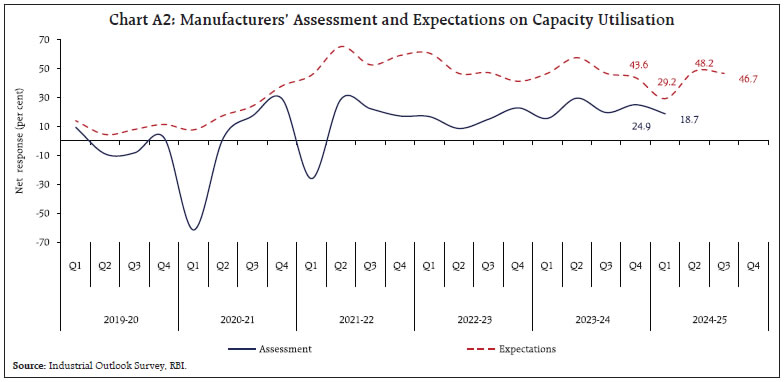
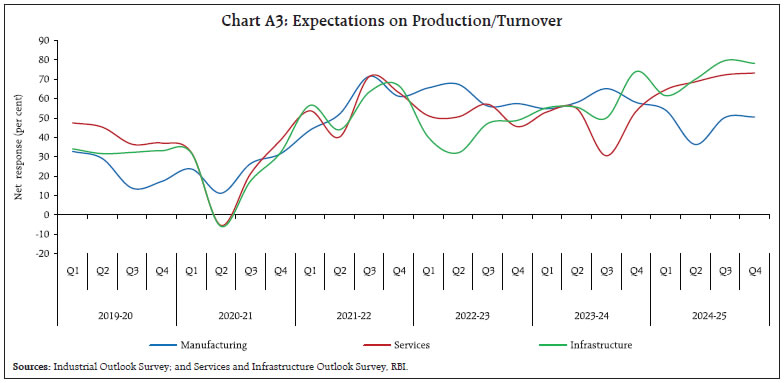 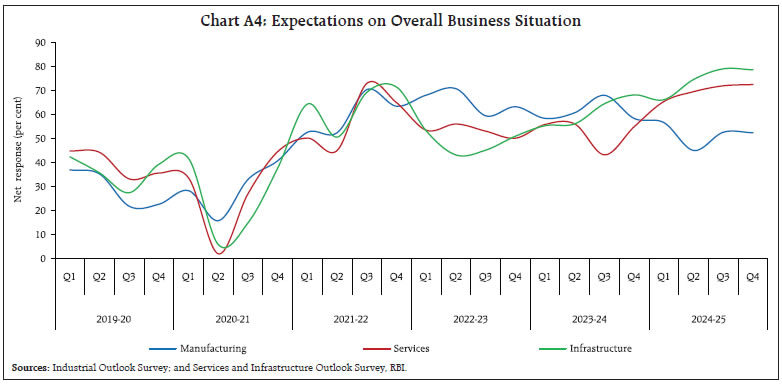 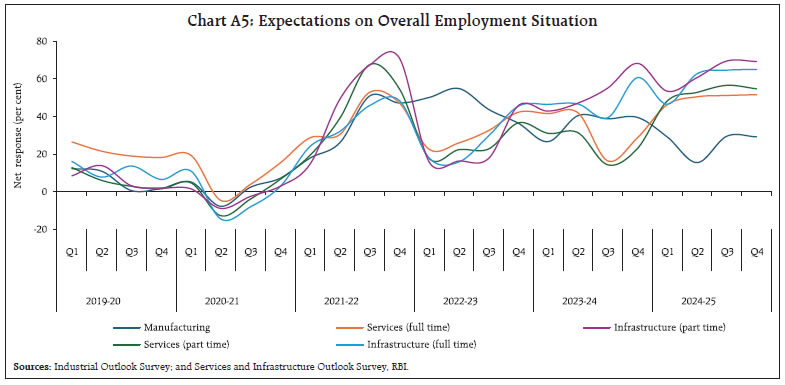
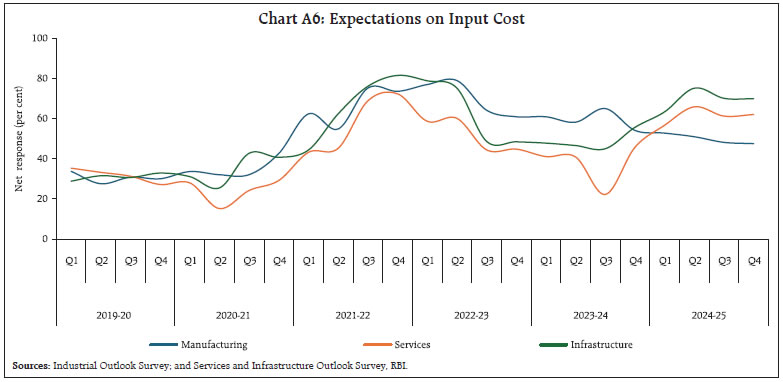 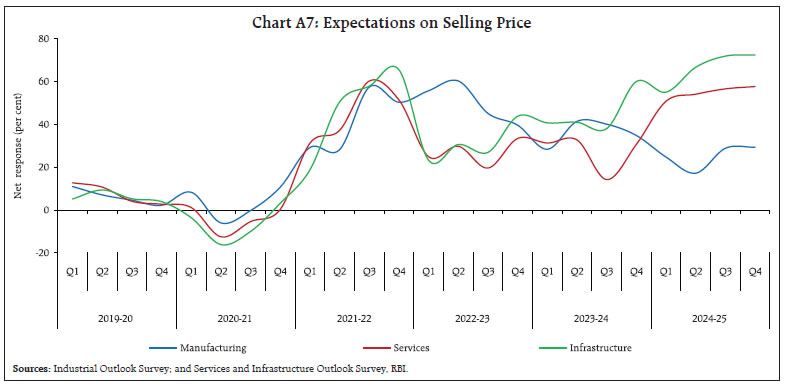
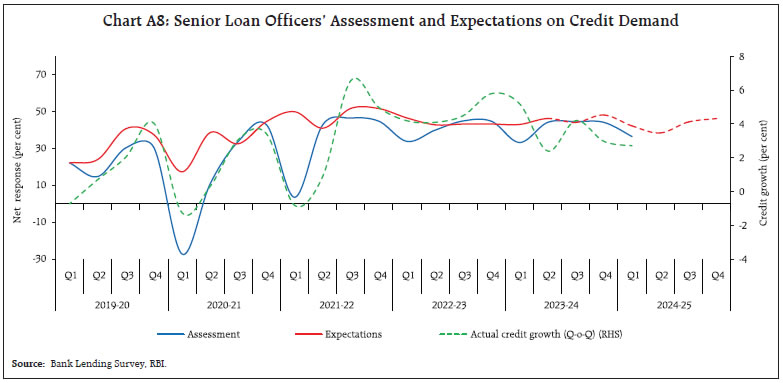 Note: The ‘net response’ is calculated as the difference between the percentage of respondents reporting optimism and that reporting pessimism. The increase option (I) is an optimistic response for all parameters, except the cost related parameters, such as cost of raw materials, etc., where the decrease option (D) signifies optimism from the viewpoint of a respondent company. * This article has been prepared by Michael Debabrata Patra, G. V. Nadhanael, Rajni Dahiya, Durga G, Arpita Agarwal, Bajrangi Lal Gupta, Ramesh Kumar Gupta, Harendra Behera, K M Neelima, Gautam, Love Kumar Shandilya, Madhuresh Kumar, Harshita Yadav, Ettem Abhignu Yadav, Shivam, Sritama Ray, Rashika Arora, Sumit Roy, Anirban Sanyal, Agamani Saha, Dilpreet Sharma, Khushi Sinha, Shreya Gupta, Sai Dheeraj Vayugundla Chenchu, Vikas Anand, Himani Shekhar, Asish Thomas George, Samir Ranjan Behera, Vineet Kumar Srivastava, and Rekha Misra. 1 Christine Lagarde, President of the ECB, Monetary Policy Statement Press Conference, July 18, 2024. 2 Jerome Powell, Chair of the Federal Reserve of the United States, Press Conference July 31, 2024. 3 The Financial Times, August 8, 2024. 4 World Development Report, 2024. 5 Copernicus Climate Change Service, July 2024. 6 The IMD calculates the total number of heatwave days across 36 meteorological sub-divisions in India. As a result, the cumulative number of heatwave days can exceed the total number of days in a given month. 7 In India a heat wave is declared based on two criteria i) temperature threshold and ii) departure from normal. First of all, for a day to be considered as a heatwave day the temperature should reach in excess of 40°C in Plains, 37°C for coastal region and 30°C for Hilly regions. If the departure from normal temperature exceeds 4.5°C in a sub-division a heatwave day is declared. However, if the actual maximum temperature surpasses 45°C in a sub-division, it is considered a heatwave day regardless of the departure from normal temperature. 8 https://www.newindianexpress.com/business/2024/Aug/03/india-achieves-highest-global-growth-rate-in-agricultural-gdp-niti-aayog. 9 Earnings before interest and taxes (EBIT) divided by interest expenses. 10 Capital, Labour, Energy, Materials and Service. 11 https://www.pwc.com/gx/en/issues/data-and-analytics/publications/artificial-intelligence-study.html. 12 https://www.niti.gov.in/sites/default/files/2023-03/AIRAWAT-Establishing-an-AI-Specific-Cloud-Computing-Infrastructure-for-India.pdf. 14 Basic Statistical Returns, RBI. 15 The Economic Times, July 18, 2024. 16 Hindustan Times, August 8, 2024. 17 Shri Shaktikanta Das, Governor, Reserve Bank of India, Governor’s Statement: August 8, 2024. 18 The Sagarmala Programme of the Ministry of Ports, Shipping and Waterways seeks to enhance the performance of the logistics sector by reducing logistics costs for both domestic and international trade by leveraging coastal and waterway transportation. 19 Monetary Policy Statement, 2024-25 Resolution of the Monetary Policy Committee (MPC) August 6 to 8, 2024. 20 https://icea.org.in/blog/wp-content/uploads/2024/07/ICEA-TARRIF-4.0.pdf. 21 As per the latest data released by the Controller General of Accounts (CGA) pertaining to the financial position of the Union government. 22 Greater than 106 per cent of LPA. 23 As per IMD’s SWM rainfall forecast for the second half of the season and for the month of August 2024 released on August 01, 2024. 24 According to the latest data released by the Ministry of Agriculture and Farmers’ Welfare (MoAFW). 25 Paddy accounts for almost 37 per cent of kharif full season normal area. 26 As per the provisional data released by the NSO on August 12, 2024. 27 Food Corporation of India (FCI) will decide the exact quantity of grain stocks to be offloaded in consultation with the Ministry after keeping the stock for PDS and buffer norm requirements. 28 Negotiated Dealing System – Order Matching segment. 30 Excluding the impact of the merger of a non-bank with a bank (with effect from July 1, 2023). 31 Based on a sample of 340 companies constituting around 60 per cent of the total market capitalisation of listed banking and financial sector companies. 32 Based on 1795 early-reporting companies, with 91 per cent coverage in terms of sales during Q4:2023-24. 33 by major banks and all India financial institutions (AIFIs). 34 A specialist division from the Financial Times that provides a comprehensive offering of services related to foreign direct investment. 35 RBI Notifications. July 30, 2024. 36 RBI Press Release. July 31, 2024. 37 RBI Press Release. July 31, 2024. 38 NPCI Press Release. July 11, 2024 39 NPCI Press Release. July 22, 2024. 40 Some countries excluded as per regulatory guidance. 41 NBBL Circular. August 06, 2024. 42 RBI Press Release. August 08, 2024. 43 “India should grow at 7-10% for 20-30 yrs to avoid middle income trap: NITI”, Business Standard, July 29, 2024. 44 “The Indian Economy: Opportunities and Challenges”, (Keynote Address delivered by Michael Debabrata Patra, Deputy Governor, Reserve Bank of India - March 25, 2024 - at the Nomura’s 40th Central Bankers Seminar at Kyoto, Japan). 45 INDIA@75, Speech delivered by Dr. Michael Debabrata Patra, Deputy Governor, Reserve Bank of India in an event to celebrate Azadi Ka Amrit Mohotsav organised by Reserve Bank of India - August 13, 2022, Bhubaneswar. |

Share this page:


Install the RBI mobile application and get quick access to the latest news!


