Survey of India’s Foreign Liabilities & Assets for the Mutual Fund Companies (2009-2011) - RBI - Reserve Bank of India
Survey of India’s Foreign Liabilities & Assets for the Mutual Fund Companies (2009-2011)
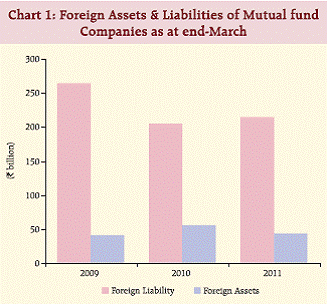
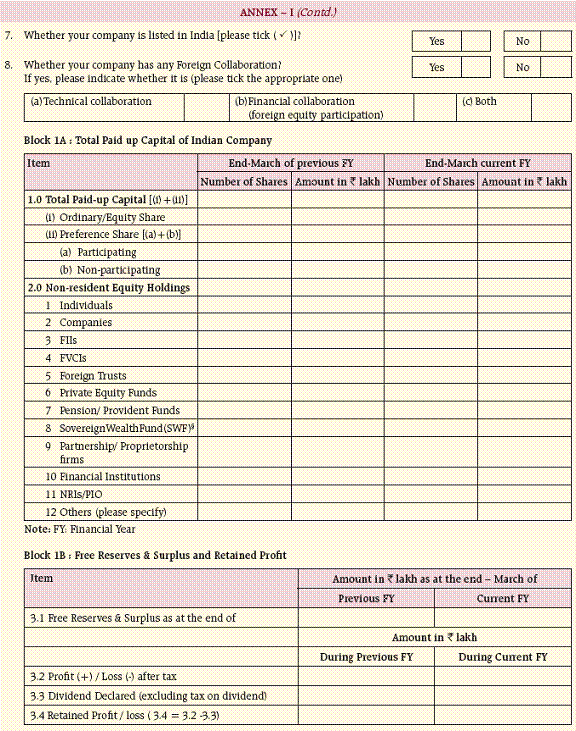
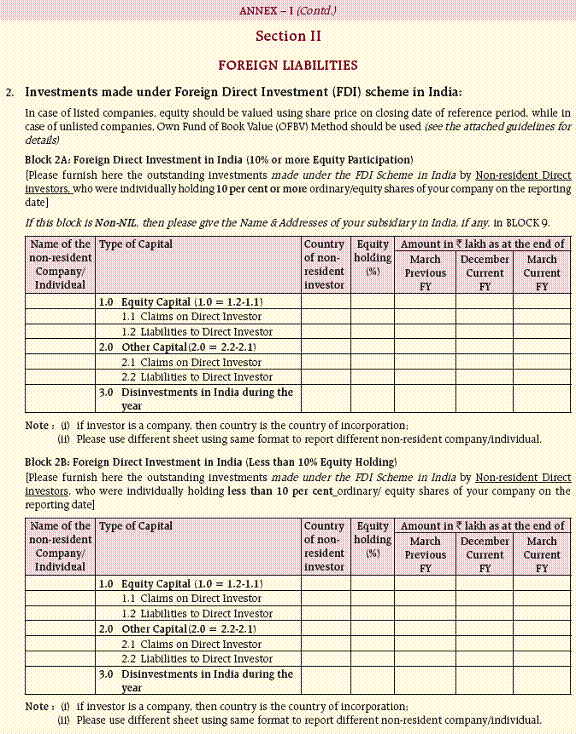
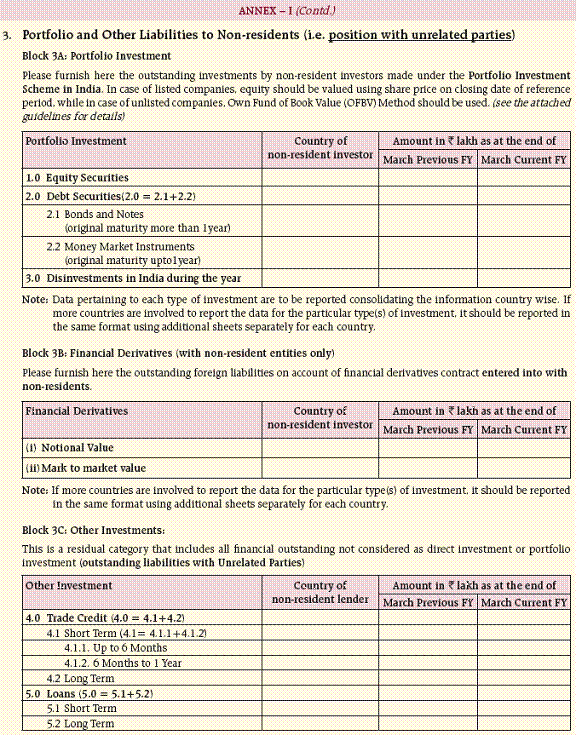
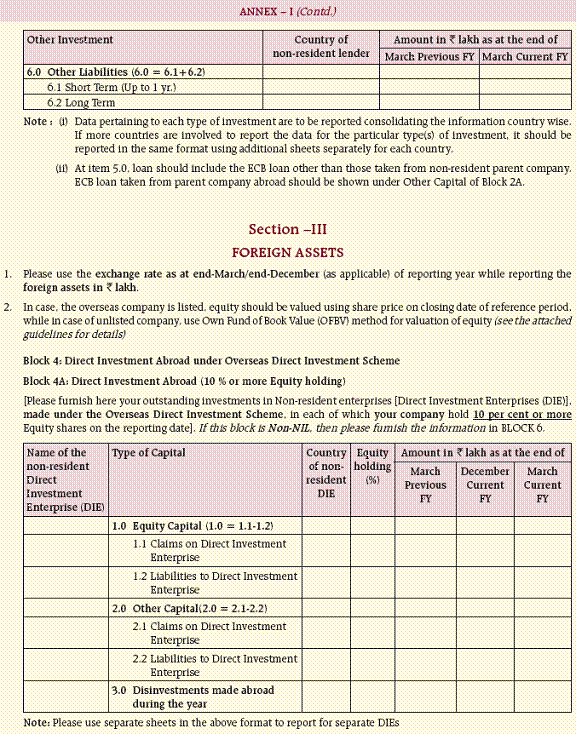
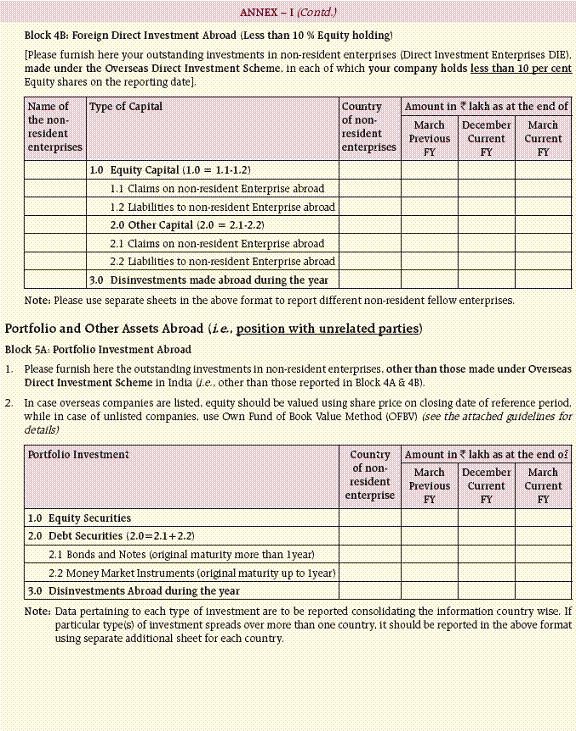
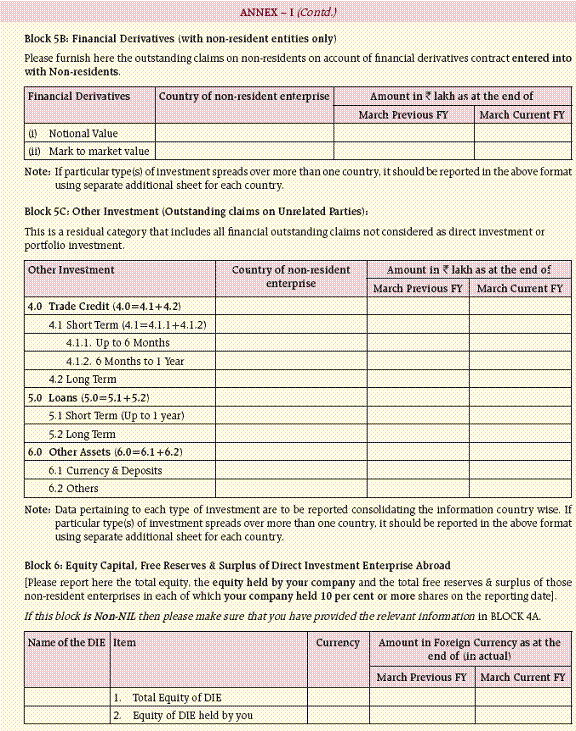
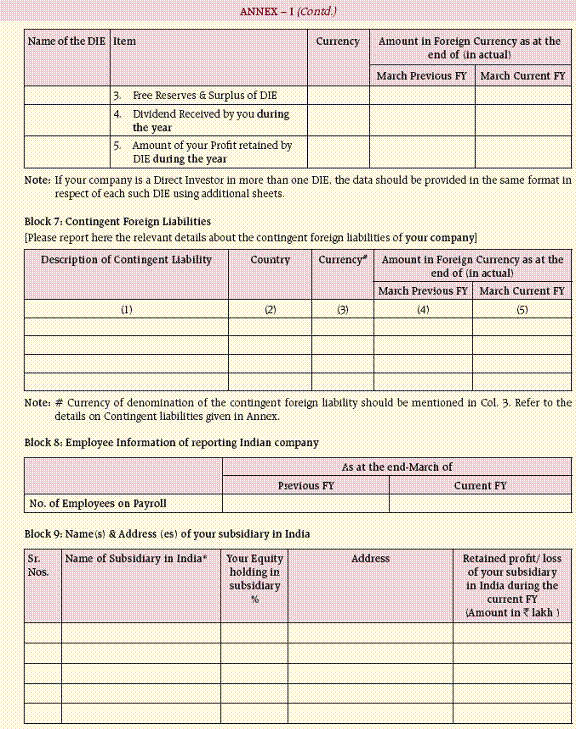
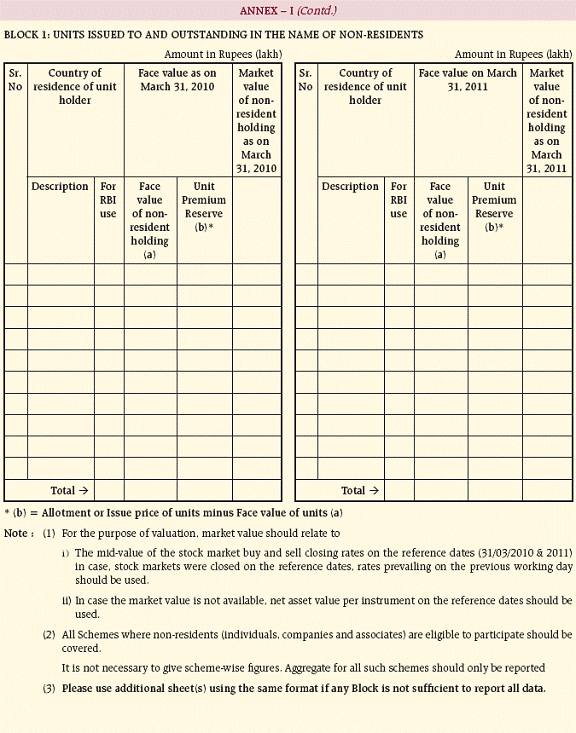
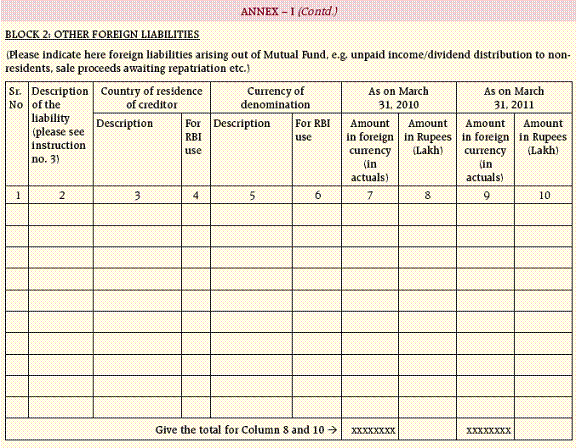
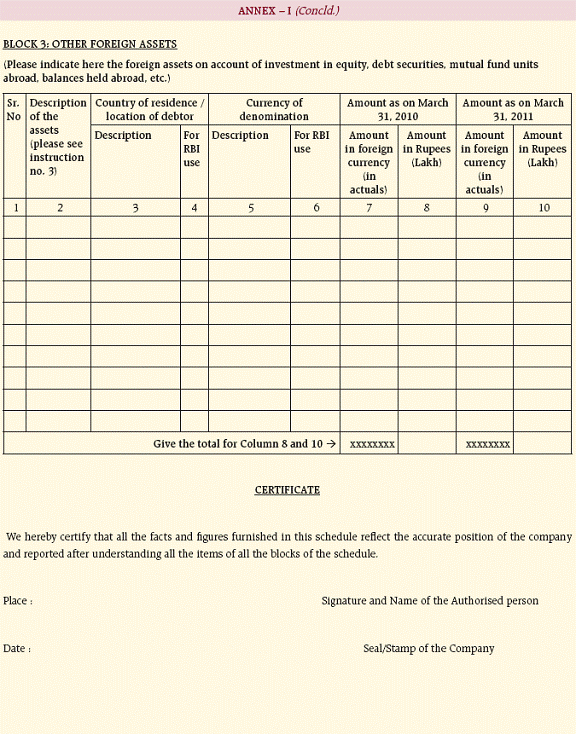
Survey of India’s Foreign Liabilities & Assets for the Mutual Fund Companies (2009-2011)* This article presents an overview of the foreign assets and liabilities of the mutual fund companies (MFs) in India based on surveys conducted by the Reserve Bank with March 2009 to March 2011 as the reference period. The results cover the responses of 44 MFs for March 2011 which held/acquired foreign assets and/or liabilities and 38 of these companies were common during the entire reference period. The changes in foreign liabilities and assets of MFs are analysed in detail along with the country-wise exposures. It was found that the overseas portfolios of MFs witnessed considerable fluctuations during this period, which was coterminous with global financial crisis. It was also found that in March 2011, foreign liabilities of MFs were over five times their foreign assets which were largely in terms of investment in equity securities. Section I Introduction The Reserve Bank collects information on cross-border liabilities and assets of Indian resident companies on a regular basis, which is used as an input for compilation of India’s Balance of Payments (BoP) statistics, International Investment Position (IIP), Coordinated Direct Investment Survey (CDIS) and Coordinated Portfolio Investment Survey (CPIS) as per international standards. Foreign liabilities and assets of corporations arise on account of foreign direct investment (FDI), portfolio investment, other investments, which include trade credit, loan, etc. The first Census on Foreign Liabilities and Assets (FLA) was conducted by the Reserve Bank with end-June 1948 as the reference period. Since 1997, FLA information was being collected through annual surveys, before the move to census basis reporting since March 2011. These details also provide analytical inputs on the extent to which the economy can withstand unexpected shocks in capital flows and show the level of confidence international investors place in the economy. This article presents the salient features of the FLA data relating to mutual fund companies (MFs) and asset management companies (AMCs) associated with MFs for the reference period March 2009 to March 2011. Section II and III discuss the foreign liabilities and assets of MFs and AMCs, respectively. Section IV covers the reinvested earnings of the AMCs and conclusions are presented in Section V. Scope & Coverage The information on foreign liabilities and assets analysed here has been collected under the FLA schedule (for information on the stock of external assets and liabilities of AMCs) and Schedule 4 (for information regarding MF units issued to non-residents, unpaid dividend, redemption of units issued to nonresidents and MFs’ overseas investment). Format of both the schedules are given in Annex I. In terms of coverage, 38 MFs reported for March 2009 which rose to 44 for March 2011 and 38 companies were common in all the three years. As all 44 MFs in the survey frame for March 2011 responded (List in Annex II), it was complete enumeration. Developments in the Mutual Fund sector A mutual fund is a professionally managed collective investment scheme that pools money from multiple investors and invests typically in instruments such as, stocks, bonds, short-term money market instruments, other mutual funds, other securities, and/ or commodities such as precious metals. The investors are issued units in proportion to their investment. MFs trade (buy and sell) instruments in accordance with their investment objective and the income earned through these investments and the capital appreciation realised are shared by its unit holders in proportion to the number of units held by them. MFs in India are a significant source of investment in both government and corporate securities market. The foundation of the MF industry in India dates back to 1963 when Unit Trust of India (UTI) introduced mutual fund. Over the period, a number of players entered the market including private and foreign companies. Banks too have established mutual funds. As a part of the opening up of the financial sector, permission was given to private sector funds, including foreign fund management companies (most of them entering through joint ventures with Indian promoters), to enter the MF industry in 1993. All MFs are required to be established as trusts under the Indian Trusts Act, 1882 and the Securities and Exchange Board of India (SEBI) regulates their functioning. MFs dealing exclusively with money market instruments are required to be registered with the Reserve Bank. The actual fund management activity of an MF is generally conducted by a separate AMC. At present, Indian AMCs which launch off-shore funds abroad have to obtain SEBI’s approval for such schemes. The minimum net worth of an AMC or its affiliate must be `50 million to act as a manager in any other fund. Mutual Fund Companies: Foreign Liabilities & Assets In India, MFs are allowed to issue the units of different schemes to non-residents, which are their foreign liabilities, with two broad components: (i) issue of units to non-residents which can be classified further based on face value as well as market value, and (ii) other foreign liabilities arising out of unpaid income/dividend to non-residents, sale proceeds pending repatriation, etc. In addition to investment in MF units abroad and investment in foreign equity and debt instruments, foreign assets of MFs include balances held abroad, dividend receivable from abroad, etc., which are classified as ‘Other Foreign Assets’ in the survey schedule. Foreign assets of MFs increased sharply from `40.6 billion in March 2009 to `55.4 billion in March 2010, mainly on account of significant enhancement in the aggregate ceiling for their overseas investment during this period. The ratio of foreign assets of the MFs to their foreign liabilities increased from 15.4 per cent at March 2009 to 27.2 per cent in March 2010 as lesser units issued to non-residents during 2009-10 (Table 1). Due to lower investment in equity securities compared with 2009-10, this ratio witnessed a substantial decline to 20.1 per cent by March 2011. Also, the assets declined by 22.6 per cent to `42.9 billion in March 2011 reflecting the impact of global economic slowdown, especially the meltdown in the stock markets. On the other hand, foreign liabilities of MFs (sum of ‘units issued to nonresidents’ and ‘other foreign liabilities’) declined from `263.5 billion in March 2009 to `203.9 billion as at end-March 2010 and but rose thereafter to `213.9 billion in March 2011. Chart 1 presents the trend in foreign liabilities and assets of MFs during the reference period.
Non-resident Holding Units issued to non-residents constitute the dominant component of foreign liabilities of MFs (99.6 per cent in March 2011). The liabilities based on face value declined from `263.1 billion in March 2009 to `202.9 billion in March 2010 before increasing to `213.1 billion in March 2011 whereas the liabilities based on market value increased gradually from `311.1 billion in March 2009 to `361.6 billion in March 2010 and further to `405.2 billion in March 2011 (Table 2). The higher growth in market value terms is partly attributable to the stock market recovery after the meltdown in 2008-09. Country-wise Distribution of Units issued to Non-residents (i) Based on Face Value: The country-wise distribution of MFs’ foreign liabilities, based on face value of units issued to non-residents, shows that the share of United Arab Emirates (UAE) declined from 15.0 per cent of the total foreign liabilities to 13.3 per cent in March 2010 and thereafter rose to 14.5 per cent in March 2011 (Table 3). The share for the USA which was 2.2 per cent in March 2009, increased to 6.5 per cent by March 2011. However, Hong Kong’s share which increased sharply from 1.6 per cent in March 2009 to 9.7 per cent in March 2010, declined to 1.9 per cent by March 2011. MFs’ overseas liabilities were also high for the UK (4.2 per cent) and Singapore (2.7 per cent) in March 2011. The category ‘Others’ include the responses in which the country contribution was very small or country details were not given or Indian addresses were given for NRI investment. The share of ‘Others’ was as high as 65.3 per cent in total foreign liabilities of MFs. (ii) Based on Market Value: The country-wise classification of foreign liabilities on account of units issued to non-residents indicates that, as per market value also, UAE held major share of the foreign liabilities during the survey period (12.0 per cent in March, 2011) whereas the share of the USA increased from 2.2 per cent in March 2009 to 7.1 per cent in March 2011 followed by Canada (5.6 per cent in March 2011) and the UK (3.8 per cent in March 2011). The share of Hong Kong increased sharply from 1.4 per cent to 7.6 per cent during 2009-10 but declined thereafter to 3.4 per cent by March 2011. The share of ‘Others’ category (which has the same coverage as in the case of liabilities based on face value) was about 61.1 per cent of the total foreign liabilities (Table 4). Overseas Investment Foreign Assets of MFs have been classified according to investment in equity securities, debt securities and other foreign assets. Over 99 per cent of Overseas assets of MFs were held in equity investments which surged from `40.4 billion in March 2009 to `55.4 billion in March 2010 before declining to `42.7 billion in March 2011 (Table 5). No MF reported overseas investment in debt instruments.
Country-wise Distribution of Overseas Portfolio Assets The country-wise classification of foreign portfolio assets of MFs indicates that Luxembourg accounted for major share of the foreign assets during the reference period. The share of foreign assets in Luxembourg declined from 57.0 per cent to 46.2 per cent during 2009-10 before moving to 49.6 per cent by March 2011. This was followed by the USA (18.8 per cent) and Hong Kong (6.8 per cent). The share of foreign assets to Japan surged from Nil in March 2009 and March 2010 to 3.2 per cent by March 2011. The category ‘Others’ (which has the same meaning as in the case of liabilities based on face value) had around 8.1 per cent share in the total foreign liabilities (Table 6). Asset Management Companies: Foreign Liabilities and Assets Asset management refers to professional management of investments that guides gaining of assets (stocks, bonds, gold, and real estate), their use and disposal, and management of any costs and risks associated with the assets, in order to maximise the return on assets and make most of the assets’ potential throughout their life. An Asset Management Company (AMC) is a firm that invests pooled funds of retail investors in various assets in line with the stated investment objectives. AMCs undertake the fund management activity of MFs. Against a fee, AMCs provide more diversification, liquidity and professional management consulting service than is normally available to individual investors. They collect money from investors by way of floating various schemes and attempt to achieve portfolio diversification by investing in such securities that are not highly correlated with each other.
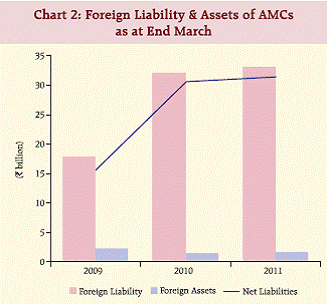
44 AMCs associated with the MFs responded to the survey for 2010-11. Consistent with financial market activity during the period, foreign liabilities of AMCs increased rapidly (80.3 per cent growth) during 2009-10 but the growth moderated in 2010-11 (2.9 per cent). In sum, foreign liabilities of AMCs increased from `17.8 billion in March 2009 to `32.9 billion by March 2011 (Table 7). On the other hand, their foreign assets declined from `2.3 billion in March 2009 to `1.3 billion in March 2010 before rising marginally to `1.5 billion by March 2011. Due to large surge in foreign liabilities of AMCs, their net liabilities more than doubled from `15.5 billion in March 2009 to `31.4 billion in March 2011. (a) Country-wise foreign liabilities Singapore replaced Mauritius as the country with largest share in total foreign liabilities of the AMCs during the reference period and accounted for over one-fourth of such liabilities. Foreign liabilities of AMCs to Singapore spurted from nearly `1.0 billion in March 2009 to `8.5 billion by March 2011 whereas it declined from `8.5 billion in March 2009 to `5.3 billion in March 2011 for Mauritius. In March 2011, the shares of Singapore (25.9 per cent), Mauritius (16.1 per cent), USA (8.2 per cent) and Japan (7.1 per cent) in such liabilities were high. Japan and Luxembourg accounted for foreign liabilities from 2010 onwards. The category ‘Others’ includes cases where individual country-wise contribution was very small or the country of the investor was not given (Table 8). (b) Country-wise foreign assets The share of Singapore in foreign assets of AMCs increased rapidly and it accounted for more than half of such portfolio in March 2011. Guernsey (16.6 per cent), Mauritius (8.7 per cent), UAE (7.9 per cent), UK (4.4 per cent) and Malaysia (4.1 per cent) were other countries with significant shares in such assets (Table 9). Reinvested Earnings of AMCs Reinvested earning is the Foreign Direct investor’s share in resident company’s retained earnings, which is the difference (positive or negative) between a company’s net profit/loss and its distributed dividends. Reinvested earnings are included in the balance of payments (BoP) statistics with the double-entry bookkeeping principle by (a) including it in the financial accounts as the part of FDI to reflect the direct investor’s increased investment in the foreign subsidiary, associate or branch and (b) recording as a investment income payments in the current account, representing the direct investor’s income on equity investment. Reinvested earnings of the AMCs increased from `1,442 million in 2008-09 to `2,389 million in 2009-10 and further to `3,791 million in 2010-11 reflecting the increased profit earnings by the AMCs. Conclusions Foreign liabilities of MFs are overwhelmingly on account of issue of MF Units to non-residents. Among the countries, UAE and USA accounted for the major share of liabilities, both at face value as well as at market value even as country details for a large share of investment was not received. In case of AMCs, Singapore had largest share in both foreign liabilities and assets. Portfolio assets constituted major portion of foreign assets of MFs after liberalisation of the policies on overseas investment by MFs. Within portfolio investment, the assets were overwhelmingly in terms of equity investment, overseas mutual fund units had a small share and no MF invested in debt securities abroad.
* Prepared in the External Liabilities and Assets Statistics Division of the Department of Statistics and Information Management (DSIM). The previous study in the series with reference period 2006-2009 was published in May 2011 issue of the RBI Bulletin. |
||||||||||||||||||||||||||||||||||||||||||||||||||||||||||||||||||||||||||||||||||||||||||||||||||||||||||||||||||||||||||||||||||||||||||||||||||||||||||||||||||||||||||||||||||||||||||||||||||||||||||||||||||||||||||||||||||||||||||||||||


