Survey of Small Borrowal Accounts : 2008* The Survey of Small Borrowal Accounts for the year ended March 31, 2008 is the seventh in the series and was conducted to obtain a profile of small borrowal accounts (accounts each with credit limit of `2 lakh or less) for which account-wise details are not collected through the Basic Statistical Returns (BSR) system. These accounts constitute about 88 per cent of all borrowal accounts, even though in terms of outstanding credit, their share is less than 14 per cent. The survey covered 52.6 per cent of over 9.4 crore small borrowal accounts and 47.5 per cent of the outstanding credit of `3,29,396 crore to small borrowers. Agriculture and Personal Loans dominated the small borrowal accounts. About 40 per cent of the agricultural loans were disbursed through Kisan Credit Cards and about 60 per cent of agricultural loans were charged interest at the rate of 6 to 10 per cent annually. While presenting the broad structure of these accounts, separate profile of accounts of the women borrowers are also presented. Highlights
-
According to BSR data, for various years, small borrowal accounts form around 90 per cent of all borrowal accounts whereas their share in outstanding bank credit is generally lower than 20 per cent.
-
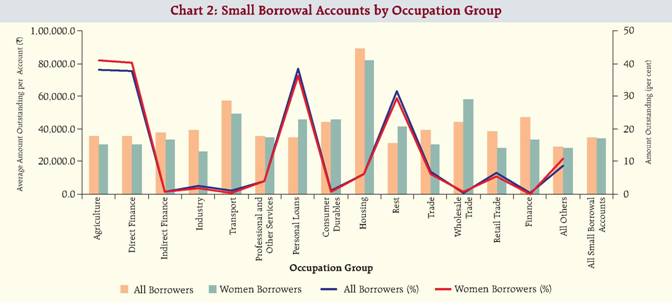
Personal loans dominated the occupation categories of small borrowal accounts with shares of 38.7 per cent and 38.5 per cent in terms of number and amount outstanding, respectively, followed by 'Agriculture' with shares of 37.6 per cent and 38.2 per cent in terms of number and amount outstanding, respectively, The share of number of agricultural loans increased marginally from that in March 2006 while the same for personal loans declined.
-
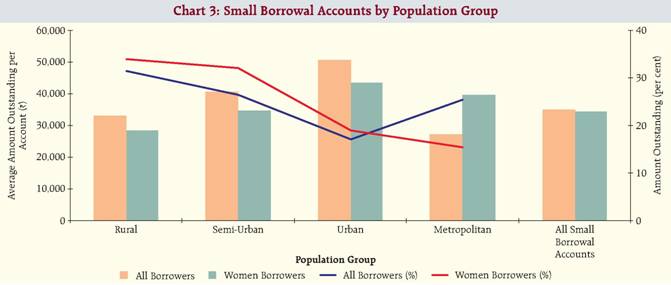
A large portion of small borrowal accounts was sanctioned in Rural areas with 33.1 per cent share in terms of number and 31.5 per cent in terms of the amount outstanding, This was followed by Metropolitan areas with shares of 32.6 per cent and 25.3 per cent, respectively, in terms of number of accounts and amount outstanding, Though the share of small borrowal accounts in Rural areas declined between March 2006 and March 2008, its share in amount outstanding had risen.
-
Among various Bank groups, Nationalised Banks had maximum small borrowal accounts with share of 32.3 per cent in number and 40.2 per cent in amount outstanding, This was followed by Other Scheduled Commercial Banks which accounted for 24.7 per cent and 17.2 per cent in total number of small borrowal accounts and amount outstanding, respectively, The share of Other Scheduled Commercial Banks substantially increased between 2006 and 2008.
-
The distribution of small borrowal accounts as per size of credit limit was skewed, 48.3 per cent of the small borrowal accounts were with credit limit up to `25,000 but accounted for only 15.5 per cent of the total amount outstanding, The small borrowal accounts each with credit limit above `1 lakh formed just 11.4 per cent of all borrowal accounts but accounted for 36.3 per cent of the total amount outstanding.
-
Term loans dominated the type of loan accounts with shares of 40.7 per cent and 47.3 per cent in terms of number and outstanding amount, respectively. This was followed by Demand loans constituting 17.2 per cent and 15.4 per cent of number of small borrowal accounts and outstanding amount, respectively, It was observed that 16.0 per cent of the loans were extended through Kisan Credit Cards (Production & Investment), which accounted for 17.7 per cent of the total outstanding amount. About 42.0 per cent of the Agricultural loans was issued through Kisan Credit Cards (Production & Investment) accounting for a share of 45.6 per cent of the outstanding amount. The share of Term loans in terms of number increased between March 2006 and March 2008 but its share in amount outstanding declined.
-
Most of the small borrowal accounts were Standard Assets and they constituted 89.5 per cent of all the small borrowal accounts and 92.0 per cent in terms of amount outstanding. Thus, only 10.5 per cent of all the accounts were found to be non-performing assets (NPA).
-
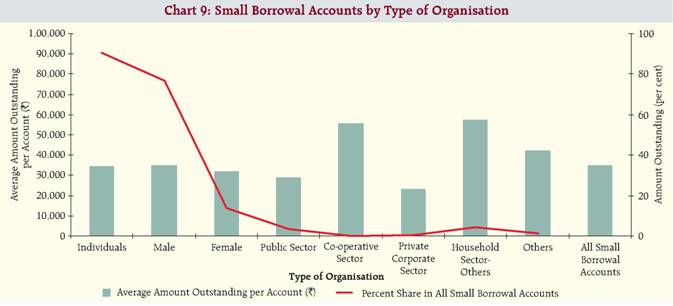
The majority of small borrowal accounts were held by Individuals with share of 91.7 per cent in total small borrowal accounts and 90.5 per cent in the amount outstanding. Among individuals, majority of the accounts belonged to male members. The female borrowers formed only 15.1 per cent and 13.9 per cent of total number of small borrowal accounts and amount outstanding, respectively.
-
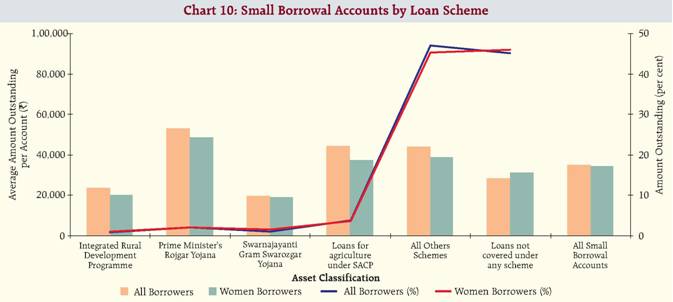
The small borrowal accounts sanctioned under various loan schemes, viz., Integrated Rural Development Programme (IRDP), Prime Minister's Rojgar Yojna [including Self-Employment scheme for Educated Unemployed Youth (SEEUY)], Swarnajayanti Gram Swarozgar Yojana (SGSY) and Loans for agriculture under Special Agriculture Credit Plan (SACP) formed just 7.5 per cent of the total small borrowal accounts and accounted for about 7.8 per cent of the amount outstanding. The loan accounts not covered under any scheme formed about 55.2 per cent of total small borrowal accounts, accounting for 45.1 per cent of the amount outstanding. The share of loans under Integrated Rural Development Programme (IRDP) declined between March 2006 and March 2008.
-
A large number of the small borrowal accounts (29.5 per cent) were charged interest rates in the range of '6 to 10 per cent’ accounting for 31.0 per cent share of the amount outstanding. About 60.6 per cent of the Agricultural loans were priced at an annual rate of interest between '6 and 10 per cent’ and their share was 58.1 per cent in the outstanding amount. About two-fifths of the Housing loans (38.7 per cent) were charged between '6 and 10 per cent’ per annum with 38.1 per cent share in the amount outstanding.
-
Among various social groups, only 3.3 per cent and 1.7 per cent of the small borrowal accounts belonged to Scheduled Castes (including neo-Buddhists) and Scheduled Tribes, respectively. The corresponding shares in total amount outstanding stood at 2.4 per cent and 1.2 per cent, respectively.
-
Among the major states, Maharashtra accounted for the largest share of 24.0 per cent of small borrowal accounts followed by Tamil Nadu (13.9 per cent) and Andhra Pradesh (11.6 per cent). Even, in terms of amount outstanding, the highest share was owned by Maharashtra at 15.0 per cent followed by Tamil Nadu (13.6 per cent) and Andhra Pradesh (11.6 per cent).
I. Introduction In the present system of Basic Statistical Returns (BSR) from Scheduled Commercial Banks (SCBs) in India, data on various aspects of borrowal accounts are collected through BSR-1 return which constitutes two parts, viz., Part A and Part B. While the detailed account-wise information on borrowal accounts, each with credit limit above `2 lakh are collected in Part A, broad occupation group-wise consolidated data relating to accounts each with credit limit of `2 lakh or less (mentioned as small borrowal accounts here) are collected in Part B. Small borrowal accounts are predominant in number, comprising 88.0 per cent of all accounts, though their share in amount outstanding was relatively low at 13.6 per cent of the total outstanding credit as at the end of March 31, 2008. In view of the increased attention accorded to the weaker segments of the society in recent years, it was felt that disaggregated data on the small borrowal accounts would be beneficial. Therefore, a sample Survey of Small Borrowal Accounts is being conducted by the Reserve Bank of India. The main objective of the survey is to obtain the profile of small borrowal accounts and the structural pattern of these accounts according to important characteristics such as the size of outstanding credit, occupation, category and social group of the borrower, type of account, type of loan scheme, rate of interest charged, etc. The present survey was conducted with reference period as end-March 2008. Details of small borrowal accounts in respect of all the branches of Scheduled Commercial Banks (excluding Regional Rural Banks), maintaining centralised database at their Head Office, are collected using a simple schedule, whereas, similar data were collected from the selected sample branches of Regional Rural Banks. After detailed scrutiny of the data, the data in respect 39,097 of branches were found suitable for processing and the estimates are generated based on this data, The sample covers 52.6 per cent of the total small borrowal accounts and 47.5 per cent of total amount outstanding in these accounts. The details of the sample design and estimation procedure are given in Annex I. A copy of the schedule is given in Annex II. This article presents the salient features of small borrowal accounts as on March 31, 2008, based on the results emerging from the survey and it is organised into four sections, Abroad profile of thesmall borrowal accounts from March 1975 onwards is presented in Section II, Section III deals with the salient features of small borrowal accounts according to important classificatory characteristics, viz., occupation, population group, bank group, size of credit limit, amount outstanding, type of loan account, asset classification, type of organisation, loan scheme, rate of interest, social group, etc. Classification of small borrowal accounts as per population group, bank group, size of credit limit, type of account, asset classification, type of organisation and rate of interest for various occupation categories are given in statements 1 to 7. The interest cost differential between small and large borrowal accounts across the major occupation groups is reported in Section IV, Section V presents the comparative results of this survey with those of the past round of the survey (Survey of Small Borrowal Accounts, March 2006).
II. Profile of Small Borrowal Accounts, 1975-2008 According to BSR data on banking statistics over the last three decades from 1975 to 2008, small borrowal accounts are predominant in number, accounting for over 87 per cent of all borrowal accounts even though the cut-off credit limit for classification of small borrowal accounts has been revised upwards twice during this period, The cut-off point of the credit limit, which was set at `10,000 at the time of inception in 1972, has been revised upwards to `25,000 from June 1984 and `2 lakh effective from March 1999 (effective from March 2002 in the case of Regional Rural Banks).
Table 1 : Profile of Small Borrowal Accounts, 1975 to 2008 |
At the end of |
Cut-off Limit
for Small
Borrowal
Account
(`) |
Small Borrowal Accounts |
All Accounts |
Per cent Share of
Small Borrowal
Accounts in All Accounts |
No. of
Acc
ounts
(Thou
sands) |
Amount
Outst
anding
(` Crore) |
Average
Amount
Outst
anding per Account (`) |
No. of
Acc
ounts
(Thou
sands) |
Amount
Outsta
nding
(` Crore) |
Average
Amount
Outsta
nding per Account (`) |
No. of Acco
unts |
Amount
Outst
anding |
1 |
2 |
3 |
4 |
5 |
6 |
7 |
8 |
9 |
June 1975 |
10,000 |
5607 |
831 |
1,482 |
6180 |
9,011 |
14,581 |
90.7 |
9.2 |
June 1976 |
10,000 |
7674 |
1,110 |
1,447 |
8317 |
11,678 |
14,041 |
92.3 |
9.5 |
June 1977 |
10,000 |
10016 |
1,393 |
1,391 |
10750 |
13,457 |
12,518 |
93.2 |
10.4 |
June 1978 |
10,000 |
12137 |
1,816 |
1,496 |
13007 |
15,961 |
12,271 |
93.4 |
11.4 |
June 1979 |
10,000 |
14336 |
2,336 |
1,630 |
15383 |
19,163 |
12,457 |
93.2 |
12.2 |
June 1980 |
10,000 |
16832 |
2,886 |
1,714 |
18034 |
21,312 |
11,817 |
93.4 |
13.5 |
June 1981 |
10,000 |
19307 |
3,553 |
1,840 |
20747 |
24,875 |
11,990 |
93.1 |
14.3 |
June 1982 |
10,000 |
21877 |
4,582 |
2,094 |
23516 |
29,590 |
12,583 |
93.0 |
15.5 |
June 1983 |
10,000 |
23682 |
5,089 |
2,149 |
25563 |
35,020 |
13,700 |
92.6 |
14.5 |
June 1984 |
25,000 |
28211 |
8,897 |
3,154 |
29537 |
43,326 |
14,668 |
95.5 |
20.5 |
June 1985 |
25,000 |
32137 |
10,028 |
3,120 |
33611 |
49,995 |
14,874 |
95.6 |
20.1 |
June 1986 |
25,000 |
37143 |
12,615 |
3,396 |
38789 |
56,182 |
14,484 |
95.8 |
22.4 |
June 1987 |
25,000 |
41620 |
15,444 |
3,711 |
43436 |
63,727 |
14,672 |
95.8 |
24.2 |
June 1988 |
25,000 |
45886 |
17,954 |
3,913 |
47981 |
71,285 |
14,857 |
95.6 |
25.2 |
June 1989 |
25,000 |
49717 |
22,330 |
4,491 |
52113 |
88,027 |
16,892 |
95.4 |
25.4 |
Mar, 1990 |
25,000 |
51180 |
24,147 |
4,718 |
53851 |
1,04,312 |
19,370 |
95.0 |
23.1 |
Mar, 1991 |
25,000 |
58784 |
27,323 |
4,648 |
61947 |
1,24,203 |
20,050 |
94.9 |
22.0 |
Mar, 1992 |
25,000 |
62548 |
29,945 |
4,788 |
65861 |
1,36,706 |
20,757 |
95.0 |
22.0 |
Mar, 1993 |
25,000 |
58521 |
32,091 |
5,484 |
62116 |
1,62,467 |
26,155 |
94.2 |
19.8 |
Mar, 1994 |
25,000 |
55810 |
32,188 |
5,767 |
59651 |
1,75,891 |
29,487 |
93.6 |
18.3 |
Mar, 1995 |
25,000 |
53915 |
34,060 |
6,317 |
58097 |
2,10,939 |
36,308 |
92.8 |
16.2 |
Mar, 1996 |
25,000 |
51905 |
36,253 |
6,985 |
56672 |
2,54,692 |
44,941 |
91.6 |
14.2 |
Mar, 1997 |
25,000 |
50094 |
37,446 |
7,475 |
55618 |
2,84,373 |
51,130 |
90.1 |
13.2 |
Mar, 1998 |
25,000 |
46828 |
41,095 |
8,776 |
53584 |
3,29,944 |
61,575 |
87.4 |
12.5 |
Mar, 1999 |
2,00,000 |
50997 |
88,282 |
17,311 |
52305 |
3,82,425 |
73,114 |
97.5 |
23.1 |
Mar, 2000 |
2,00,000 |
52856 |
1,02,745 |
19,439 |
54370 |
4,60,081 |
84,620 |
97.2 |
22.3 |
Mar, 2001 |
2,00,000 |
50456 |
1,06,294 |
21,067 |
52364 |
5,38,434 |
1,02,825 |
96.4 |
19.7 |
Mar, 2002 |
2,00,000 |
54130 |
1,25,649 |
23,212 |
56388 |
6,55,993 |
1,16,336 |
96.0 |
19.2 |
Mar, 2003 |
2,00,000 |
56527 |
1,45,057 |
25,662 |
59491 |
7,55,969 |
1,27,073 |
95.0 |
19.2 |
Mar, 2004 |
2,00,000 |
61900 |
1,62,700 |
26,284 |
66390 |
8,80,312 |
1,32,597 |
93.2 |
18.5 |
Mar, 2005 |
2,00,000 |
71106 |
1,99,880 |
28,110 |
77151 |
11,52,468 |
1,49,378 |
92.2 |
17.3 |
Mar, 2006 |
2,00,000 |
77122 |
2,48,498 |
32,221 |
85435 |
15,13,842 |
1,77,192 |
90.3 |
16.4 |
Mar, 2007 |
2,00,000 |
84347 |
2,78,895 |
33,065 |
94442 |
19,47,100 |
2,06,169 |
89.3 |
14.3 |
Mar, 2008 |
2,00,000 |
94132 |
3,29,396 |
34,993 |
106990 |
24,17,006 |
2,25,909 |
88.0 |
13.6 |
The share of small borrowal accounts (each with credit limit `10,000) in all accounts rose from 90.7 per cent in June 1975 to 92.6 per cent by June 1983 in terms of number, while their share in total outstanding credit registered a rise from 9.2 per cent to 14.5 per cent during the same period (Chart 1, Table 1), The average amount outstanding per small borrowal account, on the other hand, increased from `1,482 to `2,149 during the same period, The cut-off credit limit was raised to `25,000 for the first time in June 1984, The share of small borrowal accounts in terms of number of accounts remained almost stable at around 95 per cent during the period June 1984 to March 1992 and the subsequent period witnessed a steady fall in the share from 94.2 per cent in 1993 to 87.4 per cent in 1998. From March 1999, the cut-off point of credit limit for small borrowal accounts was raised to `2 lakh. The share of number of small borrowal accounts in all accounts ascended to 97.5 per cent by March 1999 and steadily declined to 88.0 per cent in March 2008. Similarly, the share of these accounts in amount outstanding at 23.1 per cent at the end of March 1999 started slumping and stood at 13.6 per cent at the end of March 2008. However, the average amount outstanding per small borrowal account in absolute terms showed a continuous upward trend from `17,311 in March 1999 to `34,993 in March 2008. III. Distribution of Small Borrowal Accounts According to Important Classificatory Characteristics The salient features of the small borrowal accounts according to important classificatory characteristics, viz., occupation group, population group, bank group, size of credit limit, type of account, asset classification, type of organization, etc. are presented below. Details of such classification for major occupational groups are also discussed in this section (Refer to statements 1 to 7 respectively).
Table 2 : Distribution of Small Borrowal Accounts by Occupation as on March 31, 2008 |
Occupation |
Percent Share |
Average Amount Outstanding per Account (`) |
Number of Accounts |
Amount Outstanding |
All Borrowers |
Women Borrowers |
All Borrowers |
Women Borrowers |
All Borrowers |
Women Borrowers |
1 |
2 |
3 |
4 |
5 |
6 |
1. Agriculture |
37.6 |
46.3 |
38.2 |
40.9 |
35,568 |
30,197 |
Direct Finance |
37.0 |
45.6 |
37.6 |
40.2 |
35,533 |
30,149 |
Indirect Finance |
0.6 |
0.8 |
0.6 |
0.7 |
37,951 |
33,132 |
2. Industry |
2.3 |
2.1 |
2.6 |
1.6 |
39,286 |
26,373 |
3. Transport and Other Support Services |
0.6 |
0.2 |
0.9 |
0.3 |
57,325 |
49,377 |
4. Professional and Other Services |
4.1 |
3.8 |
4.1 |
3.9 |
35,147 |
35,099 |
5. Personal Loans |
38.7 |
27.4 |
38.5 |
36.2 |
34,817 |
45,309 |
Consumer Durables |
0.7 |
0.6 |
0.9 |
0.8 |
44,363 |
45,559 |
Housing |
2.4 |
2.5 |
6.1 |
6.1 |
89,216 |
81,894 |
Rest |
35.5 |
24.3 |
31.4 |
29.4 |
30,934 |
41,479 |
6. Trade |
6.2 |
7.0 |
6.9 |
6.2 |
38,774 |
30,116 |
Wholesale Trade |
0.3 |
0.5 |
0.4 |
0.8 |
44,366 |
57,851 |
Retail Trade |
5.9 |
6.5 |
6.5 |
5.4 |
38,511 |
28,149 |
7. Finance |
0.2 |
0.2 |
0.3 |
0.2 |
46,857 |
33,690 |
8. All Others |
10.4 |
13.0 |
8.5 |
10.7 |
28,832 |
28,233 |
All Small Borrowal Accounts |
100.0 |
100.0 |
100.0 |
100.0 |
34,993 |
34,226 |
|
(94,132) |
(11,326) |
(3,29,396) |
(38,765) |
|
|
Note : The figures in brackets relate to the number of accounts in thousands and amount outstanding in ` crore. |
III.1 Occupation Group Personal loans dominated the occupation categories with a share of 38.7 per cent in terms of number of accounts (Table 2, Chart 2). This was followed by Agriculture with share of 37.6 per cent. Similar trend is observed in terms of amount outstanding. The share in terms of amount outstanding was the highest for Personal loans (38.5 per cent) which were followed by Agricultural loans (38.2 per cent). The shares of other occupation groups were found to be very low. The average amount outstanding per account was the highest for Housing loans (`89, 216) and it was followed by Transport and Other Support Services (`57,235).
It is observed that the number of small loans extended to women were also mainly for Agricultural purpose (46.3 per cent) and as Personal loans (27.4 per cent). The average amount outstanding per account to women borrowers was similar to those for all small borrowers. III.2 Population Group The maximum number of small borrowal accounts was sanctioned in Rural areas followed by Metropolitan cities with shares of 33.1 per cent and 32.6 per cent, respectively (Table 3, Chart 3). The shares in terms of amount outstanding were 31.5 and 25.3, respectively, for Rural and Metropolitan areas. However, the average amount outstanding per account was the highest at `50,609 in Urban areas and was lowest at `27,179 in Metropolitan areas.
Table 3 : Distribution of Small Borrowal Accounts by Population Group as on March 31, 2008 |
Population Group |
Percent Share |
Average Amount Outstanding per Account (`) |
Number of Accounts |
Amount Outstanding |
All Borrowers |
Women Borrowers |
All Borrowers |
Women Borrowers |
All Borrowers |
Women Borrowers |
1 |
2 |
3 |
4 |
5 |
6 |
1. Rural |
33.1 |
40.6 |
31.5 |
33.9 |
33,271 |
28,550 |
2. Semi-Urban |
22.9 |
31.5 |
26.5 |
32.0 |
40,609 |
34,812 |
3. Urban |
11.8 |
15.0 |
17.1 |
19.0 |
50,609 |
43,497 |
4. Metropolitan |
32.6 |
13.4 |
25.3 |
15.5 |
27,179 |
39,585 |
All Small Borrowal Accounts |
100.0 |
100.0 |
100.0 |
100.0 |
34,993 |
34,226 |
|
(94,132) |
(11,326) |
(3,29,396) |
(38,765) |
|
|
Note: The figures in brackets relate to the number of accounts in thousands and amount outstanding in `crore. |
In case of women borrowers, the share of Rural areas was the highest at 40.6 per cent in terms of numbers and 33.9 per cent in terms of amount outstanding. However, the share of women borrowers in Metropolitan in terms of number of accounts and amount outstanding were the lowest at 13.4 per cent and 15.5 per cent, respectively. III.3 Bank Group Among different bank groups, Nationalised Banks contributed to the highest shares of small borrowal accounts in terms of number of (32.3 per cent) as well as outstanding amount (40.2 per cent) (Table 4, Chart 4). On the other hand, the share of Foreign Banks in terms of number of small accounts and outstanding amount was the lowest at 8.3 per cent and 5.1 per cent, respectively. The average amount outstanding per account was relatively higher for SBI and its Associates and the Nationalised Banks.
Table 4: Distribution of Small Borrowal Accounts by Bank Group as on March 31, 2008 |
Bank Group |
Percent Share |
Average Amount Outstanding per Account (`) |
Number of Accounts |
Amount Outstanding |
All Borrowers |
Women Borrowers |
All Borrowers |
Women Borrowers |
All Borrowers |
Women Borrowers |
1 |
2 |
3 |
4 |
5 |
6 |
1. SBI & its Associates |
18.4 |
2.8 |
24.2 |
27.9 |
46,069 |
41,349 |
2. Nationalised Banks |
32.3 |
39.0 |
40.2 |
42.1 |
43,440 |
36,918 |
4. Foreign Banks |
8.3 |
2.5 |
5.1 |
1.9 |
21,440 |
25,283 |
5. Regional Rural Banks |
16.7 |
23.5 |
13.9 |
17.5 |
29,005 |
25,470 |
6. Other Scheduled Commercial Banks |
24.7 |
12.3 |
17.2 |
11.0 |
24,383 |
30,725 |
All Small Borrowal Accounts |
100.0 |
100.0 |
100.0 |
100.0 |
34,993 |
34,226 |
|
(94,132) |
(11,326) |
(3,29,396) |
(38,765) |
|
|
Note: The figures in brackets relate to the number of accounts in thousands and amount outstanding in ` crore. |
 |
Table 5 : Distribution of Small Borrowal Accounts by Credit Limit as on March 31, 2008 |
Size of Credit Limit (in Rupees) |
Percent Share |
Average Amount Outstanding per Account (`) |
Number of Accounts |
Amount Outstanding |
All Borrowers |
Women Borrowers |
All Borrowers |
Women Borrowers |
All Borrowers |
Women Borrowers |
1 |
2 |
3 |
4 |
5 |
6 |
1. Up to 2,500 |
13.3 |
12.5 |
1.5 |
1.4 |
3,914 |
3,947 |
2. 2,500-5,000 |
3.3 |
5.6 |
0.4 |
0.9 |
4,643 |
5,656 |
3. 5,000-10,000 |
7.5 |
11.4 |
1.9 |
3.2 |
8,636 |
9,450 |
4. 10,000-15,000 |
7.2 |
9.3 |
2.6 |
4.0 |
12,948 |
14,599 |
5. 15,000-25,000 |
17.1 |
19.4 |
9.1 |
11.6 |
18,620 |
20,558 |
Up to 25,000 |
48.3 |
58.1 |
15.5 |
21.1 |
11,226 |
12,426 |
6. 25,000-50,000 |
24.6 |
21.5 |
22.1 |
23.3 |
31,474 |
37,078 |
7. 50,000-75,000 |
7.7 |
6.2 |
10.4 |
10.5 |
47,439 |
57,349 |
8. 75,000-1,00,000 |
8.0 |
6.1 |
15.6 |
14.3 |
68,375 |
80,135 |
9. 1,00,000-1,50,000 |
6.1 |
4.4 |
16.2 |
14.7 |
92,409 |
1,13,433 |
10,1,50,000-2,00,000 |
5.3 |
3.6 |
20.1 |
16.1 |
1,34,187 |
1,53,227 |
All Small Borrowal Accounts |
100.0 |
100.0 |
100.0 |
100.0 |
34,993 |
34,226 |
|
(94,132) |
(11,326) |
(3,29,396) |
(38,765) |
|
|
Note: The figures in brackets relate to the number of accounts in thousands and amount outstanding in ` crore. |
III. 4 Size of Credit Limit The distribution of small borrowal accounts as per size of credit limit was skewed, 48.3 per cent of the small borrowal accounts with credit limit up to `25,000 each accounted for only 15.5 per cent of the amount outstanding (Chart 5, Table 5). Another 24.6 per cent of accounts were in the credit limit range of `25,000-50,000 and these had 22.1 per cent share in the amount outstanding, At the other extreme, accounts in the credit limit range of `1.5 lakh to `2 lakh contributed only 5.3 per cent in terms of number but accounted for 20.1 per cent of the outstanding amount, For women borrowers, the share of loan accounts with credit limit up to `25,000 each was even higher.
Table 6 : Distribution of Small Borrowal Accounts by Amount Outstanding as on March 31, 2008 |
Size of Amount Outstanding
(in Rupees) |
Percent Share |
Average Amount Outstanding per Account (`) |
Number of Accounts |
Amount Outstanding |
All Borrowers |
Women Borrowers |
All Borrowers |
Women Borrowers |
All Borrowers |
Women Borrowers |
1 |
2 |
3 |
4 |
5 |
6 |
1. Up to 2,500 |
20.7 |
16.7 |
0.4 |
0.4 |
639 |
842 |
2. 2,500-5,000 |
4.8 |
6.3 |
0.7 |
0.9 |
5,032 |
5,103 |
3. 5,000-10,000 |
9.1 |
12.3 |
2.3 |
3.3 |
8,725 |
9,216 |
4. 10,000-15,000 |
8.6 |
11.3 |
3.4 |
4.8 |
13,754 |
14,478 |
5. 15,000-25,000 |
14.3 |
15.9 |
8.7 |
10.6 |
21,397 |
22,801 |
Up to 25,000 |
57.6 |
62.5 |
15.5 |
20.0 |
9,402 |
10,967 |
6. 25,000-50,000 |
19.7 |
18.8 |
20.8 |
21.9 |
36,876 |
39,973 |
7. 50,000-75,000 |
8.9 |
8.1 |
15.3 |
15.3 |
60,139 |
64,418 |
8. 75,000-1,00,000 |
5.1 |
4.1 |
12.5 |
11.7 |
85,140 |
97,581 |
9. 1,00,000-1,50,000 |
5.4 |
4.1 |
18.0 |
16.0 |
1,16,611 |
1,33,880 |
10. 1,50,000-2,00,000 |
2.7 |
2.0 |
13.3 |
11.3 |
1,75,457 |
1,97,674 |
11. Above 2,00,000 |
0.6 |
0.5 |
4.7 |
3.8 |
2,60,521 |
2,69,164 |
All Small Borrowal Accounts |
100.0 |
100.0 |
100.0 |
100.0 |
34,993 |
34,226 |
|
(94,132) |
(11,326) |
(3,29,396) |
(38,765) |
|
|
Note : The figures in brackets relate to the number of accounts in thousands and amount outstanding in ` crore. |
Among the various occupational categories, Agricultural Loans had higher share of 56.8 per cent of accounts with credit limit up to `25,000 (Statement 3). For housing loans, only 17.2 per cent of the accounts had credit limit up to `25,000 each whereas about 44.1 per cent of the housing loan accounts were with credit limit between `1 lakh and `2 lakh and they accounted for 70.7 per cent of the amount outstanding.
III.5 Size of Outstanding amount Similar trend was noticed in the case of outstanding amount of small borrowing, Accounts with outstanding amount up to `25,000, constituted 57.6 per cent of the total number of such accounts but only 15.5 per cent of the total outstanding amount (Table 6, Chart 6), On the other hand, accounts with outstanding amount of `1.5 lakh to `2 lakh each constituted 2.7 per cent and 13.3 per cent of the total by number and amount respectively.
Table 7 : Distribution of Small Borrowal Accounts by Type of Account as on March 31, 2008 |
Type of Account |
Percent Share |
Average Amount Outstanding per Account (`) |
Number of Accounts |
Amount Outstanding |
All Borrowers |
Women Borrowers |
All Borrowers |
Women Borrowers |
All Borrowers |
Women Borrowers |
1 |
2 |
3 |
4 |
5 |
6 |
1. Kisan Credit Card |
16.0 |
14.3 |
17.7 |
14.4 |
38,536 |
34,465 |
2. Cash Credit |
4.9 |
3.6 |
6.2 |
3.4 |
44,719 |
32,325 |
3. Overdraft |
6.2 |
5.5 |
4.7 |
3.4 |
26,682 |
21,171 |
4. Demand Loan |
17.2 |
29.1 |
15.4 |
24.5 |
31,373 |
28,863 |
5. Credit Cards |
10.2 |
1.8 |
3.7 |
1.2 |
12,743 |
22,862 |
6. Term Loan |
40.7 |
39.0 |
47.3 |
46.5 |
40,631 |
40,845 |
Medium-Term Loans |
20.5 |
16.2 |
18.7 |
17.0 |
31,982 |
35,847 |
Long-Term Loans |
20.2 |
22.7 |
28.6 |
29.5 |
49,377 |
44,409 |
7. Others |
4.7 |
6.8 |
5.0 |
6.6 |
36,680 |
33,372 |
All Small Borrowal Accounts |
100.0 |
100.0 |
100.0 |
100.0 |
34,993 |
34,226 |
|
(94,132) |
(11,326) |
(3,29,396) |
(38,765) |
|
|
Note: The figures in brackets relate to the number of accounts in thousands and amount outstanding in ` crore. |
III.6 Type of Loan Account Term loans dominated the types of loan accounts with shares of 40.7 per cent and 47.3 per cent in terms of number and outstanding amount, respectively (Table 7, Chart 7). This was followed by Demand loans constituting 17.2 per cent of the total small borrowal accounts and 15.4 per cent of the total outstanding amount. It was observed that, 16.0 per cent of the loans were extended through Kisan Credit Cards (KCC) and in terms of amount outstanding its share is at 17.7 per cent. The average amount outstanding was the highest at `44,719 for Cash Credit and was lowest at `12,743 for Credit Cards. The average amount outstanding for loans through KCC was `38,536.
In case of women borrowers, the type of loan accounts follow similar pattern. It is, however, to be noticed that the share of borrowings through Credit Card was much lower for women borrowers, both in terms of number of accounts (1.8 per cent) and amount outstanding (1.2 per cent).
Table 8 : Distribution of Small Borrowal Accounts by Asset Classification as on March 31, 2008 |
Asset Classification |
Percent Share |
Average Amount Outstanding per Account (`) |
Number of Accounts |
Amount Outstanding |
All Borrowers |
Women Borrowers |
All Borrowers |
Women Borrowers |
All Borrowers |
Women Borrowers |
1 |
2 |
3 |
4 |
5 |
6 |
1. Standard Assets |
89.5 |
90.7 |
92.0 |
93.9 |
35,979 |
35,408 |
2. Sub-standard Assets |
4.1 |
2.8 |
3.9 |
2.6 |
32,880 |
32,494 |
3. Doubtful Assets |
4.6 |
4.2 |
3.2 |
2.4 |
24,747 |
20,049 |
4. Loss Assets |
1.8 |
2.3 |
0.9 |
1.0 |
17,301 |
15,471 |
All Small Borrowal Accounts |
100.0 |
100.0 |
100.0 |
100.0 |
34,993 |
34,226 |
|
(94,132) |
(11,326) |
(3,29,396) |
(38,765) |
|
|
Note: The figures in brackets relate to the number of accounts in thousands and amount outstanding in ` crore. |
About 42.0 percent of the Agricultural loans were issued through KCC (Production & Investment) accounting for a share of 45.6 per cent of the amount outstanding (Statement 4). Term loans (medium-term and long-term) were next which formed 23.5 per cent of the number of accounts with a share of 23.4 per cent in the amount outstanding. About 24.3 per cent of the Personal loans were Personal Credit Card loans. However, a predominant portion (92.2 percent) of the Housing loans included therein was in the form of Term loans.
III. 7 Asset Classification Most of the small borrowal accounts were Standard Assets and these constituted 89.5 per cent in terms of number and 92.0 per cent in terms of amount outstanding (Table 8, Chart 8). Thus, only 10.5 per cent of the accounts were found to be non-performing assets (NPAs); accounting for 8.0 per cent of the amount outstanding in respect of all small borrowal accounts. The share of Standard Assets in terms of number of accounts among different major occupation groups varied from 94.5 per cent for Housing loans to 68.7 per cent for Retail Trade (Statement 5). In terms of amount outstanding, the share varied from 97.5 per cent for loans to Other Financial Intermediaries to a lower level of 78.8 per cent for Retail Trade, In case of Trade, 14.7 per cent of accounts and 9.8 per cent of amount outstanding were classified as 'Doubtful Assets’, For Industry, 14.1 per cent of accounts and 8,6 per cent of amount outstanding were classified as 'Doubtful Assets'.
Table 9 : Distribution of Small Borrowal Accounts by Type of Organisation as on March 31, 2008 |
Type of Organisation |
Percent Share of All Small Borrowers |
Average
Amount
Outstanding
per Account
(`) |
Number of Accounts |
Amount Outstanding |
1 |
2 |
3 |
1. Individuals |
91.7 |
90.5 |
34,559 |
Male |
76.5 |
76.7 |
35,052 |
Female |
15.1 |
13.9 |
32,069 |
2. Public Sector |
4.0 |
3.3 |
28,756 |
3. Co-operative Sector |
- |
- |
55,818 |
4. Private Corporate Sector |
0.5 |
0.3 |
23,374 |
5. Household Sector - Others |
2.7 |
4.5 |
57,398 |
6. Others |
1.1 |
1.3 |
42,195 |
All Small Borrowal Accounts |
100.0 |
100.0 |
34,993 |
|
(94,132) |
(3,29,396) |
|
Note: The figures in brackets relate to the number of accounts in thousands and amount outstanding in ` crore. |
III.8 Type of Organisation The survey results revealed that 91.7 per cent of all small borrowal accounts, in terms of number. were held by Individuals which accounted for 90.5 per cent of the amount outstanding (Table 9, Chart 9). Women borrowers constituted 15.1 per cent in number and 13.9 per cent in terms of amount outstanding of the total small borrowal accounts. Even though the share of small loans to Co-operative Sector is negligible, the average amount outstanding per account is very high (`55,818). The share of Self-Help Groups and Micro - Finance Organizations (Others) and at 1.1 per cent in terms of number and at 1.3 per cent in terms of amount outstanding. The average amount outstanding was lowest at `28,756 for Public Sector Organisations.
III.9 Loan Scheme The small borrowal accounts, sanctioned under various major loans schemes, viz., Integrated Rural Development Programme (IRDP), Prime Minister's Rojgar Yojana [including Self-Employment scheme for Educated Unemployed Youth (SEEUY)], Swarnajayanti Gram Swarozgar Yojana (SGSY) and Loans for agriculture under Special Agriculture Credit Plan (SACP) formed just 7.5 per cent of the total small borrowal accounts and accounted for about 7.8 per cent of the total outstanding credit (Table 10, Chart 10). Loans disbursed under all other schemes contributed to 37.3 per cent of the total small borrowal accounts and 47.1 per cent of the total amount outstanding, The loan accounts not covered under any scheme formed about 55.2 per cent of total small borrowal accounts, accounting for 45.1 per cent of the amount outstanding. The average amount outstanding per account was maximum at `53,000 under SEEUY scheme and was minimum at `19,663 under SGSY scheme.
Table 10 : Distribution of Small Borrowal Accounts by Loan Scheme as on March 31, 2008 |
Loan Scheme |
Percent Share |
Average Amount Outstanding per Account (`) |
Number of Accounts |
Amount Outstanding |
All Borrowers |
Women Borrowers |
All Borrowers |
Women Borrowers |
All Borrowers |
Women Borrowers |
1 |
2 |
3 |
4 |
5 |
6 |
1. Integrated Rural Development Programme (IRDP) |
1.3 |
1.9 |
0.8 |
1.1 |
23,607 |
20,113 |
2. Prime Minister's Rojgar Yojana (including SEEUY) |
1.4 |
1.5 |
2.1 |
2.1 |
53,000 |
48,531 |
3. Swarnajayanti Gram Swarozgar Yojana (SGSY) |
1.8 |
2.8 |
1.0 |
1.5 |
19,663 |
19,061 |
4. Loans for agriculture under Special Agriculture Credit Plan (SACP) |
3.1 |
3.4 |
3.9 |
3.7 |
44,337 |
37,495 |
5. All Others Schemes |
37.3 |
39.8 |
47.1 |
45.4 |
44,212 |
39,057 |
6. Loans not covered under any scheme |
55.2 |
50.6 |
45.1 |
46.1 |
28,563 |
31,146 |
All Small Borrowal Accounts |
100.0 |
100.0 |
100.0 |
100.0 |
34,993 |
34,226 |
|
(94,132) |
(11,326) |
(3,29,396) |
(38,765) |
|
|
Note: The figures in brackets relate to the number of accounts in thousands and amount outstanding in ` crore. |
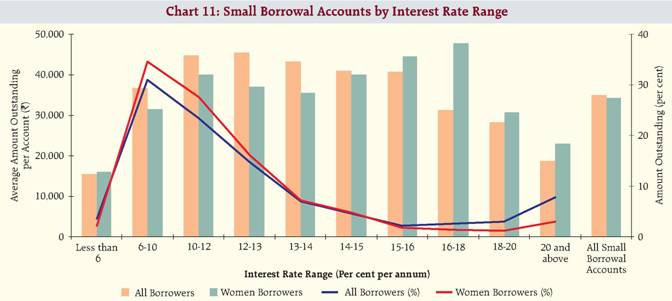
III. 10 Rate of Interest A large number of the small borrowal accounts (29.5 per cent) were charged interest rates in the range of '6 to 10 per cent’ accounting for 31.0 per cent share in amount outstanding (Table 11, Chart 11). Another 18.3 per cent small borrowal accounts were changed interest rate in the range of '10 to 12 per cent’. On the other hand, 14.6 per cent of small borrowers were charged interest rates above 20 per cent, which may be partly due to penal rates on NPAs.
Table 11 : Distribution of Small Borrowal Accounts by Rate of Interest as on March 31, 2008 |
Interest Rate Range
(Per cent per annum) |
Percent Share |
Average Amount Outstanding per Account (`) |
Number of Accounts |
Amount Outstanding |
All Borrowers |
Women Borrowers |
All Borrowers |
Women Borrowers |
All Borrowers |
Women Borrowers |
1 |
2 |
3 |
4 |
5 |
6 |
1. Less than 6 |
8.2 |
4.6 |
3.7 |
2.1 |
15,536 |
15,883 |
2. 6-10 |
29.5 |
37.5 |
31.0 |
34.6 |
36,836 |
31,566 |
3. 10-12 |
18.3 |
23.5 |
23.4 |
27.5 |
44,767 |
40,059 |
4. 12-13 |
11.3 |
15.1 |
14.8 |
16.3 |
45,610 |
37,031 |
5. 13-14 |
5.7 |
6.9 |
7.1 |
7.2 |
43,339 |
35,384 |
6. 14-15 |
3.9 |
4.1 |
4.5 |
4.7 |
40,896 |
39,879 |
7. 15-16 |
1.9 |
1.4 |
2.2 |
1.8 |
40,682 |
44,624 |
8. 16-18 |
2.9 |
1.1 |
2.6 |
1.5 |
31,146 |
47,627 |
9. 18-20 |
3.6 |
1.4 |
2.9 |
1.3 |
28,127 |
30,813 |
10. 20 and above |
14.6 |
4.5 |
7.8 |
3.0 |
18,744 |
22,904 |
All Small Borrowal Accounts |
100.0 |
100.0 |
100.0 |
100.0 |
34,993 |
34,226 |
|
(94,132) |
(11,326) |
(3,29,396) |
(38,765) |
|
|
Note: The figures in brackets relate to the number of accounts in thousands and amount outstanding in ` crore. |
60.6 per cent of the Agricultural Loans were priced at an annual rate of interest between '6 and 10 per cent’ and their share was 58.1 per cent in the outstanding amount (Statement 7). About one-fourth (24.1 per cent) of the accounts in Agricultural sector were priced in the interest rate range of '10-12 per cent’ with 24.8 per cent share in the amount outstanding, In case of Industry, 25.5 per cent of the accounts belonged to the interest rate range '10-12 percent’ with 28.5 percent share in the amount outstanding, About two-fifths of the Housing loans (38.7 per cent) were charged between '6 and 10 per cent’ per annum with 38.1 per cent share in the amount outstanding, 37.9 per cent of the Housing loans belonged to the interest rate range '10-12 per cent’ which accounted for 43.4 per cent share of the amount outstanding.
Table 12 : Distribution of Small Borrowal Accounts by Social Group as on March 31, 2008 |
Social Group |
Percent Share |
Average Amount Outstanding per Account (`) |
Number of Accounts |
Amount Outstanding |
All Borrowers |
Women Borrowers |
All Borrowers |
Women Borrowers |
All Borrowers |
Women Borrowers |
1 |
2 |
3 |
4 |
5 |
6 |
1. Scheduled Tribes |
1.7 |
2.5 |
1.2 |
1.5 |
25,299 |
20,600 |
2. Scheduled Castes
(including neo-Buddhists) |
3.3 |
6.4 |
2.4 |
3.8 |
25,560 |
20,452 |
3. Other Backward Castes |
8.0 |
11.8 |
8.0 |
11.3 |
35,269 |
32,661 |
4. General |
74.0 |
78.8 |
74.3 |
82.6 |
35,121 |
35,861 |
5. All Others |
13.0 |
0.4 |
14.1 |
0.8 |
37,762 |
- |
All Small Borrowal Accounts |
100.0 |
100.0 |
100.0 |
100.0 |
34,993 |
34,225 |
|
(94,132) |
(11,326) |
(3,29,396) |
(38,765) |
|
|
Note: The figures in brackets relate to the number of accounts in thousands and amount outstanding in ` crore. |
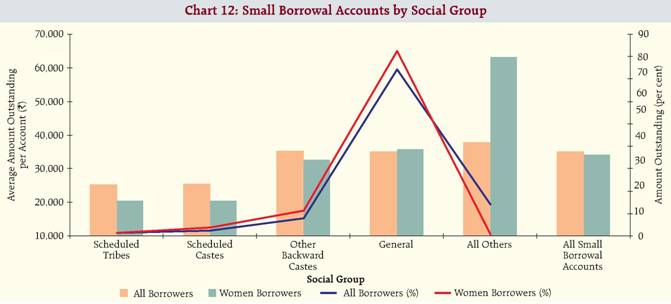
III. 11 Social Group 3.3 per cent of the small borrowal accounts belonged to 'Scheduled Castes’ (including neo-Buddhists) while those of 'Scheduled Tribes’ had a share of 1.7 per cent. The corresponding shares in total amount outstanding stood at 2.4 per cent and 1.2 per cent (Table 12, Chart 12), About 8.0 per cent of the borrowal accounts belonged to 'Other Backward Castes’ which accounted for 8.0 per cent of the total amount outstanding. In the case of small borrowal accounts of women, a similar trend was observed. The average amount outstanding for women accounts were comparatively lower that those of all accounts in most of the social groups.
III.12 Major States Maharashtra accounted for the largest share of 24.0 per cent of small borrowal accounts, followed by Tamil Nadu (13.9 per cent) and Andhra Pradesh (11.6 per cent). In terms of amount outstanding, the highest share was owned by Maharashtra (15.0 per cent) followed by Tamil Nadu (13.6 per cent) and Andhra Pradesh (11.6 percent) (Table 13, Chart 13). The share of small borrowal accounts in total number of borrowal accounts was also the highest for Maharashtra (93.6 per cent), followed by Andhra Pradesh and Orissa at 92.2 per cent each. This ratio was the least for Lakshadweep at 13.9 per cent. In terms of amount outstanding it was highest at 38.4 per cent in Nagaland, followed by Manipur (38.3 per cent) and Assam (33.6 per cent). However, this share was very low in Dadra & Nagar Haveli (1.5 per cent), Daman & Diu (2.4 per cent) and Delhi (2.6 per cent). The average amount outstanding per account was maximum in Haryana (`65,754) as against the all-India average of `34,993. It was followed by Andaman & Nicobar Islands (`63,981) and Mizoram (`63,560). The average amount outstanding per account was the lowest in Maharashtra (`21,811).
Table 13 : State-wise Number of Accounts and Amount Outstanding pertaining to Small and All Borrowal Accounts
as on March 31, 2008 |
Major States/UTs |
Small Borrowal Accounts |
All Accounts |
Per cent share of Small Borrowal Accounts in All Accounts |
No.
of Acc
ounts
(in 000's) |
Amo
unt
Outsta
nding
(` Crore) |
Average
Amount
Outsta
nding
per
Account
(`) |
(Percent Share)
|
No.
of Acco
unts
(in
000's) |
Amo
unt
Outsta
nding
(` Crore) |
Average
Amount
Outsta
nding
per
Account
(`) |
(Percent Share)
|
Num
ber
of
Acco
unts |
Amo
unt
Outsta
nding |
Num
ber
of
Acco
unts |
Amo
unt
Outsta
nding |
No.
of Accounts |
Amo
unt
Outst
anding |
1 |
2 |
3 |
4 |
5 |
6 |
7 |
8 |
9 |
10 |
11 |
12 |
Andaman & Nicobar |
15 |
95 |
63,981 |
0.02 |
0.03 |
26 |
850 |
3,32,914 |
0.02 |
0.04 |
58.2 |
11.2 |
Andhra Pradesh |
10,947 |
38,334 |
35,018 |
11.63 |
11.64 |
11,871 |
1,73,679 |
1,46,308 |
11.10 |
7.19 |
92.2 |
22.1 |
Arunachal Pradesh |
43 |
265 |
62,007 |
0.05 |
0.08 |
57 |
1,486 |
2,60,005 |
0.05 |
0.06 |
74.7 |
17.8 |
Assam |
1,131 |
5,194 |
45,919 |
1.20 |
1.58 |
1,270 |
15,470 |
1,21,836 |
1.19 |
0.64 |
89.1 |
33.6 |
Bihar |
3,040 |
9,886 |
32,525 |
3.23 |
3.00 |
3,335 |
30,549 |
91,610 |
3.12 |
1.26 |
91.2 |
32.4 |
Chandigarh |
122 |
752 |
61,461 |
0.13 |
0.23 |
210 |
22,292 |
10,59,941 |
0.20 |
0.92 |
58.2 |
3.4 |
Chhattisgarh |
813 |
3,713 |
45,684 |
0.86 |
1.13 |
971 |
20,459 |
2,10,740 |
0.91 |
0.85 |
83.7 |
18.1 |
Dadra & Nagar Haveli |
2 |
11 |
46,981 |
|
|
5 |
762 |
16,57,354 |
|
0.03 |
51.6 |
1.5 |
Daman & Diu |
4 |
15 |
43,505 |
|
|
5 |
639 |
11,89,847 |
0.01 |
0.03 |
66.1 |
2.4 |
Delhi |
1,794 |
7,206 |
40,174 |
1.91 |
2.19 |
2,513 |
2,75,757 |
10,97,476 |
2.35 |
11.41 |
71.4 |
2.6 |
Goa |
157 |
651 |
41,474 |
0.17 |
0.20 |
208 |
6,224 |
2,99,386 |
0.19 |
0.26 |
75.5 |
10.5 |
Gujarat |
2,629 |
11,609 |
44,151 |
2.79 |
3.52 |
3,502 |
1,47,282 |
4,20,599 |
3.27 |
6.09 |
75.1 |
7.9 |
Haryana |
1,198 |
7,877 |
65,754 |
1.27 |
2.39 |
1,542 |
50,038 |
3,24,503 |
1.44 |
2.07 |
77.7 |
15.7 |
Himachal Pradesh |
407 |
1,873 |
46,032 |
0.43 |
0.57 |
473 |
9,852 |
2,08,321 |
0.44 |
0.41 |
86.0 |
19.0 |
Jammu & Kashmir |
391 |
2,319 |
59,383 |
0.41 |
0.70 |
663 |
14,143 |
2,13,463 |
0.62 |
0.59 |
58.9 |
16.4 |
Jharkhand |
1,291 |
4,341 |
33,629 |
1.37 |
1.32 |
1,419 |
17,383 |
1,22,510 |
1.33 |
0.72 |
91.0 |
25.0 |
Karnataka |
6,944 |
26,463 |
38,111 |
7.38 |
8.03 |
8,048 |
1,97,630 |
2,45,554 |
7.52 |
8.18 |
86.3 |
13.4 |
Kerala |
5,053 |
19,002 |
37,609 |
5.37 |
5.77 |
5,743 |
72,945 |
1,27,007 |
5.37 |
3.02 |
88.0 |
26.1 |
Lakshadweep |
1 |
2 |
41,606 |
|
|
4 |
49 |
1,14,003 |
|
|
13.9 |
5.1 |
Madhya Pradesh |
2,818 |
13,841 |
49,118 |
2.99 |
4.20 |
3,306 |
53,654 |
1,62,310 |
3.09 |
2.22 |
85.2 |
25.8 |
Maharashtra |
22,575 |
49,238 |
21,811 |
23.98 |
14.95 |
24,127 |
6,30,910 |
2,61,492 |
22.55 |
26.10 |
93.6 |
7.8 |
Manipur |
55 |
343 |
62,768 |
0.06 |
0.10 |
76 |
897 |
1,17,873 |
0.07 |
0.04 |
71.9 |
38.3 |
Meghalaya |
90 |
450 |
50,171 |
0.10 |
0.14 |
129 |
1,854 |
1,43,484 |
0.12 |
0.08 |
69.4 |
24.3 |
Mizoram |
24 |
155 |
63,560 |
0.03 |
0.05 |
59 |
901 |
1,53,721 |
0.05 |
0.04 |
41.7 |
17.2 |
Nagaland |
75 |
429 |
57,405 |
0.08 |
0.13 |
88 |
1,116 |
1,27,260 |
0.08 |
0.05 |
85.2 |
38.4 |
Orissa |
2,933 |
10,529 |
35,895 |
3.12 |
3.20 |
3,183 |
33,624 |
1,05,639 |
2.97 |
1.39 |
92.2 |
31.3 |
Puducherry |
168 |
614 |
36,491 |
0.18 |
0.19 |
187 |
2,329 |
1,24,275 |
0.18 |
0.10 |
89.8 |
26.4 |
Punjab |
1,463 |
9,211 |
62,952 |
1.55 |
2.80 |
2,117 |
76,202 |
3,59,962 |
1.98 |
3.15 |
69.1 |
12.1 |
Rajasthan |
2,910 |
14,158 |
48,658 |
3.09 |
4.30 |
3,504 |
72,819 |
2,07,805 |
3.28 |
3.01 |
83.0 |
19.4 |
Sikkim |
29 |
163 |
55,473 |
0.03 |
0.05 |
41 |
1,132 |
2,77,363 |
0.04 |
0.05 |
72.1 |
14.4 |
Tamil Nadu |
13,061 |
44,673 |
34,204 |
13.87 |
13.56 |
14,392 |
2,32,374 |
1,61,459 |
13.45 |
9.61 |
90.8 |
19.2 |
Tripura |
118 |
459 |
39,003 |
0.12 |
0.14 |
301 |
1,708 |
56,806 |
0.28 |
0.07 |
39.1 |
26.9 |
Utter Pradesh |
7,815 |
30,090 |
38,501 |
8.30 |
9.13 |
8,825 |
1,12,902 |
1,27,940 |
8.25 |
4.67 |
88.6 |
26.7 |
Utterakhand |
584 |
2,693 |
46,121 |
0.62 |
0.82 |
689 |
11,585 |
1,68,191 |
0.64 |
0.48 |
84.8 |
23.2 |
West Bengal |
3,436 |
12,742 |
37,088 |
3.65 |
3.87 |
4,104 |
1,25,512 |
3,05,862 |
3.84 |
5.19 |
83.7 |
10.2 |
All India |
94,132 |
3,29,396 |
34,993 |
100.0 |
100.0 |
1,06,990 |
24,17,007 |
2,25,909 |
100.0 |
100.00 |
88.0 |
13.6 |
 |
IV. Interest Cost of Small Borrowal Accounts by Occupation In view of the importance accorded to interest charged on small borrowal accounts, an attempt was made to compare the interest cost of such accounts with those of large borrowal accounts (each with credit limit over `2 lakh) for major occupation groups. The interest cost in each category was worked out as a weighted average, using the amount outstanding in different interest rate ranges as the weights.
Table 14 : Average Interest Cost according to Small and Large borrowal Accounts, March 2008 |
Occupation |
Average Interest Rate (per cent) |
Small
Borrowal
Accounts
(Up to
`2 Lakh) |
Large
Borrowal
Accounts
(Above
`2 Lakh) |
Interest
Rate
Differential
[(3)-(2)] |
1 |
2 |
3 |
1. Agriculture |
9.0 |
11.8 |
2.8 |
Direct Finance |
9.0 |
11.8 |
2.8 |
Indirect Finance |
10.7 |
11.7 |
1.0 |
2. Industry |
13.0 |
12.4 |
-0.6 |
3. Transport and Other Support Services |
14.0 |
12.3 |
-1.7 |
4. Professional and Other Services |
12.2 |
12.6 |
0.4 |
5. Personal Loans |
14.2 |
12.0 |
-2.3 |
Consumer Durables |
23.9 |
16.7 |
-7.2 |
Housing |
9.8 |
10.5 |
0.7 |
Rest |
14.9 |
14.3 |
-0.6 |
6. Trade |
11.7 |
12.5 |
0.8 |
Wholesale Trade |
11.4 |
12.1 |
0.7 |
Retail Trade |
11.8 |
12.8 |
1.0 |
7. Finance |
10.1 |
12.7 |
2.6 |
8. All Others |
9.8 |
12.6 |
2.8 |
All Borrowal Accounts |
11.5 |
12.3 |
0.9 |
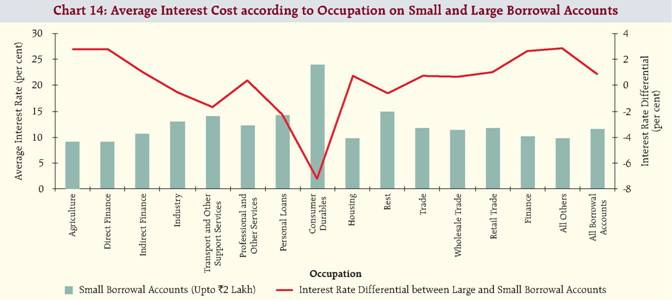
The average rate of interest on small borrowal accounts at 11.5 per cent was marginally lower than that on large borrowal accounts (12.3 per cent) at the end of March 2008 (Table 14, Chart 14). The average cost of borrowing in respect of small borrowal accounts in the Agricultural sector was the minimum at 9.0 per cent. For Industry. Transport Services, Professional and Other Services and Personal loans in general, the same varied in the range of 12.2 per cent to 14.2 per cent, The highest interest rate at 23.9 per cent was for Consumer Durables within Personal loans category. The interest rate differential, in absolute terms, between large and small borrowal accounts was minimum in case of Professional and Other Services and maximum in case of Consumer Durables. V. Comparison March 2008 Survey Results with March 2006 Survey Results In this section, the results of the current survey round (March 2008) are compared with those of the previous survey round of March 2006 in terms of some important classificatory characteristics. VI. Occupation Group It is observed that the shares of various occupations groups has remained almost similar in terms of number as well as amount outstanding during the both the survey rounds, The share of agriculture loan increased marginally from 36.1 per cent in March 2006 to 37.6 per cent in March 2008 while in terms of amount outstanding it increased from 31.1 per cent in March 2006 to 38.2 per cent in March 2008 (Table 15, Chart 15). The share of small borrowal accounts for Industry declined from 3.4 per cent to 2.3 per cent and from 4.0 per cent to 2.6 per cent in terms of amount outstanding. The share of Personal Loans declined from 40.6 per cent to 38.7 per cent in terms of number. The average amount outstanding per loan account increased for most of the occupation groups.
Table 15 : Distribution of Small Borrowal Accounts by Occupation Group as at end-March 2006 and 2008 |
Occupation Group |
Percent Share |
Average Amount Outstanding per Account (`) |
Number of Accounts |
Amount Outstanding |
As at end-March 2006 |
As at end-March 2008 |
As at end-March 2006 |
As at end-March 2008 |
As at end-March 2006 |
As at end-March 2008 |
Per cent (+)/ (-) in 2008 over 2006 |
1 |
2 |
3 |
4 |
5 |
6 |
7 |
1. Agriculture |
36.1 |
37.6 |
31.1 |
38.2 |
27,723 |
35,568 |
28.3 |
Direct Finance |
35.4 |
37.0 |
30.5 |
37.6 |
27,746 |
35,533 |
28.1 |
Indirect Finance |
0.7 |
0.6 |
0.6 |
0.6 |
26,594 |
37,951 |
42.7 |
2. Industry |
3.4 |
2.3 |
4.0 |
2.6 |
37,465 |
39,286 |
4.9 |
3. Transport and Other Support Services |
0.6 |
0.6 |
1.0 |
0.9 |
53,192 |
57,325 |
7.8 |
4. Professional and Other Services |
1.6 |
4.1 |
1.7 |
4.1 |
33,093 |
35,147 |
6.2 |
5. Personal Loans |
40.6 |
38.7 |
42.8 |
38.5 |
33,970 |
34,817 |
2.5 |
Consumer Durables |
1.9 |
0.7 |
2.5 |
0.9 |
42,985 |
44,363 |
3.2 |
Housing |
2.7 |
2.4 |
7.9 |
6.1 |
93,048 |
89,216 |
-4.1 |
Rest |
36.0 |
35.5 |
32.4 |
31.4 |
29,010 |
30,934 |
6.6 |
6. Trade |
7.0 |
6.2 |
7.0 |
6.9 |
32,505 |
38,774 |
19.3 |
Wholesale Trade |
0.4 |
0.3 |
0.6 |
0.4 |
53,488 |
44,366 |
-17.1 |
Retail Trade |
6.6 |
5.9 |
6.4 |
6.5 |
31,318 |
38,511 |
23.0 |
7. Finance |
0.1 |
0.2 |
0.1 |
0.3 |
33,074 |
46,857 |
41.7 |
8. All Others |
10.6 |
10.4 |
12.4 |
8.5 |
37,654 |
28,832 |
-23.4 |
All Small Borrowal Accounts |
100.0 |
100.0 |
100.0 |
100.0 |
32,221 |
34,993 |
8.6 |
|
(77,122) |
(94,132) |
(2,48,498) |
(3,29,396) |
|
|
|
V.2 Population Group The share of small borrowal accounts in Rural areas declined from 35.8 per cent to 33.1 per cent during the period between March 2006 and March 2008 (Table 16, Chart 16). However, the share in amount outstanding of Rural accounts had risen from 30.5 per cent to 31.5 per cent. In metropolitan areas, the share of number of accounts increased from 24.6 per cent to 32.6 per cent and the amount outstanding increased from 23.1 to 25.3 per cent.
Table 16 : Distribution of Small Borrowal Accounts by Population Group as at end-March 2006 and 2008 |
Population Group |
Per cent Share |
Average Amount Outstanding per Account (`) |
Number of Accounts |
Amount Outstanding |
As at end-March 2006 |
As at end-March 2008 |
As at end-March 2006 |
As at end-March 2008 |
As at end-March 2006 |
As at end-March 2008 |
Per cent (+)/ (-) in 2008 over 2006 |
1 |
2 |
3 |
4 |
5 |
6 |
7 |
Rural |
35.8 |
33.1 |
30.5 |
31.5 |
27,481 |
33270.6 |
21.1 |
Semi-Urban |
25.7 |
22.9 |
27.1 |
26.5 |
34,045 |
40608.8 |
19.3 |
Urban |
14.0 |
11.8 |
19.2 |
17.1 |
44,299 |
50608.9 |
14.2 |
Metropolitan |
24.6 |
32.6 |
23.1 |
25.3 |
30,340 |
27179.4 |
-10.4 |
All Small Borrowal Accounts |
100.0 |
100.0 |
100.0 |
100.0 |
32,221 |
34,993 |
8.6 |
|
(77,122) |
(94,132) |
(2,48,498) |
(3,29,396) |
|
|
|
Note : The figures in brackets relate to the number of accounts in thousands and amount outstanding in ` crore.
(+) Increase (-) Decrease |
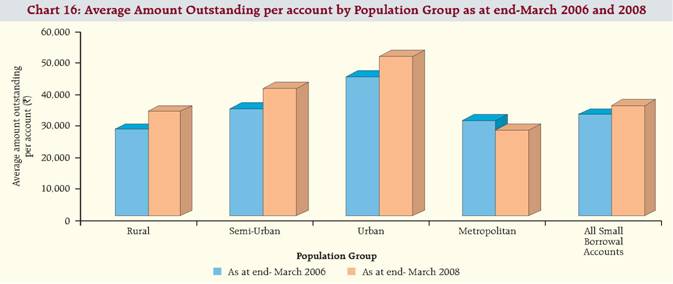 |
Table 17 : Distribution of Small Borrowal Accounts by Bank Group as at end-March 2006 and 2008 |
Bank Group |
Per cent Share |
Average Amount Outstanding per Account(`) |
Number of Accounts |
Amount Outstanding |
As at end-March 2006 |
As at end-March 2008 |
As at end-March 2006 |
As at end-March 2008 |
As at end-March 2006 |
As at end-March 2008 |
Per cent (+)/ (-) in 2008 over 2006 |
1 |
2 |
3 |
4 |
5 |
6 |
7 |
SBI & its Associates |
21.6 |
18.4 |
25.4 |
24.2 |
37,855 |
46,069 |
21.7 |
Nationalised Banks |
36.9 |
32.3 |
43.9 |
40.2 |
38,325 |
43,440 |
13.3 |
Regional Rural Banks |
17.1 |
8.3 |
12.1 |
5.1 |
22,859 |
21,440 |
-6.2 |
Foreign Banks |
11.8 |
16.7 |
4.6 |
13.9 |
12,707 |
29,005 |
128.3 |
Other Scheduled Commercial Banks |
12.5 |
24.7 |
13.9 |
17.2 |
35,617 |
24,383 |
-31.5 |
All Small Borrowal Accounts |
100.0 |
100.0 |
100.0 |
100.0 |
32,221 |
34,993 |
8.6 |
|
(77,122) |
(94,132) |
(2,48,498) |
(3,29,396) |
|
|
|
Note : The figures in brackets relate to the number of accounts in thousands and amount outstanding in ` crore.
(+) Increase (-) Decrease |
V.3 Bank Group Among various bank groups, Other Scheduled Commercial Banks had shown large increase in lending to small borrowers as their share in terms of number of accounts (24.7 per cent from 12.5 per cent) and amount outstanding (17.2 per cent from 13.9 per cent) increased between 2006 and 2008 (Table 17, Chart 17). The share of Foreign Banks recorded substantial increase, particularly with regard to amount outstanding, For Other bank groups, including the Regional Rural Banks, the share in terms of number of accounts and amount outstanding declined.
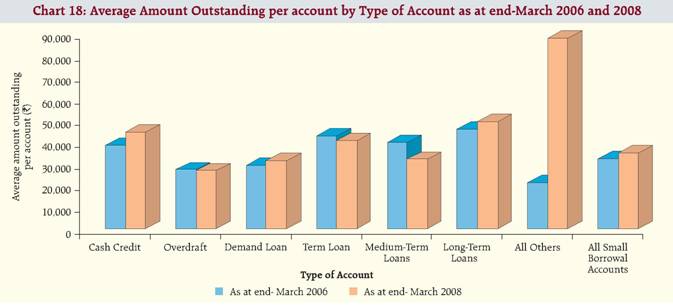
V.4 Type of Account The share of small borrowal accounts under Term Loans, which dominated all types of accounts, increased from 39.3 per cent in March 2006 to 40.7 per cent in March 2008 but their share in amount outstanding declined from 52.2 per cent to 47.3 per cent during the same period (Table 18, Chart 18). The share of number of accounts and amount outstanding under Demand Loan had shown a marginal rise.
Table 18 : Distribution of Small Borrowal Accounts by Type of Account as at end-March 2006 and 2008 |
Type of Account |
Per cent Share |
Average Amount Outstanding per Account (`) |
Number of Accounts |
Amount Outstanding |
As at end-March 2006 |
As at end-March 2008 |
As at end-March 2006 |
As at end-March 2008 |
As at end-March 2006 |
As at end-March 2008 |
Per cent (+)/ (-) in 2008 over 2006 |
1 |
2 |
3 |
4 |
5 |
6 |
7 |
Cash Credit |
5.0 |
4.9 |
5.9 |
6.2 |
38,342 |
44,719 |
16.6 |
Overdraft |
6.6 |
6.2 |
5.6 |
4.7 |
27,124 |
26,682 |
-1.6 |
Demand Loan |
16.8 |
17.2 |
15.2 |
15.4 |
28,994 |
31,373 |
8.2 |
Term Loan |
39.3 |
40.7 |
52.2 |
47.3 |
42,778 |
40,631 |
-5.0 |
Medium-Term Loans |
19.3 |
20.5 |
23.8 |
18.7 |
39,675 |
31,982 |
-19.4 |
Long-Term Loans |
20.0 |
20.2 |
28.4 |
28.6 |
45,769 |
49,377 |
7.9 |
All Others @ |
32.2 |
31.0 |
21.1@ |
26.4 |
21,134 |
87,960 |
316.2 |
All Small Borrowal Accounts |
100.0 |
100.0 |
100.0 |
100.0 |
32,221 |
34,993 |
8.6 |
|
(77,122) |
(94,132) |
(2,48,498) |
(3,29,396) |
|
|
|
Note: The figures in brackets relate to the number of accounts in thousands and amount outstanding in ` crore. |
V.5 Asset Classification The shares of Standard Assets, in terms of number of accounts increased marginally from 89.0 per cent in 2006 to 89.5 per cent in 2008, while in terms of amount outstanding it decreased from 92.5 per cent in 2006 to 92.0 per cent in 2008 (Table 19, Chart 19). On the other hand, the shares of Doubtful and Loss Assets declined both in terms of number and amount outstanding. V.6 Type of Organisation The share of number of small borrowal accounts disbursed to Individuals declined marginally between 2006 and 2008 (Table 20, Chart 20), It is noticed that the share of Male borrowers under Individual Category had gone up, whereas, that availed by Female has come down. V.7 Loan Scheme The share of number of accounts under Integrated Rural Development Programme (IRDP) declined from 3.8 per cent in March 2006 to 1.3 per cent in March 2008 and their share in amount outstanding also declined from 1.5 per cent to 0.8 per cent (Table 21, Chart 21). Similar trend was observed in case of loan accounts sanctioned under Prime Minister's Rojgar Yojana and Swarnajayanti Gram Swarozgar Yojana (SGSY) schemes. In case of all other schemes which constituted 40.4 per cent of all loan accounts in 2008, there was a significant decline in the percentage share in terms of number of accounts. The percentage share of 'Loans not covered under any schemes’ had gone up.
Table 19 : Distribution of Small Borrowal Accounts by Asset Classification as at end-March 2006 and 2008 |
Asset Classification |
Per cent Share |
Average Amount Outstanding per Account (`) |
Number of Accounts |
Amount Outstanding |
As at end-March 2006 |
As at end-March 2008 |
As at end-March 2006 |
As at end-March 2008 |
As at end-March 2006 |
As at end-March 2008 |
Per cent (+)/ (-) in 2008 over 2006 |
1 |
2 |
3 |
4 |
5 |
6 |
7 |
Standard Assets |
89.0 |
89.5 |
92.5 |
92.0 |
33,518 |
35,979 |
7.3 |
Sub-standard Assets |
2.3 |
4.1 |
2.3 |
3.9 |
31,580 |
32,880 |
4.1 |
Doubtful Assets |
5.7 |
4.6 |
3.9 |
3.2 |
22,017 |
24,747 |
12.4 |
Loss Assets |
3.0 |
1.8 |
1.3 |
0.9 |
13,729 |
17,301 |
26.0 |
All Small Borrowal Accounts |
100.0 |
100.0 |
100.0 |
100.0 |
32,221 |
34,993 |
8.6 |
|
(77,122) |
(94,132) |
(2,48,498) |
(3,29,396) |
|
|
|
Note: The figures in brackets relate to the number of accounts in thousands and amount outstanding in ` crore.
(+) Increase (-) Decrease |
 |
Table 20 : Distribution of Small Borrowal Accounts by Type of Organization as at end-March 2006 and 2008 |
Type of Organization |
Per cent Share |
Average Amount Outstanding per Account (`) |
Number of Accounts |
Amount Outstanding |
As at end-March 2006 |
As at end-March 2008 |
As at end-March 2006 |
As at end-March 2008 |
As at end-March 2006 |
As at end-March 2008 |
Per cent (+)/ (-) in 2008 over 2006 |
1 |
2 |
3 |
4 |
5 |
6 |
7 |
Individuals |
92.1 |
91.7 |
88.7 |
90.5 |
31013 |
34559 |
11.4 |
Male |
75.6 |
76.5 |
74.8 |
76.7 |
31856 |
35052 |
10.0 |
Female |
16.5 |
15.1 |
13.9 |
13.9 |
27145 |
32069 |
18.1 |
Public Sector |
1.7 |
4.0 |
1.3 |
3.3 |
24851 |
28756 |
15.7 |
Co-operative Sector |
0.1 |
0.0 |
0.1 |
0.0 |
42311 |
55818 |
31.9 |
Private Corporate Sector |
1.0 |
0.5 |
1.4 |
0.3 |
47449 |
23374 |
-50.7 |
Household Sector-Others |
4.2 |
2.7 |
7.5 |
4.5 |
57565 |
57398 |
-0.3 |
Others |
1.0 |
1.1 |
1.0 |
1.3 |
34590 |
42195 |
22.0 |
All Small Borrowal Accounts |
100.0 |
100.0 |
100.0 |
100.0 |
32,221 |
34,993 |
8.6 |
|
(77,122) |
(94,132) |
(2,48,498) |
(3,29,396) |
|
|
|
Note: The figures in brackets relate to the number of accounts in thousands and amount outstanding in ` crore. (+) Increase (-) Decrease |
 |
Table 21 : Distribution of Small Borrowal Accounts by Loan Scheme as at end-March 2006 and 2008 |
Loan Scheme |
Per cent Share |
Average Amount Outstanding per Account (`) |
Number of Accounts |
Amount Outstanding |
As at end-March 2006 |
As at end-March 2008 |
As at end-March 2006 |
As at end-March 2008 |
As at end-March 2006 |
As at end-March 2008 |
Per cent (+)/ (-) in 2008 over 2006 |
1 |
2 |
3 |
4 |
5 |
6 |
7 |
Integrated Rural Development Programme (IRDP) |
3.8 |
1.3 |
1.5 |
0.8 |
12,284 |
23607 |
92.2 |
Prime Minister's Rojgar Yojana (including (SEEUY)) |
2.5 |
1.4 |
3.8 |
2.1 |
48,381 |
53000 |
9.5 |
Swarnajayanti Gram Swarozgar Yojana (SGSY) |
2.2 |
1.8 |
1.4 |
1.0 |
20,748 |
19663 |
-5.2 |
All Others Schemes |
45.3 |
40.4 |
51.3 |
51.0 |
36,456 |
44222 |
21.3 |
Loans not covered under any scheme |
46.2 |
55.2 |
42.1 |
45.1 |
29,377 |
28563 |
-2.8 |
All Small Borrowal Accounts |
100.0 |
100.0 |
100.0 |
100.0 |
32,221 |
34,993 |
8.6 |
|
(77,122) |
(94,132) |
(2,48,498) |
(3,29,396) |
|
|
|
 |
The average amount outstanding per account for loans disbursed under IRDP increased by 92.2 per cent in 2008 from 2006. In case of 'Prime Minister's Rojgar Yojana’ and 'All Other Schemes’ the average amount outstanding per account increased by 9.5 per cent and 21.3 per cent, respectively in the same period. However, for 'Swarnajayanti Gram Swarozgar Yojana (SGSY)’ and 'Loans not covered under any schemes', the average amount outstanding per account had declined by 5.2 and 2.8 per cent, respectively. Personal loans and Agriculture loans dominated the small borrowal accounts. Large portion of these accounts was sanctioned in Rural areas. Nationalized Banks extended maximum number of small borrowal accounts. However, the share of Other Scheduled Commercial Banks substantially increased between 2006 and 2008. About 50 per cent of the small borrowal accounts with credit limit up to `25,000. In terms of type of loan accounts, the Term loans dominated the small borrowal accounts. Most of these accounts were classified as Standard Assets and only 10.5 per cent were found to be Non Performing Assets. The majority of small borrowal accounts were held by Individuals and large number of these accounts was charged interest rates in the range of '6 to 10 per cent’. The small borrowal accounts, sanctioned under various loan schemes formed less than 10 per cent of the total small borrowal accounts.
Statement 1 : Occupation and Population Group-wise percentage Distribution of Number of Accounts and Amount
Outstanding pertaining to Small Borrowal Accounts as on March 31,2008 |
Occupation |
Rural |
Semi-Urban |
Urban |
Percent share |
Percent share |
Percent share |
No. of Acco unts |
Amo unt out
stan ding |
Average
Amount
out
standing
per Account (`) |
No. of Acco unts |
Amo unt out
stan ding |
Average
Amount
out
standing
per Account (`) |
No. of Acco unts |
Amo unt out
stan ding |
Average
Amount
out
standing
per Account (`) |
1 |
2 |
3 |
4 |
5 |
6 |
7 |
8 |
9 |
1. Agriculture |
62.0 |
56.0 |
31,548 |
30.7 |
33.6 |
38,142 |
5.9 |
9.3 |
54,998 |
Direct Finance |
62.0 |
56.1 |
31,510 |
30.8 |
33.6 |
38,070 |
5.9 |
9.3 |
54,726 |
Indirect Finance |
61.0 |
52.8 |
34,016 |
29.8 |
32.6 |
42,895 |
6.6 |
11.8 |
70,733 |
2. Industry |
30.3 |
19.9 |
29,643 |
14.6 |
13.3 |
41,011 |
8.3 |
10.6 |
57,757 |
3. Transport and Other Support Services |
22.5 |
22.1 |
52,008 |
16.6 |
18.5 |
58,901 |
25.5 |
31.7 |
65,948 |
4. Professional and Other Services |
14.6 |
11.6 |
31,440 |
18.3 |
15.6 |
33,807 |
9.8 |
12.1 |
49,249 |
5. Personal Loans |
14.9 |
16.5 |
40,776 |
16.1 |
21.5 |
49,162 |
13.1 |
23.5 |
65,880 |
Consumer Durables |
20.2 |
10.5 |
30,785 |
22.2 |
12.9 |
34,449 |
20.8 |
13.9 |
39,601 |
Housing |
26.7 |
20.3 |
71,241 |
26.1 |
23.8 |
85,446 |
26.8 |
31.6 |
1,10,529 |
Rest |
14.1 |
16.0 |
37,657 |
15.4 |
21.3 |
45,910 |
12.2 |
22.4 |
60,849 |
6. Trade |
47.0 |
38.2 |
32,991 |
27.8 |
27.2 |
39,781 |
15.0 |
20.4 |
55,174 |
Wholesale Trade |
56.5 |
45.5 |
37,445 |
23.9 |
24.5 |
47,595 |
12.6 |
20.5 |
75,916 |
Retail Trade |
46.7 |
38.0 |
32,853 |
27.9 |
27.3 |
39,609 |
15.1 |
20.4 |
54,730 |
7. Finance |
33.2 |
27.4 |
35,810 |
20.2 |
20.0 |
42,966 |
10.2 |
11.6 |
49,121 |
8. All Others |
9.7 |
12.1 |
29,541 |
22.6 |
31.2 |
32,543 |
23.2 |
18.6 |
18,848 |
All Small Borrowal Accounts |
33.0 |
31.3 |
33,271 |
22.8 |
26.4 |
40,609 |
11.8 |
17.0 |
50,609 |
Statement 1 : Occupation and Population Group-wise percentage Distribution of Number of Accounts and Amount
Outstanding pertaining to Small Borrowal Accounts as on March 31,2008 (Concld.) |
Occupation |
Metro |
Total |
Percent share |
Percent share |
No. of Acco unts |
Amo unt out
stan ding |
Average
Amount
out
standing
per Account(`) |
No. of Acco unts |
Amo unt out
stan ding |
Average
Amount
out
standing
per Account (`) |
10 |
11 |
12 |
13 |
14 |
15 |
1. Agriculture |
1.3 |
1.0 |
26,873 |
100.0 |
100.0 |
35,568.3 |
Direct Finance |
1.3 |
1.0 |
26,409 |
100.0 |
100.0 |
35,532.6 |
Indirect Finance |
2.7 |
2.8 |
41,424 |
100.0 |
100.0 |
37,950.8 |
2. Industry |
46.8 |
56.2 |
54,224 |
100.0 |
100.0 |
39,285.9 |
3. Transport and Other Support Services |
35.4 |
27.8 |
41,629 |
100.0 |
100.0 |
57,325.4 |
4. Professional and Other Services |
57.3 |
60.6 |
41,940 |
100.0 |
100.0 |
35,147.4 |
5. Personal Loans |
55.9 |
38.5 |
25,322 |
100.0 |
100.0 |
34,817.5 |
Consumer Durables |
36.9 |
62.8 |
1,00,819 |
100.0 |
100.0 |
44,362.6 |
Housing |
20.3 |
24.3 |
1,12,251 |
100.0 |
100.0 |
89,216.2 |
Rest |
58.2 |
40.3 |
22,961 |
100.0 |
100.0 |
30,933.6 |
6. Trade |
10.2 |
14.2 |
56,503 |
100.0 |
100.0 |
38,773.5 |
Wholesale Trade |
7.1 |
9.5 |
62,816 |
100.0 |
100.0 |
44,365.8 |
Retail Trade |
10.3 |
14.4 |
56,391 |
100.0 |
100.0 |
38,510.6 |
7. Finance |
36.4 |
41.0 |
48,868 |
100.0 |
100.0 |
46,857.0 |
8. All Others |
44.5 |
38.1 |
20,216 |
100.0 |
100.0 |
28,832.5 |
All Small Borrowal Accounts |
32.5 |
25.2 |
27,179 |
100.0 |
100.0 |
34,992.9 |
Statement 2 : Occupation and Bank Group-wise percentage Distribution of Number of Accounts and Amount
Outstanding pertaining to Small Borrowal Accounts as on March 31, 2008 |
Occupation |
State Bank of India and ITS Associates |
Nationalised Banks |
Foreign Banks |
Percent share |
Percent share |
Percent share |
No. of Acco unts |
Amo unt out
stan ding |
Average
Amount
out
standing
per Account (`) |
No. of Acco unts |
Amo unt out
stan ding |
Average
Amount
out
standing
per Account (`) |
No. of Acco unts |
Amo unt out
stan ding |
Average
Amount
out
standing
per Account (`) |
1 |
2 |
3 |
4 |
5 |
6 |
7 |
8 |
9 |
1. Agriculture |
21.5 |
23.6 |
39,935 |
46.6 |
51.1 |
39,866 |
0.0 |
0.0 |
28,276 |
Direct Finance |
21.5 |
23.5 |
39,807 |
46.8 |
51.2 |
39,804 |
0.0 |
0.0 |
28,276 |
Indirect Finance |
20.4 |
26.8 |
48,564 |
38.5 |
46.6 |
44,734 |
0.0 |
0.0 |
- |
2. Industry |
12.1 |
13.1 |
47,277 |
41.0 |
37.4 |
39,884 |
0.3 |
0.2 |
26,080 |
3. Transport and Other Support Services |
10.6 |
15.7 |
77,410 |
44.3 |
48.5 |
57,008 |
0.0 |
0.0 |
9,357 |
4. Professional and Other Services |
3.5 |
4.2 |
46,414 |
27.1 |
32.2 |
45,525 |
5.3 |
4.4 |
32,369 |
5. Personal Loans |
18.8 |
29.5 |
53,707 |
18.3 |
28.1 |
52,777 |
20.2 |
12.1 |
20,587 |
Consumer Durables |
6.7 |
5.7 |
39,854 |
43.0 |
26.2 |
28,869 |
0.0 |
0.0 |
- |
Housing |
27.6 |
27.4 |
87,625 |
51.7 |
54.3 |
92,668 |
1.1 |
0.6 |
47,164 |
Rest |
18.5 |
30.6 |
50,487 |
15.6 |
23.2 |
45,418 |
21.8 |
14.7 |
20,498 |
6. Trade |
16.6 |
18.2 |
43,229 |
51.9 |
54.9 |
41,821 |
4.9 |
4.6 |
37,181 |
Wholesale Trade |
1.9 |
2.3 |
52,913 |
44.1 |
53.3 |
52,540 |
0.4 |
0.1 |
14,989 |
Retail Trade |
17.3 |
19.0 |
43,181 |
52.3 |
55.0 |
41,410 |
5.1 |
4.8 |
37,255 |
7. Finance |
7.5 |
9.5 |
54,165 |
51.4 |
53.8 |
44,571 |
0.2 |
0.1 |
30,320 |
8. All Others |
13.2 |
21.4 |
42,732 |
19.1 |
31.6 |
43,533 |
0.2 |
0.1 |
7,873 |
All Small Borrowal Accounts |
18.3 |
24.0 |
46,069 |
32.2 |
40.0 |
43,440 |
8.3 |
5.1 |
21,440 |
Statement 2 : Occupation and Bank Group-wise percentage Distribution of Number of Accounts and Amount
Outstanding pertaining to Small Borrowal Accounts as on March 31,2008 (Concld.) |
Occupation |
Regional rural banks |
Other scheduled commercial banks |
Total |
Percent share |
Percent share |
Percent share |
No. of Acco unts |
Amo unt out
stan ding |
Average
Amount
out
standing
per Account (`) |
No. of Acco unts |
Amo unt out
stan ding |
Average
Amount
out
standing
per Account (`) |
No. of Acco unts |
Amo unt out
stan ding |
Average
Amount
out
standing
per Account (`) |
10 |
11 |
12 |
13 |
14 |
15 |
16 |
17 |
18 |
1. Agriculture |
27.6 |
21.2 |
27,989 |
4.4 |
4.1 |
34,586 |
100.0 |
100.0 |
35,568.3 |
Direct Finance |
27.5 |
21.2 |
28,126 |
4.3 |
4.1 |
34,534 |
100.0 |
100.0 |
35,532.6 |
Indirect Finance |
32.5 |
18.1 |
20,580 |
8.6 |
8.5 |
36,255 |
100.0 |
100.0 |
37,950.8 |
2. Industry |
12.0 |
6.4 |
23,363 |
34.5 |
42.9 |
54,276 |
100.0 |
100.0 |
39,285.9 |
3. Transport and Other Support Services |
15.2 |
11.1 |
38,026 |
29.8 |
24.7 |
43,104 |
100.0 |
100.0 |
57,325.4 |
4. Professional and Other Services |
16.5 |
7.9 |
18,384 |
47.6 |
51.3 |
41,367 |
100.0 |
100.0 |
35,147.4 |
5. Personal Loans |
5.8 |
6.7 |
39,186 |
36.9 |
23.6 |
21,951 |
100.0 |
100.0 |
34,817.5 |
Consumer Durables |
32.8 |
28.1 |
40,576 |
17.4 |
40.0 |
1,08,665 |
100.0 |
100.0 |
44,362.6 |
Housing |
13.4 |
9.2 |
60,841 |
6.1 |
8.5 |
1,22,358 |
100.0 |
100.0 |
89,216.2 |
Rest |
4.8 |
5.5 |
35,057 |
39.3 |
26.0 |
20,163 |
100.0 |
100.0 |
30,933.6 |
6. Trade |
21.5 |
15.5 |
28,508 |
5.1 |
6.9 |
52,787 |
100.0 |
100.0 |
38,773.5 |
Wholesale Trade |
50.9 |
39.4 |
33,673 |
2.8 |
4.9 |
75,709 |
100.0 |
100.0 |
44,365.8 |
Retail Trade |
20.2 |
14.3 |
27,915 |
5.2 |
7.0 |
52,231 |
100.0 |
100.0 |
38,510.6 |
7. Finance |
26.3 |
20.6 |
33,438 |
14.7 |
15.9 |
46,171 |
100.0 |
100.0 |
46,857.0 |
8. All Others |
15.1 |
15.1 |
26,320 |
52.4 |
31.8 |
16,005 |
100.0 |
100.0 |
28,832.5 |
All Small Borrowal Accounts |
16.7 |
13.8 |
29,005 |
24.6 |
17.1 |
24,383 |
100.0 |
100.0 |
34,992.9 |
Statement 3 : Occupation and Size of credit limit-wise percentage Distribution of Number of Accounts and Amount
Outstanding pertaining to Small Borrowal Accounts as on March 31,2008 |
Occupation |
Up to 2500 |
2500 - 5000 |
5000 -10000 |
Percent share |
Percent share |
Percent share |
No. of Acco unts |
Amo unt out
stan ding |
Average
Amount
out
standing
per Account (`) |
No. of Acco unts |
Amo unt out
stan ding |
Average
Amount
out
standing
per Account (`) |
No. of Acco unts |
Amo unt out
stan ding |
Average
Amount
out
standing
per Account (`) |
1 |
2 |
3 |
4 |
5 |
6 |
7 |
8 |
9 |
1. Agriculture |
6.7 |
0.9 |
4,618.6 |
4.6 |
0.6 |
4,921.4 |
11.4 |
2.9 |
9,043.9 |
Direct Finance |
6.6 |
0.9 |
4,672.1 |
4.6 |
0.6 |
4,912.4 |
11.4 |
2.9 |
9,042.8 |
Indirect Finance |
9.9 |
0.6 |
2,252.9 |
6.2 |
0.9 |
5,361.3 |
10.3 |
2.5 |
9,124.2 |
2. Industry |
9.5 |
1.2 |
4,924.4 |
5.0 |
0.5 |
3,601.2 |
7.5 |
1.3 |
6,680.9 |
3. Transport and Other Support Services |
25.0 |
0.4 |
857.1 |
3.4 |
0.2 |
2,526.5 |
4.4 |
0.5 |
6,806.4 |
4. Professional and Other Services |
7.9 |
1.0 |
4,404.7 |
4.0 |
0.5 |
4,409.6 |
7.3 |
1.6 |
7,545.8 |
5. Personal Loans |
14.0 |
0.5 |
1,268.5 |
1.9 |
0.2 |
3,845.1 |
4.2 |
0.9 |
7,642.3 |
Consumer Durables |
6.0 |
0.5 |
3,940.2 |
2.8 |
0.3 |
4,739.7 |
7.4 |
2.9 |
17,440.6 |
Housing |
8.5 |
0.3 |
3,100.0 |
0.8 |
0.1 |
6,273.2 |
1.8 |
0.2 |
11,273.0 |
Rest |
14.6 |
0.6 |
1,173.3 |
1.9 |
0.2 |
3,751.5 |
4.3 |
1.0 |
7,190.2 |
6. Trade |
11.6 |
0.5 |
1,790.5 |
3.5 |
0.4 |
4,411.5 |
7.5 |
1.7 |
8,715.6 |
Wholesale Trade |
4.1 |
1.3 |
14,241.0 |
5.7 |
0.9 |
6,831.5 |
10.2 |
2.0 |
8,755.7 |
Retail Trade |
12.0 |
0.5 |
1,589.8 |
3.4 |
0.4 |
4,216.9 |
7.4 |
1.7 |
8,713.0 |
7. Finance |
16.0 |
0.1 |
416.2 |
0.9 |
0.1 |
3,873.9 |
2.9 |
0.5 |
8,872.3 |
8. All Others |
38.2 |
10.0 |
7,525.3 |
3.1 |
0.6 |
5,716.8 |
5.9 |
1.9 |
9,538.2 |
All Small Borrowal Accounts |
13.3 |
1.5 |
3,913.7 |
3.3 |
0.4 |
4,643.3 |
7.5 |
1.9 |
8,636.2 |
Statement 3 : Occupation and Size of credit limit-wise percentage Distribution of Number of Accounts and Amount
Outstanding pertaining to Small Borrowal Accounts as on March 31,2008 (Contd) |
Occupation |
10000 -15000 |
15000 - 25000 |
25000 - 50000 |
Percent share |
Percent share |
Percent share |
No. of Acco unts |
Amo unt out
stan ding |
Average
Amount
out
standing
per Account (`) |
No. of Acco unts |
Amo unt out
stan ding |
Average
Amount
out
standing
per Account (`) |
No. of Acco unts |
Amo unt out
stan ding |
Average
Amount
out
standing
per Account (`) |
10 |
11 |
12 |
13 |
14 |
15 |
16 |
17 |
18 |
1. Agriculture |
10.8 |
4.2 |
13,950.2 |
23.3 |
13.7 |
20,885.3 |
25.3 |
27.0 |
38,072.6 |
Direct Finance |
10.8 |
4.3 |
13,959.4 |
23.3 |
13.7 |
20,913.5 |
25.3 |
27.2 |
38,091.3 |
Indirect Finance |
9.0 |
3.1 |
13,209.6 |
22.9 |
11.5 |
18,978.9 |
19.2 |
18.5 |
36,434.7 |
2. Industry |
4.9 |
1.3 |
10,712.4 |
16.6 |
6.8 |
15,998.4 |
27.6 |
19.6 |
27,981.3 |
3. Transport and Other Support Services |
2.2 |
0.5 |
11,999.5 |
6.1 |
1.8 |
16,752.0 |
9.5 |
6.2 |
37,743.9 |
4. Professional and Other Services |
5.3 |
1.4 |
9,508.5 |
15.0 |
6.2 |
14,625.4 |
28.8 |
20.7 |
25,242.6 |
5. Personal Loans |
5.0 |
1.6 |
10,894.5 |
12.2 |
5.3 |
15,020.1 |
24.8 |
17.9 |
25,159.3 |
Consumer Durables |
7.8 |
5.3 |
30,366.4 |
17.8 |
12.9 |
32,187.3 |
34.4 |
32.2 |
41,537.1 |
Housing |
1.3 |
0.3 |
17,777.6 |
5.3 |
1.4 |
24,180.3 |
13.9 |
6.1 |
39,065.5 |
Rest |
5.2 |
1.7 |
10,161.6 |
12.6 |
5.8 |
14,251.0 |
25.4 |
19.8 |
24,179.2 |
6. Trade |
5.6 |
2.0 |
13,894.1 |
22.7 |
10.9 |
18,542.5 |
22.6 |
21.8 |
37,471.4 |
Wholesale Trade |
6.4 |
1.8 |
12,903.7 |
27.6 |
11.2 |
17,947.8 |
21.4 |
18.9 |
39,197.1 |
Retail Trade |
5.6 |
2.0 |
13,947.1 |
22.5 |
10.9 |
18,576.8 |
22.7 |
22.0 |
37,394.8 |
7. Finance |
2.8 |
0.7 |
12,687.2 |
13.3 |
4.8 |
16,896.7 |
25.0 |
17.9 |
33,561.7 |
8. All Others |
4.6 |
2.3 |
14,123.9 |
10.8 |
7.3 |
19,395.2 |
21.3 |
22.9 |
30,925.5 |
All Small Borrowal Accounts |
7.2 |
2.6 |
12,948.3 |
17.1 |
9.1 |
18,619.7 |
24.6 |
22.1 |
31,474.3 |
Statement 3 : Occupation and Size of credit limit-wise percentage Distribution of Number of Accounts and Amount
Outstanding pertaining to Small Borrowal Accounts as on March 31,2008 (Contd) |
Occupation |
50000 - 75000 |
75000 -100000 |
100000 -150000 |
Percent share |
Percent share |
Percent share |
No. of Acco unts |
Amo unt out
stan ding |
Average
Amount
out
standing
per Account (`) |
No. of Acco unts |
Amo unt out
stan ding |
Average
Amount
out
standing
per Account (`) |
No. of Acco unts |
Amo unt out
stan ding |
Average
Amount
out
standing
per Account (`) |
19 |
20 |
21 |
22 |
23 |
24 |
25 |
26 |
27 |
1. Agriculture |
5.8 |
10.0 |
61,316.3 |
5.7 |
14.1 |
87,553.8 |
3.6 |
12.7 |
1,25,647.5 |
Direct Finance |
5.8 |
10.0 |
61,317.3 |
5.7 |
14.1 |
87,644.3 |
3.6 |
12.6 |
1,25,636.4 |
Indirect Finance |
5.7 |
9.2 |
61,250.4 |
6.9 |
15.0 |
82,553.5 |
5.0 |
16.7 |
1,26,172.2 |
2. Industry |
6.6 |
8.9 |
53,397.1 |
9.6 |
18.3 |
74,693.4 |
5.8 |
15.8 |
1,07,069.2 |
3. Transport and Other Support Services |
9.7 |
10.6 |
62,262.0 |
18.6 |
28.4 |
87,385.5 |
11.7 |
25.1 |
1,22,807.9 |
4. Professional and Other Services |
6.7 |
9.3 |
48,824.8 |
9.0 |
16.6 |
65,206.2 |
8.1 |
17.7 |
76,904.1 |
5. Personal Loans |
10.6 |
11.2 |
36,660.0 |
10.5 |
16.3 |
54,244.1 |
9.4 |
20.8 |
77,429.1 |
Consumer Durables |
9.0 |
13.1 |
64,080.7 |
9.1 |
16.3 |
79,879.1 |
3.3 |
8.7 |
1,16,916.6 |
Housing |
8.7 |
6.5 |
66,629.8 |
15.6 |
14.4 |
82,311.2 |
20.0 |
27.3 |
1,21,862.3 |
Rest |
10.8 |
12.0 |
34,535.5 |
10.2 |
16.7 |
50,848.7 |
8.8 |
19.9 |
70,264.3 |
6. Trade |
6.8 |
10.9 |
62,594.0 |
9.4 |
19.3 |
79,690.7 |
4.3 |
11.0 |
98,154.2 |
Wholesale Trade |
4.0 |
5.5 |
61,776.6 |
8.0 |
15.4 |
85,167.2 |
5.3 |
14.8 |
1,23,352.0 |
Retail Trade |
6.9 |
11.2 |
62,616.1 |
9.5 |
19.6 |
79,472.2 |
4.3 |
10.8 |
96,681.3 |
7. Finance |
8.3 |
9.6 |
53,944.0 |
11.6 |
18.2 |
73,345.9 |
10.6 |
23.2 |
1,02,876.5 |
8. All Others |
4.6 |
9.3 |
59,129.3 |
4.7 |
13.4 |
82,777.8 |
3.3 |
13.4 |
1,17,847.2 |
All Small Borrowal Accounts |
7.7 |
10.4 |
47,438.5 |
8.0 |
15.6 |
68,375.3 |
6.1 |
16.2 |
92,409.1 |
Statement 3 : Occupation and Size of credit limit-wise percentage Distribution of Number of Accounts and Amount
Outstanding pertaining to Small Borrowal Accounts as on March 31,2008 (Concld) |
Occupation |
150000 - 200000 |
Total |
Percent share |
Percent share |
No. of Accounts |
Amount out
standing |
Average
Amount
out
standing
per Account (`) |
No. of Accounts |
Amount out
standing |
Average
Amount
out
standing
per Account (`) |
28 |
29 |
30 |
31 |
32 |
33 |
1. Agriculture |
2.9 |
13.9 |
1,69,760.6 |
100.0 |
100.0 |
35,568.35 |
Direct Finance |
2.9 |
13.7 |
1,69,668.7 |
100.0 |
100.0 |
35,532.58 |
Indirect Finance |
4.9 |
22.2 |
1,73,387.6 |
100.0 |
100.0 |
37,950.82 |
2. Industry |
6.9 |
26.4 |
1,49,164.3 |
100.0 |
100.0 |
39,285.85 |
3. Transport and Other Support Services |
9.3 |
26.4 |
1,62,732.3 |
100.0 |
100.0 |
57,325.35 |
4. Professional and Other Services |
8.0 |
25.0 |
1,09,780.0 |
100.0 |
100.0 |
35,147.37 |
5. Personal Loans |
7.4 |
25.3 |
1,18,745.6 |
100.0 |
100.0 |
34,817.47 |
Consumer Durables |
2.3 |
7.7 |
1,48,421.1 |
100.0 |
100.0 |
44,362.61 |
Housing |
24.1 |
43.5 |
1,60,865.9 |
100.0 |
100.0 |
89,216.15 |
Rest |
6.4 |
22.3 |
1,07,765.5 |
100.0 |
100.0 |
30,933.61 |
6. Trade |
5.9 |
21.4 |
1,40,543.1 |
100.0 |
100.0 |
38,773.53 |
Wholesale Trade |
7.3 |
28.1 |
1,71,485.9 |
100.0 |
100.0 |
44,365.82 |
Retail Trade |
5.8 |
21.0 |
1,38,730.7 |
100.0 |
100.0 |
38,510.57 |
7. Finance |
8.6 |
24.8 |
1,34,447.3 |
100.0 |
100.0 |
46,857.01 |
8. All Others |
3.5 |
18.8 |
1,54,069.9 |
100.0 |
100.0 |
28,832.47 |
All Small Borrowal Accounts |
5.3 |
20.1 |
1,34,186.9 |
100.0 |
100.0 |
34,992.89 |
Statement 4 : Occupation and Type of Account-wise percentage Distribution of Number of Accounts and Amount
Outstanding pertaining to Small Borrowal Accounts as on March 31, 2008 |
Occupation |
Cash credit |
Overdraft |
Demand Loan |
Percent share |
Percent share |
Percent share |
No. of Acco unts |
Amo unt out
stan ding |
Average
Amount
out
standing
per Account (`) |
No. of Acco unts |
Amo unt out
stan ding |
Average
Amount
out
standing
per Account (`) |
No. of Acco unts |
Amo unt out
stan ding |
Average
Amount
out
standing
per Account (`) |
1 |
2 |
3 |
4 |
5 |
6 |
7 |
8 |
9 |
1. Agriculture |
7.9 |
8.4 |
37,983.6 |
0.5 |
0.8 |
56,823.6 |
20.3 |
16.5 |
28,986.5 |
Direct Finance |
7.8 |
8.3 |
37,781.3 |
0.5 |
0.8 |
55,798.5 |
20.3 |
16.5 |
28,876.6 |
Indirect Finance |
11.8 |
14.6 |
46,883.6 |
1.5 |
3.2 |
79,681.5 |
21.8 |
20.5 |
35,805.3 |
2. Industry |
8.9 |
14.7 |
64,896.0 |
3.5 |
3.5 |
38,952.3 |
4.6 |
3.2 |
27,034.9 |
3. Transport and Other Support Services |
1.2 |
1.6 |
76,294.1 |
0.6 |
0.9 |
82,917.1 |
3.9 |
3.1 |
45,377.1 |
4. Professional and Other Services |
4.2 |
5.4 |
44,856.7 |
2.5 |
3.0 |
42,252.7 |
6.8 |
6.5 |
33,330.6 |
5. Personal Loans |
0.4 |
0.6 |
44,080.3 |
5.8 |
6.5 |
39,249.1 |
17.7 |
16.5 |
32,411.1 |
Consumer Durables |
0.6 |
0.7 |
55,691.1 |
1.3 |
1.2 |
40,686.9 |
16.0 |
14.3 |
39,578.6 |
Housing |
0.2 |
0.2 |
82,499.6 |
0.6 |
0.6 |
80,819.3 |
3.3 |
2.4 |
64,358.4 |
Rest |
0.5 |
0.6 |
42,618.8 |
6.2 |
7.9 |
38,956.4 |
18.7 |
19.3 |
31,905.0 |
6. Trade |
15.3 |
23.4 |
59,173.4 |
2.3 |
4.5 |
74,548.1 |
4.5 |
4.7 |
40,490.3 |
Wholesale Trade |
17.4 |
29.8 |
75,976.4 |
4.9 |
7.4 |
66,453.4 |
6.1 |
5.1 |
36,947.1 |
Retail Trade |
15.2 |
23.0 |
58,269.4 |
2.2 |
4.3 |
75,391.4 |
4.4 |
4.7 |
40,721.6 |
7. Finance |
5.2 |
3.7 |
32,854.2 |
3.4 |
2.9 |
39,997.1 |
6.6 |
3.8 |
27,156.4 |
8. All Others |
3.7 |
6.5 |
50,146.8 |
33.3 |
16.1 |
13,974.0 |
19.7 |
24.2 |
35,396.3 |
All Small Borrowal Accounts |
4.9 |
6.2 |
44,719.4 |
6.2 |
4.7 |
26,682.2 |
17.2 |
15.4 |
31,372.9 |
Statement 4 : Occupation and Type of Account-wise percentage Distribution of Number of Accounts and Amount
Outstanding pertaining to Small Borrowal Accounts as on March 31,2008 (Contd) |
Occupation |
Personal Credit Cards |
General Credit Cards |
Kisan Credit Cards - Production |
Percent share |
Percent share |
Percent share |
No. of Acco unts |
Amo unt out
stan ding |
Average
Amount
out
standing
per Account (`) |
No. of Acco unts |
Amo unt out
stan ding |
Average
Amount
out
standing
per Account (`) |
No. of Acco unts |
Amo unt out
stan ding |
Average
Amount
out
standing
per Account (`) |
10 |
11 |
12 |
13 |
14 |
15 |
16 |
17 |
18 |
1. Agriculture |
0.1 |
0.1 |
33,047.6 |
0.1 |
0.1 |
19,896.6 |
41.1 |
44.5 |
38,539.4 |
Direct Finance |
0.1 |
0.1 |
33,051.4 |
0.1 |
0.0 |
18,835.6 |
41.7 |
45.2 |
38,529.3 |
Indirect Finance |
0.0 |
0.0 |
18,775.1 |
0.7 |
0.5 |
29,756.6 |
2.9 |
3.7 |
48,226.1 |
2. Industry |
0.0 |
0.0 |
35,918.3 |
0.1 |
0.0 |
2,618.3 |
0.3 |
0.3 |
34,587.7 |
3. Transport and Other Support Services |
0.0 |
0.0 |
#DIV/0! |
0.0 |
0.0 |
24,210.5 |
0.0 |
0.0 |
68,832.8 |
4. Professional and Other Services |
0.1 |
0.0 |
20,398.1 |
0.1 |
0.0 |
8377.7 |
0.3 |
0.1 |
10,879.8 |
5. Personal Loans |
24.3 |
7.4 |
10,550.8 |
0.7 |
1.0 |
46,042.6 |
0.1 |
0.1 |
32,718.7 |
Consumer Durables |
0.1 |
0.1 |
46,570.8 |
12.3 |
28.2 |
1,02,016.1 |
1.2 |
0.4 |
13,663.4 |
Housing |
0.0 |
0.0 |
29,087.4 |
0.0 |
0.0 |
29,255.9 |
0.0 |
0.0 |
18,059.9 |
Rest |
26.4 |
9.0 |
10,548.9 |
0.5 |
0.3 |
19,567.1 |
0.1 |
0.1 |
39,056.1 |
6. Trade |
0.1 |
0.0 |
18,304.6 |
0.4 |
0.3 |
24,128.9 |
0.2 |
0.2 |
44,341.3 |
Wholesale Trade |
1.0 |
0.4 |
16,369.9 |
0.3 |
0.2 |
33,952.2 |
3.1 |
3.2 |
45,013.5 |
Retail Trade |
0.0 |
0.0 |
22,961.6 |
0.5 |
0.3 |
23,875.7 |
0.0 |
0.0 |
42,116.2 |
7. Finance |
0.0 |
0.0 |
#DIV/0! |
0.0 |
0.0 |
14,058.3 |
2.9 |
3.6 |
57,966.9 |
8. All Others |
0.1 |
0.1 |
19,539.7 |
0.0 |
0.0 |
45,430.1 |
1.5 |
1.9 |
36,348.5 |
All Small Borrowal Accounts |
9.4 |
2.9 |
10,648.1 |
0.4 |
0.4 |
40,923.8 |
15.7 |
17.2 |
38,491.5 |
Statement 4 : Occupation and Type of Account-wise percentage Distribution of Number of Accounts and Amount
Outstanding pertaining to Small Borrowal Accounts as on March 31,2008 (Contd) |
Occupation |
Kisan Credit Cards - Investment |
Other Credit Cards |
Medium Term Loans |
Percent share |
Percent share |
Percent share |
No. of Acco unts |
Amo unt out
stan ding |
Average
Amount
out
standing
per Account (`) |
No. of Acco unts |
Amo unt out
stan ding |
Average
Amount
out
standing
per Account (`) |
No. of Acco unts |
Amo unt out
stan ding |
Average
Amount
out
standing
per Account (`) |
19 |
20 |
21 |
22 |
23 |
24 |
25 |
26 |
27 |
1. Agriculture |
0.9 |
1.1 |
40,749.2 |
0.7 |
0.7 |
37,231.0 |
9.9 |
9.2 |
33,148.8 |
Direct Finance |
0.9 |
1.0 |
38,577.2 |
0.6 |
0.7 |
37,376.8 |
9.7 |
9.1 |
33,271.4 |
Indirect Finance |
3.8 |
7.5 |
75,586.4 |
1.1 |
0.9 |
31,426.2 |
21.0 |
16.2 |
29,375.0 |
2. Industry |
0.0 |
0.0 |
34,867.6 |
0.6 |
0.7 |
41,729.7 |
38.0 |
31.0 |
32,115.4 |
3. Transport and Other Support Services |
0.1 |
0.0 |
25,502.6 |
0.1 |
0.1 |
39,814.1 |
40.0 |
40.0 |
57,271.3 |
4. Professional and Other Services |
0.0 |
0.0 |
28,952.0 |
0.4 |
0.4 |
32,286.1 |
51.9 |
37.8 |
25,630.5 |
5. Personal Loans |
0.0 |
0.0 |
30,895.8 |
0.1 |
0.1 |
21,766.2 |
25.1 |
23.1 |
32,057.0 |
Consumer Durables |
0.0 |
0.0 |
#DIV/0! |
0.0 |
0.0 |
68,441.1 |
31.0 |
25.1 |
35,945.7 |
Housing |
0.0 |
0.0 |
36.2 |
0.0 |
0.0 |
57,339.0 |
11.7 |
9.6 |
73,619.6 |
Rest |
0.0 |
0.0 |
31,356.7 |
0.1 |
0.1 |
20,802.6 |
25.9 |
25.7 |
30,690.9 |
6. Trade |
0.0 |
0.0 |
34,552.2 |
1.1 |
1.2 |
39,700.4 |
20.3 |
16.2 |
31,016.8 |
Wholesale Trade |
0.0 |
0.0 |
2,29,451.1 |
0.2 |
0.4 |
81,473.8 |
19.4 |
17.9 |
41,045.5 |
Retail Trade |
0.0 |
0.0 |
33,504.1 |
1.2 |
1.2 |
39,338.1 |
20.3 |
16.1 |
30,566.7 |
7. Finance |
0.0 |
0.0 |
31,388.6 |
1.2 |
0.2 |
7,905.9 |
39.4 |
47.6 |
56,535.2 |
8. All Others |
0.0 |
0.0 |
28,483.7 |
0.4 |
0.4 |
29,119.3 |
23.9 |
27.2 |
32,740.9 |
All Small Borrowal Accounts |
0.4 |
0.4 |
40,456.9 |
0.4 |
0.4 |
35,395.1 |
20.5 |
18.7 |
31,982.5 |
Statement 4 : Occupation and Type of Account-wise percentage Distribution of Number of Accounts and Amount
Outstanding pertaining to Small Borrowal Accounts as on March 31,2008 (Concld) |
Occupation |
Long-Term Loans |
Others |
Total |
Percent share |
Percent share |
Percent share |
No. of Acco unts |
Amo unt out
stan ding |
Average
Amount
out
standing
per Account (`) |
No. of Acco unts |
Amo unt out
stan ding |
Average
Amount
out
standing
per Account (`) |
No. of Acco unts |
Amo unt out
stan ding |
Average
Amount
out
standing
per Account (`) |
28 |
29 |
30 |
31 |
32 |
33 |
34 |
35 |
36 |
1. Agriculture |
13.6 |
14.2 |
37,052.2 |
5.0 |
4.4 |
31,744.6 |
100.0 |
100.0 |
35,568.3 |
Direct Finance |
13.4 |
14.0 |
37,111.1 |
4.9 |
4.4 |
31,626.8 |
100.0 |
100.0 |
35,532.6 |
Indirect Finance |
25.5 |
23.5 |
34,981.5 |
10.1 |
9.4 |
35,548.6 |
100.0 |
100.0 |
37,950.8 |
2. Industry |
38.3 |
39.9 |
40,989.7 |
5.7 |
6.7 |
45,973.7 |
100.0 |
100.0 |
39,285.9 |
3. Transport and Other Support Services |
45.9 |
43.5 |
54,319.0 |
8.1 |
10.8 |
75,925.6 |
100.0 |
100.0 |
57,325.4 |
4. Professional and Other Services |
28.2 |
41.4 |
51,670.6 |
5.5 |
5.3 |
34,135.2 |
100.0 |
100.0 |
35,147.4 |
5. Personal Loans |
23.4 |
41.7 |
62,140.2 |
2.4 |
3.2 |
45,621.3 |
100.0 |
100.0 |
34,817.5 |
Consumer Durables |
29.8 |
26.2 |
39,024.3 |
7.8 |
3.8 |
21,738.0 |
100.0 |
100.0 |
44,362.6 |
Housing |
80.5 |
83.6 |
92,705.5 |
3.7 |
3.6 |
86,807.3 |
100.0 |
100.0 |
89,216.2 |
Rest |
19.3 |
33.9 |
54,272.2 |
2.2 |
3.1 |
42,697.6 |
100.0 |
100.0 |
30,933.6 |
6. Trade |
48.7 |
42.3 |
33,673.0 |
7.0 |
7.3 |
39,899.9 |
100.0 |
100.0 |
38,773.5 |
Wholesale Trade |
24.3 |
17.6 |
32,141.0 |
23.3 |
18.1 |
34,453.1 |
100.0 |
100.0 |
44,365.8 |
Retail Trade |
49.8 |
43.6 |
33,708.0 |
6.3 |
6.7 |
40,849.3 |
100.0 |
100.0 |
38,510.6 |
7. Finance |
30.8 |
28.0 |
42,638.7 |
10.5 |
10.3 |
45,739.7 |
100.0 |
100.0 |
46,857.0 |
8. All Others |
6.8 |
11.3 |
47,971.5 |
10.4 |
12.2 |
33,690.3 |
100.0 |
100.0 |
28,832.5 |
All Small Borrowal Accounts |
20.2 |
28.6 |
49,377.4 |
4.7 |
5.0 |
36,680.1 |
100.0 |
100.0 |
34,992.9 |
Statement 5 : Occupation and Asset Classification-wise percentage Distribution of Number of Accounts and Amount
Outstanding pertaining to Small Borrowal Accounts as on March 31,2008 |
Occupation |
Standard Assets |
Sub-standard Assets |
Doubtful Assets |
Percent share |
Percent share |
Percent share |
No. of Acco unts |
Amo unt out
stan ding |
Average
Amount
out
standing
per Account (`) |
No. of Acco unts |
Amo unt out
stan ding |
Average
Amount
out
standing
per Account (`) |
No. of Acco unts |
Amo unt out
stan ding |
Average
Amount
out
standing
per Account (`) |
1 |
2 |
3 |
4 |
5 |
6 |
7 |
8 |
9 |
1. Agriculture |
92.5 |
95.1 |
36,566.5 |
2.2 |
2.2 |
34,179 |
3.8 |
2.3 |
21,376.4 |
Direct Finance |
92.6 |
95.2 |
36,515.0 |
2.2 |
2.1 |
34,254 |
3.8 |
2.3 |
21,357.8 |
Indirect Finance |
86.2 |
91.4 |
40,252.7 |
3.9 |
3.2 |
31,368 |
7.2 |
4.2 |
22,023.7 |
2. Industry |
72.9 |
82.1 |
44,253.7 |
6.9 |
7.2 |
40,862 |
14.1 |
8.6 |
23,926.3 |
3. Transport and Other Support Services |
79.5 |
88.0 |
63,448.8 |
4.2 |
4.1 |
55,261 |
11.7 |
6.5 |
31,902.3 |
4. Professional and Other Services |
81.7 |
85.6 |
36,839.2 |
7.1 |
6.7 |
32,950 |
8.5 |
6.1 |
25,118.8 |
5. Personal Loans |
91.8 |
92.6 |
35,155.5 |
4.1 |
4.0 |
33,821 |
3.2 |
2.5 |
27,415.1 |
Consumer Durables |
79.7 |
87.7 |
48,793.1 |
5.8 |
4.1 |
31,189 |
10.7 |
5.1 |
21,037.2 |
Housing |
94.5 |
95.5 |
90,243.0 |
2.0 |
1.7 |
75,430 |
2.9 |
2.4 |
73,192.1 |
Rest |
91.8 |
92.2 |
31,070.2 |
4.2 |
4.4 |
32,551 |
3.1 |
2.5 |
24,962.4 |
6. Trade |
69.1 |
79.3 |
44,481.9 |
8.1 |
8.0 |
38,040 |
14.7 |
9.8 |
25,687.3 |
Wholesale Trade |
77.2 |
87.3 |
50,192.4 |
2.5 |
2.6 |
45,150 |
16.4 |
8.4 |
22,613.5 |
Retail Trade |
68.7 |
78.8 |
44,180.2 |
8.4 |
8.3 |
37,940 |
14.6 |
9.8 |
25,849.3 |
7. Finance |
92.0 |
97.5 |
49,660.2 |
1.9 |
1.1 |
26,668 |
3.9 |
0.9 |
10,491.8 |
8. All Others |
89.2 |
91.5 |
29,570.4 |
7.0 |
5.6 |
23,215 |
2.2 |
2.1 |
26,844.4 |
All Small Borrowal Accounts |
89.5 |
92.0 |
35,979.0 |
4.1 |
3.9 |
32,880 |
4.6 |
3.2 |
24,746.8 |
Statement 5 : Occupation and Asset Classification-wise percentage Distribution of Number of Accounts and Amount
Outstanding pertaining to Small Borrowal Accounts as on March 31,2008 (Concld) |
Occupation |
Loss Assets |
Total |
Percent share |
Percent share |
No. of Accounts |
Amount out
standing |
Average
Amount
out
standing
per Account (`) |
No. of Accounts |
Amount out
standing |
Average
Amount
out
standing
per Account (`) |
10 |
11 |
12 |
13 |
14 |
15 |
1. Agriculture |
1.4 |
0.4 |
11,110 |
100.0 |
100.0 |
35,568 |
Direct Finance |
1.4 |
0.4 |
10,967 |
100.0 |
100.0 |
35,533 |
Indirect Finance |
2.6 |
1.1 |
16,183 |
100.0 |
100.0 |
37,951 |
2. Industry |
6.1 |
2.1 |
13,661 |
100.0 |
100.0 |
39,286 |
3. Transport and Other Support Services |
4.6 |
1.4 |
17,841 |
100.0 |
100.0 |
57,325 |
4. Professional and Other Services |
2.6 |
1.6 |
21,226 |
100.0 |
100.0 |
35,147 |
5. Personal Loans |
1.0 |
0.9 |
31,396 |
100.0 |
100.0 |
34,817 |
Consumer Durables |
3.7 |
3.1 |
37,197 |
100.0 |
100.0 |
44,363 |
Housing |
0.7 |
0.4 |
54,271 |
100.0 |
100.0 |
89,216 |
Rest |
0.9 |
0.9 |
29,796 |
100.0 |
100.0 |
30,934 |
6. Trade |
8.1 |
3.0 |
14,462 |
100.0 |
100.0 |
38,774 |
Wholesale Trade |
3.9 |
1.7 |
19,969 |
100.0 |
100.0 |
44,366 |
Retail Trade |
8.2 |
3.1 |
14,340 |
100.0 |
100.0 |
38,511 |
7. Finance |
2.2 |
0.6 |
11,952 |
100.0 |
100.0 |
46,857 |
8. All Others |
1.6 |
0.8 |
14,618 |
100.0 |
100.0 |
28,832 |
All Small Borrowal Accounts |
1.8 |
0.9 |
17,301 |
100.0 |
100.0 |
34,993 |
Statement 6 : Occupation and Type of Organisation-wise percentage Distribution of Number of Accounts and Amount
Outstanding pertaining to Small Borrowal Accounts as on March 31,2008 (Contd) |
Occupation |
Public Sector |
Co-operative Sector |
Private Corporate Sector |
Percent share |
Percent share |
Percent share |
No. of Acco unts |
Amo unt out
stan ding |
Average
Amount
out
standing
per Account (`) |
No. of Acco unts |
Amo unt out
stan ding |
Average
Amount
out
standing
per Account (`) |
No. of Acco unts |
Amo unt out
stan ding |
Average
Amount
out
standing
per Account (`) |
1 |
2 |
3 |
4 |
5 |
6 |
7 |
8 |
9 |
1. Agriculture |
7.4 |
6.0 |
28,859 |
0.0 |
0.1 |
54,443 |
0.0 |
0.1 |
88,975 |
Direct Finance |
7.5 |
6.1 |
28,947 |
0.0 |
0.1 |
60,602 |
0.0 |
0.1 |
90,806 |
Indirect Finance |
6.0 |
3.4 |
21,549 |
0.4 |
0.2 |
18,515 |
0.1 |
0.2 |
54,022 |
2. Industry |
3.5 |
2.2 |
25,349 |
0.0 |
0.0 |
68,980 |
1.9 |
1.8 |
36,376 |
3. Transport and Other Support Services |
3.7 |
1.5 |
23,088 |
0.0 |
0.0 |
63,607 |
0.6 |
0.6 |
58,571 |
4. Professional and Other Services |
6.0 |
3.0 |
17,779 |
0.0 |
0.1 |
68,433 |
0.2 |
0.4 |
70,251 |
5. Personal Loans |
0.8 |
0.9 |
40,757 |
0.0 |
0.0 |
64,573 |
0.0 |
0.1 |
59,435 |
Consumer Durables |
5.0 |
3.9 |
35,115 |
0.0 |
0.0 |
111,445 |
0.1 |
0.4 |
1,43,419 |
Housing |
1.7 |
1.5 |
76,596 |
0.0 |
0.0 |
56,889 |
0.0 |
0.0 |
67,845 |
Rest |
0.6 |
0.7 |
35,064 |
0.0 |
0.0 |
64,073 |
0.0 |
0.1 |
54,964 |
6. Trade |
4.5 |
3.1 |
26,754 |
0.0 |
0.0 |
49,352 |
0.2 |
0.4 |
78,082 |
Wholesale Trade |
16.4 |
13.8 |
37,359 |
0.0 |
0.1 |
89,434 |
1.1 |
1.7 |
67,609 |
Retail Trade |
3.9 |
2.5 |
24,649 |
0.0 |
0.0 |
47,991 |
0.2 |
0.3 |
81,417 |
7. Finance |
0.7 |
0.8 |
50,176 |
0.2 |
0.3 |
68,242 |
3.1 |
0.7 |
10,165 |
8. All Others |
2.6 |
2.5 |
27,531 |
0.0 |
0.1 |
46,674 |
3.3 |
1.5 |
13,271 |
All Small Borrowal Accounts |
4.0 |
3.3 |
28,756 |
0.0 |
0.0 |
55,818 |
0.5 |
0.3 |
23,374 |
Statement 6 : Occupation and Type of Organisation-wise percentage Distribution of Number of Accounts and Amount
Outstanding pertaining to Small Borrowal Accounts as on March 31,2008 (Contd) |
Occupation |
Male |
Female |
Percent share |
Percent share |
No. of Acco unts |
Amount out
stan ding |
Average
Amount
out
standing
per Account (`) |
No. of Acco unts |
Amount out
stan ding |
Average
Amount
out
standing
per Account (`) |
10 |
11 |
12 |
13 |
14 |
15 |
1. Agriculture |
74.5 |
77.5 |
36,980 |
15.4 |
13.0 |
30,128 |
Direct Finance |
74.6 |
77.6 |
36,958 |
15.4 |
13.0 |
30,069 |
Indirect Finance |
68.9 |
70.0 |
38,597 |
16.3 |
14.5 |
33,884 |
2. Industry |
72.3 |
70.1 |
38,108 |
13.6 |
10.9 |
31,496 |
3. Transport and Other Support Services |
82.7 |
75.6 |
52,375 |
4.4 |
4.3 |
57,018 |
4. Professional and Other Services |
65.5 |
68.4 |
36,683 |
13.8 |
14.5 |
36,822 |
5. Personal Loans |
82.2 |
80.3 |
34,023 |
15.0 |
14.8 |
34,262 |
Consumer Durables |
82.2 |
76.4 |
41,248 |
12.1 |
18.4 |
67,432 |
Housing |
81.0 |
82.8 |
91,204 |
15.9 |
14.9 |
83,272 |
Rest |
82.2 |
79.9 |
30,060 |
15.0 |
14.6 |
30,174 |
6. Trade |
68.2 |
64.3 |
36,577 |
14.8 |
11.7 |
30,792 |
Wholesale Trade |
60.5 |
49.9 |
36,590 |
13.0 |
17.2 |
58,587 |
Retail Trade |
68.6 |
65.1 |
36,576 |
14.8 |
11.4 |
29,647 |
7. Finance |
33.3 |
27.5 |
38,639 |
10.4 |
8.0 |
35,924 |
8. All Others |
73.7 |
74.4 |
29,083 |
16.5 |
17.2 |
29,996 |
All Small Borrowal Accounts |
76.5 |
76.7 |
35,052 |
15.1 |
13.9 |
32,069 |
Statement 6 : Occupation and Type of Organisation-wise percentage Distribution of Number of Accounts and Amount
Outstanding pertaining to Small Borrowal Accounts as on March 31,2008 (Concld) |
Occupation |
Others |
Total |
Percent share |
Percent share |
No. of Acco unts |
Amo unt out
stan ding |
Average
Amount
out
standing
per Account (`) |
No. of Acco unts |
Amo unt out
stan ding |
Average
Amount
out
standing
per Account (`) |
16 |
17 |
18 |
19 |
20 |
21 |
1. Agriculture |
2.5 |
3.2 |
45,585 |
100.0 |
100.0 |
35,568 |
Direct Finance |
2.4 |
3.1 |
45,194 |
100.0 |
100.0 |
35,533 |
Indirect Finance |
8.3 |
11.6 |
53,305 |
100.0 |
100.0 |
37,951 |
2. Industry |
8.7 |
14.9 |
67,275 |
100.0 |
100.0 |
39,286 |
3. Transport and Other Support Services |
8.6 |
18.0 |
1,19,496 |
100.0 |
100.0 |
57,325 |
4. Professional and Other Services |
14.4 |
13.6 |
33,222 |
100.0 |
100.0 |
35,147 |
5. Personal Loans |
2.0 |
3.9 |
68,610 |
100.0 |
100.0 |
34,817 |
Consumer Durables |
0.6 |
0.9 |
61,919 |
100.0 |
100.0 |
44,363 |
Housing |
1.3 |
0.8 |
56,454 |
100.0 |
100.0 |
89,216 |
Rest |
2.1 |
4.6 |
69,177 |
100.0 |
100.0 |
30,934 |
6. Trade |
12.3 |
20.4 |
64,105 |
100.0 |
100.0 |
38,774 |
Wholesale Trade |
8.9 |
17.3 |
86,368 |
100.0 |
100.0 |
44,366 |
Retail Trade |
12.5 |
20.6 |
63,361 |
100.0 |
100.0 |
38,511 |
7. Finance |
52.2 |
62.8 |
56,341 |
100.0 |
100.0 |
46,857 |
8. All Others |
3.8 |
4.4 |
33,096 |
100.0 |
100.0 |
28,832 |
All Small Borrowal Accounts |
3.8 |
5.8 |
53,066 |
100.0 |
100.0 |
34,993 |
Annex I
Sample Design and Estimation Procedure Sample Design A stratified sampling design is used to select the sample of bank branches. All the small borrowal accounts of a selected bank branch are included in the sample. Many Scheduled Commercial Banks (excluding Regional Rural Banks) are maintaining centralised account-wise database for all their bank's branches at their head office. These banks are requested to provide account-wise data on small borrowal accounts for all their bank's branches as per requirement in soft copy. Those banks which are not maintaining centralized database for all their branches, a suitable stratified sample design is used to select the sample of branches. It is ensured that sufficient numbers of branches will be there in almost all the strata formed by using State/ Union Territory, Population Group and Bank Group to provide the estimates of required parameters at the desired level. The selection of sample branches is done for all branches of Regional Rural Banks (RRBs). The frame for selection of RRB branches is prepared based on a list of branches as at end of March 2007. These branches are grouped into strata formed by using State and Population Group depending upon the location of the branch. A ten per cent sample of RRB branches, viz., 1351 RRB branches, are selected from each stratum independently by the method of linear systematic sampling. The selected RRB branches are asked to submit account-wise data for the required characters for all small borrowal accounts, which are maintained by the branches as on March 31, 2008. Estimation Procedure Notations
Let
p, p' denotes the subscript for the classificatory character (p or p'=1,2,..,)
q, q' denotes the subscript for the class of classificatory character (q or q' =1,2,...)
i denotes the subscript for State/Union Territory (i= 1,2....... 35)
j denotes the superscript for Population Group 0 = 1,2,3,4)
k denotes the subscript for Bank Group (k=1,2,3,4,5)
r denotes the subscript for bank branch
s denotes the subscript for small borrowal account
N denotes the total number of bank branches in the population
n denotes the number of responded bank branches for the survey in the sample
M denotes the number of small borrowal accounts in the population
A denotes the amount outstanding pertaining to small borrowal accounts in the population
c denotes the variable which takes only two values 1 and 0 (1 for the presence of the class of classificatory character and 0 otherwise).
The estimates for a State/UT or a population group or a bank group or any combination thereof are obtained by adding the stratum level estimates. These estimates are further adjusted for non-reporting strata.
Annex II RESERVE BANK OF INDIA
DEPARTMENT OF STATISTICS AND INFORMATION MANAGEMENT
SURVEY OF SMALL BORROWAL ACCOUNTS - MARCH 31, 2008 Schedule
INSTRUCTIONS FOR FILLING IN THE SCHEDULE In the present system of Basic Statistical Returns (BSR) on banking statistics, data on various aspects of the borrowal accounts are collected through BSR-1 return, comprising two parts (Part A and Part B). While detailed account-wise data on borrowal accounts each with a credit limit above `2 lakh are collected in Part-A, the data in respect of accounts with credit limit `2 lakh or less (referred to as small borrowal accounts for the purpose of this survey) are collected broad occupation group-wise through Part-B of the return. The main objective of this survey is to obtain a profile and the structural pattern of these accounts according to important characteristics, such as the size of outstanding credit, occupation of the borrower and type of loan scheme etc. with the help of a sample. Department of Statistics and Information Management (DSIM), Reserve Bank of India conducts periodically this Survey of Small Borrowal Accounts. The last such survey was conducted with March 31, 2006 as the reference date. The schedule consists of two blocks. Block-1 is pertaining to identification particulars of the branch, whereas Block-2 collects account-wise information pertaining to all small borrowal accounts maintained by the all branches as on March 31, 2008. The data need to be submitted in electronic form as per enclosed data input record design/ ASCII file structure, either through CD or through e-mail . The data in compact disk (CD) may please be forwarded to; The Director,
Survey Division,
Department of Statistical Analysis and Computer Services,
Reserve Bank of India,
C-8, 2nd floor, Bandra-Kurla Complex,
Post Box No. 8128,
Bandra (East), Mumbai 400 051
(Tele Fax No.; 022-2657 1555,
Telephone No.; 022-2657 2197 (Direct), 022-2657 8100/
8300/8500/8700 Ext- 7235, 7279). GENERAL INSTRUCTIONS 1. Uniform Branch Code Part-I and Part-II allotted to it by the DSIM (then DESACS) should be clearly indicated in the space provided in the schedule. 2. Continuous serial number (started from 1) should be entered in Column-1 [Sample Sr. No.] for each small borrowal account for each Uniform Branch Code Part-I. 3. The Account Number for each of the accounts should be recorded in Column-2. This information may be useful for referring back to the account (by the branch) in case of any inconsistency observed in the data. 4. The Credit Limit and the Amount Outstanding in Rupees are to be recorded in Columns 3 and 4 respectively. The amount should be recorded after rounding off to the nearest Rupee and Paise should not be recorded. Decimal point, slashes/strokes, comma etc., should not be used while reporting the figures. 5. The Rate of Interest is to be reported in Column-6 in percent per annum with 4 digit field with leading/ trailing zeros wherever required e.g. 6.0 = > 0600, 16.5=>1650, 5.25=>0525, 21.0=>2100 etc. 6. Occupation code will be recorded in Column-7. These codes will correspond to the occupation codes as given in BSR-1B. For ready reference these broad occupation codes adopted for BSR-1 B are given in Annexure I (for details and explanation of these codes, please refer to Guidelines/Instructions provided in the Handbook of Instructions, BSR-1 and 2, Seventh Edition and applicable for March 2008). 7. Codes for Fixed/Floating Rate of Interest, Type of Account, Asset Classification, Secured/Unsecured Loan Scheme, Organisation, Loan Scheme, Category of Borrower and Social Group should be recorded in Columns 5, 8, 9, 10, 11, 12, 13 and 14 respectively, as per the code list provided in Annexure II. 8. For the relationship among Occupation, Type of Account, Organisation and Category of Borrower, please refer to Chapter VI of Handbook of Instructions, BSR-1 and 2, Seventh Edition, March 2008. (For ready reference a copy attached Annexure III may be referred). 9. Please ensure that all the codes are correctly reported against each borrowal account.
Annexure I |
(i) Occupation Code |
|
Agriculture and Allied Activities |
|
Cultivation of food and cash crops excluding plantation crops |
|
1. Cereals |
101 |
2. Pulses |
102 |
3. Sugarcane |
103 |
4. Cotton |
104 |
5. All other food and cash crops |
109 |
6. Cultivation of Plantation Crops |
110 |
7. Direct finance to agriculture |
120 |
Activities allied to agriculture |
|
8. Dairying |
131 |
9. Poultry farming |
132 |
10. Fishing |
133 |
11. Other activities allied to agriculture |
139 |
12. Indirect finance to agriculture |
199 |
Food Manufacturing and Processing |
|
13. Rice Mills, Flour and Dal Mills |
201 |
14. Edible oils and Vanaspati |
202 |
15. Tea |
203 |
16. Other food manufacturing and processing |
209 |
Textiles |
|
17. Cotton textile |
211 |
18. Jute and natural fibre textile |
212 |
19. Handloom textile and Khadi |
213 |
20. Other textile |
219 |
21. Leather& leather products |
220 |
22. Wood & Wood Products |
230 |
23. Rubber, Plastic & their products |
240 |
24. Glass & Glass Ware |
250 |
25. Gems & Jewellery |
260 |
26. Paper and Paper Products |
270 |
27. Printing, Publishing & allied activities |
280 |
Industry |
|
Chemical & Chemical Products |
|
28. Fertilizers |
291 |
29. Drugs and Pharmaceuticals |
292 |
30. Other Chemicals & Chemical Products |
299 |
31. Cement& Cement Products |
300 |
32. Metals and metal products |
310 |
Annexure I (Concld) |
(i) Occupation Code (concltd.) |
|
Engineering |
|
33. General Engineering Machinery & Goods |
321 |
34. Electrical Machinery & Goods |
322 |
35. Electronic Machinery & Goods |
323 |
36. Vehicles, Vehicle parts & Transport equipments |
330 |
37. Other industries (not included elsewhere) |
340 |
38. Construction |
400 |
Trade |
|
39. Wholesale Trade |
510 |
40. Wholesale Trade |
520 |
41. Transport and other support services |
600 |
Professional and other services |
|
42. Professional services |
711 |
43. Tourism, Hotels & Restaurants |
712 |
44. Recreation services |
713 |
45. Repairs & maintenance services (except capital goods) |
714 |
46. Other services |
719 |
47. Financial Intermediation |
800 |
Personal loans and consumption loans: Staff |
|
48. Staff housing loans: Individual, Through Society |
861 |
49. Staff Vehicle Loans: Purchase of motor vehicles including two-wheelers (given to staff) |
862 |
50. Purchase of consumable durables (given to staff) |
863 |
51. Staff Education Loans (given to staff-self/wards) |
864 |
52. Staff Credit Cards (given to staff) |
868 |
53. Other Staff loans (given to staff) |
869 |
Personal loans and consumption loans: Other than Staff |
|
54. Housing loans (other than staff) |
871 |
55. Purchase of motor vehicles including two wheelers (other than staff) |
872 |
56. Purchase of consumable durables (other than staff) |
873 |
57. Education Loans (other than staff) |
874 |
58. Investment Loans |
875 |
59. General Credit Cards |
877 |
60. Personal Credit Cards |
878 |
61. Other personal loans (other than staff) |
879 |
62. All others including unclassified loans |
890 |
Annexure II
(ii) Fixed/Floating Rate of Interest Code |
Fixed rate of interest - 1 |
Floating rate of interest - 2 |
(iii) Type of Account Code |
Cash credit - 10 |
Overdraft - 20 |
Demand Loan - 30 |
Personal Credit Cards - 31 |
General Credit Cards - 32 |
Kisan Credit Card - Production loan - 33 |
Kisan Credit Card - Investment Loan -34 |
Other Credit Card - 35 |
Term Loan - (including interim cash credit pending sanction of term loans and instalment credit) : |
(1) Medium Term Loan (i.e. loans and advances granted for a period above 1 year and up to and inclusive of 3 years) - 41 |
(2) Long-Term Loans (i.e. loans and advances granted for a period above 3 years) -42 |
Others - 99 |
(iv) Asset Classification Code |
Standard Assets -1 |
Sub-standard Assets - 2 |
Doubtful Assets - 3 |
Loss Assets - 4 |
(v) Secured/Un-Secured Loan Code |
Secured - 1 |
Un-Secured - 2 |
(vi) Organisation Code |
Public Sector - 10 |
Co-operative Sector - 20 |
Private Corporate Sector - 30 |
Household Sector - Individual (Singly/Jointly) |
Male - 41 |
Female - 42 |
Household Sectors - Others |
Proprietary concerns -51 |
Joint families -52 |
Partnership firms - 53 |
Joint Liability Groups - 54 |
NGOs, Trusts and Groups - 55 |
Micro Finance Institutions |
Self-Help Group - Direct - Women - 61 |
Self-Help Group - Direct - Others - 62 |
Self-Help Group - Through NGOs - Women - 63 |
Self-Help Group - Through NGOs - Others - 64 |
Self-Help Group - Through MFIs - Women - 65 |
Self-Help Group - Through MFIs - Others - 66 |
Other MFIs not engaged in promotion of SHGs - 69 |
Annexure II (Contd)
(vii) Loan Scheme Code |
Integrated Rural Development Programme (RDP) - 01 |
Prime Minster's Rojgar Yojna (including SEEUY) - 02 |
Differential Rate of Interest Scheme (DR) - 03 |
Scheme of Urban Micro Enterprises (SUME) (including SEPUP) - 04 |
Prime Ministers Integrated Urban Poverty Eradication |
Programme (PMIUPEP) - 05 |
Swarnajayanti Granm Swarozgar Yojana (SSGSY) - 06 |
Swarnajayanti Shahari Rozgar Yojana (SJSRY) - 07 |
Supply of Improved Tool Kits to Rural Artisans (SITRA) - 08 |
Ganga Kalyan Yojana (GKY) - 09 |
Million Well Scheme (MWS) - 10 |
Training of Rural Youth for Self Employment (TRYSEM) - 11 |
Development of Women and Children in Rural Areas (DSWCRA) - 12 |
Jawahar Rozgar Yojana (JRY) - 13 |
Nehru Rozgar Yojana (NRY) - 14 |
Urban Basic Services for the Poor (UBSP) -15 |
Scheme for Liberation and Rehabilitation of Scavengers (SLRS) - 16 |
Urban Self Employment Programme (USEP) - 17 |
Development of Women and Children in Urban Areas (DWVUA) - 18 |
Loans of agriculture under Special Agricultural Credit Plan (SACP) - 19 |
Others Scheme - 20 |
Loans not covered under any scheme - 21 |
(viii) Category of Borrower Code |
Manufacturing Enterprises (Industries) |
Micro (Manufacturing) Enterprises |
Weavers - Handloom - 01 |
Weavers - Powerloom - 02 |
Rural Artisans/Craftsman - 03 |
Village/Cottage Industries (except promoted by KVIC/KVIB) - 04 |
Tiny Industries - 05 |
Small (Manufacturing) Enterprises -11 |
Medium (Manufacturing) Enterprises - 12 |
Large (Manufacturing) Enterprises - 19 |
Khadi and Village Industries Sector - 29 |
Business/Trade and Service Enterprises |
Micro (Service) Enterprises - 31 |
Small (Service) Enterprises - 32 |
Medium (Service) Enterprises - 33 |
Large (Service) Enterprises - 39 |
Farmers (Agriculture and allied activities) |
Small Farmers - 41 |
Marginal Farmers - 42 |
Agricultural Labourers - 43 |
Tenant Farmers/Sharecroppers/Oral lessees - 44 |
Annexure II (Concld)
Other Farmers (Medium & Large) - 45 |
Other borrowers engaged in agriculture and allied activities - 49 |
All Others - 99 |
(ix) Social Group Code |
Scheduled Tribe - 1 |
Scheduled Caste (including neo Buddhists)-2 |
Other Backward Caste - 3 |
General - 4 |
Annexure II DEPARTMENT OF STATISTICS AND INFORMATION MANANAGEMENT
SURVEY OF SMALL BORROWAL ACCOUNTS - MARCH 31, 2008 ASCII File Structure/Layout
Input Record Design for Block 1 |
Field No. |
Field Description |
Field Size |
Field Position |
Type of Data |
1 |
Job Code ( = SBA2008) |
7 |
1-7 |
AN |
2 |
Uniform Branch Code - Part I |
7 |
8-14 |
AN |
3 |
Filler -1 ( = space) |
1 |
15 |
AN |
4 |
Uniform Branch Code - Part II |
7 |
16-22 |
AN |
5 |
Filler -1 ( = space) |
1 |
23 |
AN |
6 |
Total Number of Accounts |
6 |
24-29 |
N |
7 |
Total Amount Outstanding (in ` Thousand) |
8 |
30-37 |
N |
Notes : 1. The length of a record of Block 1 is 37 characters.
2. For a given Uniform Branch Code-Part I one account per record should be entered.
3. Total Number of Small borrowal Accounts and Total Amount Outstanding (in Rupees Thousand) as on March 31, 2008 reported under filed 6 and 7 must tally with the data reported under BSR-1B, March 2008 and these figures should be entered right justified with leading zeroes wherever required. |
Input Record Design for Block 2 |
Field No. |
Field Description |
Field Size |
Field Position |
Type of Data |
1 |
Job Code ( = SBA2008) |
7 |
1-7 |
AN |
2 |
Filler -1 ( = space) |
1 |
8 |
AN |
3 |
Uniform Branch Code - Part I |
7 |
9-15 |
AN |
4 |
Filler -1 ( = space) |
1 |
16 |
AN |
5 |
Serial Number |
8 |
17-24 |
N |
6 |
Account Number |
25 |
25-49 |
AN |
7 |
Credit Limit (Rupees) |
6 |
50-55 |
N |
8 |
Amount Outstanding (Rupees) |
8 |
56-63 |
N |
9 |
Fixed/Floating Rate of Interest Code |
1 |
64 |
AN |
10 |
Rate of Interest |
4 |
65-68 |
AN |
11 |
Occupation Code |
3 |
69-71 |
AN |
12 |
Type of Account Code |
2 |
72-73 |
AN |
13 |
Asset Classification Code |
1 |
74 |
AN |
14 |
Secured/Un-Secured Loan Code |
1 |
75 |
AN |
15 |
Organisation Code |
2 |
76-77 |
AN |
16 |
Loan Scheme Code |
2 |
78-79 |
AN |
17 |
Category of Borrower Code |
2 |
80-81 |
AN |
18 |
Social Group Code |
1 |
82 |
AN |
N - Numeric AN- Alphanumeric |
Notes : 1. The length of a record of Block 2 is 82 characters.
2. For a given Uniform Branch Code-Part I one account per record should be entered.
3. Serial Number, Credit Limit and Amount Outstanding should be entered right justified with leading zeroes wherever required.
4. All Alphanumeric fields to be entered with leading zeros wherever required (e.g. Code No. "011" should not be entered as "11." or ".11" or "11". The entire two/three digit including the leading zero should be entered).
5. The Rate of Interest should be entered as 4 digit alphanumeric field with leading/trailing zeros wherever required e.g. 6.0=> 0600, 16.5 = >1650, 5.25=>0525, 21 = >2100 etc.
6. Codes for Occupation, Fixed/Floating Rate of Interest, Type of Account, Asset Classification, Secured/Un-Secured Loan, Organisation, Loan Scheme, Category of Borrower and Social Group should be recorded as per the code list provided in Annexure I and II.
7. For the relationship among Occupation, Type of Account, Organisation and Category of Borrower, please refer to Chapter VI of Handbook of Instructions, BSR-1 and 2, Seventh Edition, March 2008. (For ready reference a copy attached Annexure III may be referred). |
* Prepared by Division of Enterprise Surveys, (erstwhile part of Survey Division) Department of Statistics and Information Management, The previous article on the subject 'Survey of Small Borrowal Accounts: March 2006' appeared in June 2008 issue of Reserve Bank of India Bulletin. |