Survey on Computer Software & Information Technology Services Exports: 2007-08* The Reserve Bank of India (RBI) conducted annual comprehensive survey on software and Information Technology (IT) services exports during 2007-08 covering 6,140 companies for compiling data on computer services exports as well as exports of Information Technology Enabled Services (ITES)/Business Process Outsourcing (BPO). The survey also collected the software services trade data as per the mode of supply, introduced by General Agreement on Trade in Services (GATS). Highlights:
- Total Computer Services and ITES/BPO services exports of India during 2007-08 was estimated at Rs.1,40,200 crore (US$ 34,841 million), of which computer services exports was Rs.1,07,438 crore (US$ 26,699 million).
- Of the total software exports (Computer and ITES/BPO services), around 74.6 per cent was through offsite services while onsite software exports accounted for 25.4 per cent.
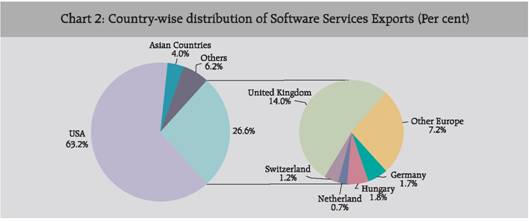
- The United States (US) was the major destination for software exports accounting for 63.2 per cent. The share of the United Kingdom (UK) was 14.0 per cent while Other European countries contributed 12.6 per cent in India’s total software exports.
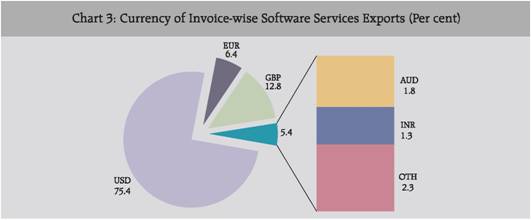
- US Dollar was the major currency for invoicing software exports, with a share of 75.4 per cent. Pound Sterling and Euro accounted for 12.8 and 6.4 per cent, respectively.
Introduction:
National Statistical Commission in its report [NSC (2001)] made the recommendation: ‘Although the Reserve Bank of India collects the data on software exports through Software Exports (SOFTEX) forms, it uses the National Association of Software & Services Companies (NASSCOM) data as a controlling total for gross receipts from software exports. There is, however, a need to re-examine the current methodology on collection of software exports data. Reserve Bank of India should constitute a technical group consisting of members from the Reserve Bank, Ministry of Commerce, Central Statistical Organisation (CSO), NASSCOM and few major software companies to comprehensively examine the data reporting mechanism for software exports’. Responding to the recommendation of NSC, the Reserve Bank constituted a Technical Group (TG) on Re-examination of Data Reporting System on Software Exports in 2001, with the members from Ministry of Commerce, CSO, Software Technology Parks of India (STPI), NASSCOM, the Reserve Bank and a few major software companies. The Group submitted its report to the Reserve Bank in March 2003. The TG recommended, among others, to conduct a Comprehensive Survey (in the nature of Census) every three years followed by quarterly representative surveys to collect data on software and IT exports. Based on the recommendations of the Technical Group, the first Comprehensive Survey covering all companies engaged in information technology (IT) and computer services exports activities was conducted for the period 2002-03 in December 2003. Based on the results of the survey, an article titled “Computer Services Exports from India: 2002-03" was published in the Reserve Bank of India Bulletin in September 2005. Further, to examine some of the issues regarding compilation of software exports data as per Balance of Payments Manual, fifth edition (BPM5), it was decided to form a Technical Group with the members from the Reserve Bank of India, NASSCOM and STPI to ‘examine in detail the compilation issues regarding software exports’. It was also decided that data on “Software Services” should be collected with a clear cut demarcation of items, namely (i) Computer Services and (ii) ITES /BPO services and thus the data should be published for these constituents. Accordingly, a Technical Group on Computer Services Exports (TGCSE) with members from various departments of the Reserve Bank of India, NASSCOM and STPI was formed by the Bank. The Group submitted its report to the Bank in May 2008. As per the recommendation of TGCSE, a comprehensive annual survey on software and IT services exports was launched for the reference period 2007-08 in September 2008. The survey collected the information on the computer services exports, as defined in BPM5 [1993] and Manual on Statistics of International Trade in Services (MSITS [2002]) as well as on ITES/BPO services exports. The distinctive features of the Computer Services as defined in BPM5 [1993], MSITS [2002] and BPM6 [2008] are indicated in Annex – I. Format of survey schedule is given in Annex – II while the concepts, definitions and coverage are presented in Annex – III. The estimation procedure for estimating the software exports of non-responded companies is detailed in Annex – IV. Survey Results:
The survey results presented below are compatible with BPM5. The survey also contains information on the exports data as per the modes of supply, defined in MSITS [2002]. Total 993 companies responded to the survey. Exports undertaken by the non-responding companies have been estimated as per methodology given in Annex – IV. Reconciliation of survey estimates with NASSCOM and Softex data is given in Box item.
Software Services Exports from India during 2007-08:
Software and IT services exports were categorised into two components: (i) Computer Services and (ii) ITES/BPO Services. Total software services exports from India during 2007-08 were Rs.1,40,200 crore, of which computer services export were Rs.1,07,438 crore while the balance Rs.32,762 crore were on account of ITES/BPO services exports (Table 1).
Table 1: Software Services Exports from India during 2007-08 |
Activity |
Exports |
Rs. crore |
US$ million* |
Share (in per cent) |
Computer Services |
1,07,438 |
26,699 |
76.6 |
of which; IT Services |
94,209 |
23,412 |
67.2 |
Software Product Development |
13,229 |
3,287 |
9.4 |
ITES/BPO Services |
32,762 |
8,142 |
23.4 |
of which; BPO Services |
28,268 |
7,025 |
20.2 |
Engineering Services |
4,494 |
1,117 |
3.2 |
Total |
1,40,200 |
34,841 |
100.0 |
Note : *Using annual average Rupee/Dollar exchange rate as published in Hand Book of Statistics on Indian Economy, RBI. |

Under the Computer Services, IT services exports constituted a major part accounting for 67.2 per cent while the share of software product development was 9.4 per cent. BPO services exports accounted for 20.2 per cent while Engineering services had 3.2 per cent share in total software exports.
Activity-wise distribution of ITES/BPO Services Exports:
Exports through ITES/BPO services were compiled based on the classification given by Department of Information Technology of the GoI [DIT(GoI(2003)]. Of the total ITES/BPO services exports, Customer interaction services accounted for 18.3 per cent followed by Medical transcription services at 13.0 per cent. Finance and Accounting, auditing, book keeping and tax consulting services together had 8.9 per cent share in total ITES/BPO services exports. Other BPO services includes Procurement and logistics services, Animation, Gaming, Document management services, etc., which contributed about 33.0 per cent (Table 2).
Table 2: Activity-wise distribution of ITES/ BPO Services Exports |
Activity |
Exports |
Share in (per cent) |
| |
Rs. crore |
US$ million |
I. BPO Services |
28,268 |
7,025 |
86.3 |
Customer interaction services |
5,993 |
1489 |
18.3 |
Finance and Accounting, auditing, book keeping and tax consulting services |
2,912 |
724 |
8.9 |
HR Administration |
763 |
190 |
2.3 |
Legal services (including IP management services) |
594 |
148 |
1.8 |
Business and corporate research |
1,159 |
288 |
3.5 |
Medical transcription |
4,268 |
1,061 |
13.0 |
Content development, management and publishing |
1,753 |
436 |
5.4 |
Any other service |
10,826 |
2,690 |
33.0 |
II. Engineering Services |
4,494 |
1,117 |
13.7 |
Embedded Solutions |
1,177 |
292 |
3.6 |
Product Design Engineering (mechanical, electronics excluding software) |
2,031 |
505 |
6.2 |
Architectural and other technical services |
427 |
106 |
1.3 |
Any other service |
854 |
212 |
2.6 |
Total ITES/BPO Services |
32,762 |
8,142 |
100.0 |
Within the Engineering services exports, Product design engineering services accounted for 6.2 per cent while Embedded solutions services had 3.6 per cent share.
Organisation-wise Software Services Exports:
Based on the reported data, 80.9 per cent of the companies were private limited companies which had a share of 39.2 in total reported software exports while public limited companies, though smaller in number (9.2 per cent), accounted for 58.8 per cent of total software services exports (Table 3).
Table 3: Organisation-wise distribution of Software Services Exports |
Type of Organization |
Number of Companies (in %) |
Software Services Exports |
Rs. crore |
US$ million |
Share (in per cent) |
Private Limited Companies |
80.9 |
55,017 |
13,672 |
39.2 |
Public Limited Companies |
9.2 |
82,429 |
20,484 |
58.8 |
Others |
9.9 |
2,754 |
685 |
2.0 |
Total |
100.0 |
1,40,200 |
34,841 |
100.0 |
Country-wise distribution of Software Services Exports:
The major destination for software services exports was the US accounting for 63.0 per cent. Exports to European countries constituted 26.6 per cent and of which the UK alone accounted for 14.0 per cent. The share of Asian countries was at 4.0 per cent of the total software services exports from India (Table 4).
Currency Invoicing pattern of Software Services Exports:
US Dollar was the major currency of invoicing accounting for the maximum share at 75.4 per cent followed by Pound Sterling (GBP) 12.8 per cent and the Euro 6.4 per cent. Software exports invoicing in Indian Rupee (INR) was only at 1.3 per cent of the total software exports (Table 5).
Table 4: Destination of Software Services Exports |
Country |
Exports |
Share (in per cent) |
| |
Rs. crore |
US$ million |
|
USA & Canada |
89,702 |
22,292 |
64.0 |
Europe |
37,289 |
9,267 |
26.6 |
of which UK |
19,614 |
4,874 |
14.0 |
Asia |
5,673 |
1,410 |
4.0 |
of which East Asia |
4,279 |
1,063 |
3.0 |
West Asia |
702 |
174 |
0.5 |
South Asia |
692 |
172 |
0.5 |
Australia & New Zealand |
2,136 |
531 |
1.5 |
Others |
5,401 |
1,342 |
3.8 |
Total |
1,40,200 |
34,841 |
100.0 |
Software Services Exports –offsite verses onsite:
Software services can be provided either in the form of offsite or onsite. Offsite exports accounted for 74.5 per cent of the total software services export while the rest were in the form of onsite (Table 6).
Table 5: Currency of Invoice-wise Software Services Exports |
Currency of Invoice |
Exports |
Share (%) |
Rs. crore |
US$ million |
USD |
1,05,665 |
26,259 |
75.4 |
Euro |
8,913 |
2,215 |
6.4 |
GBP |
17,970 |
4,466 |
12.8 |
AUD |
2,518 |
626 |
1.8 |
INR |
1,774 |
441 |
1.3 |
Others |
3,360 |
834 |
2.3 |
Total |
1,40,200 |
34,841 |
100.0 |
Size-wise classification of Software Services Exports:
About 91.5 per cent of the companies had the exports size below Rs.100 crore (small companies) with their share in the total software services exports at 7.8 per cent only. Though the share of large companies with the exports of Rs.100 crore and above was 8.5 per cent, their contribution in total software exports was about 92.2 per cent. The share of offsite exports of the small companies varied between 92.5 and 96.1 per cent while for large companies, its share was about 72.9 per cent.
Table 6: Software Services Exports -offsite vs onsite |
Type of Service |
Exports |
Share (per cent) |
Rs. crore |
US$ million |
Onsite |
35,673 |
8,865 |
25.5 |
Offsite |
1,04,527 |
25,976 |
74.5 |
Total |
1,40,200 |
34,841 |
100.0 |
On classifying the exports size as per destination of exports revealed that, large companies had marginally lower access to the US & Canada as compared to small companies. On the other hand, large companies had some what higher access to European countries as compared to small companies (Table 7).
Software business as per Modes of Supply:
International Trade in Services, as per MSITS [2002] of GATS, includes the (i) transactions between resident and nonresident covering Mode-1, Mode-2 and Mode-4, as defined earlier and (ii) services provided locally by the affiliates established abroad i.e. Mode-3. However, as per BPM5, foreign affiliates established abroad are treated as the domestic entities in the host economy and hence the services delivered by them are not considered as the exports of the home country. To this extent, data on services exports in BoP will differ from those as per Foreign Affiliated Trade Statistics. The present survey collected the software services trade data in terms of all four modes.
Table 7: Software Services Exports Classified by size & other characteristics |
Exports size (Rs crore) |
Number of companies (% share) |
Share in Exports (%) |
Destination of Exports (%) |
Exports (%) |
USA & Canada |
European Countries |
Other Countries |
Onsite |
Offsite |
< 1 |
29.7 |
0.1 |
69.3 |
17.0 |
13.6 |
3.9 |
96.1 |
1 - 10 |
38.5 |
1.4 |
71.7 |
17.3 |
10.9 |
7.5 |
92.5 |
10 - 100 |
23.4 |
6.3 |
69.0 |
20.8 |
10.2 |
6.2 |
93.8 |
>=100 |
8.5 |
92.2 |
63.5 |
27.2 |
9.4 |
27.1 |
72.9 |
Total |
100.0 |
100.0 |
64.0 |
26.6 |
9.4 |
25.4 |
74.6 |
From Table 8, it may be seen that the total international trade in software services by India stood at Rs.1,62,743 crore. Mode-1 (cross border supply) accounted for 60.4 per cent of total international trade in software services by India, while Mode-4 (presence of natural person) and Mode-3 (commercial presence) had 25.1 and 13.9 per cent share, respectively and the lowest being Mode-2 (consumption abroad) accounting for 0.6 per cent share. Small companies had delivered the software services mainly through Mode-1 covering about four fifth of their software exports. For large companies Mode-1 accounted for 58.5 per cent while Mode-4 accounted for 26.9 per cent to total international trade in software services by India.
Software business done by Subsidiaries/Associates Abroad:
In the present survey, the information was collected about the software business done by subsidiaries/associates of Indian companies abroad (foreign affiliates) in respect of business done in host country i.e. locally, to India and to other countries, for the purpose of Foreign Affiliates Trade in Services (FATS). It was observed that, total software business done by the Indian owned foreign affiliates during 2007-08 was at Rs.25,338 crore (excluding the services made available to India) (Table 9). Based on the type of activity, Indian companies were classified into four major categories viz.; IT services, Software product development, BPO and Engineering services. Companies having combination of these services were classified under ‘Others’. The software services provided by the Indian owned foreign affiliates were mainly towards the respective host county. The foreign affiliates of those Indian software companies which were categorised as ‘Others’ i.e. providing mix of services, were the major source for software business generated abroad. The foreign affiliates of Indian software companies engaged in purely ‘Engineering Services’ had negligible share in the total software business provided by the foreign affiliates. Box : Comparison of survey results with NASSCOM and Softex data Reserve Bank of India publishes the software exports data in BoP using NASSCOM data as a controlling total. The Reserve Bank also collects the information about the non-physical offsite software exports data through SOFTEX forms. NASSCOM releases annual software exports data on their website, based on the global software business of Indian software companies, i.e. software exports of Indian companies together with the software exports of their overseas subsidiaries. The Reserve Bank has conducted a survey on Software & IT Services Exports during 2007-08 to collect the information about the software & ITES/BPO services exports. In order to make the survey result comparable with NASSCOM data, the software business of overseas subsidiaries of Indian companies have been added to India’s software exports. The comparison of software exports of India based on the survey results has been made with the data released by NASSCOM for 2007-08 and also with the data received through Softex forms. Based on the survey, software exports from India during 2007-08 was estimated at Rs 1,40,200 crore (US$ 34,841 million). Also, software business done by the Indian subsidiaries abroad in 2007-08 was to the tune of Rs 25,338 crore (US$ 6,297 million). Together with the subsidiaries business, global software business based on the survey was Rs 1,65,538 crore (US$ 41,138 million), as against Rs.1,62,020 crore (US$ 40,300 million) published by NASSCOM.
Further, non-physical (offsite) software exports, as declared on Softex forms by Indian companies, during 2007-08 was Rs.1,07,464 crore. Adding the onsite software exports of Rs.35,673 crore, as reported in the survey, the total software exports during 2007-08 worked out to Rs 1,40,137 crore, which was close to the estimated software exports as per survey result. The survey results are quite comparable with the software exports data released by NASSCOM and also with the software exports data collected through Softex forms by the Reserve Bank.
Reconciliation of Software Exports from India during 2007-08 |
(Rs.crore) |
Software exports as per NASSCOM (Global business) |
Software Exports based on survey |
Software Exports based on survey and Softex data |
Indian companies |
Subsidiaries abroad |
Global business |
Offsite Non-physical software exports based on Softex |
Onsite software exports based on survey |
Total Software Exports of India |
(1) |
(2) |
(3) |
(4)=(2)+(3) |
(5) |
(6) |
(7)=(5)+(6) |
1,62,020 |
1,40,200 |
25,338 |
1,65,338 |
1,07,464 |
35,673 |
1,40,137 |
Table 8: International Trade in Software Services |
Exports Size |
No. of companies (%) |
Amount (Rs crore) |
Per cent Share in Total |
Mode 1 |
Mode 2 |
Mode 3 |
Mode 4 |
Total |
Mode 1 |
Mode 2 |
Mode 3 |
Mode 4 |
Less then 1 Crore |
29.7 |
197 |
2 |
21 |
6 |
226 |
87.2 |
0.9 |
9.3 |
2.7 |
1 - 10 Crore |
38.5 |
1,830 |
30 |
190 |
112 |
2,162 |
84.6 |
1.4 |
8.8 |
5.2 |
10 - 100 Crore |
23.4 |
8,220 |
253 |
1,029 |
367 |
9,869 |
83.3 |
2.6 |
10.4 |
3.7 |
=Above 100 Crore |
8.5 |
88,023 |
745 |
21,303 |
40,415 |
1,50,486 |
58.5 |
0.5 |
14.2 |
26.9 |
ALL Companies |
100.0 |
98,270 |
1,030 |
22,544 |
40,899 |
1,62,743 |
60.4 |
0.6 |
13.9 |
25.1 |
Mode 1 : Cross Border Supply. Mode 2: Consumption Abroad. Mode 3: Commercial Presence. Mode 4: Presence of Natural Persons. |
The US had maximum number of Indian owned affiliates accounting for 36.1 per cent of total number of Indian owned foreign affiliates and contributing about 60.7 per cent of business done by all foreign affiliates. The UK and Canada accounted for 10.8 per cent and 5.7 per cent in total business of the foreign affiliates, respectively (Table 10).
Table 9: Distribution Software Business byForeign Affiliates as per Activity of Indian companies |
(Rs crore) |
Activity |
Number of Foreign Affiliates (%) |
Software business done by foreign affiliates |
Locally |
To India |
To Other Countries |
IT Services |
21.6 |
1,545 |
49 |
16 |
Software Product Development |
3.7 |
113 |
3 |
16 |
BPO Services |
17.6 |
550 |
55 |
1,793 |
Engineering Services |
0.8 |
0 |
2 |
0 |
Others |
56.3 |
20,337 |
878 |
969 |
Total |
100.0 |
22,544 |
986 |
2,794 |
Summary : This article provides the estimates for the ‘Computer Services Exports’ as well as ‘ ITES/ BPO Services Exports’ of India for the period 2007-08, based on the annual comprehensive survey on software and IT services exports conducted by the Reserve Bank. The total software and IT services exports of India were estimated at Rs.1,40,200 crore (US$ 34,841 million), of which computer services exports, as defined in BPM5, were at Rs.1,07,438 crore (US$ 26,699 million). The data on software services trade were also collected according to Mode of Supply, as per the MSITS [2002] of GATS. The international trade in software services exports covering all modes of supply as per MSITS [2002] was estimated at Rs.1,62,743 crore (US$ 40,433 million).
Table 10. Software Business by Foreign Affiliates |
(Rs crore) |
Country |
Number of Foreign Affiliates (%) |
Software business of Foreign Affiliates |
Locally |
To India |
To Other Countries |
United States |
36.1 |
15,114 |
756 |
278 |
United Kingdom |
14.7 |
2,705 |
67 |
35 |
Canada |
2.4 |
45 |
0 |
1,396 |
Germany |
3.7 |
1,212 |
73 |
13 |
Netherlands |
2.9 |
896 |
5 |
0 |
Australia |
1.6 |
236 |
0 |
557 |
Singapore |
8.4 |
629 |
31 |
33 |
Others |
30.2 |
1,707 |
54 |
482 |
Total |
100.0 |
22,544 |
986 |
2,794 |
IV. References:
- BPM5 (1993): Balance of Payments Manual, 5th edition, International Monetary Fund (IMF), 1993.
- DIT [GoI(2003)]: IT-Enabled Services; http://www.mit.gov.in/itconf/
- MSITS (2002): GATS Manual on Statistics of International Trade in Services; UN etc., 2002.
- NSC (2001): Report of the National Statistical Commission (August 2001).
- Technical Group Report (2003): Technical Group on Re-examination of Data Reporting System on Software Exports, Reserve Bank of India, 2003.
- BPM6 (2008): Balance of Payments Manual, 6th edition, International Monetary Fund (IMF), 2008.
Annex - I
Computer Services as Per BPM5 [1993], BPM6 [2008] vis-à-vis MSITS [2002]
As per BPM5 [1993] of IMF |
As per BPM6 [2008] and MSITS [2002] |
The Computer services include the following: |
Computer services include hardware and software related services and data-processing services, as mentioned below: |
1. Data bases, such as development, storage and online time series; |
1. Hardware and software consultancy and implementation services; |
2. Data processing- including tabulation, provision of processing services on timesharing or specific (hourly) basis and Management of facilities of others on a continuing basis; |
2. Maintenance and repair of computer peripheral equipment; |
3. Hardware consultancy; |
3. Disaster recovery services, provision of advice, and assistance on matter related to the management of computer resources; |
4. Software implementation- including design, development and programming of customized systems; |
4. Analysis, design and programming of systems ready to use (including web page development and design), and technical consultancy related to software; |
5. Maintenance and repair of computer peripheral equipment. |
5. Development, production, supply and documentation of customized software, including the operating systems made on order for specific users; |
| |
6. System maintenance and other support services such as training provided as a part of consultancy; |
| |
7. Data processing services such as data entry, tabulation and processing on a timesharing basis; |
| |
8. Web page hosting services (i.e. the provision of server space on the internet to host the clients’ web pages; |
| |
9. Computer facilities management. |
Annex - II
CONFIDENTIAL RESERVE BANK OF INDIA
Department of Statistics and Information Management (Balance of Payments Statistics Division) Software and Information Technology (IT) Services Exports: Survey
Schedule Reference Period : April 2007 to March 2008 (Annual) PART-A: Profile of the Company
1. Name and address of the Company |
|
Name of the Company |
|
Registered Address |
|
2. Contact Details |
|
(i) Name in Full |
|
(ii) Designation |
|
(ii) Tel. No. |
|
(iv) Fax. No. |
|
(v) Email: |
|
3. Business Activity
(According to the principal source of operating revenue)
Please provide approximate percentage share of various business activities, describing your company in total business (A+B+C+D)
Business Activity |
% Share |
A. IT Services |
|
(i) Hardware and software consultancy and implementation services |
|
(ii) Maintenance and repair of computers and peripheral equipment |
|
(iii) Data recovery services, provision of advice, and assistance on matters related to the management of computer resources |
|
(iv) Analysis, design and programming of systems ready to use (including web page development and design), and technical consultancy related to software |
|
(v) Development, production, supply and documentation of customised software, including operating systems made on order for specific users |
|
(vi) Systems maintenance and other support services such as training provided as part of consultancy; |
|
(vii) Data processing services such as data entry, tabulation, and processing on a timesharing basis; |
|
Annex - II (Contd.) |
(viii) |
Web page hosting services (i.e., the provision of server space on the internet to host clients’ web pages) |
|
(ix) |
Computer facilities management |
|
(x) |
Non-physical exports of packaged software |
|
(xi) |
Any other service (please specify) |
|
Total (IT Services) |
0.0 |
B. ITES/BPO |
|
(i) |
Customer interaction services |
|
(ii) |
Finance and Accounting, auditing, book keeping and tax consulting services |
|
(iii) |
HR Administration |
|
(iv) |
Procurements and logistics |
|
(v) |
Legal services
(including IP management services) |
|
(vi) |
Business and corporate research |
|
(vii) |
Animation |
|
(viii) |
Gaming |
|
(ix) |
Medical transcription |
|
(x) |
Document Management |
|
(xi) |
Content development and management and publishing |
|
(xii) |
Pharmaceuticals and biotechnology |
|
(xiii) |
Any other service (please specify) |
|
Total (ITES/BPO) |
0.0 |
C. Engineering Services |
|
(i) |
Embedded Solutions |
|
(ii) |
Product Design Engineering (mechanical, electronics excluding software) |
|
(iii) |
Industrial automation and enterprise asset management |
|
(iv) |
Architectural and other technical services |
|
(v) |
Any other service (please specify) |
|
Total (Engineering Services) |
0.0 |
D. Software Products |
|
(i) |
Software products |
|
(ii) |
Own software products license revenues |
|
(iii) |
Resale of software |
|
(iv) |
Offshore Product Development |
|
(v) |
Any other service (please specify) |
|
Total (Software Products) |
0.0 |
E. Total (A+B+C+D) |
0.0 Total (E) Should be = 100 |
4. Form of Organisation (Please select the organisation type] |
Organisation type |
Please Enter Organisation Type |
PART -B: Software and IT Exports 5. Information on Software and IT Services Exports
(a) Exports - Major Activities: Total Invoice value in Rupees [including billing to subsidiary(s) associate(s) abroad ] during the reference period according to major activities
Exports - Major Activities |
Invoice Value (Rupees) |
(i) IT Services |
|
(ii) ITES/BPO |
|
(iii) Engineering Services |
|
(iv) Software Products |
|
Total (I + ii + iii + iv) |
0 |
(b) Exports- Major Currencies: Invoice value in terms of actual currency of invoice and in Rupees [including billing to subsidiary(s)/ associate(s) abroad] during the reference period according to major currencies
Exports - Major Currencies |
Invoice Value |
Actual Currency |
Rupees |
US $ |
|
|
Euro |
|
|
Pound Sterling |
|
|
Japanese Yen |
|
|
Canadian Dollar |
|
|
Australian Dollar |
|
|
Indian Rupee |
|
|
Others (converted in Indian rupees) |
|
|
Total |
|
0 |
(c) Exports- Type of Service: Total Invoice value in Rupees [including billing to subsidiary(s)/ associate(s) abroad] during the reference period as per type export service
Exports - Type of Service |
Amount (Rupees) |
(i) On-site services |
|
(ii) Off-shore services in non-physical form (i.e., exports through data communication links etc.) |
|
(iii) Off-shore services in physical form |
|
Total (i + ii + iii) |
0 |
(d) Exports - Major Areas: Total Invoice value in Rupees [including billing to subsidiary(s)/ associate(s) abroad] during the reference period to major countries/ regional groups
Exports - Regional Groups |
Amount (Rupees) |
(i) USA |
|
(ii) Canada |
|
(iii) Europe |
|
Annex - II (Contd.) |
of Which : (a) Germany |
|
(b) Hungary |
|
(c) Netherlands |
|
(d) Switzerland |
|
(e) United Kingdom |
|
(iv) East Asia |
|
of Which : (a) Hong Kong |
|
(b) Japan |
|
(c) Singapore |
|
(v) West Asia |
|
(vi) South Asia |
|
(vii) Australia |
|
(viii) New Zealand |
|
(ix) Latin America |
|
(x) Others |
|
Total (i + ii + ……+ ix + x) |
0 |
6. Exports - Modes of Supply
Total invoice on software and IT services exports as per the Modes of Supply during the reference period
Exports - Modes of Supply |
Amount (Rupees) |
Services rendered to foreign entities/persons from Indian office (Cross border supply) |
|
Consumption of services by foreign entities/persons in India (Consumption abroad) |
|
Onsite services provided by deputing employees abroad (Presence of natural persons) |
|
Total |
0 |
7. Exports Proceeds- Receipt, Expenditure and Held Abroad
Information on amount received, spent and held abroad [including billing to subsidiary(s)/ associate(s) abroad] on account of software and IT exports during the reference period
Exports Proceeds - Receipt, Expenditure and Held Abroad |
Amount (Rupees) |
(i) Amount received from abroad during the reference period |
|
(ii) Total amount paid to employees abroad by the Indian company |
|
(iii) Total amount spent on office expenses etc. abroad
(excluding amount paid to employees abroad) by the Indian company |
|
(iv) Total amount held abroad at the beginning of the reference period by the Indian company |
|
(v) Change in amount held abroad during the reference period (Increase +, Decrease -) |
|
PART -C: Employment Details 8. Information on Number of Employees
Employment |
Indian Citizen |
Foreigner (Citizens of other countries) |
Total |
| |
(1) |
(2) |
(1+2) |
a) Indian Company |
|
|
0 |
b) Subsidiary(s)/Associate(s) abroad |
|
|
0 |
Total (a+b) |
0 |
0 |
0 |
PART -D: Subsidiary/ Associate Abroad
9. Information on subsidiary(s)/ associate(s) abroad
If your company owns any subsidiary/associate, please give number of subsidiaries/ associates abroad and provide the following information for each subsidiary(s)/ associate(s) separately. Number of Subsidiaries/ Associates Abroad Please Enter Number of Subsidiaries/ Associates
Subsidiary(s)/ Associate(s)’s |
Holding by your company (in %) |
Period of operation (in years & months) |
Total software/IT services rendered by the Subsidiary(s)/ Associate(s) during the reference period (in Rupees) |
Name |
Country Name |
locally |
to India |
to other Countries |
Total |
| |
COUNTRY |
|
|
|
|
|
0 |
| |
COUNTRY |
|
|
|
|
|
0 |
| |
COUNTRY |
|
|
|
|
|
0 |
| |
COUNTRY |
|
|
|
|
|
0 |
| |
COUNTRY |
|
|
|
|
|
0 |
| |
COUNTRY |
|
|
|
|
|
0 |
| |
COUNTRY |
|
|
|
|
|
0 |
| |
COUNTRY |
|
|
|
|
|
0 |
| |
COUNTRY |
|
|
|
|
|
0 |
| |
COUNTRY |
|
|
|
|
|
0 |
10. Declaration
I hereby declare that the information given in this return is complete and correct to the best of my knowledge and belief.
(i) Name in Full
(ii) Designation
(iii) Date:
Annex - III
Concepts and Definition Concepts and Definition:
A. Definitional boundary of computer services exports
In the BPM5, software & IT services are classified under ‘Computer and information services’ that covers computer data and news related service transactions. The ‘Computer services’ component of this services class includes data bases, such as development, storage, and on-line time series; data processing—including tabulation, provision of processing services on a time-share or specific (hourly) basis, and management of facilities of others on a continuing basis; hardware consultancy; software implementation – including design, development, and programming of customized systems; maintenance and repair of computers and peripheral equipment. However, BPM6 classifies Computer Services separately from Information Services which is in line with Manual on Statistics of International Trade in Services [MSITS(2002)]. The disaggregated information to be provided under the component ‘Computer services’ is mentioned in Annex-I. In the present survey, the information on Computer services exports are collected under head of IT services and software development services exports.
B. Activity wise classification of IT Enabled Services
As per the information available in the website of the Department of Information Technology of the Government of India [DIT, GoI(2003)], spectrum of I.T. Enabled Services (ITES) in India covers Call Centers, Medical Transcription, Back Office Operations, Revenue Accounting and other ancillary operation, Insurance Claims Processing, Legal databases, Content Development/ Animation, Payroll Logistics Management, etc. However, BPM5 as well as BPM6 and the MSITS(2002) do not provide for any activity classified under the name of ‘IT enabled’ business services or BPO. As per BPM5, other business services cover, among others, miscellaneous business, professional, and technical services. It is generally agreed that underlying product (commodity), and not the mode of delivery, should be the criterion of classification. To illustrate, the provision of business services, such as accounting services, should be included under appropriate heading under the other business services even though these services are entirely delivered through computer or internet. In the present survey, exports through ITES/BPO services has been compiled based on the classification given by Department of Information Technology of the GoI [DIT(GoI(2003)].
C. Modes of supply under General Agreement on Trade in Services (GATS) and software exports
Recognizing certain intrinsic differences in the way services are produced and consumed as compared to the way goods are produced and consumed, the General Agreement on Trade in Services (GATS) introduced the concept of modes of supply. It may be stated that while under BPM5, transactors in the international trade are classified into two types, viz., resident and non-resident, the MSITS [2002] defined the four modes of supply in the following manner:
(a) Mode 1 - cross-border supply: from the territory of one country into the territory of any other country;
(b) Mode 2 - consumption abroad: in the territory of one country to the service consumer of other country;
(c) Mode 3 - commercial presence: by a service supplier of one country, through commercial presence in the territory of any other country;
(d) Mode 4 - presence of natural persons: by a service supplier of one country, through presence of natural persons in the territory of any other country. Software & IT Services Exports survey- 2007-08:
A. Survey Methodology:
The survey, conducted through mailed (electronic mail) questionnaire canvassing around 6,140 companies, engaged in Software and Information Technology Enabled Services/Business Process Outsourcing (ITES/ BPO) services. The survey frame was prepared using the member companies of NASSCOM and companies registered with STPI. Thus, the comprehensive survey was census in nature.
B. Response:
Response received from 993 companies. Out of these companies, 215 companies were only engaged in BPO services, 59 companies in Engineering services, 313 in IT services, 100 companies in Software Product Development while the remaining companies reported combination of above activities as their business activity.
C. Information collected through the
Survey:
Information collected through the survey was on various characteristics, viz.; business activity, type of organization, exports as per major activities, country and currency-wise exports, nature of exports (onsite and offsite), modes of supply (as defined by GATS), information on employment, business done by the subsidiaries/ associates abroad.
Annex - IV
Methodology for estimation of Software Exports of Non-responded companies Total 993 companies responded to the survey covering all major companies. So, the non-responded companies were the smaller companies. Further, it was observed from data received from the responded companies that onsite export was mainly reported by the major companies. So while estimating the exports done by the non-responded companies, only offsite export was considered. As no information was available about the business activity of the non-responded companies, these were classified into 4 groups viz.; IT, BPO, Engineering and Software Product Development based on the observed proportion. Also, the distribution of export in all the four groups i.e. IT, BPO, Engineering and Software Product Development was highly positively skewed. So median exports of each of these groups was used for estimating the exports done by respective group of business. Using the methodology, the software services exports of non-respondent companies was estimated to the tune of Rs.19,928 crore (around 14.0 per cent of total software services exports). To estimate other distributional patterns of exports, observed proportions were used.
Annual survey on Software and IT Services Exports for the period 2007-08 was launched canvassing around 6,140 Software and IT/BPO companies. Of these, 1070 companies responded to the survey which includes 78 NIL and closed companies. All the major software and IT/BPO companies responded to the survey. Using the observed proportion, number of NIL and Closed companies have been estimated from 5070 non-responded companies and software exports have been estimated for the remaining 4700 non-responded companies, using the following method:
- Based on the reported activity, companies were classified in four groups, viz.; IT Services, BPO Services, Engineering Services and Software Product Services (having 100 per cent business under respective group).
- For classifying the other companies having combination of these as their business activity, reported proportions of their exports done in IT, BPO, Engineering and Software Product services have been used.
- Based on the reported data, it was observed that ‘On-site’ software export was primarily reported by the major companies. Therefore, only offshore software exports component was used for estimating software export of non-responded companies.
- As the observed distribution of exports was highly positively skewed in each of these groups, median was used for estimating software exports in each group.
estimated software exports for ith group
Then, the total software exports of India has been compiled as the sum of reported software exports and the estimated software extort for non-responded companies in each of the four groups.
* Prepared in the Balance of Payments Statistics Division, Department of Statistics & Information Management. Previous article on Computer Services Exports from India: 2002-03 was published in RBI Bulletin, September 2005. |