Union Budget 2009-10: Review and Assessment* The article undertakes a review and an assessment of the Union Budget 2009-10. The revised estimates of the finances of the Central Government during 2008-09 placed key deficit indicators, viz., revenue deficit and fiscal deficit in relation to GDP substantially higher than the budget estimates. This was mainly on account of deceleration in tax revenue due to moderation in growth rate coupled with tax cuts and higher expenditure to provide a stimulus to the economy in the aftermath of the global financial crisis. With the fiscal stimulus being sustained, the key deficit indicators are slated to widen further during 2009-10. However, the deviation in the key deficit indicators from those mandated under FRBM rules are considered temporary and the Government reiterated its intention to revert back to the path of fiscal consolidation as soon as the negative effects of global financial crisis on growth have been overcome. As a medium-term objective, it has been proposed to initiate institutional reforms encompassing all aspects of Budget such as subsidies, taxes, expenditure and disinvestments. The Union Budget 2009-10 was presented in the backdrop of moderation of growth in the Indian economy and signs of stabilisation in the rate of decline in the global economy. The Budget has aimed to address three important challenges in the short and medium-term, viz., revive the economy to attain a growth of 9.0 per cent per annum at the earliest, deepen and broaden the agenda for inclusive development and re-energise Government and improve delivery mechanisms. The Budget has envisaged a higher allocation for the crucial sectors such as infrastructure in rural and urban areas, education and health, rural employment and empowerment of different segments of population. On taxation front, the changes in the taxes have been envisaged both in direct and indirect taxes to address the concerns of growth and employment. The Budget has emphasised the need to revert back to the path of fiscal consolidation as soon as possible so as to attain sustainability of the finances of the Government in the medium-term. In order to accomplish this, the Government has recognised the importance of institutional reforms encompassing all aspects of the budget such as subsidies, taxes, expenditure and disinvestment.
Thrust of the Budget
Economic Revival, Inclusive Development and Building Accountable Institutions
In the Union Budget 2009-10, the Government has attempted to address three important challenges facing the economy, viz., economic revival, inclusive development and building accountable institutions. To arrest the fall in growth rate in the short-term and sustain it at 9 per cent in the medium-term, the Budget has adopted an expansionary fiscal policy in the short-run. To make development more inclusive there has been substantial increase in the allocation for sectors such as rural employment, health and education. In addition, the Union Budget 2009-10 has for the first time called for creating entitlements backed by legal guarantee to provide basic amenities and opportunities for livelihood to vulnerable sections of society. The Government has also recognised the importance of accountability, transparency and delivery mechanisms of development programmes for high growth and inclusive development.
Fiscal Consolidation
There was substantial deviation from the path of fiscal consolidation in the 2008-09 with key deficit indicators, viz., revenue deficit (RD) and gross fiscal deficit (GFD) turning out to be much higher than the budget estimates. This was on account of economic slowdown, fiscal stimulus measures in terms of tax cuts and additional expenditure to support economic growth. As a result, fiscal deficit increased from 2.7 per cent in 2007-08 to 6.2 per cent of GDP in 2008-09 (provisional accounts). The Central Government has continued to place emphasis on revival of the economy by persisting with fiscal stimulus measures through tax cuts and higher expenditure in 2009-10 as well. Accordingly, the gross fiscal deficit for 2009-10 has been budgeted higher at 6.8 per cent of GDP. However, the Government intends to revert back to the path of fiscal consolidation at the earliest possible. In this context, it has proposed to initiate institutional reform measures in all aspect of the budget such as subsidies, taxes, expenditure and disinvestment. Further, the Thirteenth Finance Commission (ThFC), through an additional Terms of Reference, has been mandated to review the fiscal adjustment and suggest a revised roadmap to maintain the gains from fiscal consolidation through 2010 to 2015. The ThFC has been asked to particularly keep in view the need to bring in the liabilities of the Central Government on account of oil, food and fertiliser bonds into the fiscal accounting, and the impact of various other obligations of the Central Government on the deficit targets. In the medium-term fiscal policy statement, the targets of fiscal deficit during 2010-11 and 2011-12 have been set at 5.5 per cent and 4.0 per cent, respectively.
Tax Proposals
The tax proposals announced in the Budget are in line with broad objectives of taxation policy such as elimination of distortions in the tax structure, moderate levels of taxation and expansion of tax base, rationalisation and simplification of tax structure followed in recent years. Accordingly, the threshold exemption limits on personal income tax (PIT) has been enhanced and surcharge on PIT removed to rationalise the income tax structure. On the indirect tax front, the aim has been to integrate tax on goods (CENVAT) and tax on services and finally move towards Goods and Service Tax (GST) by April 1, 2010. As a part of this initiative, the excise duty rate has been increased from 4 per cent to 8 per cent on certain finished goods and consumer goods to converge it to the mean CENVAT rate. The reduction in excise rate announced on two occasions, from 14 per cent to 10 per cent and from 10 per cent to 8 per cent, to support the manufacturing sector as part of fiscal stimulus was kept unchanged. It has proposed to increase the revenue from service tax by adding four more services under the service tax. Other initiatives included the provision of quality services to taxpayers by re-engineering business processes in the Income- tax department through extensive use of modern technology such as use of e-filling of returns, e-payment of taxes, establishment of a Centralised Processing Centre, issue of refunds through ECS and refund bankers, computer aided selection of cases for scrutiny and effective taxpayer information system. Thus, the strategy of tax policy has aimed to improve voluntary compliance and efficiency of tax administration by using the latest information technology tools.
Against the above backdrop, this article makes an assessment of the Union Budget 2009-10. Section I presents the major policy initiatives announced. The tax proposals announced in the Budget are discussed in Section II. The budgetary outcome in the revised estimates for 2008-09 is discussed in the Section III. Section IV presents an analysis of budget estimates for 2009-10. Section V provides an assessment of the Budget followed by conclusion. Section I
Major Policy Initiatives The major policy announcements in the Budget for 2009-10 are aimed at bringing economy back to the high growth path of 9.0 per cent at the earliest while ensuring inclusive growth and re-energise the Government and improve delivery mechanisms. Towards the objective of economic revival, the Budget has announced several short and medium-term measures for development of infrastructure, agriculture, restoration of export growth, containment of subsidies, improvement in financial access and deepening of markets and improve investment environment. In order to make growth process more inclusive, the allocation of resources for programmes such as National Rural Employment Guarnatee Scheme (NREGS), Bharat Nirman and Pradhan Mantri Gram Sadak Yojana (PMGSY) were substantially enhanced and various schemes were also announced to empower the weaker sections. Measures were also announced to improve the public delivery system and national security.
I.1. Agriculture and Rural Development
Agriculture sector continued to be a priority in the Budget for the purpose of growth and stability. The major thrust areas for sustaining a growth rate of 4 per cent in the sector included: credit, capital formation, debt waiver, debt relief, irrigation and rural infrastructure. a) Agriculture Credit, Debt Waiver and Debt Relief: The targeted credit to agriculture for 2009-10 has been placed at Rs. 3,25,000 crore as against the credit flow of Rs.2,87,000 crore in 2008-09. In order to enable the achievement of the target, the interest subvention scheme for short-term crop loans to farmers for loans up to Rs.3 lakh per farmer at interest rate of 7 per cent per annum was proposed to be continued. An additional subvention of 1 per cent amounting to Rs.411 crore has been provided to those farmers who pay short-term crop loans on schedule. The time given to farmers with more than two hectares of land to pay 75 per cent of their overdues by June 30, 2009 under Agriculture Debt Waiver and Debt Relief Scheme (2008) has been extended to December 31, 2009.
b) Irrigation: The allocation under Accelerated Irrigation Benefit Programme (AIBP) has been increased by 75 per cent over the Interim Budget. Rashtriya Krishi Vikas Yojna (RKVY) has been initiated to increase public investment in agriculture and allied activities like agricultural marketing, agricultural research and education, soil and water conservation agriculture by providing incentive to States. The allocation under the scheme has been raised by 30 per cent over 2008-09 BE.
c) Rural Infrastructure: The progress made in attaining the targets for building rural infrastructure under Bharat Nirman for provision of irrigation, water supply, roads, houses, electrification and telephone facilities in the villages during 2008-09 had been impressive. The allocation for Bharat Nirman has been increased by 45 per cent in 2009-10 over 2008-09 BE. The allocation for the Pradhan Mantri Gram Sadak Yojana (PMGSY) under Bharat Nirman has been increased by 59 per cent in 2009-10 over 2008-09 BE to Rs 12,000 crore. The allocation for the Indira Awaas Yojana (IAY) has been increased by 63 per cent to Rs.8,800 crore in 2009-10 BE. To boost the resource base of Rural Housing Fund of National Housing Bank (NHB) for their refinance operations in rural housing sector, an allocation of Rs.2,000 crore has also been proposed from the shortfall in the priority sector lending of commercial banks.
I.2 Industry and Services
a) Restoring Export Growth: To provide assistance to the exporters to help them overcome the negative fallout of global economic crisis, an adjustment assistance scheme to provide enhanced Export Credit and Guarantee Corporation to badly hit sectors initiated in December 2008 has been extended up to March 2010. The allocation under the Market Development Assistance Scheme which provides support to exporters in developing new markets has been enhanced by 148 per cent over 2008-09 BE to Rs.124 crore. In order to protect the employment-oriented sectors from the global meltdown, the deadline for interest subvention on pre-shipment credit for seven employment oriented sectors has been extended from September 30, 2009 to March 31, 2010.
b) Micro, Small and Medium Enterprises: A special fund of Rs.4,000 crore has been proposed to be provided to Small Industries Development Bank of India (SIDBI) out of Rural Infrastructure Development Fund (RIDF). This fund would incentivise Banks and State Finance Corporations (SFCs) to lend to Micro and Small Enterprises (MSEs) by refinancing 50 per cent of incremental lending to MSEs during 2009-10. I.3 Physical Infrastructure The Budget continued to take measures for the expansion of infrastructure which is vital for growth. In order to ensure that the infrastructure projects do not face financing difficulties, India Infrastructure Finance Company Limited (IIFCL) would refinance 60 per cent of the commercial bank loans for public private partnership (PPP) projects in critical sectors over the next fifteen to eighteen months. The IIFCL and Banks would be able to support a total investment of Rs.100,000 crore in infrastructure.
The allocation to National Highways Authority of India (NHAI) for National Highway Development Programme (NHDP) has been hiked by 23.0 per cent over 2008-09 (BE) while that of Railways by about 46.0 per cent over the Interim Budget 2009-10. The allocation under the Accelerated Power Development and Reform Programme (APDRP) has been increased to Rs.2,080 crore over 2008-09 (BE) to bridge the gap between demand and supply of power. The allocation under Jawaharlal Nehru National Urban Renewal Mission (JNNURM) has been increased by 87 per cent over 2008-09 (BE). The allocation for housing and basic amenities to the urban poor has also been enhanced to Rs 3,973 crore in the Budget 2009-10.
The indigenous production of natural gas is set to double with finding of natural gas in the KG Basin on the Eastern off-shore of the country. In the light of natural gas emerging as an important source of energy, to facilitate transportation of gas across the country, it has been proposed to develop a blueprint for long distance gas highways leading to National Gas Grid.
I.4 Social Infrastructure and Welfare Measures
The higher allocation for the development of social infrastructure are aimed to boost aggregate demand, generate employment and provide support to the vulnerable section of the society. In order to make growth inclusive, the outlays for flagship programmes relating to rural employment, education, health, water supply, women and child development and other welfare has been increased substantially.
a) Education and Health: The allocation for National Rural Health Mission (NRHM) has been increased by Rs 2,057 crore in the Budget over and above Rs.12,070 crore in the Interim Budget. It has been proposed to bring all BPL families under the Rashtriya Swasthya Bima Yojana (RSBY) operationlised in 2008 to empower poor families by giving the freedom of choice for using health care services from private hospital or government hospital. An allocation of Rs.350 crore has been earmarked for this scheme.
b) Employment Generation: The allocation for National Rural Employment Guarantee Act (NREGA) has been budgeted to increase by 144 per cent over 2008-09 (BE) at Rs.39,100 crore for the year 2009-10. In order to increase the productivity of assets and resources under NREGA, convergence with other schemes relating to agriculture, forests, water resources, land resources, and rural roads has been proposed. In the first stage, a total of 115 pilot districts have been selected for such convergence. It has been proposed to launch a new project for modernisation of the Employment Exchanges in public private partnership so that a job seeker can register on-line from anywhere and approach any employment exchange.
c) Other Welfare Measures: In order to enable students from economically weaker sections to access higher education, a scheme to provide full interest subsidy during the period under moratorium has been proposed. The scheme would cover loans taken by the students from scheduled banks to pursue any of the approved courses of study, in technical and professional streams, from recognised institutions in India. A new scheme called Pradhan Mantri Adarsh Gram Yojana (PMAGY) would be launched during 2009-10 on a pilot basis for the integrated development of 1000 villages (with scheduled castes population of above 50 per cent) with an allocation of Rs.100 crore. The Swarna Jayanti Gram Swarozgar Yojna (SGSY) would be restructured as National Rural Livelihood Mission to make it universal in coverage, focused in approach and time bound for poverty eradication by 2014-15. In addition to providing capital subsidy at an enhanced rate, it is proposed to provide interest subsidy to poor households for loans up to Rs. one lakh from banks. In the light of profound transformation brought about by Women’s Self Help Group in rural areas, it has been envisaged to enrol at least 50 per cent of all rural women in India as members of SHGs over the next five years and link these SHGs to banks. The corpus of Rashtriya Mahila Kosh (RMK), which has been the instrument of socio-economic development by facilitating the credit support or microfinance to poor women, would be increased from Rs.100 crore to Rs.500 crore over the next few years. With the objective to reduce the current level of female illiteracy by half in three years, the National Mission for Female Literacy with a focus on minorities, SC, ST and other marginalised groups has been launched. The draft Food Security Bill would be placed on the website of the Department of Food and Public Distribution for public debate and consultations.
1.5 Towards Building Accountable Institutions
A provision of Rs.120 crore has been made for the Unique Identification Authority of India (UIDAI) which was set up for improving governance with regard to delivery of public services.
1.6 Financial Sector
Financial Inclusion: To increase the level of financial inclusion for sustaining long-term equitable development, a subcommittee of State Level Bankers Committee (SLBC) would identify under-banked or un-banked areas and formulate an action plan for providing banking facilities to all these areas in the next 3 years. An amount of Rs.100 crore has been set aside during the current year as one-time grant-in-aid to ensure provision of at least one centre/Point of Sales (POS) for banking services in each of the unbanked blocks in the country. Section II
Tax Proposals The thrust of reforms over the last few years has been to improve the efficiency and equity of tax system. This is sought to be achieved by eliminating distortions in the tax structure, introducing moderate tax rates and expanding the base. As a result, the Centre’s tax- GDP ratio increased to 12.9 per cent in 2007-08 from a low of 9.2 per cent in 2003-04 before sliding to 11.8 per cent in 2008-09. The growth in tax revenue is mainly due to growth in direct tax revenue. Their share in Centre’s tax revenue has increased to 56 per cent in 2008-09 from 41 per cent in 2003-04 resulting in the enhancement of tax equity of tax system. The Income Tax Return Forms are proposed to be made simpler and user-friendly. The Government has proposed to pursue structural changes in direct taxes by releasing the new Direct Taxes Code on August 12, 2009 and also pursue structural changes in indirect taxes by accelerating the process for the smooth introduction of the Goods and Services Tax (GST) with effect from April 1, 2010. A unique computer based Document Identification Number for tracking taxpayer would be introduced to enhance transparency in the functioning of the tax administration. It has been proposed to merge the two Authorities for Advance Rulings on Direct and Indirect Taxes by amending the relevant Acts to further enhance efficiency in tax administration. The Union Budget has sought to provide quality services to taxpayers by re-engineering business processes in the Income-tax department through extensive use of modern technology such as use of e-filling of returns, e-payment of taxes, computer aided selection of cases for scrutiny. Overall, the direct tax measures for the Union Budget 2009-10 would be revenue neutral while indirect taxes would yield a net gain of Rs.2,000 crore. Detailed tax proposals are set out in Annex I. The major tax proposals in the Budget are as follows.
II.1 Direct Taxes
a) Personal Income Tax
Some relief has been provided to small and marginal taxpayers, women and senior citizens in the basic exemption limit. In case of senior citizens above 65 years of age, the exemption limit has been raised by Rs.15,000 to Rs.2,40,000. In the case of women and all other categories of individual taxpayers, the basic exemption limit has been raised by Rs.10,000 each to Rs.1,90,000 and Rs.1.60,000, respectively. The surcharge of 10 per cent on personal income tax has been eliminated. It has also been proposed to increase the deduction under section 80-DD in respect of maintenance, including medical treatment, of a dependent who is a person with severe disability to Rs.1,00,000 from the earlier limit of Rs.75,000.
b) Corporate Tax The corporate tax rates have been kept unchanged in the Budget 2009-10. The Minimum Alternate Tax (MAT) is levied on “Zero Tax Companies” who had book profits and declared dividends to the shareholders but who do not pay any income tax. In order to increase equity in taxation of corporate taxpayers and enhance tax revenue, MAT rate has been increased from 10 per cent of book profits to 15 per cent. However, to give relief to corporate tax payers, the period allowed to carry forward the tax credit under MAT has been extended from seven years to ten years.
Table 1: Income Tax Rates |
Up to Rs. 1,60,000/- |
Nil |
Rs. 1,60,001/- to Rs. 3,00,000 |
10 per cent |
Rs. 3,00,001/- to Rs. 5,00,000/- |
20 per cent |
Above Rs. 5,00,000/- |
30 per cent |
c) Other Taxes
The Fringe Benefit Tax imposed on the value of certain fringe benefits provided by employers to their employees has been abolished in order to reduce the compliance burden. The Commodity Transaction Tax has been also abolished. However, the Securities Transaction Tax (STT) has been kept unchanged.
With a view to tide over the slowdown in exports, the sun-set clauses for tax holiday have been extended by one more year, i.e., for the financial year 2010-11. It has also been proposed to extend the tax holiday under section 80-IB (9) of the Income Tax Act to natural gas sector to facilitate the energy security.
It has been proposed to reduce the distortionary impact of profit linked tax incentives by introducing investment-linked tax exemptions beginning with businesses of setting up and operating ‘cold chain’, warehousing facilities for storing agricultural produce and the business of laying and operating cross country natural gas or crude or petroleum oil pipeline network for distribution on common carrier principle.
In order to facilitate the business operations of all small taxpayers and reduce their compliance burden, it has been proposed to expand the scope of presumptive taxation to all small businesses with a turnover upto Rs.40 lakh. They would have the option to declare their income from business at the rate of 8 per cent of their turnover and simultaneously enjoy exemption from the compliance burden of maintaining books of accounts.
The tax treatment New Pension Scheme (NPS), an important social security system of Government, has been rationalised by exempting the income of the NPS Trust from income tax and any dividend paid to this Trust from Dividend Distribution Tax. All purchases and sales of equity shares and derivatives by the NPS Trust would also be exempted from the Securities Transaction Tax.
In order to incentivise the corporate sector to undertake research and development (R&D) work, it has been proposed to extend the scope of the current provision of weighted deduction of 150 per cent on expenditure incurred on in-house R&D to all manufacturing businesses except for a small negative list.
II.2 Indirect taxes
a) Goods and Services Tax
The dual GST model in which the Centre and the States would each legislate, levy and administer the Central GST and State GST, respectively will be introduced on April 01, 2010.
b) Customs duty
It has been proposed to impose a nominal basic customs duty of 5 per cent on Set Top Boxes to encourage domestic value addition. Since electronic hardware industry has a strong potential for employment especially in the SME sector, the basic customs duty on LCD panels has been reduced from 10 per cent to 5 per cent to support indigenous production. Full exemption from basic customs duty has been provided to rough corals for encouraging value-addition and export. The customs duty has been reduced to 5 per cent from 10 per cent in respect of influenza vaccine and nine specified life saving drugs used for the treatment of breast cancer, hepatitis-B, rheumatic arthritis etc., and on bulk drugs used for the manufacture of such drugs. These would also be totally exempted from excise duty and countervailing duty. On the other hand, customs duty has been increased from Rs. 100 to Rs.200 per ten grams for gold bars and from Rs. 250 to Rs. 500 per ten gram for other forms of gold (excluding jewellery). Customs duty on silver (excluding jewellery) has also been increased from Rs.500 per kg to Rs.1,000 per kg.
c) Excise duty
A differential in excise rates has been maintained between the cotton sector and the manmade fibres sector. It has been proposed to restore the erstwhile optional rate of 4 per cent for cotton textiles beyond the fibre stage. It has been proposed to restore the rate of 8 per cent central excise duty on manmade fibre and yarn on a mandatory basis and on stages beyond fibre and yarn at that rate on optional basis. The basic customs duty on wool waste and cotton waste was reduced to 10 per cent. For further convergence of central excise duty rates to a mean rate of 8 per cent, it has been proposed to increase the rate on many items. The petro-diesel blended with bio-diesel has been fully exempted from excise duty. In addition, it has been proposed to reduce basic customs duty on bio-diesel from 7.5 per cent to 2.5 per cent - at par with petro-diesel to encourage the use of environment friendly fuel.
It has been proposed to exempt the value attributable to the transfer of the right to use packaged software from excise duty and CVD. For construction industry, restoration of full exemption to goods manufactured at site, including pre-fabricated concrete slabs or blocks has been proposed. Excise duty on petrol driven trucks has been reduced from 20 per cent to 8 per cent.
d) Service Tax
The service tax has been kept unchanged at 10 per cent. Keeping in view the growing share of the services sector, four more services have been brought into services taxes net viz., (i) transportation of non-essential goods through railways, (ii) transportation of specified goods through coastal shipping and inland shipping, (iii) legal advice, consultancy or technical assistance provided by a corporate law firm to a corporate, and (iv) cosmetic and plastic surgery.
Services received by exporters from goods transport agents and commission agents, where the liability to pay service tax is ab initio on the exporter, has been exempted from service tax. For other services received by exporters, the exemption would be operated through the existing refund mechanism based on self-certification of the documents where such refund is below 0.25 per cent of fob value and certification of documents by a Chartered Accountant for value of refund exceeding the above limit. The Export Promotion Councils and the Federation of Indian Export Organisations (FIEO) are proposed to be exempted from the levy of service tax on the membership and other fees collected by them till March 31, 2010.
Section III
Revised Estimates 2008-091
III.1 Deficit Indicators
The revised estimates for 2008-09 showed marked deterioration in all the key deficit indicators viz., revenue deficit (RD), gross fiscal deficit (GFD) and primary deficit (PD), relative to GDP over their budgeted levels. The deterioration of the deficit indicators was due to marked deceleration in tax collection as a result of economic slowdown and cut in indirect tax rates on the one hand and substantial hike in expenditure, in particular revenue expenditure, to boost aggregate demand on the other.
The revenue receipts declined by Rs.40,762 crore (6.8 per cent) from the budgeted level while revenue expenditure increased by Rs.1,45,327 crore (22.1 per cent). As a result, RD in the 2008-09 RE at Rs.2,41,273 crore was higher than the BE by 337.2 per cent and constituted 4.4 per cent of the GDP as against the budgeted level of 1.0 per cent. Consequently, GFD was higher by Rs.1,93,228 crore (145.0 per cent) constituting 6.0 per cent of GDP as against the budgeted level of 2.5 per cent. Similarly, primary balance which was budgeted to be a surplus of 1.1 per cent of GDP, turned to a deficit of Rs.1,33,821 crore, constituting 2.5 per cent of GDP in 2008-09 (RE) (Table 2).
III.2 Revenue Receipts
Reflecting the impact of economic slowdown and reduction in tax rates as fiscal stimulus measures to contain the slowdown, the gross tax revenue in the revised estimates for 2008-09 at Rs.6,27,949 crore was lower by Rs.59,766 crore (8.7 per cent) than the budget estimates and constituted 11.6 per cent of GDP. The collections under all the major taxes declined significantly from the budgeted level. Only the recently introduced taxes such as service tax, banking cash transaction tax, fringe benefit tax, constituting a small proportion of the gross taxes, were higher than the budgeted level. Consequently, the net tax revenue [gross tax revenue less States’ share in Central taxes and amount transferred to National Calamity Contingency Fund (NCCF)] was 8.1 per cent lower than the budgeted amount. Non-tax revenue, however, was higher by 0.4 per cent than the budget estimates due to increase in ‘other non-tax revenue’ component (consisting of economic services, social services, etc) by 10.0 per cent. Other major components viz., dividends and profits and interest receipts, however, declined by Rs.3,468 crore and Rs.99 crore, respectively. Reflecting this, the revenue receipts (net) of the Centre in the revised estimated for 2008-09 at Rs.5,62,173 crore fell short of the budgeted level by 6.8 per cent.
Table 2: Major Fiscal Indicators- 2008-09(RE) versus 2008-09(BE) |
(Rupees crore) |
Item |
2008-09 (BE) |
2008-09(RE) |
Variation (3 over 2) |
1 |
2 |
3 |
4 |
5 |
1. |
Revenue Deficit (3-2) |
55,184 |
2,41,273 |
1,86,089 |
337.2 |
2. |
Revenue Receipts |
6,02,935 |
5,62,173 |
-40,762 |
6.8 |
|
i. Tax Revenue |
5,07,150 |
4,65,970 |
-41,180 |
-8.1 |
|
ii. Non-Tax Revenue |
95,785 |
96,203 |
418 |
0.4 |
3. |
Revenue Expenditure |
6,58,119 |
8,03,446 |
1,45,327 |
22.1 |
|
Of which: |
|
|
|
|
|
i. Subsidies |
71,431 |
1,29,243 |
57,812 |
80.9 |
|
ii. Interest Payments |
1,90,807 |
1,92,694 |
1,887 |
1.0 |
4. |
Gross Fiscal Deficit (1-5+6+7) |
1,33,287 |
3,26,515 |
1,93,228 |
145 |
5. |
Other non-debt capital receipts |
10,165 |
2,567 |
-7,598 |
-74.7 |
6. |
Capital Outlay (i+ii) |
84,522 |
83,305 |
-1,217 |
-1.4 |
|
i. Defence |
48,007 |
41,000 |
-7,007 |
-14.6 |
|
ii. Non-defence capital outlay |
36,515 |
42,305 |
5,790 |
15.9 |
7. |
Net Lending (i-ii) |
3,746 |
4,504 |
758 |
20.2 |
|
i. Loans |
8,243 |
14,202 |
5,959 |
72.3 |
|
ii.Recoveries |
4,497 |
9,698 |
5,201 |
115.7 |
8. |
Gross Primary Deficit (4-3(ii)) |
-57,520 |
1,33,821 |
1,91,341 |
-332.7 |
III.3 Non-Debt Capital Receipts
The non-debt capital receipts comprising recoveries of loans and advances and other miscellaneous receipts including disinvestment receipts declined by Rs.2,397 crore (or by 16.3 per cent) in the 2008-09 (RE). This decline was due to non-realisation of the budgeted disinvestment proceeds by the extent of Rs.7,598 crore, despite the recoveries of loans and advances more than doubling to Rs.9,698 in 2008-09 (RE).
III.4 Aggregate Expenditure
With the additional expenditure provided under three supplementary demand for grants, the aggregate expenditure in the revised estimates for 2008-09 was significantly higher by Rs.1,50,069 crore (20.0 per cent) than the budget estimates, with rise in revenue expenditure amounting to Rs.1,45,327 crore. The higher revenue expenditure was mainly on account of subsidies and defence in the non-plan component and rural development under plan component. Subsidies in the RE at Rs.1,29,243 crore were higher by 80.9 per cent, primarily on account of increase in fertiliser subsidies. Rise in defence revenue expenditure was on account of implementation of the Sixth Pay Commission award for defence personnel. With regard to capital expenditure, while the defence capital outlay declined by Rs.7,007 crore, non-defence capital outlay increased by Rs.5,790 crore. The net lending also increased by 20.2 per cent with higher loan disbursements more than off-setting the larger loan recoveries.
Table 3: Plan and Non-Plan Expenditure in 2008-09 |
( Rupees crore) |
Item |
2008-09 (BE) |
2008-09(RE) |
Variation (3 over 2) |
|
|
|
Amount |
Per cent |
1 |
2 |
3 |
4 |
5 |
Non-Plan |
|
|
|
|
1. |
Interest Payments |
1,90,807 |
1,92,694 |
1,887 |
1.0 |
2. |
Grants to States |
43,294 |
38,421 |
-4,873 |
-11.3 |
3. |
Interest Subsidies |
2,829 |
4,063 |
1,234 |
43.6 |
4. |
Fertiliser Subsidy |
30,986 |
75,849 |
44,863 |
144.8 |
5. |
Defence Services |
1,05,600 |
1,14,600 |
9,000 |
8.5 |
Total Non-Plan Expenditure |
5,07,498 |
6,17,996 |
1,10,498 |
21.8 |
Plan |
2,43,386 |
2,82,957 |
39,571 |
16.3 |
1. |
Central Plan |
1,79,954 |
2,04,129 |
24,175 |
13.4 |
2. |
Central Assistance for State and UT Plans |
63,432 |
78,828 |
15,396 |
24.3 |
Total Plan Expenditure |
2,43,386 |
2,82,957 |
39,571 |
16.3 |
a) Plan and Non-Plan Expenditure
Expenditure pattern indicates that non-plan and plan expenditure increased by 21.8 per cent and 16.3 per cent, respectively from the budgeted levels. Under non-plan expenditure, interest payments, interest subsidies, fertiliser subsidies and defence services increased in the revised estimates over the budgeted level, with fertiliser subsidy alone accounting for 40.6 per cent of the increase in total non-plan expenditure. There was, however, a cutback of Rs.4,873 crore (11.3 per cent) in grants to States from the budgeted level (Table 3). Under plan expenditure, allocation for Central Plan was higher by 13.4 per cent due to substantial hike in rural development. Central assistance for State and UT plans was also higher by 24.3 per cent in the RE mainly due to hike in the allocation for externally aided projects, irrigation and Jawaharlal Nehru National Urban Renewal Mission (JNNURM).
III.5 Financing Pattern of Gross Fiscal Deficit
In view of the increase in GFD by 2.4 times in the revised estimates of 2008-09 over the budgeted level, the net market borrowings (dated securities and 364 days Treasury Bills) was hiked by 2.7 times of the budgeted level to Rs.2,66,539 crore. Net market borrowings would finance 81.6 per cent of the GFD as against 74.3 per cent in the budget estimates (Table 4). There would also be substantial increase in the drawdown of cash balances to finance 9.2 per cent of the GFD as against 5.4 per cent in the budget estimates. Contribution from National Small Savings Fund would also be higher at 3.4 per cent as against negligible amount envisaged in the budget estimates. On the other hand, financing from external assistance in the revised estimates was lower at 2.9 per cent of GFD than the budgeted level of 8.2 per cent. In the public account, deposits and advances would finance 3.9 per cent of GFD against the budgeted level of 6.5 per cent.
Table 4: Financing Pattern of Gross Fiscal Deficit in 2008-09 |
(Rupees crore) |
Item |
2008-09 |
2008-09 |
(BE) |
(RE) |
1 |
2 |
3 |
Gross Fiscal Deficit |
1,33,287 |
3,26,515 |
|
(100) |
(100) |
Financed by |
|
|
Market Borrowings (Market loans |
99,000 |
2,66,539 |
and 364 day T-bills) |
(74.3) |
(81.6) |
Securities against small savings |
9,873 |
1,323 |
|
(7.4) |
(0.4) |
External Assistance |
10,989 |
9,603 |
|
(8.2) |
(2.9) |
State provident fund |
4,800 |
4,800 |
|
(3.6) |
(1.5) |
NSSF |
53 |
11,206 |
|
(0.0) |
(3.4) |
Reserve Funds |
-972 |
-16,808 |
|
-(0.7) |
-(5.1) |
Deposit and Advances |
8,629 |
12,788 |
|
(6.5) |
(3.9) |
Postal Insurance and Life |
4,123 |
2,594 |
Annuity Funds |
(3.1) |
(0.8) |
Draw down of Cash Balances |
7,225 |
29,984 |
|
(5.4) |
(9.2) |
Others |
-10,433 |
4,485 |
|
-(7.8) |
(1.4) |
Note: Figures in parenthesis are percentages to GFD. |
IV. Analysis of Budget Estimates 2009-102
The Union Budget for 2009-10 was presented against the backdrop of persisting global economic slowdown that continues to impact the Indian economy adversely, and the need to revive the growth at the earliest possible while recognising the medium-term concerns. The buoyancy in revenue collection has significantly fallen not only due to the economic slowdown but also due to tax reduction measures undertaken by the Government to provide stimulus to growth. At the same time, enhancement of expenditure to boost the aggregate demand in the economy has been sustained. In this context, there has been an increase in allocation for social sector to create employment and public assets and infrastructure development in both rural and urban areas. With the moderation in economic growth expected to continue well into the fiscal 2009-10, the Budget has envisaged relaxation of the FRBM targets during 2009-10 for continuing with fiscal stimulus measures. IV.1 Deficit Indicators
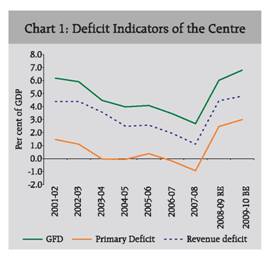
The Union Interim Budget for 2009-10 has indicated about the sustaining of fiscal stimulus during 2009-10 to provide boost to demand and revive the economy from the slowdown. Consequently, the key deficit indicators, viz., RD, GFD and PD, as per cent of GDP, are budgeted at 4.8 per cent, 6.8 per cent and 3.0 per cent in 2009-10, higher than 4.4 per cent, 6.0 per cent and 2.5 per cent, respectively, during 2008-09 (RE) (Chart 1).
The RD is budgeted to increase by Rs.41,462 crore in 2009-10 due to higher increase in revenue expenditure on account of interest payments, defence and non-plan grants to States and UTs than the increase in revenue receipts arising from non-tax revenue. With capital outlay also increasing substantially, GFD is budgeted to increase by 22.8 per cent to Rs.74,481 crore (Table 5).
Table 5: Major Fiscal Indicators- 2009-10(BE) versus 2008-09 (RE) |
(Rupees crore) |
Item |
2008-09 (RE) |
2009-10(BE) |
Variation (3 over 2) |
Amount |
Per cent |
1 |
2 |
3 |
4 |
5 |
1. |
Revenue Deficit (3-2) |
2,41,273 |
2,82,735 |
41,462 |
17.2 |
2. |
Revenue Receipts (i+ii) |
5,62,173 |
6,14,497 |
52,324 |
9.3 |
|
i. Tax Revenue |
4,65,970 |
4,74,218 |
8,248 |
1.8 |
|
ii. Non-Tax Revenue |
96,203 |
1,40,279 |
44076 |
45.8 |
3. |
Revenue Expenditure |
8,03,446 |
8,97,232 |
93786 |
11.7 |
|
of which: |
|
|
|
|
|
i. Subsidies |
1,29,243 |
1,11,276 |
-17,967 |
-13.9 |
|
ii. Interest Payments |
1,92,694 |
2,25,511 |
32,817 |
17 |
4. |
Gross Fiscal Deficit (1+6+7-5) |
3,26,515 |
4,00,996 |
74,481 |
22.8 |
5. |
Other non-debt capital receipts |
2,567 |
1,120 |
-1,447 |
-56.4 |
6. |
Capital Outlay (i+ii) |
83,305 |
1,11,267 |
27,962 |
33.6 |
|
i. Defence |
41,000 |
54,824 |
13,824 |
33.7 |
|
ii. Non-defence capital outlay |
42,305 |
56,443 |
14,138 |
33.4 |
7. |
Net lending |
4,504 |
8,114 |
3,610 |
80.2 |
|
i. Loans |
14,202 |
1,23,39 |
-1,863 |
-13.1 |
|
ii. Recoveries |
9,698 |
4,225 |
-5,473 |
-56.4 |
8. |
Gross Primary Deficit (4-3(ii)) |
1,33,821 |
1,75,485 |
41,664 |
31.1 |
The deterioration in deficit indicators has been associated with a distinct deterioration in the quality indicator, i.e., sharp rise in the RD to GFD ratio, indicating pre-emption of resources from borrowings for current consumption. This ratio, which fell continuously from 79.7 per cent in 2003-04 to 41.4 per cent in 2007-08, rose to 73.9 per cent in 2008-09 and is estimated at 70.5 per cent in 2009-10, a level that prevailed in 2001-02 (Chart 2).
IV.2 Revenue Receipts
The continued economic slowdown and moderated rates of indirect taxes would limit the mobilisation of revenue by the Central Government during 2009-10. Though the revenue receipts during 2009-10 are budgeted to increase by 9.3 per cent, improving from 3.7 per cent growth recorded in 2008-09 (RE), gross tax revenue would increase by 2.1 per cent only, decelerating from 5.9 per cent in 2008-09 (RE). Non-tax revenue, however, is expected to grow sharply by 45.8 per cent due to expected receipts from the auction of third-generation (3G) radio spectrum, as against the decline of 6.0 per cent in 2008-09 (RE). The net tax revenue [gross tax revenue less States’ share in Central taxes and amount transferred to National Calamity Contingency Fund (NCCF)] is budgeted to increase by 1.8 per cent over the preceding year.
 |
a) Tax Revenue
The gross tax collections, relative to GDP, are budgeted to decline to 10.9 per cent during 2009-10 from 11.6 per cent in 2008-09 (RE). Tax-GDP ratio was moving up steadily from 2001-02 to a peak level of 12.6 per cent in 2007-08. Corporation tax collections are budgeted to increase by 15.6 per cent in 2009-10 compared to 15.1 per cent in 2008-09. The growth in personal income tax, however, is estimated to decline by 1.1 per cent from 5.2 per cent growth in 2008-09 (RE). Collection of indirect taxes would decline with custom duty and union excise duty expected to decline by 9.3 per cent and 1.7 per cent, respectively, during 2009-10. With the proposed abolition of fringe benefit tax (FBT), there would be no collection under this tax. Consequently, the buoyancies (percentage change in tax revenue as a ratio to percentage change in GDP) of major taxes in 2009-10, are budgeted not only to decline, but turn negative in most of them, barring that of corporation tax, which would see some improvement. Tax buoyancies during 2009-10 would thus be far lower than the average recorded during 2004-05 to 2007-08.
b) Non-Tax Revenue
Non-tax revenues (NTR) are budgeted to increase sharply to Rs.1,40,279 crore (45.8 per cent) in 2009-10 from Rs.96,203 crore in 2008-09, reflecting higher revenues from ‘other’ non-tax revenue, which is estimated to grow by 101.8 per cent as a result of expected receipts from the auction of third-generation (3G) radio spectrum. The receipts from dividends and profits, which are other major components of NTR, are also expected to increase to Rs.49,750 crore from Rs.39,736 crore in 2008-09 (RE). Interest receipts are estimated at Rs.19,174 crore as compared with Rs.19,036 crore in 2008-09(RE).
IV.3 Non-Debt Capital Receipts
The recoveries of loans and advances from the State Governments and CPSUs are estimated to decline by 56.4 per cent to Rs.4,225 crore in 2009-10 (BE) from Rs.9,698 crore in 2008-09 (RE). Disinvestment proceeds are also budgeted to decline during 2009-10 to Rs.1,120 crore from Rs.2,567 crore in 2008-09 (RE).
IV.4 Aggregate Expenditure
The Government has envisaged moderating the growth of aggregate expenditure during 2009-10 to 13.3 per cent, as against the sharp rise of 33.1 per cent during 2008-09. This lower growth in aggregate expenditure would mainly emanate from revenue expenditure which is budgeted to grow lower by 11.7 per cent compared to 35.2 per cent growth in 2008-09 (RE). Containment of subsidies, in particular fertiliser subsidy, would be an important contributing factor to the slower growth in revenue expenditure during 2009-10 (Table 6). Consequently, the total subsidies are budgeted to decline by 13.9 per cent in 2009-10 (BE) as against the sharp growth of 82.2 per cent in 2008-09 (RE). Subsidies would account for 1.9 per cent of GDP during 2009-10 compared to 2.4 per cent in the previous year.
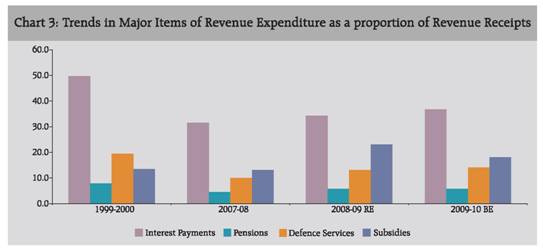
With the rise in fiscal deficit, interest payments during 2009-10 at Rs.2,25,511 crore are estimated to show higher increase of Rs.32,817 crore (17.0 per cent) from Rs.21,664 crore (12.7 per cent) in 2008-09 (RE). Defence expenditure is budgeted to increase substantially by 23.7 per cent due to the implementation of Sixth Central Pay Commission recommendations. The ratios of interest payments and defence to revenue receipts would increase markedly, while that of subsidies would decline during 2009-10 (Chart 3).
Table 6: Major Subsidies |
(Rupees crore) |
Items |
2007-08 |
2008-09
(RE) |
2009-10
(BE) |
1 |
2 |
3 |
4 |
Total Subsidies |
70,926 |
1,29,243 |
1,11,276 |
of which: |
(1.5) |
(2.4) |
(1.9) |
i. Food |
31,328 |
43,627 |
52,490 |
|
(0.7) |
(0.8) |
(0.9) |
ii. Fertiliser |
32,490 |
75,849 |
49,980 |
|
(0.7) |
(1.4) |
(0.9) |
iii. Petroleum |
2,820 |
2,877 |
3,109 |
|
(0.1) |
(0.1) |
(0.1) |
iv. Interest subsidy |
2,311 |
4,063 |
2,601 |
|
(0.0) |
(0.1) |
(0.0) |
v. Other subsidies |
1,977 |
2,827 |
3,096 |
|
(0.0) |
(0.1) |
(0.1) |
Note: Figures in brackets are percentages to GDP. |
The Budget has envisaged stepping up capital expenditure further by 26.8 per cent during 2009-10 from 17.9 per cent increase in 2008-09 (RE). The capital outlay is budgeted to increase by Rs.27,962 crore (33.6 per cent) as against a decline of Rs.23,635 crore (22.1 per cent) in 2008-09. Both the defence and non-defence capital outlay are estimated to increase by Rs.13,824 crore and Rs.14,138 crore, respectively. The defence capital outlay is budgeted to be the largest non-plan capital expenditure.
a) Plan and Non-Plan Expenditure
The expenditure pattern shows that there would be significant moderation in the growth of both non-plan and plan components during 2009-10. The increase in the non-plan expenditures would mainly arise due to interest payments, defence and grants to states and UTs. The increase in interest payments would reflect substantial hike in Government borrowings and special securities issued to Oil Marketing Companies and Food Corporation of India during 2008-09. Sizeable rise in budgeted non-plan expenditure in defence services would arise on account of enhanced provision for pay and allowances, maintenance expenditure and for modernisation of defence services. The budget has also proposed to provide higher non-plan grants t o States and UTs to compensate for the revenue loss incurred on account of phasing out of Central Sales Tax and introduction of Value Added Tax. With regard to plan expenditure, the increase would mainly come about in the central plan component (Table 7). The increase in plan expenditure is mainly accounted for by enhanced allocation to the social sector and urban and rural infrastructure. Most of this additional plan expenditure will go to the schemes like NREGS, PMGSY, RGGVY, NRHM, AIBP, JNNURM, RKVY and TUFS.
Table 7: Plan and Non-Plan Expenditure in 2009-10 |
(Rupees crore) |
Item |
2008-09 (RE) |
2009-10 (BE) |
Amount |
(Per cent) |
1 |
2 |
3 |
4 |
5 |
Interest Payments |
1,92,694 |
2,25,511 |
32,817 |
17.0 |
Food Subsidy |
43,627 |
52,490 |
8,863 |
20.3 |
Interest Subsidies |
4,063 |
2,601 |
-1,462 |
-36.0 |
Police |
20,711 |
25,390 |
4,679 |
22.6 |
Agriculture and allied services |
5,891 |
2,438 |
-3,453 |
-58.6 |
Pensions |
32,690 |
34,980 |
2,290 |
7.0 |
Defence Expenditure |
1,14,600 |
1,41,703 |
27,103 |
23.7 |
Grants to States and UTs |
38,421 |
48,570 |
10,149 |
26.4 |
Other Communication Services |
1,676 |
5,305 |
3,629 |
216.5 |
Capital Outlay |
13,694 |
21,056 |
7,362 |
53.8 |
Other non-plan expenditure |
1,49,929 |
1,35,645 |
-14,284 |
-9.5 |
Total Non-Plan |
6,17,996 |
6,95,689 |
77,693 |
12.6 |
Central Plan |
2,04,129 |
2,39,840 |
35,711 |
17.5 |
Central Assistance for State and |
78,828 |
85,309 |
6,481 |
8.2 |
UT Plans |
|
|
|
|
Total Plan |
2,82,957 |
3,25,149 |
42,192 |
14.9 |
IV.5 Financing of Gross Fiscal Deficit
In contrast to earlier years, the financing pattern of GFD reveals that the Government has envisaged financing almost the entire amount of the deficit during 2009-10 through market borrowings. Net market borrowings would finance 99.2 per cent of the GFD in 2009-10 as against 81.6 per cent in 2008-09 (RE). No drawdown of cash balances has been envisaged during 2009-10, which financed 9.2 per cent of GFD in 2008-09 (RE). External borrowings and securities against small savings would finance 4.0 per cent and 3.3 per cent of GFD in 2009-10, as against 2.9 per cent and 0.4 per cent in 2008-09 (RE), respectively (Table 8).
IV.6 Sectoral Allocation of Expenditure
The sectoral allocation of expenditure under developmental heads like health and education has been increased, while the share of subsidies, agriculture and rural development as a percentage of total expenditure has declined (Table 9).
IV.7 Devolution and Transfer of Resources to States and Union Territories
The devolution pattern of resources to the State Governments and Union Territories shows that net resource transfer would increase by 7.0 per cent to Rs.3,13,751 crore during 2009-10. With the expected slowdown in the gross tax collection, the taxes transferred to the States and Union Territories would increase by only 2.6 per cent to Rs.1,64,361 crore. Grants would increase by 14.3 per cent to Rs.1,46,337 crore, with the non-plan and plan components rising by 26.4 per cent and 9.1 per cent, respectively (Table 10).
Table 8: Financing Pattern of Gross Fiscal Deficit |
(Rupees crore) |
Item |
2008-09
(RE) |
2009-10
(BE) |
1 |
2 |
3 |
Gross Fiscal Deficit |
3,26,515 |
4,00,996 |
Financed by |
|
|
Market Borrowings |
2,66,539 |
3,97,957 |
|
(81.6) |
(99.2) |
Securities issued against |
1,323 |
13,256 |
Small Savings |
(0.4) |
(3.3) |
External Assistance |
9,603 |
16,047 |
|
(2.9) |
(4.0) |
State Provident Fund |
4,800 |
5,000 |
|
(1.5) |
(1.2) |
NSSF |
11,206 |
-103 |
|
(3.4) |
(0.0) |
Reserve Funds |
-16,808 |
-8,428 |
|
-(5.1) |
-(2.1) |
Deposit and Advances |
12,788 |
9,026 |
|
(3.9) |
(2.3) |
Postal Insurance and |
2,594 |
2,672 |
Life Annuity Funds |
(0.8) |
(0.7) |
Draw down of Cash Balances |
29,984 |
0 |
|
(9.2) |
(0.0) |
Others |
4,486 |
-34,431 |
|
(1.4) |
-(8.6) |
Note: Figures in parenthesis are percentages to GFD. |
Table 9: Expenditure on Select Development Heads |
(Rupees crore) |
Item |
2008-09
(RE) |
2009-10
(BE) |
1 |
2 |
3 |
Subsidies |
1,29,243 |
1,11,276 |
|
(14.3) |
(10.9) |
Agriculture |
1,23,038 |
1,07,441 |
|
(13.7) |
(10.5) |
Education |
34,429 |
42,338 |
|
(3.8) |
(4.1) |
Health, family welfare |
16,277 |
22,733 |
and sanitation |
(1.8) |
(2.2) |
Rural Development |
40,799 |
43,554 |
|
(4.5) |
(4.3) |
Irrigation |
579 |
664 |
|
(0.1) |
(0.1) |
Note: Figures in the parenthesis are percentages to total expenditure. |
IV.8 Eleventh Plan Projections vis-avis the Budget Estimates for 2009-10
The projections indicated in the Approach Paper to the Eleventh Plan for the major fiscal indicators vis-a-vis the 2009-10 (BE) are set out in Table 12. It is observed that the total expenditure would substantially exceed the Eleventh Plan projections for 2009-10, primarily due to non-plan expenditure. Though the plan expenditure would also be higher than the projected, it would be solely due to the revenue component as capital component would be lower than the projected. Thus, the large increase in GFD in 2009-10 from the projection in the Eleventh Plan would follow from non-plan expenditure and the revenue component of plan expenditure (Table 11).
Table 10: Resource Transfer to States and Union Territories |
(Amount in Rupees crore) |
Tax |
2008-09 (RE) |
2009-10 (BE) |
Variation
(BE over RE)
(Per cent) |
1 |
2 |
3 |
4 |
States and UTs Share of Taxes and Duties |
1,60,179 |
1,64,361 |
2.6 |
Grants |
1,28,072 |
1,46,337 |
14.3 |
Non-Plan |
38,421 |
48,570 |
26.4 |
Plan |
89,651 |
97,767 |
9.1 |
Loans |
7,118 |
5,714 |
-19.7 |
Non-Plan |
89 |
89 |
0.0 |
Plan |
7,029 |
5,625 |
-20.0 |
Recovery of Loan |
|
|
|
and Advances |
2,008 |
2,661 |
32.5 |
Net Resource |
|
|
|
Transfers |
2,93,361 |
3,13,751 |
7.0 |
Table 11: Eleventh Plan Projections vis-a-vis the Budget Estimates |
(As per cent to GDP) |
Item |
2009-10 |
Eleventh
Plan Projections |
Budget Estimates |
1 |
2 |
3 |
Centre |
|
|
1. Gross Budgetary Support |
|
|
to Plan |
4.97 |
5.55 |
of which |
|
|
(i) Plan revenue |
|
|
Expenditure |
2.87 |
4.75 |
2. Total Non-Plan |
8.86 |
11.88 |
of which |
|
|
(i) Interest Payments |
2.98 |
3.85 |
(ii) Defence |
2.30 |
2.42 |
(iii) Non-Plan grants |
|
|
to States & UTs |
0.62 |
0.83 |
(iv) Subsidies |
0.96 |
1.90 |
3. Total Expenditure |
13.83 |
17.43 |
4. Gross tax revenue |
12.18 |
10.95 |
less: Share of States |
3.32 |
2.81 |
5. Net Tax to Centre |
8.86 |
8.10 |
6. Non-tax Revenue |
1.76 |
2.40 |
7. Total Revenue Receipts |
10.62 |
10.49 |
8. Gross Fiscal Deficit |
3.00 |
6.85 |
9. Revenue Deficit |
0.00 |
4.83 |
V. ASSESSMENT OF THE UNION BUDGET 2009-10
The stance of Union Budget 2009-10 guided by the objectives of keeping the economy on the higher growth trajectory. Consequently, the Government has continued with the policy of increasing public expenditure to boost demand and create infrastructure. It may be noted that without the positive impact of the three fiscal stimulus measures on the economy, GDP growth of 6.7 per cent in India during 2008-09, the second fastest in the World, may not have been achieved. At the same time, it is also important to note that these fiscal stimulus measures undertaken by Government have led to substantial deviation from the fiscal consolidation path mandated under the FRBM Act during 2008-09 and 2009-10. This widening of deficit raises debt sustainability concerns and pre-emption of Government revenue by interest payments in the medium to long-term term. The debt to GDP ratio which had fallen continuously during the FRBM period up to 2007-08 has reversed the trend during 2008-09 and 2009-10. The interest payments to revenue receipts also increased from 31.6 per cent in 2007-08 to 36.7 per cent in 2009-10 (BE). Therefore, there is a need to revert back to the path of fiscal consolidation with emphasis on structural fiscal reforms and prudent fiscal management at the earliest.
V.1 Fiscal Correction and Consolidation
The medium-term fiscal policy statement has placed the rolling targets of major fiscal indicators under FRBM for 2010-11 and 2011-12 at significantly lower levels than in 2008-09 (RE) and 2009-10 (BE). Though these lower deficits may indicate intentions of the Central Government to revert back to the path of fiscal consolidation, the deficit targets would continue to remain significantly higher than those envisaged in FRBMA (Table 12).
Thus, bringing back the key deficit indicators to the level of 2007-08 in the medium-term could be a challenging task. In this context, it may be indicated that the Thirteenth Finance Commission through an additional Terms of Reference was mandated to review the roadmap for fiscal adjustment and suggest a suitably revised roadmap to maintain the gains of fiscal consolidation through 2010 to 2015, particularly keeping in view the need to bring in the liabilities of the Central Government on account of oil, food and fertiliser bonds into the fiscal accounting, and the impact of various other obligations of the Central Government on the deficit targets.
It is imperative that the Government undertake measures to improve the revenue buoyancy once again, which has fallen sharply during the last two years. The tax-GDP ratio had significantly improved from 9.2 per cent in 2003-04 to 12.6 per cent in 2007-08. This has been achieved through rationalisation of the tax structure (moderate levels and a few rates), widening of the tax base, and reduction in compliance costs through improvement in tax administration. The extensive adoption of information technology solutions and re-engineering of business processes has also fostered a less intrusive tax system and encouraged voluntary compliance. These measures have resulted in increased buoyancy in tax revenues till 2007-08 and helped in fiscal consolidation (Table 13).
Table 12: Rolling Targets under FRBM (Per cent to GDP) |
Item |
Revised
Estimates
2008-09 |
Budget
Estimates
2009-10 |
Target for |
|
|
|
2010-11 |
2011-12 |
1 |
2 |
3 |
4 |
5 |
Revenue Deficit |
4.4 |
4.8 |
3.0 |
1.5 |
Gross Fiscal Deficit |
6.0 |
6.8 |
5.5 |
4.0 |
Gross Tax Revenue |
11.6 |
10.9 |
11.9 |
12.4 |
Total outstanding liabilities at end of the year |
59.6 |
61.4 |
60.1 |
57.2 |
Notes: 1. "Total outstanding liabilities" include external public debt at current exchange rates.
2. For projections, constant exchange rates have been assumed. Targets for 2010-11 and 2011-12 will be revisited after the implementation of the 13th Finance Commission recommendations from 2010-11. |
There are several factors, which, however, would facilitate fiscal consolidation process in the medium-term. They include: (a) The Sixth Pay Commission arrears would have been paid out in 2009-10 (60 per cent of the total) with no further liability in 2010-11; (b) most of the farm loan waiver amounts would be paid out in 2009-10 leaving marginal amounts for the next year; (c) much of the decline in business and corporate tax collections is cyclical and would reverse when growth would revive; (d) the expected introduction of the GST in 2010-11 provides an opportunity for setting indirect tax system on the path to producing a sustained increase in revenues; and (e) the Government could also consider reverting back some of the indirect tax cuts when the growth picks up sufficiently. In this regard, the Government has also emphasised the importance of institutional reforms during 2009-10 in order to bring the fiscal deficit under control.
Table 13: Gross Tax Revenue (Per cent to GDP) |
Year |
Budgeted |
Actual |
1 |
2 |
3 |
2002-03 |
9.6 |
8.8 |
2003-04 |
9.2 |
9.2 |
2004-05 |
10.2 |
9.7 |
2005-06 |
10.5 |
10.2 |
2006-07 |
11.2 |
11.5 |
2007-08 |
11.8 |
12.6 |
2008-09 |
12.7 |
11.6* |
* : Revised Estimates. |
V.2 Inflation
The impact of the fiscal deficit, which increased from 6.0 per cent of GDP in 2008-09 (RE) to 6.8 per cent of GDP, on inflation could take place through two channels: (a) increase in aggregate demand, and (b) expansion in money supply through increase in bank credit to the Government including open market operations by the Reserve Bank. Since the higher fiscal deficit has been aimed at off-setting the deceleration in private consumption and investment demand, there may not be inflationary consequences as long as private demand conditions remain subdued. With ample liquidity in the system, increase appetite for government securities and subdued demand for credit from the private sector, the market would be in a position to absorb the large borrowing programme of the Government. However, the large borrowing programme could create inflationary pressures with the recovery in private sector’s demand for credit and return of surges in capital flows.
VI. CONCLUSION
The Union Budget 2009-2010 has been presented in the backdrop of uncertainty in complete economic revival, and consequently, the need to sustain fiscal stimulus measures. Thus, the emphasis was to stimulate the economy by increasing expenditure in the social sector such as education, health, rural employment and investment in infrastructure to boost the aggregate demand, generate income and employment. However, the expansionary fiscal policy has resulted in increase in the revenue and fiscal deficit much above the mandated target mentioned in the FRBM rules. As a result, the debt GDP ratio has increased impairing the debt sustainability conditions.
Though the Government has reiterated its commitment to fiscal consolidation at the earliest, the level of fiscal expansion undertaken and the large Government borrowing to finance the deficit may not be sustainable in the long run. Thus, attaining medium-term sustainability of the finances of the Government remains crucial. The medium-term fiscal policy statement has set the rolling targets of major fiscal indicators under FRBM for 2010-11 and 2011-12 lower than the levels in 2008-09 (RE) and 2009-10 (BE). However, they would remain much higher than the FRBMA targets and the levels achieved during 2007-08. To bring down the deficit indicators to the levels envisaged in FRBMA would require structural fiscal reforms and prudent fiscal management.
In a nutshell, the Union Budget 2009-10 contains elements of continuity and change. The stance of fiscal policy continued to be sustaining high public expenditure programme financed through large market borrowing to boost aggregate demand. The overall tax structure has been retained but many rationalisations have been envisaged. The large market borrowing programme envisaged in the Budget for 2009-10 needs to be managed in a smooth and non-disruptive manner without letting undue upward pressure on interest rates. The fiscal consolidation process has to be resumed at the earliest by initiating institutional reforms encompassing all aspects of budget such as taxes, expenditure, subsidies and disinvestment.
Statement 1: Budget at a Glance |
(Rs. crore) |
Items |
2007-08 (Accounts) |
2008-09
(Budget
Estimates) |
2008-09
(Revised
Estimates) |
2009-10
(Budget
Estimates) |
1 |
2 |
3 |
4 |
5 |
1. |
Revenue Receipts (i+ii) |
5,41,864 |
6,02,935 |
5,62,173 |
6,14,497 |
|
i) |
Tax Revenue (Net to Centre) |
4,39,547 |
5,07,150 |
4,65,970 |
4,74,218 |
|
ii) |
Non-tax Revenue |
1,02,317 |
95,785 |
96,203 |
1,40,279 |
|
|
of which: |
|
|
|
|
|
|
Interest Receipts |
21,060 |
19,135 |
19,036 |
19,174 |
2. |
Capital Receipts |
1,36,498 * |
1,47,949 |
3,38,780 |
4,06,341 |
|
of which: |
|
|
|
|
|
i) |
Market Borrowings |
1,30,600 |
99,000 |
2,66,539 |
3,97,957 |
|
ii) |
Recoveries of Loans |
5,100 |
4,497 |
9,698 |
4,225 |
|
iii) |
Disinvestment of equity in PSUs |
4,486 * |
10,165 |
2,567 |
1,120 |
3. |
Total Receipts (1+2) |
6,78,362 * |
7,50,884 |
9,00,953 |
10,20,838 |
4. |
Revenue Expenditure (i + ii) |
5,94,433 |
6,58,119 |
8,03,446 |
8,97,232 |
|
i) |
Non-Plan |
4,20,861 |
4,48,352 |
5,61,790 |
6,18,834 |
|
ii) |
Plan |
1,73,572 |
2,09,767 |
2,41,656 |
2,78,398 |
5. |
Capital Expenditure (i + ii) |
82,707 # |
92,765 |
97,507 |
1,23,606 |
|
i) |
Non-Plan |
51,197 # |
59,146 |
56,206 |
76,855 |
|
ii) |
Plan |
31,510 |
33,619 |
41,301 |
46,751 |
6. |
Total Non-Plan Expenditure (4i + 5i) |
4,72,058 # |
5,07,498 |
6,17,996 |
6,95,689 |
|
of which: |
|
|
|
|
|
i) |
Interest Payments |
1,71,030 |
1,90,807 |
1,92,694 |
2,25,511 |
|
ii) |
Defence |
91,681 |
1,05,600 |
1,14,600 |
1,41,703 |
|
iii) |
Subsidies |
70,926 |
71,431 |
1,29,243 |
1,11,276 |
7. |
Total Plan Expenditure (4ii + 5ii) |
2,05,082 |
2,43,386 |
2,82,957 |
3,25,149 |
8. |
Total Expenditure (6+7=4+5) |
6,77,140 # |
7,50,884 |
9,00,953 |
10,20,838 |
9. |
Revenue Deficit (4-1) |
52,569 |
55,184 |
2,41,273 |
2,82,735 |
|
|
(1.1) |
(1.0) |
(4.5) |
(4.8) |
10. |
Gross Fiscal Deficit
(8-(1+2ii+2iii)) |
1,25,690 *# |
1,33,287 |
3,26,515 |
4,00,996 |
|
|
(2.7) |
(2.5) |
(6.0) |
(6.8) |
11. |
Gross Primary Deficit (10-6i) |
-45,340 *# |
-57,520 |
1,33,821 |
1,75,485 |
|
|
- (0.9) |
-(1.1) |
(2.5) |
(3.0) |
*: Net of transfer of profit from RBI to the Union Government amounting to Rs.34,309 crore.
# : Net of acquisition cost of RBI’s stake in State Bank of India (SBI) at Rs.35,531 crore.
Notes : 1. Figures in parentheses are percentage to GDP.
2. Capital Receipts are net of repayments.
3. Market borrowings include dated securities and 364 day Treasury Bills.
Source : Budget documents of Government of India, 2009-10. |
Statement 1: Budget at a Glance (Concld.) |
(Rs. crore) |
Items |
Variations |
Col.4 over Col. 3 |
Col.4 over Col. 2 |
Col.5 over Col. 4 |
Amount |
Per cent |
Amount |
Per cent |
Amount |
Per cent |
1 |
6 |
7 |
8 |
9 |
10 |
11 |
1. |
Revenue Receipts (i+ii) |
-40,762 |
-6.8 |
20,309 |
3.7 |
52,324 |
9.3 |
|
i) Tax Revenue (Net to Centre) |
-41,180 |
-8.1 |
26,423 |
6.0 |
8,248 |
1.8 |
|
ii) Non-tax Revenue |
418 |
0.4 |
-6,114 |
-6.0 |
44,076 |
45.8 |
|
of which: |
|
|
|
|
|
|
|
Interest Receipts |
-99 |
-0.5 |
-2,024 |
-9.6 |
138 |
0.7 |
2. |
Capital Receipts |
1,90,831 |
129.0 |
2,02,282 |
148.2 |
67,561 |
19.9 |
|
of which: |
|
|
|
|
|
|
|
i) Market Borrowings |
1,67,539 |
169.2 |
1,35,939 |
104.1 |
1,31,418 |
49.3 |
|
ii) Recoveries of Loans |
5,201 |
115.7 |
4,598 |
90.2 |
-5,473 |
-56.4 |
|
iii) Disinvestment of equity in PSUs |
-7,598 |
-74.7 |
-1,919 |
-42.8 |
-1,447 |
-56.4 |
3. |
Total Receipts (1+2) |
1,50,069 |
20.0 |
2,22,591 |
32.8 |
1,19,885 |
13.3 |
4. |
Revenue Expenditure (i + ii) |
1,45,327 |
22.1 |
2,09,013 |
35.2 |
93,786 |
11.7 |
|
i) Non-Plan |
1,13,438 |
25.3 |
1,40,929 |
33.5 |
57,044 |
10.2 |
|
ii) Plan |
31,889 |
15.2 |
68,084 |
39.2 |
36,742 |
15.2 |
5. |
Capital Expenditure (i + ii) |
4,742 |
5.1 |
14,800 |
17.9 |
26,099 |
26.8 |
|
i) Non-Plan |
-2,940 |
-5.0 |
5,009 |
9.8 |
20,649 |
36.7 |
|
ii) Plan |
7,682 |
22.9 |
9,791 |
31.1 |
5,450 |
13.2 |
6. |
Total Non-Plan Expenditure (4i + 5i) |
1,10,498 |
21.8 |
1,45,938 |
30.9 |
77,693 |
12.6 |
|
of which: |
|
|
|
|
|
|
|
i) Interest Payments |
1,887 |
1.0 |
21,664 |
12.7 |
32,817 |
17.0 |
|
ii) Defence |
9,000 |
8.5 |
22,919 |
25.0 |
27,103 |
23.7 |
|
iii) Subsidies |
57,812 |
80.9 |
58,317 |
82.2 |
-17,967 |
-13.9 |
7. |
Total Plan Expenditure (4ii + 5ii) |
39,571 |
16.3 |
77,875 |
38.0 |
42,192 |
14.9 |
8. |
Total Expenditure (6+7=4+5) |
1,50,069 |
20.0 |
2,23,813 |
33.1 |
119,885 |
13.3 |
9. |
Revenue Deficit (4-1) |
1,86,089 |
337.2 |
1,88,704 |
359.0 |
41,462 |
17.2 |
10. |
Gross Fiscal Deficit
(8-(1+2ii+2iii)) |
1,93,228 |
145.0 |
2,00,825 |
159.8 |
74,481 |
22.8 |
11. |
Gross Primary Deficit (10-6i) |
1,91,341 |
-332.7 |
1,79,161 |
-395.1 |
41,664 |
31.1 |
Statement 2: Transactions on Revenue Account |
(Rs. crore) |
Items |
2007-08 (Accounts) |
2008-09
(Budget
Estimates) |
2008-09
(Revised
Estimates) |
2009-10
(Budget
Estimates) |
1 |
2 |
3 |
4 |
5 |
I. |
Revenue Receipts (A+B) |
5,41,864 |
6,02,935 |
5,62,173 |
6,14,497 |
|
A. |
Tax Revenue(Net to Centre)(a-b-c) |
4,39,547 |
5,07,150 |
4,65,970 |
4,74,218 |
|
|
a) |
Gross Tax Revenue |
5,93,147 |
6,87,715 |
6,27,949 |
6,41,079 |
|
|
|
of which : |
(12.6) |
(12.9) |
(11.6) |
(10.9) |
|
|
|
1. Corporation Tax |
1,92,911 |
2,26,361 |
2,22,000 |
2,56,725 |
|
|
|
2. Personal IncomeTax |
1,02,644 * |
1,20,604 * |
1,08,000 * |
1,06,800 * |
|
|
|
3. Customs Duty |
1,04,119 |
1,18,930 |
1,08,000 |
98,000 |
|
|
|
4. Union Excise Duty |
1,23,425 |
1,37,874 |
1,08,359 |
1,06,477 |
|
|
|
5. Service Tax |
51,301 |
64,460 |
65,000 |
65,000 |
|
|
|
6. Securities Transaction Tax |
8,576 |
9,000 |
5,500 |
6,000 |
|
|
|
7. Banking Cash Transaction Tax |
586 |
550 |
600 |
50 |
|
|
|
8. Taxes of UTs (Net of Assignments |
|
|
|
|
|
|
|
to Local Bodies) |
1,324 |
1451 |
1,590 |
1,602 |
|
|
|
9. Fringe Benefit Tax |
7,098 |
8160 |
8,500 |
0 |
|
|
|
10. Other Taxes and Duties |
1,163 |
325 |
400 |
425 |
|
|
b) |
States’ Share |
1,51,800 |
1,78,765 |
1,60,179 |
1,64,362 |
|
|
c) |
Surcharge transferred to NCCF# |
1,800 |
1,800 |
1,800 |
2,500 |
|
B. |
Non-Tax Revenue |
1,02,317 |
95,785 |
96,203 |
1,40,279 |
|
|
of |
which : |
|
|
|
|
|
|
1. |
Interest Receipts |
21,060 |
19,135 |
19,036 |
19,174 |
|
|
2. |
Dividends and Profits |
34,499 |
43,204 |
39,736 |
49,750 |
|
|
3. |
External Grants |
2,723 |
1,795 |
2,748 |
2,136 |
|
|
4. |
Non-tax Receipts of UTs |
811 |
815 |
749 |
754 |
|
|
5. |
Other Non-Tax Revenue |
43,224 |
30,836 |
33,934 |
68,465 |
II. |
Revenue Expenditure (A+B) |
5,94,433 |
6,58,119 |
8,03,446 |
8,97,232 |
|
A. |
Non-Plan Expenditure |
4,20,861 |
4,48,352 |
5,61,790 |
6,18,834 |
|
|
of |
which : |
|
|
|
|
|
|
1. |
Interest Payments |
1,71,030 |
1,90,807 |
1,92,694 |
2,25,511 |
|
|
2. |
Defence Revenue Expenditure |
54,219 |
57,593 |
73,600 |
86,879 |
|
|
3. |
Subsidies |
70,926 |
71,431 |
1,29,243 |
1,11,276 |
|
|
4. |
Non-Plan Grants to States and UTs |
35,769 |
43,294 |
38,421 |
48,570 |
|
B. |
Plan Expenditure (1+2) |
1,73,572 |
2,09,767 |
2,41,656 |
2,78,398 |
|
|
1. |
Central Plan |
1,19,666 |
1,51,417 |
1,71,633 |
2,00,290 |
|
|
2. |
Central Assistance for State and UT Plans |
53,906 |
58,350 |
70,023 |
78,108 |
III. |
Revenue Deficit (-)/Surplus(+) [ I-II ] |
-52,569 |
-55,184 |
-2,41,273 |
-2,82,735 |
# : NCCF: National Calamity Contingency Fund.
* Excluding Fringe Benefit Tax.
Note : Figures in the parentheses are gross tax revenue as percentage of GDP.
Source: Budget Documents of the Government of India, 2009-10. |
Statement 2: Transactions on Revenue Account (Concld.) |
(Rs. crore) |
Items |
Variations |
Col.4 over Col. 3 |
Col.4 over Col. 2 |
Col.5 over Col. 4 |
Amount |
Per cent |
Amount |
Per cent |
Amount |
Per cent |
1 |
6 |
7 |
8 |
9 |
10 |
11 |
I. |
Revenue Receipts (A+B) |
-40,762 |
-6.8 |
20,309 |
3.7 |
52,324 |
9.3 |
|
A. |
Tax Revenue(Net to Centre)(a-b-c) |
-41,180 |
-8.1 |
26,423 |
6.0 |
8,248 |
1.8 |
|
|
a) |
Gross Tax Revenue |
-59,766 |
-8.7 |
34,802 |
5.9 |
13,130 |
2.1 |
|
|
|
of which : |
|
|
|
|
|
|
|
|
|
1. Corporation Tax |
-4,361 |
-1.9 |
29,089 |
15.1 |
34,725 |
15.6 |
|
|
|
2. Personal IncomeTax |
-12,604 |
-10.5 |
5,356 |
5.2 |
-1,200 |
-1.1 |
|
|
|
3. Customs Duty |
-10,930 |
-9.2 |
3,881 |
3.7 |
-10,000 |
-9.3 |
|
|
|
4. Union Excise Duty |
-29,515 |
-21.4 |
-15,066 |
-12.2 |
-1,882 |
-1.7 |
|
|
|
5. Service Tax |
540 |
0.8 |
13,699 |
26.7 |
0 |
0.0 |
|
|
|
6. Securities Transaction Tax |
-3,500 |
-38.9 |
-3,076 |
-35.9 |
500 |
9.1 |
|
|
|
7. Banking Cash Transaction Tax |
50 |
9.1 |
14 |
2.4 |
-550 |
-91.7 |
|
|
|
8. Taxes of UTs (Net of Assignments |
|
|
|
|
|
|
|
|
|
to Local Bodies) |
139 |
9.6 |
266 |
20.1 |
12 |
0.8 |
|
|
|
9. Fringe Benefit Tax |
340 |
4.2 |
1,402 |
19.8 |
-8,500 |
-100.0 |
|
|
|
10. Other Taxes and Duties |
75 |
23.1 |
-763 |
-65.6 |
25 |
6.3 |
|
b) |
States’ Share |
-18,586 |
-10.4 |
8,379 |
5.5 |
4,183 |
2.6 |
|
c) |
Surcharge transferred to NCCF# |
0 |
0.0 |
0 |
0.0 |
700 |
38.9 |
|
B. |
Non-Tax Revenue |
418 |
0.4 |
-6,114 |
-6.0 |
44,076 |
45.8 |
|
|
of which : |
|
|
|
|
|
|
|
|
1. |
Interest Receipts |
-99 |
-0.5 |
-2,024 |
-9.6 |
138 |
0.7 |
|
|
2. |
Dividends and Profits |
-3,468 |
-8.0 |
5,237 |
15.2 |
10,014 |
25.2 |
|
|
3. |
External Grants |
953 |
53.1 |
25 |
0.9 |
-612 |
-22.3 |
|
|
4. |
Non-tax Receipts of UTs |
-66 |
-8.1 |
-62 |
-7.6 |
5 |
0.7 |
|
|
5. |
Other Non-Tax Revenue |
3,098 |
10.0 |
-9,290 |
-21.5 |
34,531 |
101.8 |
II. |
Revenue Expenditure (A+B) |
1,45,327 |
22.1 |
2,09,013 |
35.2 |
93,786 |
11.7 |
|
A. |
Non-Plan Expenditure |
1,13,438 |
25.3 |
1,40,929 |
33.5 |
57,044 |
10.2 |
|
|
of |
which : |
|
|
|
|
|
|
|
|
1. |
Interest Payments |
1,887 |
1.0 |
21,664 |
12.7 |
32,817 |
17.0 |
|
|
2. |
Defence Revenue Expenditure |
16,007 |
27.8 |
19,381 |
35.7 |
13,279 |
18.0 |
|
|
3. |
Subsidies |
57,812 |
80.9 |
58,317 |
82.2 |
-17,967 |
-13.9 |
|
|
4. |
Non-Plan Grants to States and UTs |
-4,873 |
-11.3 |
2,652 |
7.4 |
10,149 |
26.4 |
|
B. |
Plan Expenditure (1+2) |
31,889 |
15.2 |
68,084 |
39.2 |
36,742 |
15.2 |
|
|
1. |
Central Plan |
20,216 |
13.4 |
51,967 |
43.4 |
28,657 |
16.7 |
|
|
2. |
Central Assistance for State and UT Plans |
11,673 |
20.0 |
16,117 |
29.9 |
8,085 |
11.5 |
III. |
Revenue Deficit (-)/Surplus(+) [ I-II ] |
-1,86,089 |
337.2 |
-1,88,704 |
359.0 |
-41,462 |
17.2 |
Statement 3: Transactions on Capital Account |
(Rs. crore) |
Items |
2007-08 (Accounts) |
2008-09
(Budget
Estimates) |
2008-09
(Revised
Estimates) |
2009-10
(Budget
Estimates) |
1 |
2 |
3 |
4 |
5 |
I. |
Capital Receipts (1 to 10) |
1,36,498 * |
1,47,949 |
3,38,780 |
4,06,341 |
|
1. |
Market Borrowings |
1,30,600 |
99,000 |
2,66,539 |
3,97,957 |
|
2. |
Securities against Small Savings |
-11,302 |
9,873 |
1,323 |
13,256 |
|
3. |
State Provident Funds |
3,897 |
4,800 |
4,800 |
5,000 |
|
4. |
Special Deposits |
0 |
0 |
0 |
0 |
|
5. |
Reserve Funds and Deposits |
-5,634 |
7657 |
-4,020 |
598 |
|
6. |
NSSF |
-174 |
53 |
11,206 |
-103 |
|
7. |
Recovery of Loans and Advances |
5,100 |
4,497 |
9,698 |
4,225 |
|
8. |
Disinvestment of Equity Holding in Public Sector Enterprises |
4,486 * |
10,165 |
2,567 |
1,120 |
|
9. |
External Borrowings |
9,315 |
10,989 |
9,603 |
16,047 |
|
10 |
Others |
210 |
915 |
37,064 |
-31,759 |
II. |
Capital Expenditure (1+2) |
82,707 # |
92,765 |
97,507 |
1,23,606 |
|
1. |
Non Plan Expenditure |
51,197 # |
59,146 |
56,206 |
76,855 |
|
|
of which: |
|
|
|
|
|
|
Defence Capital |
37,462 |
48,007 |
41,000 |
54,824 |
|
2. |
Plan Expenditure (i+ii) |
31,510 # |
33,619 # |
41,301 # |
46,751 |
|
|
i) Central Plan |
23,802 |
28,537 |
32,496 |
39,550 |
|
|
ii) Central Assistance for State |
|
|
|
|
|
|
and UT Plans |
7,708 |
5,082 |
8,805 |
7,201 |
III. |
Capital Surplus(+)/Deficit(-) [I-II] |
+53,791 |
+55,184 |
+2,41,273 |
+2,82,735 |
- : Not Available.
* : Excludes an amount of Rs.34,309 crore on account of transaction relating to transfer of RBI’s stake in SBI to the Government.
# : Net of acquisition cost of RBI’s stake in State Bank of India (SBI) at Rs.35,531 crore.
Notes : 1) Capital Receipts are net of repayments.
2) Market borrowings include dated securities and 364-day Treasury Bills
Source : Budget documents of Government of India, 2009-10. |
Statement 3: Transactions on Capital Account (Concld.) |
(Rs. crore) |
Items |
Variations |
Col.4 over Col. 3 |
Col.4 over Col. 2 |
Col.5 over Col. 4 |
Amount |
Per cent |
Amount |
Per cent |
Amount |
Per cent |
1 |
6 |
7 |
8 |
9 |
10 |
11 |
I. |
Capital Receipts (1 to 10) |
1,90,831 |
129.0 |
2,02,282 |
148.2 |
67,561 |
19.9 |
|
1. |
Market Borrowings |
1,67,539 |
169.2 |
1,35,939 |
104.1 |
1,31,418 |
49.3 |
|
2. |
Securities against Small Savings |
-8,550 |
-86.6 |
12,625 |
-111.7 |
11,933 |
902.0 |
|
3. |
State Provident Funds |
0 |
0.0 |
903 |
23.2 |
200 |
4.2 |
|
4. |
Special Deposits |
- |
- |
- |
- |
- |
- |
|
5. |
Reserve Funds and Deposits |
-11,677 |
-152.5 |
1,614 |
-28.6 |
4,618 |
-114.9 |
|
6. |
NSSF |
11,153 |
21043.4 |
11,380 |
-6540.2 |
-11,309 |
-100.9 |
|
7. |
Recovery of Loans and Advances |
5,201 |
115.7 |
4,598 |
90.2 |
-5,473 |
-56.4 |
|
8. |
Disinvestment of Equity Holding in |
|
|
|
|
|
|
|
|
Public Sector Enterprises |
-7,598 |
-74.7 |
-1,919 |
-42.8 |
-1,447 |
-56.4 |
|
9. |
External Borrowings |
-1,386 |
-12.6 |
288 |
3.1 |
6,444 |
67.1 |
|
10. |
Others |
36,149 |
3950.7 |
36,854 |
17549.5 |
-68,823 |
-185.7 |
II. |
Capital Expenditure (1+2) |
4,742 |
5.1 |
14,800 |
17.9 |
26,099 |
26.8 |
|
1. |
Non Plan Expenditure |
-2,940 |
-5.0 |
5,009 |
9.8 |
20,649 |
36.7 |
|
|
of which: |
|
|
|
|
|
|
|
|
Defence Capital |
-7,007 |
-14.6 |
3,538 |
9.4 |
13,824 |
33.7 |
|
2. |
Plan Expenditure (i+ii) |
7,682 |
22.9 |
9,791 |
31.1 |
5,450 |
13.2 |
|
|
i) Central Plan |
3,959 |
13.9 |
8,694 |
36.5 |
7,054 |
21.7 |
|
|
ii) Central Assistance for State and UT Plans |
3,723 |
73.3 |
1,097 |
14.2 |
-1,604 |
-18.2 |
III. |
Capital Surplus(+)/Deficit(-) [I-II] |
1,86,089 |
337.2 |
1,87,482 |
348.5 |
41,462 |
17.2 |
Statement 4: Financing of Gross Fiscal Deficit of the Central Government |
(Rs. crore) |
Year |
Internal Finance |
External Finance |
Total Finance/
Gross Fiscal
Deficit
(5+6) |
Market Borrowings # |
Other Borrowings @ |
Draw Down
of Cash
Balances * |
Total (2+3+4) |
1 |
2 |
3 |
4 |
5 |
6 |
7 |
1990-91 |
8,001 |
22,103 |
11,347 |
41,451 |
3,181 |
44,632 |
|
(17.9) |
(49.5) |
(25.4) |
(92.9) |
(7.1) |
(100.0) |
1991-92 |
7,510 |
16,539 |
6,855 |
30,904 |
5,421 |
36,325 |
|
(20.7) |
(45.5) |
(18.9) |
(85.1) |
(14.9) |
(100.0) |
1992-93 |
3,676 |
18,866 |
12,312 |
34,854 |
5,319 |
40,173 |
|
(9.2) |
(47.0) |
(30.6) |
(86.8) |
(13.2) |
(100.0) |
1993-94 |
28,928 |
15,295 |
10,960 |
55,183 |
5,074 |
60,257 |
|
(48.0) |
(25.4) |
(18.2) |
(91.6) |
(8.4) |
(100.0) |
1994-95 |
20,326 |
32,834 |
961 |
54,121 |
3,582 |
57,703 |
|
(35.2) |
(56.9) |
(1.7) |
(93.8) |
(6.2) |
(100.0) |
1995-96 |
34,001 |
16,117 |
9,807 |
59,925 |
318 |
60,243 |
|
(56.4) |
(26.8) |
(16.3) |
(99.5) |
(0.5) |
(100.0) |
1996-97 |
19,093 |
31,469 |
13,184 |
63,746 |
2,987 |
66,733 |
|
(28.6) |
(47.2) |
(19.8) |
(95.5) |
(4.5) |
(100.0) |
1997-98 |
32,499 |
56,257 |
-910 |
87,846 |
1,091 |
88,937 |
|
(36.5) |
(63.3) |
-(1.0) |
(98.8) |
(1.2) |
(100.0) |
1998-99 |
68,988 |
42,650 |
-209 |
1,11,429 |
1,920 |
1,13,349 |
|
(60.9) |
(37.6) |
-(0.2) |
(98.3) |
(1.7) |
(100.0) |
1999-2000 |
62,076 |
40,597 |
864 |
1,03,537 |
1,180 |
1,04,717 |
|
(59.3) |
(38.8) |
(0.8) |
(98.9) |
(1.1) |
(100.0) |
2000-01 |
73,431 |
39,077 |
-1,197 |
1,11,311 |
7,505 |
1,18,816 |
|
(61.8) |
(32.9) |
-(1.0) |
(93.7) |
(6.3) |
(100.0) |
2001-02 |
90,812 |
46,038 |
-1,496 |
1,35,354 |
5,601 |
1,40,955 |
|
(64.4) |
(32.7) |
-(1.1) |
(96.0) |
(4.0) |
(100.0) |
2002-03 |
1,04,126 |
50,997 |
1,883 |
1,57,006 |
-11,934 |
1,45,072 |
|
(71.8) |
(35.2) |
(1.3) |
(108.2) |
-(8.2) |
(100.0) |
2003-04 |
88,870 |
51,833 |
-3,942 |
1,36,761 |
-13,488 |
1,23,273 |
|
(72.1) |
(42.0) |
-(3.2) |
(110.9) |
-(10.9) |
(100.0) |
2004-05 |
50,940 & |
68,231 |
-8,130 |
1,11,041 |
14,753 |
1,25,794 |
|
(40.5) |
(54.2) |
-(6.5) |
(88.3) |
(11.7) |
(100.0) |
2005-06 |
1,06,241 & |
53,610 |
-20,888 |
1,38,963 |
7,472 |
1,46,435 |
|
(72.6) |
(36.6) |
-(14.3) |
(94.9) |
(5.1) |
(100.0) |
2006-07 |
1,14,801 & |
14,782 |
4,518 |
1,34,101 |
8,472 |
1,42,573 |
|
(80.5) |
(10.4) |
(3.2) |
(94.1) |
(5.9) |
(100.0) |
2007-08 |
1,30,600 & |
-39,597 |
26,594 |
1,17,597 |
9,315 |
1,26,912 |
|
(102.9) |
-(31.2) |
(21.0) |
(92.7) |
(7.3) |
(100.0) |
2008-09 (RE) |
2,66,539 & |
20,389 |
29,984 |
3,16,912 |
9,603 |
3,26,515 |
|
(81.6) |
(6.2) |
(9.2) |
(97.1) |
(2.9) |
(100.0) |
2009-10 (BE) |
3,97,957 & |
-13,008 |
0 |
3,84,949 |
16,047 |
4,00,996 |
|
(99.2) |
-(3.2) |
(0.0) |
(96.0) |
(4.0) |
(100.0) |
RE : Revised Estimates. BE : Budget Estimates.
# : Includes dated securities and 364-days Treasury Bills.
@ : Other borrowings includes small savings, state provident funds, special deposits, reserve funds, etc. For the years 1999-2000 to 2001-02, small savings and public provident fund are represented by National Savings Fund (NSSF)’s investment in Central Government special securities and hence form part of Centre’s internal debt.
* : Prior to 1997-98, represents variations in 91-day Treasury Bills issued net of changes in cash balances with the Reserve Bank.
& : Exclusive of amount raised under Market Stabilisation Scheme.
Note : Figures in parentheses represent percentages to total finance (gross fiscal deficit).
Source : Central Government Budget Documents. |
Statement 5: Central Plan Outlay by Heads of Development |
(Rs. crore) |
Items |
2008-09
(Budget
Estimates) |
2008-09
(Revised
Estimates) |
2009-10
(Budget
Estimates) |
Variation |
Col. 3 over Col. 2 |
Col. 4 over Col. 3 |
Amount |
Per cent |
Amount |
Per cent |
1 |
2 |
3 |
4 |
5 |
6 |
7 |
8 |
1. |
Agriculture |
10,074 |
9,969 |
10,629 |
-105 |
-1.0 |
660 |
6.6 |
|
|
(2.7) |
(2.6) |
(2.4) |
|
|
|
|
2 . |
Rural Development* |
23,831 |
48,884 |
51,769 |
25,053 |
105.1 |
2,885 |
5.9 |
|
|
(6.3) |
(12.6) |
(11.6) |
|
|
|
|
3 . |
Irrigation and Flood Control |
411 |
367 |
439 |
-44 |
-10.7 |
72 |
19.6 |
|
|
(0.1) |
(0.1) |
(0.1) |
|
|
|
|
4. |
Energy |
93,815 |
98,877 |
115,574 |
5,062 |
5.4 |
16,697 |
16.9 |
|
of which : |
(25.0) |
(25.5) |
(25.8) |
|
|
|
|
|
a) Power |
45,238 |
40,512 |
56,956 |
-4,726 |
-10.4 |
16,444 |
40.6 |
|
|
(12.0) |
(10.4) |
(12.7) |
|
|
|
|
|
b) Petroleum |
42,450 |
53,147 |
53,043 |
10,697 |
25.2 |
-104 |
-0.2 |
|
|
(11.3) |
(13.7) |
(11.8) |
|
|
|
|
5. |
Industry and Minerals |
28,836 |
27,193 |
35,740 |
-1,643 |
-5.7 |
8,547 |
31.4 |
|
|
(7.7) |
(7.0) |
(8.0) |
|
|
|
|
6. |
Transport ** |
84,177 |
78,269 |
94,306 |
-5,908 |
-7.0 |
16,037 |
20.5 |
|
|
(22.4) |
(20.2) |
(21.1) |
|
|
|
|
7. |
Communications |
21,937 |
20,237 |
16,731 |
-1,700 |
-7.7 |
-3,506 |
-17.3 |
|
|
(5.8) |
(5.2) |
(3.7) |
|
|
|
|
8. |
Science, Technology and |
9,283 |
8,547 |
11,207 |
-736 |
-7.9 |
2,660 |
31.1 |
|
Environment |
(2.5) |
(2.2) |
(2.5) |
|
|
|
|
9. |
Social Services # |
95,919 |
89,692 |
1,03,856 |
-6,227 |
-6.5 |
14,164 |
15.8 |
|
|
(25.5) |
(23.1) |
(23.2) |
|
|
|
|
10. |
Others |
7,202 |
6,043 |
7,670 |
-1,159 |
-16.1 |
1,627 |
26.9 |
|
|
(1.9) |
(1.6) |
(1.7) |
|
|
|
|
Total (1 to 10) |
3,75,485 |
3,88,078 |
4,47,921 |
12,593 |
3.4 |
59,843 |
15.4 |
|
|
(100.0) |
(100.0) |
(100.0) |
|
|
|
|
To be financed by : |
|
|
|
|
|
|
|
1. |
Budgetary Support |
1,79,954 |
2,04,128 |
2,39,840 |
24,174 |
13.4 |
35,712 |
17.5 |
|
|
(47.9) |
(52.6) |
(53.5) |
|
|
|
|
2. |
Internal and Extra Budgetary |
1,95,531 |
1,83,950 |
2,08,081 |
-11,581 |
-5.9 |
24,131 |
13.1 |
|
Resources (IEBR) of Public Social Enterprises, etc. |
(52.1) |
(47.4) |
(46.5) |
|
|
|
|
*: Includes provision for rural housing but excludes provision for rural roads.
** : Includes provision for rural roads.
# : Excludes provision for rural housing.
Note : Figures in parentheses represent percentages to total.
Source : Budget documents of Government of India, 2009-10. |
Statement 6: Resources Transferred to States and Union Territory Governments. |
(Rs. crore) |
Items |
2008-09
(Budget
Estimates) |
2008-09
(Revised
Estimates) |
2009-10
(Budget
Estimates) |
Variation |
Col. 3 over Col. 2 |
Col. 4 over Col. 3 |
Amount |
Per cent |
Amount |
Per cent |
1 |
2 |
3 |
4 |
5 |
6 |
7 |
8 |
A. |
State's Share in Central Taxes |
1,78,765 |
1,60,179 |
1,64,361 |
-18,586 |
-10.4 |
4,182 |
2.6 |
|
and Duties |
|
|
|
|
|
|
|
B. |
Total Grants (i+ii) |
1,24,746 |
1,28,072 |
1,46,337 |
3,326 |
2.7 |
18,265 |
14.3 |
|
i) Plan |
81,452 |
89,651 |
97,767 |
8,199 |
10.1 |
8,116 |
9.1 |
|
ii) Non-Plan |
43,294 |
38,421 |
48,570 |
-4,873 |
-11.3 |
10,149 |
26.4 |
C. |
Total Non-Plan Loans * |
89 |
89 |
89 |
0 |
0.0 |
0 |
0.0 |
D. |
Plan Loans (i+ii) |
4,026 |
7,029 |
5,625 |
3,003 |
74.6 |
-1,404 |
-20.0 |
|
i) Central Assistance for States |
3,868 |
7,029 |
5,625 |
3,161 |
81.7 |
-1,404 |
-20.0 |
|
& Union Territory Plans |
|
|
|
|
|
|
|
|
ii) Assistance for Central & Centrally Sponsored Plan Schemes |
158 |
0 |
0 |
-158 |
-100.0 |
0 |
- |
E. |
Gross Transfers (A to D) |
3,07,626 |
2,95,369 |
3,16,412 |
-12,257 |
-4.0 |
21,043 |
7.1 |
F. |
Recovery of Loans & Advances |
2,666 |
2,008 |
2,661 |
-658 |
-24.7 |
653 |
32.5 |
G. |
Net Resources transferred to States & UT Governments (E-F) |
3,04,960 |
2,93,361 |
3,13,751 |
-11,599 |
-3.8 |
20,390 |
7.0 |
* : Net of recovery of short-term loans and advances.
Source : Budget documents of Government of India, 2009-10. |
Statement 7: Interest Payments by the Central Government |
(Rs. crore) |
Item |
1990-91 (Accounts) |
2000-2001 (Accounts) |
2001-2002 (Accounts) |
2002-2003 (Accounts) |
2003-2004 (Accounts) |
2004-05 (Accounts) |
1 |
2 |
3 |
4 |
5 |
6 |
7 |
I. Interest Payments on Internal Debt |
9,814 |
57,605 |
66,035 |
75,176 |
82,620 |
86,380 |
of which : |
|
|
|
|
|
|
i) On Market Loans* |
6,366 |
46,214 |
55,024 |
62,559 |
68,765 |
69,852 |
ii) On Treasury Bills** |
3,392 |
6,395 |
6,453 |
6,151 |
3,542 |
2,165 |
iii) On Marketable securities issued in conversion of special securities |
- |
2,399 |
2,399 |
3,067 |
6,263 |
7,753 |
II. Interest on External debt |
1,834 |
4,413 |
4,285 |
4,252 |
3,139 |
2,808 |
III. Interest on Small Savings Deposits, Certificates and PPF @ |
4,128 |
21,477 |
22,471 |
23,379 |
20,503 |
18,950 |
IV. Interest on State Provident Funds |
885 |
3,879 |
3,794 |
3,913 |
3,733 |
4,425 |
V. Interest on Special Deposits of Non-Government Provident Funds etc. |
3,876 |
12,575 |
14,259 |
13,625 |
13,161 |
12,892 |
VI. Interest on Reserve Funds |
112 |
161 |
129 |
229 |
352 |
541 |
VII. Interest on Other Obligations |
325 |
854 |
567 |
1,214 |
1,400 |
1,592 |
VIII. Others # |
524 |
2,260 |
2,633 |
3,099 |
7,286 |
654 |
Total Interest Payments (I to VIII) |
21,498 |
1,03,224 |
1,14,173 |
1,24,887 |
1,32,194 |
1,30,958 |
* : Represents dated securities.
** : Also includes special securities issued to RBI in conversion of Treasury Bills.
@ : Since 1999-2000, these payments form part of internal debt.
# : Includes inter alia, interest on insurance and pension funds, bonus on field deposits and interest on other
deposits and accounts.
Note : 1. The data are taken from Finance Accounts and Expenditure Budget volume 2 and the aggregate figures for interest payments may not tally for some years with the data produced elsewhere.
2. Since 1999-2000, interest on small savings represent interest on Central Government special securities issued to the NSSF.
Source : Finance Accounts and Budget documents of the Government of India. |
Statement 7: Interest Payments by the Central Government (Concld.) |
(Rs. crore) |
Items |
2005-06 (Accounts) |
2006-07 (Accounts) |
2007-08
(Revised
Estimates) |
2008-09
(Revised
Estimates) |
2009-10
(Budget
Estimates) |
1 |
8 |
9 |
10 |
11 |
12 |
I. |
Interest Payments on |
85,533 |
1,07,294 |
1,46,801 |
1,37,454 |
1,62,162 |
|
Internal Debt |
|
|
|
|
|
|
of which : |
|
|
|
|
|
|
i) On Market Loans* |
66,500 |
84,146 |
96,215 |
1,08,350 |
1,40,697 |
|
ii) On Treasury Bills** |
3,990 |
5,740 |
7,701 |
11,245 |
11,200 |
|
iii) On Marketable securities issued in conversion of special securities |
7,066 |
5,715 |
6,198 |
5,533 |
5,286 |
II. |
Interest on External debt |
3,173 |
3,867 |
3,928 |
4,159 |
4,313 |
III |
Interest on Small Savings Deposits, Certificates and PPF @ |
18,029 |
18,106 |
17,301 |
17,311 |
16,897 |
IV. |
Interest on State Provident Funds |
4,950 |
5,044 |
5,190 |
6,057 |
6,654 |
V. |
Interest on Special Deposits of Non-Government Provident Funds etc. |
12,874 |
12,448 |
12,235 |
11,188 |
11,179 |
VI. |
Interest on Reserve Funds |
717 |
883 |
1225 |
1249 |
752 |
VII |
Interest on Other Obligations |
1,345 |
2,451 |
5,750 |
8,867 |
15,224 |
VII. |
Others # |
3,411 |
179 |
-21400 |
6,409 |
8,330 |
Total Interest Payments (I to VIII) |
1,30,032 |
1,50,272 |
1,71,030 |
1,92,694 |
2,25,511 |
Statement 8: Outstanding Liabilities of Central Government |
(Rs. crore) |
Year
(End March) |
Internal Debt |
Of which:
Market
Loans |
Small Savings,
Deposits &
Provident
Funds |
Other Accounts+ |
Reserve
Fund and
Deposits++ |
Total
Domestic
Liabilities
(2+4+5+6) |
External Liabilities* |
Total
Liabilities
(7+8) |
1 |
2 |
3 |
4 |
5 |
6 |
7 |
8 |
9 |
1990-91 |
1,54,004 |
70,520 |
61,771 |
45,336 |
21,922 |
2,83,033 |
31,525 |
3,14,558 |
|
(27.0) |
(12.4) |
(10.8) |
(8.0) |
(3.8) |
(49.7) |
(5.5) |
(55.2) |
1991-92 |
1,72,750 |
78,023 |
69,682 |
51,818 |
23,464 |
3,17,714 |
36,948 |
3,54,662 |
|
(26.4) |
(11.9) |
(10.6) |
(7.9) |
(3.6) |
(48.5) |
(5.6) |
(54.2) |
1992-93 |
1,99,100 |
81,693 |
77,005 |
59,797 |
23,753 |
3,59,655 |
42,269 |
4,01,924 |
|
(26.5) |
(10.9) |
(10.2) |
(7.9) |
(3.2) |
(47.8) |
(5.6) |
(53.4) |
1993-94 |
2,45,712 |
1,10,611 |
87,877 |
72,477 |
24,556 |
4,30,622 |
47,345 |
4,77,967 |
|
(28.4) |
(12.8) |
(10.1) |
(8.4) |
(2.8) |
(49.7) |
(5.5) |
(55.2) |
1994-95 |
2,66,467 |
1,30,908 |
1,06,435 |
85,787 |
28,993 |
4,87,682 |
50,929 |
5,38,611 |
|
(26.2) |
(12.9) |
(10.5) |
(8.4) |
(2.9) |
(48.0) |
(5.0) |
(53.0) |
1995-96 |
3,07,869 |
1,63,986 |
1,21,425 |
92,010 |
33,680 |
5,54,984 |
51,249 |
6,06,233 |
|
(25.8) |
(13.8) |
(10.2) |
(7.7) |
(2.8) |
(46.6) |
(4.3) |
(50.9) |
1996-97 |
3,44,476 |
1,84,100 |
1,38,955 |
1,00,088 |
37,919 |
6,21,437 |
54,239 |
6,75,676 |
|
(25.0) |
(13.4) |
(10.1) |
(7.3) |
(2.8) |
(45.1) |
(3.9) |
(49.0) |
1997-98 |
3,88,998 |
2,16,598 |
1,67,780 |
1,24,087 |
42,097 |
7,22,962 |
55,332 |
7,78,294 |
|
(25.5) |
(14.2) |
(11.0) |
(8.1) |
(2.8) |
(47.3) |
(3.6) |
(51.0) |
1998-99 |
4,59,696 |
2,85,585 |
2,06,458 |
1,26,802 |
41,595 |
8,34,552 |
57,254 |
8,91,806 |
|
(26.3) |
(16.3) |
(11.8) |
(7.2) |
(2.4) |
(47.7) |
(3.3) |
(50.9) |
1999-2000 |
7,14,254# |
3,55,862 |
66,406 # |
1,34,425 |
47,508 |
9,62,592 |
58,437 |
10,21,029 |
|
(36.6) |
(18.2) |
(3.4) |
(6.9) |
(2.4) |
(49.3) |
(3.0) |
(52.3) |
2000-01 |
8,03,698 |
4,28,793 |
96,344 |
1,44,020 |
58,535 |
11,02,597 |
65,945 |
11,68,542 |
|
(38.2) |
(20.4) |
(4.6) |
(6.9) |
(2.8) |
(52.4) |
(3.1) |
(55.6) |
2001-02 |
9,13,061 |
5,16,517 |
1,44,511 |
1,64,157 |
73,133 |
12,94,862 |
71,546 |
13,66,408 |
|
(40.1) |
(22.7) |
(6.3) |
(7.2) |
(3.2) |
(56.8) |
(3.1) |
(60.0) |
2002-03 |
10,20,689 |
6,19,105 |
2,26,400 |
1,72,374 |
80,126 |
14,99,589 |
59,612 |
15,59,201 |
|
(41.6) |
(25.2) |
(9.2) |
(7.0) |
(3.3) |
(61.1) |
(2.4) |
(63.5) |
2003-04 |
11,41,706 |
7,07,965 |
2,88,378 |
1,68,094 |
92,376 |
16,90,554 |
46,124 |
17,36,678 |
|
(41.4) |
(25.7) |
(10.5) |
(6.1) |
(3.4) |
(61.4) |
(1.7) |
(63.0) |
2004-05 |
12,75,971 & |
7,58,995 |
3,90,477 |
1,74,107 |
92,989 |
19,33,544 |
60,878 |
19,94,422 |
|
(40.5) |
(24.1) |
(12.4) |
(5.5) |
(3.0) |
(61.4) |
(1.9) |
(633) |
2005-06 |
13,89,758 & |
8,62,370 |
4,79,761 |
1,86,921 |
1,09,462 |
21,65,902 |
94,243 |
22,60,145 |
|
(38.7) |
(24.0) |
(13.4) |
(5.2) |
(3.1) |
(60.4) |
(2.6) |
(63.0) |
2006-07 |
15,44,975& |
9,72,801 |
5,39,450 |
2,20,160 |
1,31,295 |
24,35,880 |
1,02,716 |
25,38,596 |
|
(37.4) |
(23.6) |
(13.1) |
(5.3) |
(3.2) |
(59.0) |
(2.5) |
(61.5) |
2007-08 |
18,08,359& |
10,92,468 |
5,53,620 |
2,36,373 |
1,27,043 |
27,25,395 |
1,12,031 |
28,37,425 |
|
(38.3) |
(23.1) |
(11.7) |
(5.0) |
(2.7) |
(57.7) |
(2.4) |
(60.1) |
2008-09 RE |
20,14,451& |
13,58,940 |
5,56,723 |
3,20,508 |
1,22,759 |
30,14,441 |
1,21,634 |
31,36,075 |
|
(37.1) |
(25.0) |
(10.3) |
(5.9) |
(2.3) |
(55.6) |
(2.2) |
(57.8) |
2009-10 BE |
23,56,940& |
17,66,897 |
5,48,467 |
3,29,007 |
1,23,357 |
33,57,771 |
1,37,681 |
34,95,452 |
|
(40.2) |
(30.2) |
(9.4) |
(5.6) |
(2.1) |
(57.3) |
(2.4) |
(59.7) |
RE : Revised Estimates BE : Budget Estimates
+ : Include mainly Postal Insurance and Life Annuity Fund, borrowings under Compulsory Deposits and Income-Tax Annuity
Deposits, Special Deposits of non-Government Provident Funds.
++ : Include Depreciation Reserve Fund of Railways and Dept. of Posts and Dept. of Telecommunications, Deposits of Local
Funds, Departmental and Judicial Deposits, Civil Deposits, etc.
* : At historical exchange-rate.
# : The sharp increase in internal debt and corresponding decline in small savings and provident funds in 1999-2000 is due to conversion of other liabilities(small savings, deposits and public provident funds) amounting to Rs. 1,80,273 crore into Central Government securities. Since 1999-2000, Small Savings represent liabilities under National Small Savings fund(NSSF) excluding NSSF investment in the Central Government's Special Securities.
& : Include amount raised under Market Stabilisation Scheme.
Note : Figures in parentheses are percentages to GDP.
Source : Budget Documents of the Government of India. |
Statement 9: Key Fiscal Indicators |
(Rs. crore) |
Item |
2000-01 (Accounts) |
2001-02 (Accounts) |
2002-03 (Accounts) |
2003-04 (Accounts) |
2004-05 (Accounts) |
2005-06 (Accounts) |
1 |
2 |
3 |
4 |
5 |
6 |
7 |
1 |
Gross Fiscal Deficit |
1,18,816 |
1,40,955 |
1,45,072 |
1,23,273 |
1,25,794 |
1,46,435 |
|
|
(5.7) |
(6.2) |
(5.9) |
(4.5) |
(4.0) |
(4.1) |
2 |
Revenue Deficit |
85,234 |
1,00,162 |
1,07,879 |
98,261 |
78,338 |
92,300 |
|
|
(4.1) |
(4.4) |
(4.4) |
(3.6) |
(2.5) |
(2.6) |
3 |
Net RBI Credit to Centre |
6,705 |
-5,150 |
-28,399 |
-76,065 |
-60,177 |
28,417 |
|
|
(0.3) |
-(0.2) |
-(1.2) |
-(2.8) |
-(1.9) |
(0.8) |
4 |
Gross Primary Deficit |
19,502 |
33,495 |
27,268 |
-815 |
-1,140 |
13,805 |
|
|
(0.9) |
(1.5) |
(1.1) |
(0.0) |
(0.0) |
(0.4) |
5 |
Subsidies |
26,838 |
31,210 |
43,533 |
44,323 |
45,957 |
47,522 |
|
of which : |
(1.3) |
(1.4) |
(1.8) |
(1.6) |
(1.5) |
(1.3) |
|
i) Food |
12,060 |
17,499 |
24,176 |
25,181 |
25,798 |
23,077 |
|
|
(0.6) |
(0.8) |
(1.0) |
(0.9) |
(0.8) |
(0.6) |
|
ii) Fertiliser |
13,800 |
12,595 |
11,015 |
11,847 |
15,879 |
18,460 |
|
|
(0.7) |
(0.6) |
(0.4) |
(0.4) |
(0.5) |
(0.5) |
|
iii) Petroleum |
.. |
.. |
5,225 |
6,351 |
2,956 |
2,683 |
|
|
|
|
(0.2) |
(0.2) |
(0.1) |
(0.1) |
6 |
Defence Expenditure |
49,622 |
54,266 |
55,662 |
60,066 |
75,856 |
80,549 |
|
|
(2.4) |
(2.4) |
(2.3) |
(2.2) |
(2.4) |
(2.2) |
7 |
Interest Payments |
99,314 |
1,07,460 |
1,17,804 |
1,24,088 |
1,26,934 |
1,32,630 |
|
|
(4.7) |
(4.7) |
(4.8) |
(4.5) |
(4.0) |
(3.7) |
8 |
Total Non-Plan Expenditure |
2,42,923 |
2,61,116 |
3,01,778 |
3,48,923 |
3,65,960 |
3,65,100 |
|
|
(11.6) |
(11.5) |
(12.3) |
(12.7) |
(11.6) |
(10.2) |
9 |
Budgetary Support to Public |
10,493 |
13,488 |
15,232 |
15,982 |
17,005 |
17,362 |
|
Enterprises * |
(0.5) |
(0.6) |
(0.6) |
(0.6) |
(0.5) |
(0.5) |
10 |
Interest Receipts |
32,811 |
35,538 |
37,622 |
38,538 |
32,387 |
22,032 |
|
|
(1.6) |
(1.6) |
(1.5) |
(1.4) |
(1.0) |
(0.6) |
11 |
Interest Payments as per cent of revenue receipts |
51.6 |
53.4 |
51.0 |
47.0 |
41.5 |
38.2 |
12 |
Revenue Deficit as per cent of Gross Fiscal Deficit |
71.7 |
71.1 |
74.4 |
79.7 |
62.3 |
63.0 |
13 |
Net RBI Credit to Centre as per cent of Gross Fiscal Deficit |
5.6 |
-3.7 |
-19.6 |
-61.7 |
-47.8 |
19.4 |
.. : Not available / applicable.
* : Figures relate to revised estimates for years prior to 2008-09
Note : Figures in parentheses are per cent to GDP.
Source : Budget documents of the Government of India. |
Statement 9: Key Fiscal Indicators (Concld.) |
(Rs. crore) |
Items |
2006-07 (Accounts) |
2007-08 (Accounts) |
2008-09
(Budget
Estimates) |
2008-09
(Revised
Estimates) |
2009-10
(Budget
Estimates) |
1 |
8 |
9 |
10 |
11 |
12 |
1. |
Gross Fiscal Deficit |
1,42,573 |
1,26,912 |
1,33,287 |
3,26,515 |
4,00,996 |
|
|
(3.5) |
(2.7) |
(2.5) |
(6.1) |
(6.8) |
2. |
Revenue Deficit |
80,222 |
52,569 |
55,184 |
2,41,273 |
2,82,735 |
|
|
(1.9) |
(1.1) |
(1.0) |
(4.5) |
(4.8) |
3. |
Net RBI Credit to Centre |
-3,024 |
-1,16,772 |
.. |
1,76,397 |
.. |
|
|
-(0.1) |
-(2.5) |
.. |
(3.3) |
.. |
4. |
Gross Primary Deficit |
-7,699 |
-44,118 |
-57,520 |
1,33,821 |
1,75,485 |
|
|
-(0.2) |
-(0.9) |
-(1.1) |
(2.5) |
(3.0) |
5. |
Subsidies |
57,125 |
70,926 |
71,431 |
1,29,243 |
1,11,276 |
|
|
(1.4) |
(1.5) |
(1.3) |
(2.4) |
(1.9) |
|
i) Food |
24,014 |
31,328 |
32,667 |
43,627 |
52,490 |
|
|
(0.6) |
(0.7) |
(0.6) |
(0.8) |
(0.9) |
|
ii) Fertiliser |
26,222 |
32,490 |
30,986 |
75,849 |
49,980 |
|
|
(0.6) |
(0.7) |
(0.6) |
(1.4) |
(0.9) |
|
iii) Petroleum |
2,699 |
2,820 |
2,884 |
2,877 |
3,109 |
|
|
(0.1) |
(0.1) |
(0.1) |
(0.1) |
(0.1) |
6. |
Defence Expenditure |
85,510 |
91,681 |
1,05,600 |
1,14,600 |
1,41,703 |
|
|
(2.1) |
(1.9) |
(2.0) |
(2.2) |
(2.4) |
7. |
Interest Payments |
1,50,272 |
1,71,030 |
1,90,807 |
1,92,694 |
2,25,511 |
|
|
(3.6) |
(3.6) |
(3.6) |
(3.6) |
(3.9) |
8. |
Total Non-Plan Expenditure |
4,13,527 |
5,07,589 |
5,07,498 |
6,17,996 |
6,95,689 |
|
|
(10.0) |
(10.7) |
(9.5) |
(11.6) |
(11.9) |
9. |
Budgetary Support to Public |
20,635 |
19,636 |
19,440 |
23,553 |
28,575 |
|
Enterprises * |
(0.5) |
(0.4) |
(0.4) |
(0.4) |
(0.5) |
10. |
Interest Receipts |
22,524 |
21,060 |
19,135 |
19,036 |
19,174 |
|
|
(0.5) |
(0.4) |
(0.4) |
(0.4) |
(0.3) |
11. |
Interest Payments as per cent of revenue receipts |
34.6 |
31.6 |
31.6 |
34.3 |
36.7 |
12. |
Revenue Deficit as per cent of Gross Fiscal Deficit |
56.3 |
41.4 |
41.4 |
73.9 |
70.5 |
13. |
Net RBI Credit to Centre as per cent of Gross Fiscal Deficit |
-2.1 |
-92.0 |
.. |
54.0 |
.. |
Annex I: Detailed Tax Proposals 1. Tax Structure and Rates
A. Personal Income Tax
Personal Income tax rates are proposed to be kept unchanged. However, the basic exemption limit has been revised. Hence the rates of income-tax on total income would be as follows:
Income Slab |
Income Tax Rates |
Up to Rs.1,60,000/- |
Nil |
(Up to Rs.1,90,000/- |
|
for women below the |
|
age of sixty-five years and |
|
Rs. 2,40,000/- for |
|
senior citizens) |
|
Rs.1,60,001/- to |
10 per cent |
Rs. 3,00,000/- |
|
(Rs.1,90,001/- to |
|
Rs. 3,00,000/- for |
|
women below the |
|
age of sixty-five years |
|
and Rs.2,40,001/- to |
|
Rs.3,00,000/- for |
|
senior citizens) |
|
Rs.3,00,001/- to |
20 per cent |
Rs.5,00,000/- |
|
Above Rs.5,00,000/- |
30 per cent |
The surcharge of 10 percent on personal income tax has been abolished.
Education cess of two per cent continued to be levied on the amount of tax payable and one per cent of income-tax only in the cases of persons not resident in India, including companies other than domestic companies. An additional surcharge called the “Education Cess on Income-tax” and “Secondary and Higher Education Cess on income-tax” will continue to be levied for the purposes of the Union at the rate of two per cent and one per cent, respectively.
B. Corporation tax
There was no change in the corporation income tax and it will continue at 30 per cent. The surcharge shall continue to be levied at the rate of 10 per cent in the case of domestic companies and 2.5 per cent in case of foreign companies.
C. Income Tax on Other Institutions
In the case of cooperative societies and local authorities there will be no surcharge as at present.
2. Measures to widen the Income Tax Base
Minimum Alternate Tax
Minimum alternate tax (MAT) is designed to enhance equity in corporate tax system. MAT rate was increased from 10 per cent of book profits to 15 per cent. However, it was proposed to extend the period allowed to carry forward the tax credit under MAT from seven to ten years. These amendments will take effect from 1st April, 2010 and shall accordingly, apply in relation to assessment year 2010-11 and subsequent years.
3. Welfare Measures
Deduction for medical treatment of a dependent suffering from disability
It was proposed to increase the deduction under section 80-DD of the Income Tax Act to an individual or HUF, who is a resident in India, in respect of: (a) Expenditure for the medical treatment (including nursing), training and rehabilitation of a dependant, being a person with disability; and (b) Amount paid to LIC or other insurance in respect of a scheme for the maintenance of a disabled dependant. The present limit for deduction is Rs.50,000 if the dependant is suffering from disability and Rs.75,000 if the dependant is suffering from severe disability. It was proposed to increase the limit for severe disability to Rs.1 lakh. However, the limit for ordinary disability was proposed to be retained at the existing level of Rs.50,000. The above amendment will be made effective from the 1st day of April, 2010 and will accordingly apply in respect of assessment year 2010-11 and subsequent years.
A. Tax benefits for New Pension System
It was proposed to exempt the income of the New Pension System (NPS) Trust from income tax and any dividend paid to this Trust from Dividend Distribution Tax. Similarly, all purchase and sale of equity shares and derivatives by the NPS Trust will also be exempt from the Securities Transaction Tax.
The New Pension System (NPS) has become operational since 1st January, 2004 and is mandatory for all new recruits to the Central Government service from 1st January, 2004. Since then it has been opened up for employees of State Government, private sector and self employed (both organised and unorganized). NPS Trust has been set-up on 27th February, 2008 as per the provisions of the Indian Trust Act, 1882 to manage the assets and funds under the NPS in the interest of the beneficiaries.
With a view to ensure that tax treatment of savings under this system is synchronised with the “exempt-exempt-taxed” (EET) method and that there is no incidence of taxation at the accumulation stage, it is proposed to make the NPS Trust a complete pass-through in so far as taxation is concerned. Therefore, it was proposed to: (i) insert a new clause (44) in section 10 of the Income-tax Act so as to provide that any income received by any person on behalf of the New Pension System Trust established on 27th day of February, 2008 under the provisions of the Indian Trust Act of 1882 shall be exempt from income tax; (ii) amend section 115-O to provide that any dividend paid to the NPS Trust shall be exempt from Dividend Distribution Tax; (iii) amend Chapter VII of Finance (No.2) Act, 2004 to provide that all purchases and sales of equity and derivatives by the NPS Trust will also be exempt from the Securities Transaction Tax; and (iv) amend section 197A to provide that the NPS Trust shall receive all income without any tax deducted at source.
The tax benefit under section 80CCD of the Income-tax Act, 1961 was hitherto available to “employees” only. However, the NPS now has been extended also to “self-employed”. Therefore, it is proposed to amend sub-section (1) of section 80CCD so as to extend the tax benefit there under also to “self-employed” individuals. It is also proposed to amend the Explanation to the said section to provide that for the purposes of the said section the assessee shall be deemed not to have received any amount in the previous year if such amount is used for purchasing an annuity plan in the same previous year. These amendments will take effect retrospectively from 1st April, 2009 and will, accordingly, apply in relation to assessment year 2009-2010 and subsequent years.
B. Measures to Promote Scientific Research and Development
Weighted deduction for in-house research and development
In order to incentivise the corporate sector to undertake research and development (R&D) work, it has been proposed to extend the scope of the current provision of weighted deduction of 150 per cent on expenditure incurred on in-house R&D to all manufacturing businesses except for a small negative list. The expenditure on research and development incurred by the company during the financial year 2009-2010 is eligible for aforesaid weighted deduction under section 35(2AB) of the Income-tax Act.
C. Measures to Promote Socio- Economic Development
Extension of income-tax exemption to Special Undertaking of Unit Trust of India (SUUTI)
This exemption was to come to an end on 31st January, 2008 and the exemption was further extended up to the 31st March, 2009. Since some of the schemes of SUUTI are still pending closure, it is proposed to amend section 13(1) so as to extend the exemption for a period of five years that is up to 31st March, 2014. This amendment will take effect retrospectively from the 1st day of April, 2009. Deduction in respect of Interest on loan taken for higher education
Section 80E of the Income-tax Act provides for a deduction to an assessee, being an individual, on account of any amount paid by him in the previous year by way of interest on loan taken from any financial institution or any approved charitable institution for the purpose of pursuing higher education in specified fields of study. Under the existing provisions, the deduction is available only for pursuing full time studies for any graduate or post-graduate course in engineering, medicine, management or for post-graduate course in applied sciences or pure sciences including mathematics and statistics.
With the objective of fostering human capital formation in the country, it is proposed to amend the provisions of section 80E of the Income Tax Act so as to extend its scope to cover all fields of studies (including vocational studies) pursued after passing the Senior Secondary Examination or its equivalent from any school, board or university recognised by the Central Government or State Government or local authority or by any other authority authorized by the Central Government or State Government or local authority to do so. This amendment will take effect from 1st day of April, 2010 and shall accordingly, apply in relation to assessment year 2010-11 and subsequent years.
Special deduction under section 36(1)(viii) to National Housing Bank (NHB)
Clause (viii) of sub-section (1) of Section 36 [section 36(1)(viii)] provides special deduction to financial corporations and banking companies of an amount not exceeding 20 per cent of the profits subject to creation of a reserve. National Housing Bank (NHB) is wholly owned by Reserve Bank of India and is engaged in promotion and regulation of housing finance institutions in the country. It provides refinancing support to housing finance institutions, banks, ARDBs, and RRBs for the development of housing in India. It also undertakes financing of slum projects, rural housing projects, housing projects for EWS and LIG categories etc. NHB is also a notified financial corporation under section 4A of the Companies Act. A view has been expressed that NHB is not entitled to the benefits of section 36(1)(viii) on the ground that it is not engaged in the long-term financing for construction or purchase of houses in India for residential purpose. The proposed amendment seeks to provide that corporations engaged in providing long-term finance (including re-financing) for development of housing in India will be eligible for the benefit under section 36(1)(viii). This amendment will take effect from the 1st April 2010 and will, accordingly, apply in relation to assessment year 2010-11 and subsequent years.
Provision for constitution of alternate dispute resolution mechanism
The dispute resolution mechanism presently in place is time consuming and finality in high demand cases is attained only after a long drawn litigation till Supreme Court. Flow of foreign investment is extremely sensitive to prolonged uncertainty in tax related matter. Therefore, it is proposed to amend the Income-tax Act to provide for an alternate dispute resolution mechanism which will facilitate expeditious resolution of disputes in a fast track basis.
D. Energy security
In order to facilitate the energy security, it is proposed to extend the tax holiday under section 80-IB (9) of the Income Tax Act to natural gas
E. Rationalisation and Simplification of Administrative and Compliance Procedure
Introduction of Document Identification Number and Facility for Electronic Communication
A tax administration designed to foster voluntarily compliance yields higher revenue than a sound tax policy administered by an inefficient tax administration. Therefore, it is proposed to introduce a computer based system of allotment and quoting of Document Identification Number (DIN) in each correspondence sent or received by it so as to enable tracking of documents and minimise tax payers’ grievances. With a view to give effect to the aforesaid, it is proposed to insert a new section 282B so as to provide that every income tax authority shall allot a computer generated Document Identification Number in respect of every notice, order, letter or any correspondence issued by him to any other income-tax authority or assessee or any other person and such number shall be quoted thereon.
F. Investment-linked tax incentive for specified business
With a view to creating rural infrastructure and environment friendly alternate means of transportation for bulk goods, it is proposed to provide investment-linked tax incentive by inserting a new section 35AD in the Income-tax Act for the following businesses:
(a) setting up and operating cold chain facilities for specified products; (b) setting up and operating warehousing facilities for storage of agricultural produce; and (c) laying and operating a cross-country natural gas or crude or petroleum oil pipeline network for distribution, including storage facilities being an integral part of such network.
G. Fringe Benefit Tax
Fringe benefit tax has been abolished.
H. Customs Duty
Major proposals about customs duties are the following :
a. Health Care
Custom duty on has been reduced on:
i) Ten specified life saving drugs/vaccine and their bulk drugs from 10 per cent to 5 per cent with Nil countervailing duty (CVD) by way of excise duty exemption.
ii) Specified heart devices, namely artificial heart and PDA/ASD occlusion device from 7.5 per cent to 5 per cent with Nil CVD by way of excise duty exemption.
b. Electronics Hardware
i) Customs duty on LCD Panels for manufacture of LCD televisions has been reduced from 10 per cent to 5 per cent. ii) Customs duty exemption on Set Top Box for television broadcasting has been withdrawn and 5 per cent customs duty imposed.
iii) Full exemption from 4 per cent special CVD on parts for manufacture of mobile phones and accessories has been reintroduced for one year, up to July 6, 2010.
c. Renewable Energy Sector
Custom duty has been reduced on :
i) Permanent magnets for PM synchronous generator above 500 KW used in wind operated electricity generators from 7.5 per cent to 5 per cent.
ii) bio-diesel from 7.5 per cent to 2.5 per cent.
d. Capital Goods
i) Concessional customs duty of 5 per cent on specified machinery for tea, coffee and rubber plantations has been reintroduced for one year, up to July 6, 2010.
ii) Customs duty on ‘mechanical harvester’ for coffee plantation has been reduced from 7.5 per cent to 5 per cent. CVD on such harvesters has also been reduced from 8 per cent to nil by way of excise duty exemption.
e. Export Promotion
i) At present, specified raw materials/ inputs imported by manufacturer-exporters of sports goods are fully exempt from customs duty, subject to specified conditions. The list of such items has been expanded by including five additional items. ii) Similarly, specified raw materials and equipment imported by manufacturer-exporters of leather goods, textile products and footwear industry are fully exempt from customs duty, subject to specified conditions. The list of such items has been expanded by including additional items.
iii) Customs duty on unworked corals has been reduced from 5 per cent to Nil.
f. Precious Metals
i) Customs duty on serially numbered gold bars (other than tola bars) and gold coins has been increased from Rs.100 per 10 gram to Rs.200 per 10 gram.
ii) Customs duty on other forms of gold has been increased from Rs.250 per 10 gram to Rs.500 per 10 gram.
iii) Customs duty on silver has been increased from Rs.500 per Kg. to Rs.1000 per Kg.
The above increase in rates is also applicable when gold and silver (including ornaments) are imported as personal baggage.
g. Textiles
The customs duty has been reduced on:
i) cotton waste from 15 per cent to 10 per cent .
ii) wool waste from 15 to 10.
h. Miscellaneous
i) Customs duty on rock phosphate has been reduced from 5 per cent to 2 per cent. ii) CVD exemption on Aerial Passenger Ropeway Projects has been withdrawn.Such projects will now attract applicable CVD.
iii) Customs duty exemption on concrete batching plants of capacity 50 cum per hour or more has been withdrawn. Such plants will now attract customs duty of 7.5 per cent.
iv) On packaged or canned software, CVD exemption has been provided on the portion of the value which represents the consideration for transfer of the right to use such software, subject to specified conditions.
v) Customs duty on inflatable rafts, snow-skis, water skis, surf-boats, sail-boards and other water sports equipment has been fully exempted.
I. Central Excise
a. General CENVAT Rate
The excise duty rate on items currently attracting 4 per cent duty has been increased to 8 per cent with the following major exceptions:
i) Specified food items including biscuits, sherbats, cakes and pastries; ii) Drugs and pharmaceutical products falling under Chapter 30; iii)Medical equipment; iv) Certain varieties of paper, paperboard and articles thereof; v) Paraxylene; vi) Power driven pumps for handling water; vii) Footwear of RSP exceeding Rs.250 but not exceeding Rs.750 per pair; viii) Pressure cookers; ix)Vacuum and gas filled bulbs of RSP not exceeding Rs.20 per bulb; x)Compact Fluorescent Lamps; and xi) Cars for physically handicapped persons. b. Sector Specific Relief Measures
1. Automobile Sector
- Specific component of excise duty applicable to large cars/utility vehicles of engine capacity 2000cc and above has been reduced from Rs.20,000 per vehicle to Rs.15,000 per vehicle;
- Excise duty on petrol driven trucks/ lorries has been reduced from 20 per cent to 8 per cent. Excise duty on chassis of such trucks/lorries has been reduced from ‘20 per cent + Rs.10000’ to ‘8 per cent + Rs.10000’.
2. Petroleum Sector
i) Excise Duty has been reduced on:
- Special Boiling Point spirits to 14 per cent;
- naphtha has been to 14 per cent;
ii) Duty paid High Speed Diesel blended with up to 20 per cent bio-diesel has been fully exempted from excise duties.
iii) The ad valorem component of excise duty of 6 per cent on petrol intended for sale with a brand name has been converted into a specific rate. Consequently, such petrol would now attract total excise duty of Rs.14.50 per litre instead of ‘6 per cent + Rs.13 per litre’.
iv) The ad valorem component of excise duty of 6 per cent on diesel intended for sale with a brand name has been converted into a specific rate. Consequently, such diesel would now attract total excise duty of Rs.4.75 per litre instead of ‘6 per cent + Rs.3.25 per litre’. 3. Textiles
i) Excise duty has been increased from 4 per cent to 8 per cent on:
- Manmade fibre and yarn.
- PTA and DMT.
- polyester chip.
- acrylonitrile;
ii) The scheme of optional excise duty of 4 per cent for pure cotton has been restored.
iii) Excise duty for man-made and natural fibres other than pure cotton, beyond the fibre and yarn stage, has been increased from 4 per cent to 8 per cent under the existing optional scheme.
iv) An optional excise duty exemption has been provided to tops of manmade fibre manufactured from duty paid tow using ‘tow-to-top’ process at par with tops manufactured from duty paid staple fibre.
v) Suitable adjustments have been made in the rates of duty applicable to DTA clearances of textile goods made by Export Oriented Units using indigenous raw materials/inputs for manufacture of such goods.
c. Miscellaneous
- Full exemption from excise duty has been provided on goods of Chapter 68 manufactured at the site of construction for use in construction work at such site.
- Excise duty exemption on ‘recorded smart cards’ and ‘recorded proximity cards and tags’ has been made optional.Manufacturers have the option to pay the applicable excise duty and avail the credit of duty paid on inputs.
- EVA compound manufactured on job work for further use in manufacture of footwear has been exempted from excise duty.
- Benefit of SSI exemption scheme has been extended to printed laminated rolls bearing the brand name of another person by excluding this item from the purview of the brand name restriction.
- On packaged or canned software, excise duty exemption has been provided on the portion of the value which represents the consideration for transfer of the right to use such software, subject to specified conditions.
- Excise duty on branded articles of jewellery has been reduced from 2 per cent to Nil.
J. Service Tax
(I) Following Services are Individually Specified as Taxable Service
- Service provided in relation to transport of goods by rail.
- Service provided in relation to transport of (i) coastal goods; and (ii) goods through Inland Water including National Waterways.
- Legal consultancy service.
- Cosmetic and plastic surgery service.
The above changes will come into effect from a date to be notified, after the enactment of Finance (No. 2) Bill, 2009. II. Exemptions from Service Tax
i) The inter-state or intra-state transportation of passengers in a vehicle bearing ‘Contract Carriage Permit’ with specified conditions.
ii) The Federation of Indian Export Organizations (FIEO) and specified Export Promotions Councils. The exemption is valid till March 31, 2010.
iii) Inter-bank purchase and sale of foreign currency between scheduled banks.
The above changes will come into effect immediately.
III. Refund Scheme for Exporters
The refund scheme of service tax paid on services, which though not in the nature of input services, are relatable to export of goods. The scheme is being revamped to ensure speedier grant of refunds to the exporters. The salient features of the new scheme, being notified under two notifications, both dated July 7, 2009, are as follows:
(a) Two taxable services, namely, ‘Transport of goods by road’ and ‘Commission paid to foreign agents’ have been exempted from the levy of service tax, if the exporter is liable to pay service tax on reverse charge basis. However, as the present cap of 10 per cent on commission agency charges has been retained, the exporter will have to pay service tax on the amount of commission which is in excess of 10 per cent.
(b) Following are some of the salient features of the revamped refund scheme, notified in supersession of notification No.41/2007-ST dated 06.10.2007: ‘Terminal Handling Charges’ is being added to the list of eligible services. The time period for filing a refund claim is being increased to one year from the date of export. The condition for filing refund claims once in a quarter is being dispensed with. Now the exporter can file a refund claim anytime after each export shipment. A simplified format is being prescribed for filing refund claims. Self-certification is being introduced to ensure faster sanction and disbursement of refunds. In a case, where total amount of refund claim does not exceed 0.25 per cent of the total f.o.b. value of exports under a claim, a self-certification by the exporter on the relevant documents to the effect that: (i) the eligible services have been received by him; (ii) the service tax payable thereon has been reimbursed; and (iii) such services have been used for the export, would be sufficient. The refunds shall be granted within one month without any pre-audit. In a case, where amount of refund claim exceeds 0.25 per cent of the f.o.b. value of exports, the documents submitted by the exporter should be certified by the chartered accountant, who audits his annual accounts. On the basis of such certification, the refund claim shall be sanctioned within one month without any pre-audit.
* Prepared in the Division of Central Finances of the Department of Economic Analysis and Policy. This article is based on the Union Budget 2009-10 presented to the Parliament on July 6, 2009. The article on Union Budget 2009-10 (Vote-on-Account) had appeared in April issue of the RBI Bulletin.
1 All comparisons of 2008-09 in this section are with the budget estimates of 2008-09 unless stated otherwise.
2 All comparisons of 2009-10 in this section are with the revised estimates for 2008-09 unless stated otherwise. |