
Union Budget 2013-14: An Assessment - RBI - Reserve Bank of India


Union Budget 2013-14: An Assessment
Union Budget 2013-14: An Assessment* This article, based on the Union Budget 2013-14 presented to the Parliament on February 28, 2013, presents the key features of the Budget and makes an assessment of the likely impact of various budgetary measures on fiscal and overall macroeconomic situation in 2013-14. Presented against the backdrop of a slowdown in both global and domestic economic growth that has persisted in the past two years, and large fiscal and current account deficits, the Union Budget for 2013-14 was formulated with two key objectives of aiding economic growth and bringing down fiscal deficit so as to leave space for private sector credit to trigger investment cycle. Highlights • The gross fiscal deficit (GFD) was contained at 5.2 per cent of GDP in 2012-13 (RE), which is marginally higher than the budget estimate of 5.1 per cent. The containment of GFD in the face of shortfall in tax revenues, telecommunication receipts and disinvestment proceeds was largely brought about by scaling down plan expenditure and capital expenditure. There was, however, a slippage in achieving the budgeted revenue deficit- GDP ratio of 3.4 per cent, reflecting the impact of a sharp rise in non-plan revenue expenditure, particularly subsidies, coupled with shortfall in revenue receipts (both tax and non-tax) during the year. • The Budget, in line with the revised road map for fiscal consolidation, estimates the gross fiscal deficit-GDP ratio to decline to 4.8 per cent in 2013- 14 (BE). In the medium-term, the GFD-GDP ratio is expected to decline to 3.0 per cent by 2016-17. • The Budget envisages a revenue-led fiscal correction to be achieved mainly through augmenting revenue receipts and reducing nonplan revenue expenditure, viz., subsidies. The revenue deficit-GDP ratio is budgeted to record reduction of 0.6 percentage points in 2013-14. Resultantly, the proportion of gross fiscal deficit that would be pre-empted by the revenue deficit is expected to decline to around 70 per cent in 2013-14 from 75 per cent in 2012-13, showing some qualitative improvement in the process of fiscal correction. • The budgeted growth in capital and plan expenditure is placed at 36.6 per cent and 29.4 per cent, respectively in 2013-14. The reprioritisation of expenditure in favour of capital expenditure is expected to increase capital outlay-GFD ratio to 38.5 per cent in 2013-14 from 28.1 per cent in 2012-13. I. Macroeconomic Framework Indian economy is expected to return to a recovery path The economy is expected to return to a recovery path in 2013-14 with real GDP growth estimated in the range of 6.1-6.7 per cent, up from 5.0 per cent recorded in 2012-13. The headline inflation is expected to moderate further in 2013-14, with the average implicit inflation, based on projected real and nominal GDP growth rates for 2013-14, estimated lower at 6.51 per cent than that in 2012-13. It is expected that the impact of fiscal policy on aggregate demand pressures would soften with a progressive move towards fiscal consolidation. It would also provide fiscal space to boost supply side initiatives directly and also through higher infrastructure investments. Policy initiatives proposed in the budget to boost investment, savings and growth are highlighted in Box 1. Box 1: Union Budget 2013-14 – Policy Initiatives 1. Budgetary measures to support growth, saving and investment While emphasising the need for investment to restart the growth engine, the Union Budget 2013-14 has laid particular focus on infrastructure investment. It has adopted a multipronged approach to address the divergent constraints facing the infrastructure sector. While on the one hand, it has proposed measures to facilitate and encourage investment in sectors like roads, ports, coal, power and waterways, it has tried, on the other hand, to address various sector-specific bottlenecks, such as, restructuring problems in power sector and pricing issues in coal and oil/ gas sectors. The focus has also been on the financing and regulatory issues. The Budget proposes to carry forward the initiatives to boost infrastructure investment, including encouraging Infrastructure Debt Funds; credit enhancement via India Infrastructure Corporation-Asian Development Bank partnership to infrastructure companies that may access the bond market; increase in the aggregate ceiling of issuance of tax-free bonds to `500 billion in 2013-14; and setting up a regulatory authority for the road sector to address issues such as financial stress, enhanced construction risk and contract management. Further, in order to attract new investment and to quicken the implementation of projects, an investment allowance for new high value investments would be introduced. A company investing `1 billion or more in plant and machinery during the period April 1, 2013 to March 31, 2015 will be entitled to deduct an investment allowance of 15 per cent of the investment. This will be in addition to the current rates of depreciation. This is expected to provide significant spill-over benefits to small and medium enterprises. In order to incentivise the household sector to save in financial instruments rather than purchase gold, the Budget has announced (i) liberalisation of the Rajiv Gandhi Equity Savings Scheme (ii) enhancement of interest exemption limit in respect of loans for the first home from a bank or a housing finance corporation up to `25 lakh during the period April 1, 2013 to March 31, 2014 and (iii) introduction of Inflation Indexed Bonds or Inflation Indexed National Security Certificates that will protect savings from inflation, especially the savings of the poor and middle classes. 2. Initiatives relating to Banking and Financial Sector A provision of `140 billion for infusing capital in public sector banks has been made in the Budget for 2013-14, over and above `125 billion for 13 public sector banks provided in 2012-13 to ensure their compliance with the Basel III regulations. To address gender-related aspects of empowerment and financial inclusion, the Budget has proposed to set up India’s first Women’s Bank as a public sector bank and Government shall provide `10 billion as initial capital. The policy measures allowing FIIs to use their investments in corporate bonds and government securities as collateral for margin requirements would help boost positive sentiment among FIIs. II. Progress towards Fiscal Consolidation Key deficits for 2013-14 broadly in line with the path envisaged by the Kelkar Committee Pursuant to the mid-year corrective measures undertaken by the Central government, the fiscal consolidation process was resumed in 2012-13, which is expected to continue in 2013-14. The consequent improvement in fiscal position is expected to be seen in select fiscal indicators in 2013-14 vis-à-vis their respective revised estimates for 2012-13. The rolling targets set out for 2014-15 and 2015-16 indicate continuation of this momentum, although slight deviations in revenue and fiscal deficits from the path envisaged by the Kelkar Committee would persist (Table 1). The revised estimates for Central government finances for 2012-13 show that the gross fiscal deficit- GDP ratio was marginally higher than the budgeted level. This reflected a sharp increase of around `408 billion in the revenue deficit and the shortfall of `60 billion in disinvestment proceeds which was offset by a reduction of around `390 billion in net capital expenditure (capital outlay + loans and advances, net of recoveries). There was a slippage in achieving the budgeted revenue deficit-GDP ratio of 3.4 per cent, reflecting the impact of a sharp rise in non-plan revenue expenditure, particularly subsidies, coupled with shortfall in revenue receipts (both tax and non-tax) during the year.
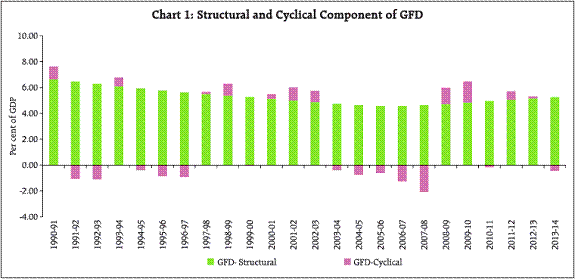
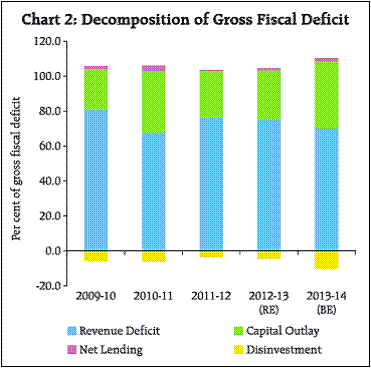
During 2013-14, the GFD-GDP ratio is estimated to decline further to 4.8 per cent (Statement 1). The envisaged correction is expected to be achieved through reduction of 0.6 percentage points in revenue deficit- GDP ratio. The reduction in revenue deficit would be brought about by revenue enhancing measures and expenditure control measures, particularly subsidies. The gross fiscal deficit of the Centre, however, continues to be predominantly structural in nature (Chart 1). The proportion of the gross fiscal deficit that would be pre-empted by the revenue deficit is expected to decline to around 70 per cent in 2013-14 from 75 per cent in 2012-13, showing some qualitative improvement in the process of fiscal correction (Chart 2). Adherence to the proposed strategy of fiscal correction would be important for the actual outturn of the growth process. Revenue Receipts to improve in 2013-14 Gross tax revenues in the revised estimates for 2012-13 recorded a shortfall of around 3.7 per cent over the budgeted level. Union excise duties, customs duties, corporation tax and wealth tax collections declined, even as income tax and service tax collections showed an improvement. The decline in non-tax revenues largely reflected a decline of around `390 billion in telecommunication receipts. With the expected growth of 19.1 per cent in tax revenues, the gross tax-GDP ratio is estimated to improve by 0.5 percentage points to 10.9 per cent during 2013-14. In similar lines, the net tax revenue of the centre is budgeted to increase to 7.8 per cent of GDP in 2013-14 from 7.4 per cent in 2012-13 (RE) (Table 2).
The increase in tax revenues is sought to be achieved through higher excise and custom duties on certain products and imposition of additional surcharge on high income individuals. The tax buoyancies of corporation tax and customs duties are estimated to record improvements in 2013-14 (Table 3). The sharp rise in budgeted non-tax revenues is on account of higher dividend receipts from state-owned enterprises (mainly in the financial sector) and proceeds from telecom spectrum sales. Among the non-debt capital receipts, the disinvestment receipts are budgeted at `400 billion in 2013-14 (`240 billion in 2012-13 (RE)). An additional amount of `140 billion is expected from disinvestment of residual share in non-government companies. Going by the past record, it would be challenging to raise the budgeted disinvestment proceeds and its success would primarily depend on growth revival and vibrant capital market conditions. Non-Plan expenditure growth to moderate in 2013-14 The Budget provides for growth of 10.8 per cent in non-plan expenditure over 2012-13 (RE), keeping in view the requirements for defence, subsidies, interest payments and grants (Table 4). The Plan expenditure is budgeted to register an increase of 29.4 per cent in 2013-14 over 2012-13 (RE), with a sharp increase in both revenue and capital expenditure. This would result in overall expenditure increase of 16.4 per cent in 2013-14 (BE) over 2012-13 (RE).
The restraint on non-plan revenue expenditure growth is critical to ensure that the fiscal consolidation going forward is sustainable, and not excessively reliant on revenue augmentation. The growth in non-plan revenue expenditure is budgeted to be contained at 8.0 per cent (13.3 per cent in 2012-13). The expenditure on subsidies is budgeted lower at 2.0 per cent of GDP in 2013-14 as against 2.6 per cent of GDP in 2012-13 (Table 5). The credibility of the fiscal correction process would depend to a large extent on meeting these targets. While the budget estimates (2013-14) for most of the components of government expenditure are broadly in line with the Kelkar Committee recommendations, there is a significant slippage in the case of non-plan revenue expenditure (Table 6). Resource transfers from the Centre to States to increase in 2013-14 The Thirteenth Finance Commission had recommended higher share of central taxes to be transferred to the states and an increase in grants-inaid, in order to minimise the vertical fiscal imbalances between the Centre and the states. Although the Centre had budgeted increase in all three forms of transfers (tax devolution, grants-in-aid and loans to the states) to states during 2012-13, the shortfall in Centre’s revenues during 2012-13 (RE) is reflected in lower gross and net transfers to the states, both in terms of GDP as well as in absolute terms. During 2013-14, gross and net transfers as ratios to GDP are budgeted to increase by 0.3 percentage points each to 5.2 per cent and 5.1 per cent, respectively (Table 7). Disinvestment proceeds to get credited in National Investment Fund In pursuance of the decision to use disinvestment proceeds from central PSUs only for select capital investment, the disinvestment proceeds from the year 2013-14 will get credited to the public account under the National Investment Fund (NIF) and will be withdrawn for/invested in approved purposes. During 2013-14, out of total disinvestment proceeds, the government proposes to finance recapitalisation of public sector banks (`140 billion) and invest in modernisation and other capital projects of railways (`260 billion). The use of disinvestment proceeds for capital investment would increase resource flows towards more productive purposes.
Tax reform process to move forward in 2013-14 Clarity in tax laws, a stable tax regime, nonadversarial tax administration, a fair mechanism for dispute resolution and an independent judiciary for greater assurance are the broad objectives of tax proposals in the Union Budget 2013-14. It is also proposed to set up a Tax Administration Reforms Commission to review the application of tax policies and tax laws periodically that can be implemented to strengthen the capacity of tax system. The Budget has announced further steps towards the implementation of Direct Taxes Code (DTC) and Goods and Services Tax (GST). As the first decisive step towards implementation of GST, a sum of `90 billion has been set apart as the first installment of the balance of central sales tax (CST) compensation to states. The GST constitutional amendment bill and GST law are expected to be tabled in the Parliament during the course of the year. The recommendations of the Standing Committee on Finance relating to DTC are being examined by the Ministry of Finance. The implementation of GST and DTC would widen the tax base in the medium-term, besides contributing in terms of efficiency and economic gains to the system as a whole. The modified provisions of GAAR based on the Expert Committee Report would come into effect from April 1, 2016.
Budgeted market borrowings of government in 2013-14 to impact liquidity During 2012-13, net market borrowings (through dated securities and 364-day treasury bills) financed around 97 per cent of the gross fiscal deficit (Table 8). While the borrowings through dated securities were reduced by `120 billion from the budget estimates due to additional cushion available from higher opening cash balances and surpluses of state governments invested in Central Government treasury bills, borrowings under 364-day treasury bills increased by `260 billion. Fiscal deficit would continue to be largely financed by market borrowings during 2013-14. The net market borrowing for 2013-14, as announced in the Union Budget, is `4,840 billion, which finances around 89 per cent of the GFD of `5,425 billion. The proposed move to introduce buy-back/switches of government securities aggregating `500 billion in 2013-14, would ease the redemption pressure in the maturity buckets 2014-15 to 2018-19. This would help in effective debt management. Given the large size of market borrowings, substantial liquidity injection by the Reserve Bank may be required. If market borrowings are contained within the budgeted amount, it could provide some required monetary space and enable efficient monetary-fiscal coordination.
III. Overall Assessment Faced with the challenge of twin deficits, the Government embarked on a fiscal consolidation path with mid-year course correction in 2012-13. The fiscal deficit targets adopted in the revised road map for fiscal consolidation formed the basis of the new notified Fiscal Responsibility and Budget Management Rules. The containment of GFD in 2012-13(RE) in the face of shortfall in tax revenues, telecommunication receipts and disinvestment proceeds was largely brought about by scaling down plan expenditure and capital expenditure. The fiscal policy for 2013-14, as enunciated in the Union Budget, has been designed to meet the macroeconomic challenges faced by India in an uncertain global environment. The reduction in the GFD-GDP ratio in 2013-14 (BE) is based on higher mobilisation of disinvestment proceeds, tax revenues, telecommunication receipts and reduction in expenditure on subsidies. As the Budget relies largely on revenue-led fiscal consolidation, its success would depend on the revival of investment climate and growth. The reduction in revenue-deficit by 0.6 per cent of GDP during 2013-14 critically hinges upon the success in meeting the projected tax and non-tax revenues. The government would have to continue with its efforts towards rationalising and reducing subsidies in order to create space for meeting future commitments under the proposed Food Security Act. The re-prioritisation of expenditure in favour of capital expenditure would increase capital outlay-GFD ratio from 28.1 per cent in 2012-13 to 38.5 per cent in 2013-14. It may be noted that during the fiscal consolidation phase the capital outlay-GFD ratio, on an average, was as high as 51.4 per cent. Overall, the fiscal consolidation measures announced in the Budget will lay the foundation for a sustainable rebalancing of Government finances. Fiscal prudence would impart confidence in the economy and support domestic and foreign investments. The envisaged elimination of effective revenue deficit by 2015-16 would make available additional resources for financing investment and capital expenditure (including grants for creation of capital assets), ensure the use of government borrowing primarily for capital formation and aid the growth process.
* Prepared in the Fiscal Analysis Division of the Department of Economic and Policy Research. The previous article on Union Budget 2012-13 was published in the Reserve Bank of India Bulletin, May 2012. 1Assuming real GDP growth of 6.5 per cent and nominal GDP growth of 13.4 per cent. |
|||||||||||||||||||||||||||||||||||||||||||||||||||||||||||||||||||||||||||||||||||||||||||||||||||||||||||||||||||||||||||||||||||||||||||||||||||||||||||||||||||||||||||||||||||||||||||||||||||||||||||||||||||||||||||||||||||||||||||||||||||||||||||||||||||||||||||||||||||||||||||||||||||||||||||||||||||||||||||||||||||||||||||||||||||||||||||||||||||||||||||||||||||||||||||||||||||||||||||||||||||||||||||||||||||||||||||||||||||||||||||||||||||||||||||||||||||||||||||||||||||||||||||||||||||||||||||||||||||||||||||||||||||||||||||||||||||||||||||||||||||||||||||||||||||||||||||||||||||||||||||||||||||||||||||||||||||||||||||||||||||||||||||||||||||||||||||||||||||||||||||||||||||||||||||||||||||||||||||||||||||||||||||||||||||||||||||||||||||||||||||||||||||||||||||||||||||||||||||||||||||||||||||||||||||||||||||||||||||||||||||||||||||||||||||||||||||||||||||||||||||||||||||||||||||||||||||||||||||||||||||||||||||||

Share this page:


Install the RBI mobile application and get quick access to the latest news!


