| India's balance of payments position continued to remain comfortable during the first half of 2007-08 (April-September), notwithstanding some deceleration in exports and higher growth in non-oil imports. Merchandise exports maintained the growth momentum during April-November 2007, although there was some moderation as compared with the growth rate during April-November 2006. Imports during April-November 2007 posted a high growth rate; oil imports, however, witnessed a sharp deceleration from the strong growth recorded during the corresponding period of the previous year. Net invisibles surplus remained buoyant during the first half of 2007-08, led by higher growth in private transfers and offset a large part of the trade deficit. The current account deficit during April-September 2007 was marginally higher than that during April-September 2006. Net capital inflows were substantially higher than those in the corresponding period of 2006-07, resulting in a sharp increase in foreign exchange reserves of US $ 85.7 billion during 2007-08 (up to January 18, 2008).
International Developments
Global economic activity remained strong in 2007, although it moderated from very buoyant conditions in 2006. Supported by strong economic conditions in emerging markets, the global economy expanded at a robust pace in the third quarter of 2007 after recording a modest growth in the second quarter (Table 47).
As regards developed economies, the United States experienced significant economic stress due to the ongoing housing market correction and associated financial market turmoil. However, according to the advance release, there was acceleration in real GDP growth in the US by 0.4 percentage point, on a year-on-year basis, to 2.8 per cent in the third quarter of 2007, primarily on account of acceleration in exports, personal consumption expenditure (PCE) and private inventory investment that was partly offset by an upturn in imports, a larger decrease in residential fixed investment and a deceleration in non-residential structures. In Japan, economic activity continued to recover in 2007, supported by domestic demand and strong exports. The Japanese economy witnessed acceleration of 0.3 percentage point in real GDP growth in the third quarter, on a year-on-year basis, attributable to rise in demand both at home and abroad. In the United Kingdom, according to preliminary estimates, real GDP growth remained robust at 3.2 per cent during the third quarter of 2007 mainly on account of firm household consumption and gross fixed capital formation growth. The sustained economic growth experienced in the euro area
Table 47 : Growth Rates - Global Scenario |
(Per cent) |
Region/Country |
2005 |
2006 |
2007P |
2008P |
2006 |
2007 |
|
|
|
|
|
Q1 |
Q2 |
Q3 |
Q4 |
Q1 |
Q2 |
Q3 |
1 |
2 |
3 |
4 |
5 |
6 |
7 |
8 |
9 |
10 |
11 |
12 |
Advanced Economies |
|
|
|
|
|
|
|
|
|
|
|
Euro area |
1.5 |
2.8 |
2.5 |
2.1 |
2.2 |
2.7 |
2.8 |
3.3 |
3.0 |
2.5 |
2.7 |
Japan |
1.9 |
2.2 |
2.0 |
1.7 |
3.0 |
2.1 |
1.6 |
2.2 |
2.6 |
1.6 |
1.9 |
Korea |
4.2 |
5.0 |
4.8 |
4.6 |
6.3 |
5.1 |
4.6 |
4.0 |
4.0 |
5.0 |
5.2 |
UK |
1.8 |
2.8 |
3.1 |
2.3 |
2.4 |
2.7 |
2.9 |
3.0 |
3.0 |
3.1 |
3.2 |
US |
3.1 |
2.9 |
1.9 |
1.9 |
3.3 |
3.2 |
2.4 |
2.6 |
1.5 |
1.9 |
2.8 |
OECD Countries |
2.5 |
2.9 |
2.7 |
2.7 |
3.2 |
3.3 |
2.8 |
3.1 |
2.6 |
2.5 |
2.9 |
Emerging Economies |
|
|
|
|
|
|
|
|
|
|
|
Argentina |
9.2 |
8.5 |
7.5 |
5.5 |
8.6 |
7.9 |
8.7 |
8.6 |
8.0 |
8.7 |
8.7 |
Brazil |
2.9 |
3.7 |
4.4 |
4.0 |
3.9 |
1.1 |
3.2 |
4.4 |
4.3 |
5.4 |
5.7 |
China |
10.4 |
11.1 |
11.5 |
10.0 |
10.3 |
10.9 |
10.7 |
10.7 |
11.1 |
11.5 |
11.5 |
India |
9.0 |
9.4 |
8.9 |
8.4 |
10.0 |
9.6 |
10.2 |
8.7 |
9.1 |
9.3 |
8.9 |
Indonesia |
5.7 |
5.5 |
6.2 |
6.1 |
5.0 |
5.0 |
5.5 |
6.1 |
6.0 |
6.3 |
6.5 |
Malaysia |
5.2 |
5.9 |
5.8 |
5.6 |
6.0 |
6.1 |
6.0 |
5.7 |
5.3 |
5.7 |
6.7 |
Thailand |
4.5 |
5.0 |
4.0 |
4.5 |
6.1 |
5.0 |
4.5 |
4.3 |
4.3 |
4.4 |
5.1 |
P : IMF Projections.
Note : Data for India in columns 2 and 3 refer to fiscal years 2005-06 and 2006-07, respectively.
Source : International Monetary Fund; The Economist; and the OECD. |
in the first half of 2007 continued through the third quarter, attributable to consumption growth in line with developments in real disposable income, as continued employment growth provided supportive conditions. Furthermore, continued strong external demand provided support to euro area exports and investment.
In emerging Asia, economic activity continued to be resilient, especially in the larger economies of the region. In China, in particular, the economy expanded at a strong pace with real GDP growing at an annual rate of 11.5 per cent in the third quarter of 2007.
According to the projections made by the IMF (World Economic Outlook, October 2007), the growth rate of the global economy is likely to moderate to 5.2 per cent in 2007 and 4.8 per cent in 2008 from 5.4 per cent in 2006 (Table 48). The extent of the likely impact of housing slowdown in the US on the global economy is still unclear. However, a global economic slowdown of modest nature, as is widely predicted, cannot be ruled out. Risks to the global outlook, however, are firmly on the downside, centred around the concern that financial market strains could deepen and trigger a more pronounced global slowdown. Additional risks to the outlook include potential inflation pressures arising from commodity price rise and volatile oil markets and the impact of likely stronger foreign exchange inflows on emerging markets.
As per the IMF projections, growth in world trade is expected to moderate to 6.6 per cent in volume terms in 2007 from 9.2 per cent in the preceding
Table 48 : Select Economic Indicators - World |
Item |
2001 |
2002 |
2003 |
2004 |
2005 |
2006 |
2007P |
2008P |
1 |
2 |
3 |
4 |
5 |
6 |
7 |
8 |
9 |
I. World Output (Per cent change) # |
2.5 |
3.1 |
4.0 |
5.3 |
4.8 |
5.4 |
5.2 |
4.8 |
|
|
|
(1.5) |
(1.9) |
(2.6) |
(3.9) |
(3.3) |
(3.8) |
(3.5) |
(3.3) |
|
i) |
Advanced economies |
1.2 |
1.6 |
1.9 |
3.2 |
2.5 |
2.9 |
2.5 |
2.2 |
|
ii) |
Other emerging market and developing countries |
4.3 |
5.1 |
6.7 |
7.7 |
7.5 |
8.1 |
8.1 |
7.4 |
|
|
of which: Developing Asia |
6.0 |
7.0 |
8.3 |
8.8 |
9.2 |
9.8 |
9.8 |
8.8 |
II. |
Consumer Price Inflation (Per cent) |
|
|
|
|
|
|
|
|
|
i) |
Advanced economies |
2.1 |
1.5 |
1.8 |
2.0 |
2.3 |
2.3 |
2.1 |
2.0 |
|
ii) |
Other emerging market and developing countries |
6.5 |
5.7 |
5.7 |
5.4 |
5.2 |
5.1 |
5.9 |
5.3 |
|
|
of which: Developing Asia |
2.7 |
2.0 |
2.5 |
4.1 |
3.6 |
4.0 |
5.3 |
4.4 |
III. |
Net Capital Flows* (US $ billion) |
|
|
|
|
|
|
|
|
|
i) |
Net private capital flows (a+b+c)** |
80.6 |
90.1 |
168.3 |
239.4 |
271.1 |
220.9 |
495.4 |
291.3 |
|
|
a) Net private direct investment |
185.9 |
154.7 |
164.4 |
191.5 |
262.7 |
258.3 |
302.2 |
293.9 |
|
|
b) Net private portfolio investment |
-79.8 |
-91.3 |
-11.7 |
21.1 |
23.3 |
-111.9 |
20.6 |
-93.1 |
|
|
c) Net other private capital flows |
-25.8 |
26.0 |
14.5 |
25.1 |
-17.0 |
73.6 |
171.0 |
88.8 |
|
ii) |
Net official flows |
0.1 |
-2.7 |
-48.7 |
-67.2 |
-146.4 |
-165.8 |
-132.1 |
-141.2 |
IV. |
World Trade @ |
|
|
|
|
|
|
|
|
|
i) |
Volume |
0.2 |
3.5 |
5.5 |
10.8 |
7.5 |
9.2 |
6.6 |
6.7 |
|
ii) |
Price deflator (in US dollars) |
-3.5 |
1.2 |
10.4 |
9.5 |
5.7 |
4.8 |
7.0 |
2.4 |
V. |
Current Account Balance (Per cent to GDP) |
|
|
|
|
|
|
|
|
|
i) |
US |
-3.8 |
-4.4 |
-4.8 |
-5.5 |
-6.1 |
-6.2 |
-5.7 |
-5.5 |
|
ii) |
China |
1.3 |
2.4 |
2.8 |
3.6 |
7.2 |
9.4 |
11.7 |
12.2 |
|
iii) |
Middle East |
6.3 |
4.8 |
8.3 |
11.7 |
19.4 |
19.7 |
16.7 |
16.0 |
P : IMF Projections.
# : Growth rates are based on exchange rates at purchasing power parities.
Figures in parentheses are growth rates at market exchange rates. Please also see ‘Note’.
* : Net capital flows to emerging market and developing countries.
** : On account of data limitations, flows listed under 'Net private capital flows' may include some official flows.
@ : Average of annual percentage change for world exports and imports of goods and services.
Note : The IMF has revised downward its estimates for global growth by around 0.5 percentage point each year during 2002-07, based on new statistical calculations of purchasing power parity
(PPP) exchange rates published in December 2007 by the International Comparison Programme (ICP).
Thus, the IMF’s estimate for growth in 2007 has been revised down to 4.7 per cent from 5.2 per cent.
Source : World Economic Outlook, October 2007, International Monetary Fund. |
year (see Table 48). Exports of other emerging market and developing countries are projected to grow by 9.2 per cent in 2007 (11.0 per cent a year ago), while those of advanced countries are expected to grow by 5.4 per cent (8.2 per cent a year ago). World exports (in US dollar terms) in the first nine months of 2007 (January-September) posted a growth of 13.8 per cent (14.6 per cent a year ago), with industrial countries registering a growth of 13.1 per cent (10.9 per cent a year ago). Developing countries witnessed a moderation in export growth at 15.7 per cent during January-October 2007 as compared with 19.2 per cent registered a year ago (Table 49).
Table 49 : Growth in Exports - Global Scenario |
(Per cent) |
Region/ Country |
2005 |
2006 |
2006 |
2007 |
|
|
|
January-October |
1 |
2 |
3 |
4 |
5 |
World |
14.0 |
15.6 |
14.6 * |
13.8 * |
Industrial Countries |
8.5 |
12.6 |
10.9 * |
13.1 * |
USA |
10.8 |
14.5 |
14.8 |
11.9 |
France |
3.8 |
10.1 |
10.4 |
10.4 |
Germany |
7.3 |
15.1 |
11.0 * |
18.9 * |
Japan |
5.2 |
9.2 |
8.1 |
8.9 |
Developing Countries |
22.0 |
19.5 |
19.2 |
15.7 |
Non-Oil Developing Countries |
19.3 |
19.9 |
19.6 |
17.1 |
China |
28.4 |
27.2 |
26.8 |
26.5 |
India |
29.9 |
21.3 |
22.1# |
19.5# |
Indonesia |
22.9 |
19.0 |
19.1 |
14.2 |
Korea |
12.0 |
14.4 |
14.6# |
14.1# |
Malaysia |
12.0 |
14.0 |
13.2 |
9.1 |
Singapore |
15.6 |
18.4 |
20.1 |
9.7 |
Thailand |
14.5 |
18.7 |
17.8 |
16.7 |
* : January-September # : January-November.
Source: International Financial Statistics, International Money Fund; DGCI&S for India. |
Merchandise Trade
As per the provisional data released by the Directorate General of Commercial Intelligence and Statistics (DGCI&S), India's merchandise exports posted a growth of 21.9 per cent during April-November 2007, moderating from the growth of 26.2 per cent during the corresponding period of 2006-07. Growth in imports at 26.9 per cent was marginally lower than that of 27.4 per cent recorded a year ago (Chart 40). Non-oil imports recorded a substantial increase of 35.3 per cent (21.3 per cent a year ago) and contributed about 88 per cent to overall import growth. Oil imports during April-November 2007 showed a sharp deceleration in growth (9.8 per cent as against 42.0 per cent in April-November 2006). Merchandise trade deficit during April-November 2007 aggregated US $ 52.8 billion, an increase of US $ 14.3 billion over a year ago (US $ 38.5 billion).
Commodity-wise data available for April-September 2007 show that petroleum products, engineering goods, and gems and jewellery remained as the drivers of export growth, together constituting about 67 per cent of the overall export growth. With the exception of gems and jewellery which showed an increase (21.2 per cent as against a decline of 1.0 per cent during April-September 2006), all the other major commodity groups recorded deceleration (Table 50).
Destination-wise, the US continued to be the major market for India's exports during 2007-08, though its share declined from 15.3 per cent in April-September 2006 to 13.7 per cent in April-September 2007. The US was followed 
by the UAE (10.3 per cent), China (5.3 per cent), the UK (4.3 per cent) and Singapore (4.2 per cent). Among the major regions, India's exports to European Union (EU) showed accelerated growth, while exports to North America, OPEC and developing countries showed moderation during April-September 2007 (Table 51).
Commodity-wise details on imports available for April-September 2007 revealed that capital goods and gold and silver were the main drivers of growth in non-oil imports. Capital goods increased by 26.9 per cent while imports of gold and silver increased by 71.0 per cent over April-September 2006. Non-oil
Table 50 : Exports of Principal Commodities |
Commodity Group |
US $ billion |
Variation (per cent) |
|
2006-07 |
2006-07 |
2007-08 |
2006-07 |
2006-07 |
2007-08 |
|
|
April-September |
|
April-September |
1 |
2 |
3 |
4 |
5 |
6 |
7 |
1. |
Primary Products |
19.7 |
8.5 |
9.8 |
20.2 |
18.4 |
15.3 |
|
of which: |
|
|
|
|
|
|
|
a) |
Agriculture and Allied Products |
12.7 |
5.6 |
6.4 |
24.2 |
24.0 |
15.1 |
|
b) |
Ores and Minerals |
7.0 |
2.9 |
3.4 |
13.6 |
8.8 |
15.7 |
2. Manufactured Goods |
84.9 |
40.9 |
46.7 |
17.0 |
18.3 |
14.1 |
|
of which: |
|
|
|
|
|
|
|
a) |
Chemicals and Related Products |
17.3 |
8.3 |
9.2 |
17.4 |
22.0 |
11.4 |
|
b) |
Engineering Goods |
29.6 |
14.0 |
16.9 |
36.1 |
37.8 |
20.8 |
|
c) |
Textiles and Textile Products |
17.4 |
8.6 |
8.7 |
5.9 |
11.6 |
1.3 |
|
d) |
Gems and Jewellery |
16.0 |
7.7 |
9.4 |
2.9 |
-1.0 |
21.2 |
3. Petroleum Products |
18.7 |
10.0 |
12.6 |
60.5 |
103.5 |
26.8 |
4. Total Exports |
126.4 |
61.1 |
71.9 |
22.6 |
27.3 |
17.6 |
Memo: |
Non-oil Exports |
107.7 |
51.2 |
59.3 |
17.7 |
18.6 |
15.8 |
Source: DGCI&S. |
Table 51 : Direction of India’s Exports |
Group/Country |
US $ billion |
Variation (per cent) |
|
2006-07 |
2006-07 |
2007-08 |
2006-07 |
2006-07 |
2007-08 |
|
|
April-September |
|
April-September |
1 |
2 |
3 |
4 |
5 |
6 |
7 |
1. |
OECD Countries |
52.0 |
25.0 |
28.3 |
13.5 |
16.1 |
13.3 |
|
of which: |
|
|
|
|
|
|
|
a) European Union |
25.8 |
12.2 |
14.6 |
15.1 |
16.8 |
19.7 |
|
b) North America |
20.0 |
10.0 |
10.4 |
8.7 |
14.7 |
4.9 |
|
US |
18.9 |
9.4 |
9.9 |
8.7 |
14.7 |
5.0 |
2. |
OPEC |
20.7 |
10.4 |
12.5 |
35.8 |
55.8 |
19.7 |
|
of which: |
|
|
|
|
|
|
|
UAE |
12.0 |
6.2 |
7.4 |
40.0 |
65.2 |
19.7 |
3. |
Developing Countries |
49.9 |
24.5 |
29.3 |
25.5 |
30.6 |
19.7 |
|
of which: |
|
|
|
|
|
|
|
Asia |
36.7 |
18.2 |
21.0 |
18.5 |
24.7 |
15.2 |
|
People's Republic of China |
8.3 |
3.4 |
3.8 |
22.7 |
18.8 |
9.8 |
|
Singapore |
6.1 |
3.5 |
3.0 |
11.9 |
30.1 |
-13.1 |
4. |
Total Exports |
126.4 |
61.1 |
71.9 |
22.6 |
27.3 |
17.6 |
Source : DGCI&S. |
imports net of gold and silver increased at an accelerated pace of 28.2 per cent (19.2 per cent during April-September 2006). During the period, while the share of capital goods, and metalliferrous ores and metal scrap in imports growth declined, the contribution of gold and silver, coal, coke and briquettes, pearls, precious and semi-precious stones, chemicals, and iron and steel showed increase (Table 52).
Table 52 : Imports of Principal Commodities |
Commodity Group |
US $ billion |
Variation (per cent) |
|
2006-07 |
2006-07 |
2007-08 |
2006-07 |
2006-07 |
2007-08 |
|
|
April-September |
|
April-September |
1 |
2 |
3 |
4 |
5 |
6 |
7 |
Petroleum, Petroleum Products and Related Material |
57.1 |
29.6 |
34.6 |
30.0 |
41.2 |
16.9 |
Edible Oil |
2.1 |
1.0 |
1.4 |
4.2 |
-11.8 |
32.9 |
Iron and Steel |
6.4 |
2.9 |
4.4 |
40.5 |
16.9 |
52.8 |
Capital Goods |
47.1 |
19.8 |
25.1 |
25.0 |
39.1 |
26.9 |
Pearls, Precious and Semi-Precious Stones |
7.5 |
3.6 |
4.7 |
-18.0 |
32.8 |
30.6 |
Chemicals |
7.8 |
3.9 |
4.7 |
12.1 |
9.5 |
21.4 |
Gold and Silver |
14.6 |
6.7 |
11.5 |
29.4 |
-3.1 |
71.0 |
Total Imports |
185.7 |
87.4 |
111.6 |
24.5 |
23.5 |
27.7 |
Memo: |
|
|
|
|
|
|
Non-oil Imports |
128.6 |
57.8 |
77.0 |
22.2 |
16.1 |
33.2 |
Non-oil Imports excluding Gold and Silver |
114.0 |
51.1 |
65.5 |
21.4 |
19.2 |
28.2 |
Mainly Industrial Inputs* |
104.7 |
47.2 |
60.1 |
19.6 |
19.5 |
27.4 |
* : Non-oil imports net of gold and silver, bulk consumption goods, manufactured fertilisers and professional instruments.
Source : DGCI&S. |
Table 53 : India’s Merchandise Trade |
(US $ billion) |
Item |
2005-06 |
2006-07 |
2006-07 |
2007-08 |
|
|
|
April-November |
1 |
2 |
3 |
4 |
5 |
Exports |
103.1 |
126.4 |
80.6 |
98.3 |
Imports |
149.2 |
185.7 |
119.1 |
151.1 |
Oil |
44.0 |
57.1 |
39.4 |
43.3 |
Non-oil |
105.2 |
128.6 |
79.7 |
107.8 |
Trade Balance |
-46.1 |
-59.4 |
-38.5 |
-52.8 |
Non-Oil Trade Balance |
-13.8 |
-20.9 |
-11.9 |
.. |
Variation (per cent) |
Exports |
23.4 |
22.6 |
26.2 |
21.9 |
Imports |
33.8 |
24.5 |
27.4 |
26.9 |
Oil |
47.3 |
30.0 |
42.0 |
9.8 |
Non-oil |
28.8 |
22.2 |
21.3 |
35.3 |
.. : Not Available.
Source : DGCI&S. |
Source-wise, China was the major source of imports in April-September 2007, accounting for 11.2 per cent of total imports (oil plus non-oil imports), followed by Saudi Arabia (7.2 per cent), the US (5.8 per cent), Switzerland (5.6 per cent), the UAE (5.5 per cent), Iran (4.2 per cent) Australia (4.0 per cent) and Germany (3.8 per cent).
Trade deficit during April-November 2007 widened to US $ 52.8 billion, an increase of US $ 14.3 billion over the corresponding period a year ago (US $ 38.5 billion) (Table 53). Trade deficit on the oil account increased by US $ 2.3 billion during April-September 2007 to reach US $ 22.0 billion, while non-oil trade deficit increased by US $ 11.1 billion to US $ 17.7 billion. Current Account
Net surplus under invisibles (services, transfers and income taken together) was higher at US $ 31.7 billion in April-September 2007 (US $ 23.4 billion in April-September 2006), reflecting mainly the rise in remittances from the overseas Indians, higher interest income on reserves and relatively moderate rise in payments of business services (Table 54). Growth in invisible receipts as well as invisible payments decelerated in April-September 2007 mainly on account of deceleration in exports of software and business services. The major components of invisible payments were travel payments, transportation, business service payments such as business and management consultancy, engineering and other technical services, and dividend and profit payments.
Table 54 : Invisibles Account (Net) |
(US $ million) |
Item |
2006-07 PR |
2006-07 PR |
2007-2008 |
|
April-March |
April- |
July- |
April- |
April- |
July- |
April- |
|
|
June |
Sept. |
Sept. |
June PR |
Sept. P |
Sept. P |
1 |
2 |
3 |
4 |
5 |
6 |
7 |
8 |
Services |
31,810 |
7,579 |
6,918 |
14,497 |
8,029 |
6,660 |
14,689 |
Travel |
2,438 |
220 |
-16 |
204 |
207 |
169 |
376 |
Transportation |
-18 |
-282 |
32 |
-250 |
-639 |
-675 |
-1,314 |
Insurance |
560 |
109 |
161 |
270 |
232 |
81 |
313 |
Government, not included elsewhere |
-153 |
-39 |
-61 |
-100 |
-16 |
-62 |
-78 |
Software |
29,033 |
6,624 |
6,716 |
13,340 |
7,884 |
7,213 |
15,097 |
Other Services |
-50 |
947 |
86 |
1,033 |
361 |
-66 |
295 |
Transfers |
28,168 |
6,873 |
5,385 |
12,258 |
8,327 |
10,116 |
18,443 |
Investment Income |
-6,018 |
-1,367 |
-1,668 |
-3,035 |
-801 |
-440 |
-1,241 |
Compensation of Employees |
-555 |
-133 |
-153 |
-286 |
-62 |
-141 |
-203 |
Total |
53,405 |
12,952 |
10,482 |
23,434 |
15,493 |
16,195 |
31,688 |
PR : Partially Revised P : Preliminary. |
The net invisible surplus offset a large part of the trade deficit (74.7 per cent during April-September 2007 as compared with 69.4 per cent during April-September 2006). Despite large merchandise trade deficit, the higher net invisible surplus, mainly emanating from private transfers, contained the current account deficit at US $ 10.7 billion in the first half of 2007-08 (US $10.3 billion in April-September 2006) (Chart 41 and Table 55). Net of remittances, the current account deficit was US $ 29.1 billion during April-September 2007 (US $ 22.6 billion a year ago). 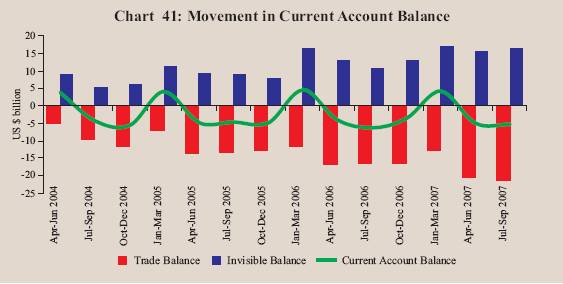
Table 55 : India’s Balance of Payments |
(US $ million) |
Item |
2006-07 PR |
2006-07 PR |
2007-2008 |
|
April-March |
April- |
July- |
April- |
April- |
July- |
April- |
|
|
June |
Sept. |
Sept. |
June PR |
Sept. P |
Sept. P |
1 |
2 |
3 |
4 |
5 |
6 |
7 |
8 |
Exports |
128,083 |
29,614 |
31,836 |
61,450 |
35,790 |
37,875 |
73,665 |
Imports |
191,254 |
46,631 |
48,593 |
95,224 |
56,480 |
59,586 |
116,066 |
Trade Balance |
-63,171 |
-17,017 |
-16,757 |
-33,774 |
-20,690 |
-21,711 |
-42,401 |
|
|
(-6.9) |
|
|
|
|
|
|
Invisible Receipts |
115,074 |
24,946 |
24,953 |
49,899 |
29,379 |
32,213 |
61,592 |
Invisible Payments |
61,669 |
11,994 |
14,471 |
26,465 |
13,886 |
16,018 |
29,904 |
Invisibles, net |
53,405 |
12,952 |
10,482 |
23,434 |
15,493 |
16,195 |
31,688 |
|
|
(5.8) |
|
|
|
|
|
|
Current Account |
-9,766 |
-4,065 |
-6,275 |
-10,340 |
-5,197 |
-5,516 |
-10,713 |
|
|
(-1.1) |
|
|
|
|
|
|
Capital Account (net)* |
46,372 |
10,444 |
8,545 |
18,989 |
16,397 |
34,752 |
51,149 |
of which: |
|
|
|
|
|
|
|
|
Foreign Direct Investment |
8,479 |
1,579 |
2,912 |
4,491 |
1,738 |
2,142 |
3,880 |
|
Portfolio Investment |
7,062 |
-506 |
2,150 |
1,644 |
7,458 |
10,876 |
18,334 |
|
External Commercial
Borrowings + |
16,155 |
3,974 |
1,761 |
5,735 |
6,963 |
3,594 |
10,557 |
|
Short-term Trade Credit |
6,612 |
1,182 |
2,683 |
3,865 |
2,153 |
3,558 |
5,711 |
|
External Assistance |
1,767 |
49 |
337 |
386 |
276 |
453 |
729 |
|
NRI Deposits |
4,321 |
1,302 |
908 |
2,210 |
-447@ |
369 |
-78 |
Change in Reserves # |
-36,606 |
-6,379 |
-2,270 |
-8649 |
-11,200 |
-29,236 |
-40,436 |
Memo: |
Current Account net of |
-37,707 |
-10,959 |
-11,646 |
-22,605 |
-13,537 |
-15,596 |
29,133 |
Private Transfers |
(-4.1) |
|
|
|
|
|
|
P : Preliminary. PR: Partially Revised. * : Includes errors and omissions.
# : On balance of payments basis (excluding valuation); (-) indicates increase.
+ : Medium and long-term borrowings.
@ : Includes Non-resident Rupee Deposits for April-June 2007.
Note : Figures in parentheses are percentages to GDP. |
Capital Flows
During the financial year 2007-08 (up to November 2007), various components of foreign investment in India recorded increased inflows. The inflows under foreign direct investment (FDI) were US $ 13.8 billion during April-November 2007 as against US $ 10.1 billion during the corresponding period of the previous year (Table 56). Source-wise data on FDI to India revealed that Mauritius was the largest source of FDI during April-November 2007, followed by Singapore and the US.
Net inflows by foreign institutional investors (FIIs) aggregated to US $ 26.8 billion during the current financial year so far (up to January 11, 2008). The number of FIIs registered with the SEBI increased from 997 at end-March 2007 to 1,219 at end-December 2007. Capital inflows on account of American depository receipts (ADRs)/global depository receipts (GDRs) amounted to US $ 5.7 billion during April-November 2007.
Table 56 : Capital Flows |
(US $ million) |
Item |
Period |
2006-07 |
2007-08 |
1 |
2 |
3 |
4 |
Foreign Direct Investment into India |
April-November |
10,113 |
13,783 |
FIIs ( net) |
April-January * |
2,491 |
26,807 |
ADRs/GDRs |
April-November |
1,850 |
5,674 |
External Assistance (net) |
April-September |
386 |
729 |
External Commercial Borrowings (net) |
|
|
|
(Medium and long-term) |
April-September |
5,735 |
10,557 |
Short-term Trade Credits (net) |
April-September |
3,865 |
5,711 |
NRI Deposits (net) |
April-November |
2,971 |
-433 |
* : Up to January 11.
Note : Data on FIIs presented in this table represent inflows into the country. They may differ from data relating to net investment in stock exchanges by FIIs. |
During the current financial year 2007-08 (April-September), the inflows (net) under external commercial borrowings (ECBs) amounted to US $ 10.6 billion. Net short-term trade credit was US $ 5.7 billion (inclusive of suppliers' credit up to 180 days) in April-September 2007. Out of total short-term trade credit, the suppliers' credit up to 180 days amounted to US $ 1.9 billion during April-September 2007.
Non-Resident Indian (NRI) deposits recorded a net outflow of US $ 433 million during April-November 2007. Although there were inflows under Foreign Currency Non-Resident (Banks) [FCNR(B)] deposits and Non-Resident Ordinary Rupee (NRO) account schemes, there were outflows under Non-Resident External Rupee Account [NR(E)RA] deposits scheme.
With net capital flows being substantially higher than the current account deficit, the overall balance of payments recorded a surplus of US $ 40.4 billion during April-September 2007 (US $ 8.6 billion during April-September 2006).
In response to net capital flows remaining well in excess of the current account financing need, a multi-pronged approach has been followed in India to deal with such flows. The policy responses have included, inter alia, liberalisation of capital outflows for residents, modulation of interest rates on non-resident deposits along with increase in minimum maturities, prepayments of external loans, and greater flexibility in exchange rate movements. Sterilisation operations through the use of the cash reserve ratio and open market operations, including the liquidity adjustment facility and the market stabilisation scheme, have also been used to manage capital flows.
A survey of major EMEs, such as Brazil, China and Russia shows that central banks in all these countries intervene in the foreign exchange markets. These EMEs sterilise their foreign exchange intervention, either fully or partially. With regard to monetary policy, different instruments are used, including increase in reserve requirements, restrictions on bank credit and other traditional monetary policy instruments designed to maintain low inflation and price stability. With respect to capital account management, different countries have initiated measures to increase outflows; in some cases inflows have also been restricted. Foreign Exchange Reserves
India's foreign exchange reserves were US $ 284.9 billion as on January 18, 2008, showing an increase of US $ 85.7 billion over end-March 2007. The increase in reserves was mainly due to an increase in foreign currency assets from US $ 191.9 billion during end-March 2007 to US $ 276.1 billion as on January 18, 2008 (Table 57).
India holds the third largest stock of reserves among the emerging market economies after China and Russia. The overall approach to the management of India's foreign exchange reserves in recent years reflects the changing composition of the balance of payments and the 'liquidity risks' associated with different types of flows and other requirements. Taking these factors into account, India's foreign exchange reserves continued to be at a comfortable level and consistent with the rate of growth, the share of external sector in the economy and the size of risk-adjusted capital flows.
Table 57 : Foreign Exchange Reserves |
(US $ million) |
Month |
Gold |
SDR |
Foreign
Currency Assets |
Reserve Position
in the IMF |
Total
(2+3+4+5) |
1 |
2 |
3 |
4 |
5 |
6 |
March 1995 |
4,370 |
7 |
20,809 |
331 |
25,517 |
March 2000 |
2,974 |
4 |
35,058 |
658 |
38,694 |
March 2005 |
4,500 |
5 |
135,571 |
1,438 |
141,514 |
March 2006 |
5,755 |
3 |
145,108 |
756 |
151,622 |
March 2007 |
6,784 |
2 |
191,924 |
469 |
199,179 |
April 2007 |
7,036 |
11 |
196,899 |
463 |
204,409 |
May 2007 |
6,911 |
1 |
200,697 |
459 |
208,068 |
June 2007 |
6,787 |
1 |
206,114 |
460 |
213,362 |
July 2007 |
6,887 |
12 |
219,753 |
455 |
227,107 |
August 2007 |
6,881 |
2 |
221,509 |
455 |
228,847 |
September 2007 |
7,367 |
2 |
239,955 |
438 |
247,762 |
October 2007 |
7,811 |
13 |
256,427 |
441 |
264,692 |
November 2007 |
8,357 |
3 |
264,725 |
435 |
273,520 |
December 2007 |
8,328 |
3 |
266,553 |
432 |
275,316 |
January 2008* |
8,328 |
3 |
276,134 |
433 |
284,898 |
* : As on January 18, 2008. |
External Debt
India's total external debt was placed at US $ 190.5 billion at end-September 2007, recording an increase of US $ 20.9 billion (12.3 per cent) over end-March 2007 (Table 58). The increase in external debt during the period was mainly on account of higher external commercial borrowings, followed by higher short-term trade credit and NRI deposits. The increase in outstanding debt to an extent was also due to a positive valuation impact (around US $ 5 billion), reflecting the depreciation of the US dollar vis-à-vis other major international currencies. About 52.8 per cent of the external debt stock was denominated in US dollars followed by the Indian rupee (17.6 per cent), Japanese yen (11.5 per cent) and SDR (11.1 per cent). The coverage of short-term debt has been made more comprehensive with the inclusion of (i) suppliers' credits up to 180 days and (ii) investment by Foreign Institutional Investors (FII) in short-term debt instruments, beginning with the quarter ended March 2005. As a result, the short-term debt at end-June 2007 was revised to US $ 28.6 billion from US $ 13.0 billion (preliminary). As at end-September 2007, short-term debt increased to US $ 30.8 billion, accounting for 16.2 per cent of the total external debt. Among the debt sustainability indicators, the ratio of short-term to total debt increased between end-March 2007 and end-September 2007 while the ratio of short-term debt to reserves declined over the same period. Foreign exchange reserves remained in excess of the stock of external debt at end-September 2007.
Table 58 : India’s External Debt |
(US $ million) |
Item |
End- |
End- |
End- |
End- |
End- |
End- |
|
March |
March |
March |
March |
June |
Sept. |
|
1995 |
2005 |
2006 |
2007 |
2007 |
2007 |
1 |
2 |
3 |
4 |
5 |
6 |
7 |
1. Multilateral |
28,542 |
31,744 |
32,620 |
35,337 |
36,058 |
37,067 |
2. Bilateral |
20,270 |
17,034 |
15,761 |
16,062 |
15,841 |
16,659 |
3. International Monetary Fund |
4,300 |
0 |
0 |
0 |
0 |
0 |
4. Trade Credit (above 1 year) |
6,629 |
5,022 |
5,450 |
7,083 |
7,747 |
8,505 |
5. External Commercial Borrowings |
12,991 |
26,405 |
26,415 |
41,722 |
47,729 |
51,770 |
6. NRI Deposit |
12,383 |
32,743 |
36,282 |
41,240 |
42,603 |
43,643 |
7. Rupee Debt |
9,624 |
2,302 |
2,032 |
1,946 |
2,032 |
2,081 |
8. Long-term (1 to 7) |
94,739 |
115,250 |
118,560 |
143,390 |
152,010 |
159,725 |
9. Short-term |
4,269 |
17,723 |
19,569 |
26,239 |
28,568 |
30,791 |
Total (8+9) |
99,008 |
132,973 |
138,129 |
169,629 |
180,578 |
190,516 |
Memo : |
|
|
|
|
|
(per cent) |
Total debt /GDP |
30.8 |
18.6 |
17.3 |
17.9 |
.. |
.. |
Short-term/Total debt |
4.3 |
13.3 |
14.2 |
15.5 |
15.8 |
16.2 |
Short-term debt/Reserves |
16.9 |
12.5 |
12.9 |
13.2 |
13.4 |
12.4 |
Concessional debt/Total debt |
45.3 |
30.9 |
28.6 |
23.3 |
21.9 |
21.4 |
Reserves/ Total debt |
25.4 |
106.4 |
109.8 |
117.4 |
118.2 |
130.0 |
Debt Service Ratio* |
25.9 |
6.1 |
9.9 |
4.8 |
4.6 |
4.5 |
* : Relates to the fiscal year. .. : Not Available. |
International Investment Position
India's net international liabilities increased by US $ 15.5 billion between end-March 2007 and end-June 2007, as the increase in international liabilities (US $ 31.6 billion) exceeded the increase in international assets (US $ 16.1 billion) (Table 59). While the increase in the liabilities was mainly due to large capital inflows under portfolio investments, direct investments and external commercial loans, the increase in international assets was on account of an increase of US $ 14.2 billion in reserve assets between end-March 2007 and end-June 2007, followed by direct investment abroad (US $ 5.4 billion). International liabilities reflected increases in direct and portfolio investment at end-June 2007 from their levels in end-March 2007. A major part of the liabilities like direct and portfolio investment reflects cumulative inflows, which are at historical prices.
Table 59 : International Investment Position of India |
(US $ billion) |
Item |
March |
March |
March |
March |
June |
|
2004 R |
2005 PR |
2006 PR |
2007 PR |
2007 PR |
1 |
2 |
3 |
4 |
5 |
6 |
A. Assets |
136.0 |
166.8 |
182.8 |
243.6 |
259.7 |
|
|
(21.3) |
(23.3) |
(22.9) |
(25.7) |
.. |
1. |
Direct Investment |
7.8 |
10.0 |
13.0 |
24.0 |
29.4 |
2. |
Portfolio Investment |
0.4 |
0.5 |
1.0 |
0.8 |
0.8 |
|
2.1 Equity Securities |
0.2 |
0.3 |
0.5 |
0.4 |
0.4 |
|
2.2 Debt securities |
0.2 |
0.2 |
0.5 |
0.4 |
0.4 |
3. |
Other Investment |
14.8 |
14.8 |
17.2 |
19.6 |
16.2 |
|
3.1 Trade Credits |
0.5 |
1.1 |
-0.3 |
2.5 |
1.9 |
|
3.2 Loans |
1.7 |
1.9 |
2.6 |
2.6 |
2.0 |
|
3.3 Currency and Deposits |
9.5 |
8.4 |
11.6 |
10.3 |
8.1 |
|
3.4 Other Assets |
3.1 |
3.4 |
3.3 |
4.2 |
4.2 |
4. |
Reserve Assets |
113.0 |
141.5 |
151.6 |
199.2 |
213.4 |
|
|
(17.7) |
(19.8) |
(19.0) |
(21.0) |
.. |
B. Liabilities |
183.2 |
210.8 |
232.0 |
290.6 |
322.2 |
|
|
(29.0) |
(29.5) |
(29.0) |
(30.7) |
.. |
1. |
Direct Investment |
38.2 |
44.5 |
51.1 |
72.3 |
83.0 |
|
|
(6.0) |
(6.2) |
(6.4) |
(7.6) |
.. |
2. |
Portfolio Investment |
43.7 |
56.0 |
64.6 |
79.2 |
93.5 |
|
|
(6.9) |
(7.8) |
(8.1) |
(8.4) |
.. |
|
2.1 Equity Securities |
33.9 |
43.2 |
54.7 |
63.3 |
75.2 |
|
2.2 Debt securities |
9.8 |
12.8 |
9.9 |
15.9 |
18.3 |
3. |
Other Investment |
101.3 |
110.3 |
116.3 |
139.1 |
145.7 |
|
|
(16.1) |
(15.5) |
(14.6) |
(14.7) |
.. |
|
3.1 Trade Credits |
6.3 |
9.6 |
10.5 |
13.7 |
14.7 |
|
3.2 Loans |
61.9 |
65.9 |
67.9 |
82.2 |
86.0 |
|
3.3 Currency and Deposits |
32.2 |
33.6 |
37.3 |
42.3 |
43.8 |
|
3.4 Other Liabilities |
1.0 |
1.2 |
0.6 |
0.9 |
1.2 |
C. Net Position (A-B) |
-47.2 |
-44.0 |
-49.2 |
-47.0 |
-62.5 |
|
|
(-7.6) |
(-6.2) |
(-6.2) |
(-5.0) |
.. |
PR : Partially Revised. P : Provisional. .. : Not Available.
Note : Figures in parentheses represent percentage to GDP. |
|


