RbiSearchHeader

Press escape key to go back

Past Searches

Theme
Theme
Text Size
Text Size
S1

RbiAnnouncementWeb

RBI Announcements
RBI Announcements

Asset Publisher

83152787

VII. Macroeconomic Outlook

The forecasts of various international agencies continue to point towards persistence of global recessionary conditions during 2009, though some indications, albeit tentative, of a global economic recovery are becoming visible. The IMF revised the growth projection for India upwards on July 8, 2009 from the earlier 4.5 per cent to 5.4 per cent in 2009. Various surveys of economic activity point towards gradual emergence of optimistic sentiment for the outlook of the Indian economy in the coming months. There are visible upside prospects as well as downside possibilities for the near-term growth outlook. Emerging lead information indicate firming up of inflation over time, even though certain possible developments could help in moderating the inflationary pressures.

VII.1 The macroeconomic outlook of the Indian economy, based on various business expectations surveys indicates that the earlier decline in overall business sentiment has reversed suggesting gradual return of optimism. The Reserve Bank’s industrial outlook survey suggests turnaround in general economic sentiments during the first two quarters of 2009-10. The professional forecasters’ survey conducted by the Reserve Bank in June 2009 also shows upward revision in the median GDP growth forecast for 2009-10.

Business Expectations Surveys

VII.2 The Business Confidence Index (BCI) of the NCAER (68th round) receded to 81.6 in April 2009 from 91.4 in January 2009. The BCI lost 9.8 points or 10.7 percent in April 2009 over its January 2009 level (Table 56). The decline was recorded in three constituent indices, namely the “overall economic conditions index over the next six months”, “investment climate in the economy now as compared to six months back”, and “expectations of financial position of the firm in next six months”. The index on “current level of capacity utilisation of the firm relative to optimal operations” remained unchanged during the period.

Table 56: Business Expectations Surveys

Organisation

Business Expectations

Growth over a year ago (per cent)

Growth over
previous round
(per cent)

Period

Index

1

2

3

4

5

NCAER

April 2009

Business Confidence Index

-45.1

-10.7

CII

April-September 2009

Business Confidence Index

-3.8

4.3

Dun & Bradstreet

July-September 2009

Business Optimism Index

-3.3

40.8

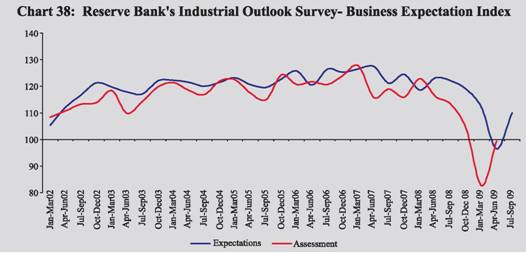
VII.3 The CII Business Confidence Index (CII-BCI) for April-September 2009 at 58.7 increased by 4.3 per cent over the preceding round (i.e., October-March 2008-09) reflecting an improvement in the ensuing business confidence. The business confidence, however, was lower by 3.8 per cent for April-September 2009 as compared to the corresponding period of last year. The Dun and Bradstreet Business Optimism Index for July–September 2009 increased significantly by 40.8 per cent to 132.1 from an all-time low of 93.8 in April-June 2009. On a year-on-year basis, the index, however, recorded a marginal decline of 3.3 per cent over the corresponding quarter of the previous year as compared to a decline of 39.0 per cent in April-June 2009. Five of the six optimism indices, namely volume of sales, net profits, new orders, selling prices, and employee levels recorded an improvement as compared to the previous quarter. Inventory levels, however, registered a decline by 2.0 per cent over the previous quarter.

VII.4 The headline Markit India Manufacturing PMI was at 55.3 during June 2009, above the neutral mark of 50.0, indicating recovery in manufacturing for the third straight month after protracted contraction. Production, new orders and manufacturing employment recorded increase during June 2009.

1

Reserve Bank’s Industrial Outlook Survey

VII.5 The Industrial Outlook Survey of the Reserve Bank conducted in April-May 2009 also suggests a turnaround in the business sentiment. For the manufacturing companies in the private sector, the business expectations indices based on an “assessment for April-June 2009” and on “expectations for July-September 2009” improved sharply by 20.3 and 14.0 per cent, respectively, over the previous quarter, when these indices had recorded their lowest level since inception of the Survey (Chart 38).

VII.6 For most of the indicators like production, order book position, capacity utilisation and financial situation, the decline in sentiment has been arrested and reversed. The price expectations show that more companies are expecting rise in input and output prices as compared with the previous quarters. The outlook on raw material cost seems to be complex, as 40.6 per cent of the respondents reported increase in price of raw materials against 37.2 per cent in the preceding quarter. Additionally, the share of companies expecting price increase also has increased to 35.8 per cent. Optimism level for selling prices (i.e., increase in selling price) for both assessment and expectations improved as compared with the last survey round mainly on account of increase in the proportion of ‘no change in selling price’ (Table 57).

Table 57: Reserve Bank's Survey – Net Response on 'A Quarter Ahead' Expectations About the Industrial Performance

Parameter

Response

Apr-Jun 2008

Jul-Sep 2008

Oct-Dec 2008

Jan-Mar 2009

Apr-Jun 2009

Jul-
Sep 2009

1

2

3

4

5

6

7

8

1.

Overall business situation

Better

46.0

41.8

33.7

21.1

11.2

26.3


(42.7)

(42.6)

(44.1)

(43.9)

(47.6)

(46.7)

2.

Financial situation

Better

36.6

32.7

27.7

16.4

8.4

16.6


(51.6)

(53.0)

(52.5)

(53.2)

(52.7)

(54.4)

3.

Working capital finance requirement

Increase

36.6

33.6

33.8

32.9

23.2

22.4


(56.5)

(57.3)

(57.7)

(57.1)

(61.0)

(61.7)

4.

Availability of finance

Improve

32.3

30.2

23.3

13.7

9.3

16.8


(58.3)

(57.9)

(59.0)

(56.3)

(61.7)

(62.6)

5.

Production

Increase

45.2

43.5

39.8

26.0

9.9

19.1


(41.0)

(36.6)

(42.1)

(42.3)

(44.9)

(45.5)

6.

Order books

Increase

41.5

38.5

35.7

20.6

6.4

-27.1


(44.3)

(43.5)

(46.1)

(46.1)

(44.4)

(45.8)

7.

Pending orders, if applicable

Below normal

-4.3

2.2

4.6

11.5

23.2

-0.5


(81.3)

(80.9)

(82.0)

(77.8)

(59.4)

(73.4)

8.

Cost of raw material

Decrease

-48.2

-54.7

-61.1

-35.7

-16.2

-1.8


(46.0)

(39.1)

(32.3)

(39.7)

(33.7)

(55.5)

9.

Inventory of raw material

Below average

-7.0

-3.8

-7.6

-3.3

1.1

10.7


(83.2)

(81.8)

(77.6)

(81.3)

(80.2)

(82.7)

10.

Inventory of finished goods

Below average

-5.8

-1.5

-4.3

-4.4

-4.4

-12.1


(84.5)

(84.5)

(82.6)

(80.9)

(78.4)

(80.6)

11.

Capacity utilisation (Main product)

Increase

25.6

22.2

26.4

12.3

-0.7

5.5


(59.9)

(58.8)

(56.0)

(59.1)

(55.0)

(57.5)

12.

Level of capacity utilisation

Above normal

9.4

3.6

-0.5

-7.4

-20.8

1.5


(Compared to the average in the preceding four quarters)


(77.0)

(74.9)

(78.7)

(73.7)

(66.4)

(70.8)

13.

Assessment of the production

More than

8.0

4.6

5.7

11.8

8.9

0.1


capacity (With regard to expected demand in the next six months)

adequate

(81.2)

(81.3)

(81.7)

(81.0)

(70.7)

(76.9)

14.

Employment in the company

Increase

20.8

15.8

16.6

7.7

-5.1

4.6


(68.2)

(71.5)

(70.4)

(75.7)

(74.0)

(78.6)

15.

Exports, if applicable

Increase

27.7

27.7

27.3

16.0

-3.8

0


(53.3)

(54.9)

(54.3)

(54.8)

(57.3)

(59.0)

16.

Imports, if any

Increase

25.3

21.3

21.4

9.1

-1.4

-100


(65.6)

(66.5)

(67.9)

(69.7)

(68.8)

(70.6)

17.

Selling prices are expected to

Increase

19.1

21.0

26.2

4.1

-9.1

-13.4


(66.0)

(61.5)

(57.6)

(61.7)

(61.9)

(65.6)

18.

If increase expected in selling prices

Increase at

9.0

3.0

0.6

0.9

25.9

0


lower rate

(64.0)

(61.3)

(54.7)

(54.0)

(53.5)

(0.0)

19.

Profit margin

Increase

7.2

3.8

-3.6

-12.9

-18.6

0


(61.0)

(59.8)

(54.7)

(53.3)

(50.6)

(54.5)

Note : 1. 'Net response' is measured as the percentage share differential between the companies reporting 'optimistic' (positive) and 'pessimistic' (negative) responses; responses indicating status quo (no change) are not reckoned. Higher 'net response' indicates higher level of confidence and vice versa.
2. Figures in parentheses are the percentages of respondents with 'no change over the preceding quarter' as responses.

VII.7 The industry-wise breakup showed that the net sentiments on ‘overall business situation’ for the sample companies recorded sharp improvement from its lowest level for the quarter April-June 2009. The industry groups, viz., fertilizer, food products, and pharmaceuticals show positive sentiment, with more companies expecting growth than those expecting contraction. The expectations on employment for the July-September 2009 show that the manufacturing sector will be a net hirer. The Business Expectations Index (BEI) for April-June 2009 improved with reference to the previous quarter indicating that the contraction is assessed to be at a much smaller rate. The BEI for July-September 2009 also indicates a turn around and crossed the critical 100 mark into the growth terrain.

Survey of Professional Forecasters1

VII.8 The results of eighth round of survey of professional forecasters’ conducted by the Reserve Bank in June 2009 placed overall (median) growth rate for 2009-10 at 6.5 per cent, revised upwards from 5.7 per cent in the earlier survey (Table 58). The sectoral growth rate forecast for the agriculture sector was revised downwards from 3 per cent to 2.5 per cent. The forecasts for industry were revised upwards from 4.1 per cent to 4.8 per cent and for services from 7.5 per cent to 8.3 per cent in the current survey. Median forecasts for different quarters of 2009-10 placed higher growth for industry and services in the third and fourth quarters of 2009-10.

VII.9 Forecasts by select agencies for real GDP growth of India in 2009-10 are set out in Table 59. There was a significant upward revision in the projection for India’s growth in 2009 by the IMF (July 8, 2009) from 4.5 per cent in April 2009 to 5.4 per cent in July 2009.

Inflation and Growth Outlook

VII.10 The outlook for growth has to be assessed in the context of both upside prospects as well as downside possibilities. Certain lead information available for the year 2009-10 that could indicate recovery in growth include: (a) IIP growth remaining positive during April-May 2009 with increasing number of industry groups showing positive trends, (b) the core infrastructure sector showing higher growth of 4.8 per cent in April-June 2009 as against 3.5 per cent in the corresponding period of the previous year, (c) cement production showing significantly higher growth during April-June 2009 over the corresponding period last year, suggesting picking up of activities in the construction sector, (d) some of the forward looking indicators for services sector activities such as tourist arrivals and railway freight earnings imporving in June 2009 and growth in new cell phone connections showing improvements during April-May 2009 being significantly higher than the numbers in the corresponding period of last year, (e) large and sustained fiscal stimulus providing the boost to aggregate demand, (f) Reserve Bank’s Industrial Outlook Survey conducted in April-May 2009 suggesting significant improvement in the respondents’ “assessment for April-June 2009” and “expectations for July-September 2009” by 20.3 per cent and 14.0 per cent, respectively, over the previous survey conducted during January-March 2009, (g) the Reserve Bank’s professional forecasters survey conducted in June 2009 showing a median GDP growth of 6.5 per cent for 2009-10, as against 5.7 per cent as per the previous survey conducted in March 2009, (h) non-food credit growth turning positive since the beginning of June 2009 and the year-on-year deceleration in credit growth showing a modest reversal since the last fortnight of June 2009, (i) capital flows, after two consecutive quarters of net outflows in the second half of 2008-09, showing signs of improvement in the first quarter of 2009-10, (j) early information on the corporate performance for the first quarter of 2009-10 indicating positive growth in both sales and profits over the corresponding period of the previous year, (k) the stock market witnessing significant recovery in the first quarter of 2009-10, indicating signs of improving risk appetite, and (l) primary segment of the capital market, which had virtually dried up since October 2008, witnessing signs of revival with one public issue being over subscribed multiple times.

Table 58: Median Forecasts of Select Macroeconomic Indicators by Professional Forecasters : 2009-10 and 2010-11


Actual 2008-09

Annual forecasts

Quarterly forecasts

2009-10

2010-11

2009-10

2010-11

Q1

Q2

Q3

Q4

Q1

E

L

E

L

E

L

E

L

E

L

E

L

E

L

1

2

3

4

5

6

7

8

9

10

11

12

13

14

15

16

17

1

Real GDP growth rate at factor cost (in per cent)

6.7

5.7

6.5

-

7.5

5.3

6.0

5.6

6.2

6.2

6.9

6.5

7.1

-

7.5


a. Agriculture & Allied Activities

1.6

3.0

2.5

3.0

3.0

2.8

2.5

2.4

3.0

3.5

3.0

3.0

3.0


b. Industry

2.6

4.1

4.8

-

7.4

2.1

2.8

3.0

3.5

5.3

5.9

5.9

7.2

-

7.0


c. Services

9.4

7.5

8.3

-

9.0

7.3

8.1

7.4

8.0

7.5

8.5

8.2

8.5

-

8.8

2

Gross Domestic Saving (per cent of GDP at current market price)

-

34.6

35.0

-

36.0

-

-

-

-

-

-

-

-

-

-

3

Gross Domestic Capital Formation (per cent of GDP at current market price)

-

35.4

36.6

-

37.9

36.2

34.5

34.5

36.4

34.1

38.0

33.8

37.0

-

36.2

4

Corporate profit after tax (growth rate in per cent)*

-

9.0

7.5

-

15.0

-2.5

-1.0

2.0

3.0

16.5

8.0

12.5

9.0

-

15.0

5

Inflation WPI

8.4

1.8

1.6

-

5.5

-1.4

0.3#

-2.5

-1.4

1.6

2.5

4.8

5.4

-

5.9

6

Exchange Rate (INR/US$ end period)

51.0

48.0

46.5

-

44.5

50.0

47.9#

49.0

47.5

48.0

47.0

47.0

46.0

-

45.4

7

91-day Treasury Bill Yield (per cent-end period)

7.1

5.0

4.6

-

5.0

-

-

-

-

-

-

-

-

-

-

8

10-year Government Securities Yield (per cent-end period)

7.6

6.5

7.0

-

7.0

-

-

-

-

-

-

-

-

-

-

9

Export (growth rate in per cent)@

5.4

-4.0

-0.5

-

12.0

-

-

-

-

-

-

-

-

-

-

10

Import (Growth rate in per cent)@

14.3

-8.4

-3.5

-

14.0

-

-

-

-

-

-

-

-

-

-

11

Trade Balance (US $ billion)

-119.4

-25.0

-19.0

-27.0

-25.8

-27.1

-31.0

-28.0

-19.9

-29.3

E : Earlier Projection. L : Latest Projection.
– : Not Available. # : Actuals. * : BSE listed companies. @ : US $ on BoP Basis
Note : The latest round refers to eighth round for the quarter ended June 2009, while earlier round refers to seventh round for the
quarter ended March 2009.
Source : Survey of Professional Forecasters, First Quarter 2009-10.


Table 59: Projections of Real GDP for India by Various Agencies – 2009-10

(Per cent)

Agency

Latest Projection

Month
of Projection

Earlier Projection

Overall Growth

Agriculture

Industry

Services

Overall
Growth
(Per cent)

Month

1

2

3

4

5

6

7

8

ADB

5.0

-

-

-

Mar-09

7.0

Dec-08

CMIE

5.8

-2.0

5.7

8.2

July-09

6.6

May

Economic Advisory Council to PM

7.0-7.5

-

-

-

Jan-09

-

-

ICRIER

4.8-5.5

-

-

-

Mar-09

-

-

IMF (Calendar year)

5.4

-

-

-

July-09

4.5

April-09

NCAER

6.5-6.9

2.5

6.0-6.3

7.9-8.5

Apr-09

-

-

OECD

5.9

-

-

-

June-09

4.3

Mar-09

World Bank

5.1

-

-

-

June-09

4.0

Mar-09

Range

4.8-7.5

-2.0-2.5

5.7-6.3

7.9-8.5


4.0-7.0


VII.11 Several lead indicators, however, suggest that the dampened growth impulses may continue, which include:(a) significant delay in the arrival of monsoon in certain parts of the country which has already affected the kharif showing, (b) persistence of global recession and the associated weak prospects for recovery in export growth in the near-term, (c) the lagged impact of decline in manufacturing growth in the Q4 of 2008-09 on services demand in early 2009-10, (d) capital goods segment in the IIP showing negative growth during April-May 2009, (e) commercial vehicles production registering a negative growth of 23.1 per cent during April-May 2009, and (f) non-oil import growth declining at an accelerated rate.

VII.12 On the inflation outlook, while certain indicators suggest possible firming up of inflation over time, other developments could also help in keeping the inflationary pressures subdued. The major lead information indicating firming up of inflation by the end of the current fiscal year include: (a) the high base effect that resulted from significant increases in the prices of food and international commodities in the first half of the year fading over time, and the base effect almost disappearing by October 2009, (b) the upward momentum in inflation visible from the rising WPI over its end-March 2009 level, (c) increase in commodity prices, particularly oil prices, during the first quarter of 2009-10 and with global recovery, the possibility of commodity and food prices increasing further, (d) increase in Minimum Support Price (MSP) as well as delayed monsoon exerting possible pressures on food prices, (e) price pressures from sugar and oil cakes remain strong, (f) CPI inflation continuing to be inflexible and firm, (g) inflation expectations not moderating commensurately in response to the sharp fall in WPI (point-to-point) inflation, and (h) the inflationary implications of fiscal stimulus and accommodative monetary policy, if sustained longer.

VII.13 Inflationary pressures may abate if: (a) global recession deepens and persists over a longer period, which could then dampen the commodity prices considerably, (b) despite the delayed progress of monsoon, agricultural growth remains unaffected, (c) administered prices, including MSP do not increase further during the year, and (d) the accommodative monetary stance returns to normal levels at the earliest.


1Introduced by the Reserve Bank from the quarter ended September 2007. The forecasts made in the section are that of professional forecasters and not that of the Reserve Bank.

RbiTtsCommonUtility

PLAYING
LISTEN

Related Assets

RBI-Install-RBI-Content-Global

RbiSocialMediaUtility

Install the RBI mobile application and get quick access to the latest news!

Scan Your QR code to Install our app

RbiWasItHelpfulUtility

Was this page helpful?