 IST,
IST,
RBI WPS (DEPR): 04/2013: Financial Development and Monetary Policy Transmission Across Financial Markets: What Do Daily Data tell for India?
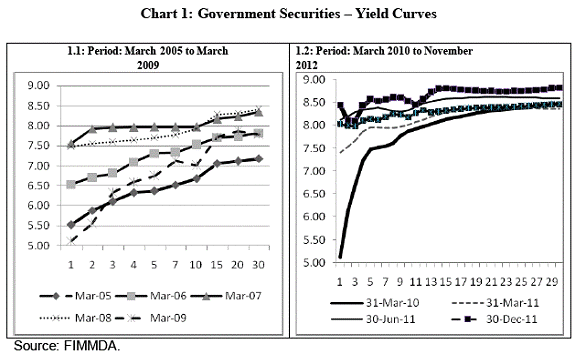
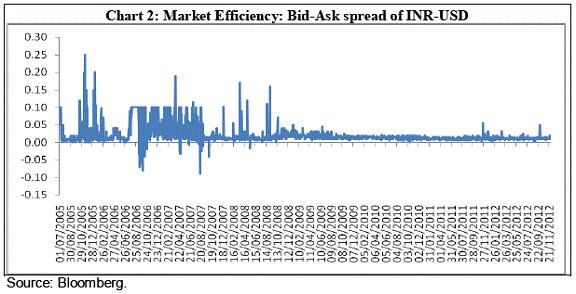
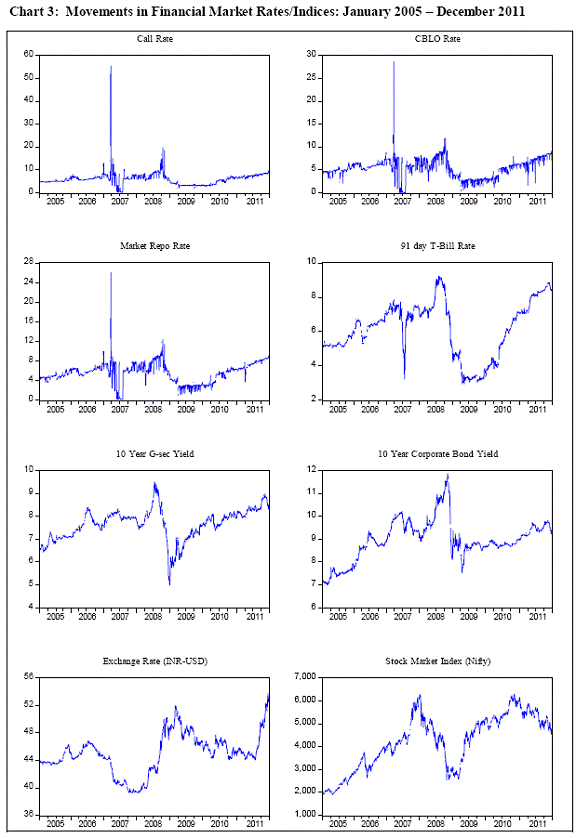
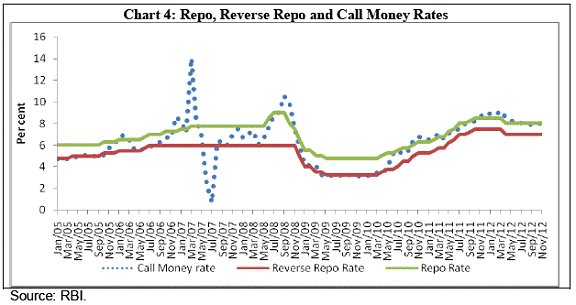
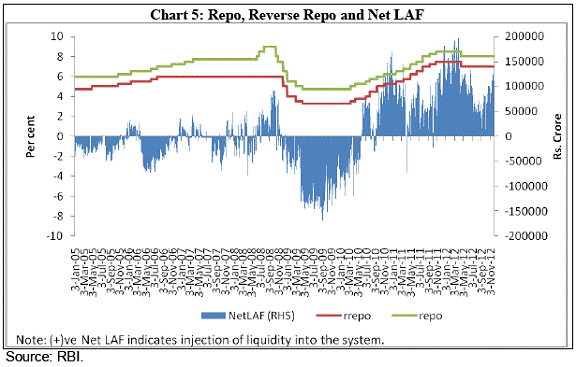
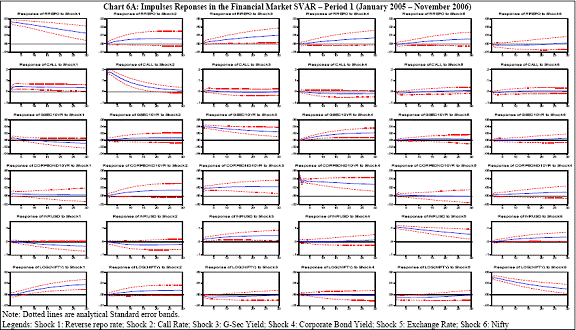
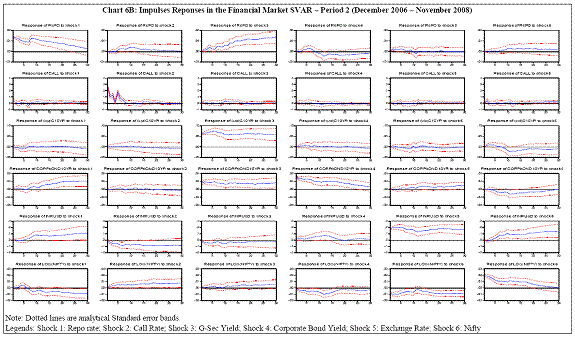
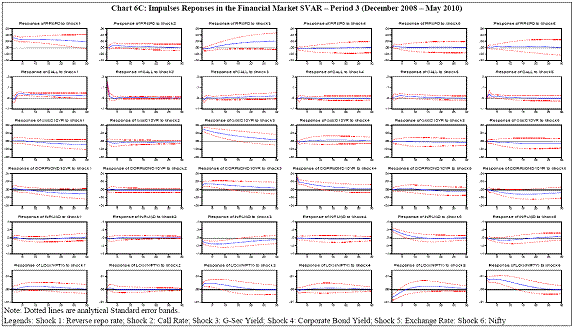
| Press Release RBI Working Paper Series No. 04 This paper seeks to address two questions In Indian context. First, what is the nature of integration among different segments of Indian financial markets? Second, what has been the influence of monetary policy on different segments of financial markets? As far as domestic financial integration is concerned, the study finds that the money market segment is fairly integrated. At the next level, among the constituents of the domestic financial markets, G-sec and corporate bond market are somewhat integrated. There is, however, limited evidence of integration between the money market and stock market. Using daily data over January 2005 – November 2012, the paper constructs a structural Vector autoregression (SVAR) model and studies the financial markets microstructure and monetary policy transmission in India related to four key segments, viz., money, bonds (G-Sec and corporate debt), forex and stock market. While the transmission of monetary policy to money market is found to be fast and efficient and the effects on bond and forex market are on expected lines, the impact of monetary policy to stock market is limited. The nature of monetary policy transmission, however, tends to vary, depending on the extent of liquidity (i.e., whether there is surplus or deficit liquidity). JEL Classification: C32, E52, F41 Keywords: Monetary Policy, Structural Vector autoregression, impulse responses Introduction The process of financial development in any emerging economy would invlove the intimately interlinked developments of both financial institutions as well as financial markets. It is well-known that transmission of monetary policy, to begin with, takes place via financial markets. Financial market developments and extent of market integration across various segments of domestic financial markets play a key role in this context. The more integrated financial markets are, in all likelihood the more would be the strength of monetary transmission across financial markets. Empirically, however, the locomotion from microstructure to macro behaviour is essentially couched in terms of some aggregation. Two issues are important here. First, the level of aggregation could dictate the nature of market. Illustratively, when the market for fruits is formed by aggregating apples and oranges, there is indeed some loss of information but the investigator still goes for it to discern broader trends. Thus, tension of inferring about the woods without missing the trees is inherent in any investigation on market integration. Second, there is yet another issue that is important in this regard, viz., presence of regulation. Illustratively, even if the quality of rice could be reasonably homogenous across all India, in presence of government regulation restricting movement of rice across states, market for rice will be segmented across India. Thus, in terms of first principles, level of aggregation and extent of regulation may determine the degree of market integration.4 While both these issues are important for financial markets, one would expect the flow of information (as well as the products) would be much smooth in financial markets than their real counterparts. After all, most of the financial products are virtual and geographical distance and transport cost will have little relevance for financial markets. Thus, the law of one price (in the form of equality of risk adjusted returns) has a higher probability of getting validated for financial markets. Nevertheless, financial transactions are highly leveraged - hence the possibility of regulation leading to market segmentation will be accordingly high in financial markets. At this stage one may segregate between two levels of integration – (a) among different segments of domestic financial markets, and (b) among a specific segment of domestic financial market and its global / foreign counterpart. Both these types of integration are on the rise with the increasing trends in globalization. It has been rightly observed:
How integrated are the segments of Indian financial markets? What is the relationship of financial markets with monetary policy actions? What has been the inter-temporal behaviour of financial market integration? The present paper seeks to answer some of these questions in Indian specifics in recent period. In particular, it concentrates on the first type of financial integration, viz., among different segments of domestic financial markets. Specifically, it seeks to address two questions:
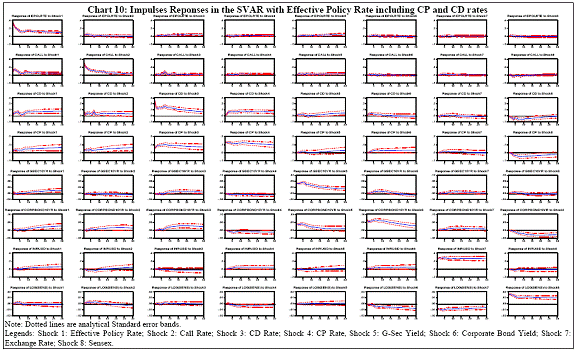
There are three discerning features of the study. First, it uses daily data over a fairly recent period, viz., January 2005 – November 2012 to decipher the extent of financial market integration. Second, it seeks to probe into the mechanism of monetary policy transmission across various segments of financial markets viz., money, G-Sec, corporate debt, forex, and equity.5 Third, given the short run nature of the data (notwithstanding the number of observations), it uses structural vector autoregression models to discern econometrically robust conclusions. A scan of the existing literature on financial market integration in India reveals that most of them concluded in favour of increasing but partial integration among the different segments of the financial markets. At the same time, because of low frequency of data most of these studies covered a period in which there was regime change with respect to monetary policy operating procedure. It is here that our study makes a departure and concentrates on a focused and recent period (i.e., January 2005 - November 2012), which is free from such issues. In some sense, it is less likely to be subjected to, what in generic term may be called as, the “Lucas Critique”. At the same time, we are aware of two specific limitations of the study. First, high frequency data are often more noisy and hence signal extraction could be difficult. But monetary policy also functions in such a noisy data environment, and hence, a priori, a high frequency model is expected to be more useful. Second, ours is a story of integration among different segments of financial markets and impact of monetary policy on them. We are, thus, quite contracted in our focus – we do not consider variables such as output, prices, or even fiscal policy, all of which could impact financial markets and monetary policy decisions. Put differently, we are confined to a partial equilibrium model where the market players in a particular segment of the financial market are concerned only with what is happening in other segments and monetary policy. But such a caricatured world might perhaps capture the very short-run and may be representative of the behaviour of the typical financial market player on a day-to-day basis. In the financial markets, where it is often joked that, “a long term investment is a short term investment that failed”, we thought our emphasis on the day-to-day activities may not be entirely misplaced. Rest of the paper is organized as follows. Section 2 gives a bird ’s eye review of the relevant literature. While issues related to financial market microstructure in India are discussed in section 3, some stylized facts on inter-temporal behaviour of rates in different segments of the financial markets are taken up in section 4. Section 5 is devoted to the extent of market integration and its relationship with monetary policy. The econometric results are discussed in section 6. Section 7 concludes the paper.2. Received Literature: A Synoptic Review There have been two distinct strands of literature on financial markets integration, viz., domestic and international. Typically the studies on international financial market integration look into the movement of a similar type of market across different countries; for example, the relationship between Sensex and Nasdaq would be classified as a study on international stock market integration. Such studies typically would use the covered / uncovered interest parity condition to formalize the law of one price across geographical or political boundaries. In this paper we refrain from studying this issue.6 Instead our primary interest is confined to the extent of integration across different segments of domestic financial markets – that is to say we confine our attention to issues like how does a change in call money rate influence the yield on a ten year G-Sec. We will have a quick rundown of the studies done in the Indian context. In terms of methodology, most of these studies probe into the issue of existence of a co-integrating relationship between a subset of interest rate / yield variables in the different segments of the financial market. Dhal and Bhoi (1998) in one the early studies on the subject studied the extent of domestic financial market in the initial years of reforms (viz., over April 1993 – March 1998). Using monthly data, they found that although fully competitive environment was yet to emerge, several segments of the financial market have achieved operational efficiency. In particular, India's financial markets were getting increasingly integrated at the short-end of the market, such as, money market, credit market, Government securities market. However, capital market is least integrated with the rest of the financial sector; there were also early indications about integration of money market and forex market. However, integration of domestic and overseas financial markets has not been found to be robust. Similar results are obtained by others as well (e.g., Pattnaik and Vasudevan, 1999). Nag and Mitra (1999) got similar results using the technique of Artificial Neural Network. Using monthly data from January 1993 to December 2002, Jain and Bhanumurthy (2005) examined the issue of financial market integration. In particular, they tested for existence of a cointegrating relationship between 91-day Treasury bill rates, call money rates and Indian Rupee/US dollar exchange rate (ER) as a measure of returns in the domestic financial markets and the LIBOR (used as the measure for the foreign interest rate). The study found that there was a strong integration of the domestic call money market with the LIBOR. Though, the study found that there is a long-term co-movement between domestic foreign exchange market and LIBOR, it is statistically insignificant. As the Government securities market in India was still in the development stage within the sample period, it was not found to be integrated with the global markets. RBI (2007) delved into the issue of financial market integration in detail. From the correlation structure of the rates in different segments of the financial market, the evidence of growing integration of financial markets beginning 2000 comes out. Interestingly, while in the money market segment, there is evidence of stronger correlation among interest rates in the more recent period 2000-06 than the earlier period 1993-2000, the sharp improvement in correlation between the reverse repo rate and money market rates in the recent period implies enhanced effectiveness of monetary policy transmission. The equity market, however, appeared to be segmented with relatively low and negative correlation with money market segments. Thus, it concluded, “Domestic financial market integration in India has been largely facilitated by wide-ranging financial sector reforms introduced since the early 1990s. Financial markets in India have acquired greater depth and liquidity; in the process, various market segments have also become better integrated over the years” (p. 312). Bhattacharyya and Sensarma (2007) examined the efficacy and robustness of alternative monetary policy instruments in transmitting the policy signals and its impact on different segments of the financial market in India. Employing a Structural VAR model with monthly data over a 10-year period (April 1996 – March 2006), they segregated the whole period into pre-liquidity adjustment facility (LAF) and post-LAF and tried to ascertain the relative importance of alternative instruments like Bank rate, CRR or the repo rate. They found “increasing evidence of market integration between the money, the foreign exchange and the government securities market, particularly at the short-end; although the term structure turned out to be somewhat segmented, transmission across the yield curve was in evidence”. Using monthly data, Singh (2011) in a recent study examined the pass-through as well as asymmetric response of policy interest rates to financial markets for the period March 2001 through October 2011. Using the framework of distributed lag model, the study found that short end of the financial market display a significantly high instantaneous pass-through in response to changes in the monetary policy rates. The study also finds that the prevailing liquidity conditions in financial markets also play an important role in conditioning the pass-through of policy rate changes to short end of the financial market. However, the bank deposit and lending rates exhibit relatively longer lags in transmission. The study also found significant asymmetry of transmission of policy rate changes during the surplus and deficit liquidity conditions, particularly at short end of financial markets using the VAR model.7 To analyze the dynamic effects of monetary policy shocks on financial markets, RBI (2011) constructed an SVAR model with the following variables, viz., policy rates (Repo, Reverse Repo, corridor width); overnight money market rate (call money, weighted average of call money, CBLO and market repo rates), CD/CP rates; and bond market (91-day t-bill rate). The model has been estimated using weekly data separately in liquidity deficit (Net LAF is negative between December 2006 and November 2008) and liquidity surplus (Net LAF is positive between April 2001 and December 2006, and December 2008 and May 2010) conditions. The identification conditions are as follows. First, Central bank does not respond contemporaneously to shocks to financial market rates. Second, policy rates are determined independent of corridor width. Third, overnight money markets respond immediately to changes in policy rates and other rates with a lag. Fourth, CP/CD rates are sensitive to policy rates and overnight money market movements. Fifth, bond yields are sensitive to policy rates and money market movements. In such a framework, the empirical exercise indicate that, “though the impact of the interest rate channel of monetary transmission varies across the segments of the financial market, it is the strongest in the money market (RBI, 2011; p. 48-49)”. The monetary transmission turned out to be substantially more effective in a deficit liquidity situation than in a surplus liquidity situation. To sum up, most of these studies using cointegration related technique tried to discern the market integration patterns over a fairly long period time in which the monetary policy operating procedure might have undergone changes. In spirit our study is very to the model developed in RBI (2011) and we develop a structural VAR (SVAR) model using high frequency data. But as a prelude to construction and discussion of such a SVAR model, we delve into the generic issues related to financial market microstructure. 3. Financial Market Development in India As a prelude to answer the two questions raised in the introduction, this section gives some details on financial markets microstructure in India. Our attention is confined to four key segments, viz., money, bonds (G-Sec and corporate debt), forex and stock markets. In the last two decades of economic reforms, the financial markets in India has come a long way from being a underdeveloped market to a reasonably well developed, transparent and an efficient market. The Government of India, the Reserve Bank of India (RBI) and Securities and Exchange Board of India (SEBI) all have taken a proactive role in the development of financial markets within their respective domains. Money Market Walter Bagehot started his book Lombard Street (1873) with, “A notion prevails that the Money Market is something so impalpable that it can only be spoken of in very abstract words and that therefore books on it must always be exceedingly difficult. But I maintain that the Money Market is as concrete and real as anything else” (Para 1.1). He was perhaps emphasising the opaqueness of the money market. Money market, being the overnight market, is crucial for the RBI, as its monetary policy is first transmitted to it. Money market is the key link in the transmission mechanism of monetary policy to financial markets and finally to the market economy. What follows below is a quick run-down of the different constituents of money market. An analysis of different segments of the money market reveals increasing importance of collateralized segments (Table 1). Call money market Call money market is the uncollateralised market, where the funds are borrowed and lent for a very short period i.e., usually a day. During 1974 to 1988, the call money market was inhibited by the ceiling interest rate, which was administered by Indian banks’ association (IBA) to prevent abnormal rise in the call rates. The call money market, however, continued to show high volatility on account of the predominant lending by non-banks and chronic borrowing by banks. The high volatility in the call money market also inhibited the proper risk management and pricing of instruments. With the introduction of collateralised money market segments, the share of call money market has reduced in the recent year. Currently, the share of call money market in aggregate money market transactions is around 29.0 per cent only. Collateralised Borrowing and Lending Obligations (CBLO) The CBLO in some sense is unique to the Indian money market. This product was developed by the central counterparty, the Clearing Corporation of India Limited ( CCIL) and was introduced on January 20, 2003. The facility was introduced with a view to provide avenues for non-banks and banks to manage their day-to-day liquidity. CBLO is a discounted instrument available in electronic book entry form for the maturity period ranging from one day to 90 days. Transactions are backed by collaterals in the form of Central government securities and treasury bills with a residual maturity of six months. CCIL acts as the Central Counter party and members borrow and lend funds through the anonymous trading system. Since the CBLO is collateralized, the rates in the CBLO market are, in general, below the call money market rate. With the development of CBLO market, there has been substantial migration from uncollateralised market to it. Currently, the CBLO market accounts for around 51.6 per cent of the market share in the money market. Market Repo Market repo is another facility for banks and non-banks to manage their short-term liquidity mismatches. Market repo operates outside the RBI’s liquidity Adjustment Facility (LAF) and transactions are backed by collaterals. The collaterals accepted in the market repo facility are central government dated Securities, treasury bills and state government securities. Earlier, market repos were permitted only among banks and PDs. In order to broaden the repo market, the RBI allowed all non-bank entities maintaining subsidiary general ledger (SGL) account to participate in the market. Further, the RBI also allowed NBFCs, MFs, Housing Finance Companies (HFCs) and insurance companies not holding SGL accounts to undertake repo transactions from March 2003, through their ‘gilt account’ maintained with the custodians. “The measures taken by the RBI have widened and deepened the money market in terms of instruments and participants, enhanced transparency and improved the signalling mechanism of monetary policy while ensuring financial stability” (RBI 2007, Table 2). The overnight interest rates in the money market have more or less remained within the informal corridor of LAF.8 The stability in call money rates also helped to improve integration of various money market segments and thereby effective transmission of policy signals (Mohanty 2010). Bond Market From the standpoint of the issuer, there are two distinct constituents of the bond market, viz., Government securities market and corporate debt market. In deference to their distinctness and differing degree of development in India, we will discuss them separately. Government Securities Market Prior to 1990s, the government securities market was underdeveloped and constrained on account of unlimited automatic monetization of the central government budget deficits, interest rate on government securities were administered and were kept low to ensure low cost of government borrowing (RBI, 2007). Further, the market for government securities was a captive one where the players were mainly financial intermediaries such as banks and LICs, who had to invest in government securities to fulfil high statutory reserve requirements. The first major reform was the introduction of auction based system for issuance of government securities in 1992, which signalled the transaction to a market related interest rate system. The abolition of automatic monetization through ad-hoc treasury bills and the introduction of ways and means advances (WMA) system from April 1997 also provided operational autonomy and greater market orientation for government securities (RBI, 2007). The statutory liquidity ratio (SLR), which signifies the captive market for government securities, was decreased from the peak rate of 38.5 per cent of net demand and time liabilities (NDTL) in February 1992 to 25 per cent in October 1997. Right now, the SLR has been further reduced to 23 per cent of NDTL for banks. The RBI has introduced the primary dealers (PDs) as market makers in the G-Sec market. PDs ensures the success of the G-Sec auction in the primary market through underwriting but also act as market makers in the secondary market by providing continuous two-way quotes. The PD system also facilitates open market operations of the RBI, besides taking over the responsibility of market making from the RBI (RBI, 2007). The various reforms initiated by the RBI have ensured successful completion of market borrowing programmes of both the central government and the state governments. The daily volatility of the yields has been declining indicating, inter alia, maturity of the government securities market (Gopinath, 2008). With the issuance of long-term securities, the yield curve has emerged for across 30 year maturity (Chart 1). “Thus the government securities market in India has witnessed a transition to an increasingly broad-based market, characterized by an efficient auction process and an active secondary market” (Mohan, 2007). Notwithstanding these improvements, the government securities market continued to be illiquid at the long end. Further, the major investors in the government securities are institutional investors, who hold securities to maturity, on account of statutory prescriptions, which makes the market illiquid. With the permission to FIIs to invest in dated government securities and T-bills with certain specified limits, the secondary market is expected to be more liquid. Corporate Bond Market A well–developed bond market is important to ensure a well-integrated financial system. Before the 1990s, the corporate bond market was dormant on account of control on the interest rates for corporate bonds as well as limited issuances in the market were also dominated by public sector companies (issuers) and banks (buyers) (Rajaram, et al 2011). The first reform in the corporate bond market was the abolition of ceiling interest rate for corporate bonds on May 1992. Thought, the primary issuances have been significant, most of these were accounted for by public sector financial institutions and were issued on a private placement basis to institutional investors. The secondary market, therefore, has not developed commensurately and market liquidity has been an issue (Reddy, 2007). Major reforms have started in the corporate bond market following the recommendation of the High Level Committee on Corporate Bonds and Securitisation (Government of India, 2005) on corporate debt market in India. The corporate bond market in India continues to be nascent despite measures taken from time to time over the past fifteen years based on the recommendations of several official committees. However, in recent years, the corporate bond market has shown significant growth in terms of outstanding stock and volumes traded in the secondary market (Table 3). Much of the increase in volumes has come in the OTC segment of the corporate bonds as reported in the reporting platform developed by the Fixed Income, Money and Derivatives Market Association (FIMMDA). Forex Market The Indian forex exchange market was virtually nonexistent from the 1950s to 1970s as India was using trade controls to foster import substitution. The origin of forex market can be traced to the year 1978, when banks in India were allowed to undertake intra-day trade in foreign exchange (RBI 2007). But the market was very limited as India followed a fixed exchange rate system. In the 1990s, as in other segments of financial markets, various reforms were taken in the foreign exchange market. The introduction of market-based exchange rate regime in 1993, adoption of current account convertibility in 1994, and substantial liberalization of capital account over the years were the most important reforms in the forex market. The RBI and the Government implemented various committees’ recommendations towards relaxation of restrictions to vitalize the foreign exchange market. The reforms in the forex market were focused on dismantling controls, developing the institutional framework and increasing the instruments for effective functioning, enhancing transparency and liberalizing the conduct of foreign exchange business (RBI 2007). Market participants have been provided with greater flexibility to undertake foreign exchange operations and manage their risks through simplification of procedures and availability of several new instruments (Mohan, 2007). At present, the foreign exchange (forex) market is divided into two segments: over the counter (OTC) market (which includes spot, forwards and swaps) and exchange-traded currency futures. The BIS Triennial Central Bank Survey of Foreign Exchange and Derivatives Market Activity in 2010 estimated that the percentage share of the rupee in total foreign exchange market turnover covering all currencies increased from 0.3 percent in 2004 to 0.7 percent in 2007 and further to 0.9 per cent in 2010. In the spot market, currencies are traded at the prevailing rates and the settlement is done by cash (T+0) or Tom (T+1) or spot (T+2). Among the forex market, the spot market continues to be the dominant in India. Within the OTC foreign currency segment, the spot market has remained the most active accounting for almost 48 per cent of the total turnover, followed by swaps (29.5 per cent) and forwards (22.5 per cent) (Table 4).9 As a result of various reforms, the liquidity in the foreign exchange market has increased manifold over the years. The efficiency of the market has also increased, as is reflected in the narrowing of bid-ask spread for USD-INR rupee (Chart 2). The forward premia is generally aligned with the interest rate differential, reflecting growing market efficiency (Mohan 2007). However, still there are issues such as transparency in the currency market from the view point of customers, as banks do not unbundle the price on the currency market as opposed to their intermediation fee (Shah et al 2008). The banks also charge very high intermediation costs Stock Market Before the initiation of economic reforms in the early 1990s, the Indian stock market was governed by a plethora of complex regulations and extensive restrictions. The economic reforms in the capital market were started with the establishment of securities and exchange board of India (SEBI). The reforms have focused on the regulatory effectiveness, enhancing competitiveness, reducing information asymmetries, developing modern technological infrastructure, mitigating transaction cost in the securities market (Mohan 2005). As part of the reforms, the foreign institutional investors (FIIs) were allowed in 1992 to participate in the market, the Indian corporate sector were allowed to raise funds in the international market through American depository receipts (ADRs) and global depository receipts (GDRs), foreign currency convertible bonds (FCCBs) and external commercial borrowings (ECBs), investment in Indian companies by non-resident Indian (NRIs) and overseas corporate bodies (OCBs) subject to certain conditions. The introduction of national stock exchange (NSE) in 1994 increased the competition in the market leading to significant rise in the volume of transactions. In the exchange- traded market, Index futures were introduced in June 2000, followed by index options in June 2001, and options and futures on individual securities in July 2001 and November 2001, respectively. The various reforms had a great impact on the Indian capital market and it has become one of the fastest growing capital markets in the world. Today, the Indian stock market size is around 70 per cent of the GDP, which is comparable to other emerging market economies (EMEs). Indian stock market such as large cap stocks/futures and index futures have liquidity and efficiency, the two critical features of the well functioning market (Government of India, 2008). The introduction of exchange traded derivative instruments such as options, futures in 2000 has enabled investors to better hedge their positions and reduce risks. As of March 2011, the NSE traded in futures and options on 223 individual stocks and four stock indices. All these derivative contracts are settled by cash payment and do not involve physical delivery of the underlying product. FIIs have an increasing presence in the equity derivatives markets and currently contribute around 22 per cent of the market turnover. Where do all the details of market microstructure lead us to? A priori, we expect certain kind of integration between domestic financial markets based on the commonality of key players in the market as well as nature i.e., short or long-term nature of firms (RBI 2007). We expect that the money market and forex market to be integrated, on account of short term nature of both markets as well as key role played by the commercial banks in both these markets. We also expect certain integration between the money market and government securities market, even though money market is short term and government securities is long term, on account of dominant role played by the commercial banks in both these markets, as well as, at times, government borrowings are funded through sale of short term government securities such as treasury bills. We also expect certain integration between the forex market and the stock market on account of key role played by the FIIs. The FIIs investments in stock markets have increased over the period and they play a major role in the segment. With the increased exposure in the stock market, they may hedge their exposure in the foreign exchange through the forward market. We also expect close integration between government securities yield and yield on corporate bonds, as government securities yields are the risk free assets and corporate bonds are priced over and above their risk free government securities yields based on their risks. 4. Inter-temporal Behaviour of rates in Financial Markets: Some Stylized Facts To begin with, some details on the data used in rest of this study are in order. For the domestic market integration, we have used the following variables from the four market segments:
These apart, for the monetary policy transmission, we have derived effective monetary policy rate using the repo Rate, reverse repo rate and amounts under the net liquidity adjustment facility (LAF). As far as source of the data are concerned, while all the money market rates are taken from the CCIL, other market rates are taken from the Bloomberg. The data on monetary policy were taken from the Handbook of Statistics on the Indian Economy of the RBI. Inter-temporal Behaviour of Financial Market Rates The Indian financial markets, during the period under study (January 2005-November 2012), in general, remained orderly, even though at periods, it was affected by certain external events such as global financial crisis (Chart 3). The call money market, in general remained orderly, and was influenced by the liquidity in the system as well as the monetary policy measures. The CBLO and money market rates also showed same trends albeit at a lower rate than the call money rates. The periods in which there was some volatility in the money market rates during the period under study are briefly described below. During January to March 2005, the call money rates firmed up due to the redemption of the India Millennium Deposits (IMDs) amidst sustained credit growth and build-up of cash balances by the Government of India. The period March 20 – 30, 2007 witnessed abnormal situation in money market. After easing to below the reverse repo rate between March 5-15, 2007, the call rate hardened substantially and averaged 28.3 per cent during March 20-30, 2007 and reached an intra-year high of 54.32 per cent as on March 30, 2007. Various factors are attributed to this abnormal movement in call rates, such as tightening of liquidity conditions due to advance tax outflows, year-end considerations, sustained credit demand and asymmetric distribution of holdings of Government securities across the banks (RBI, 2007). The money market reached its normalcy with the beginning of the new financial year on April 1, 2007. Again during end-May to July 2007, the call rate eased significantly and on a number of occasions in June 2007 it was below one per cent, mainly due to liquidity emanating from Government expenditure and the RBI’s foreign exchange operations. After the withdrawal of daily reverse repo ceiling effective August 6, 2007, the rates in the overnight money market increased in August 2007 (RBI 2007-08), to around the reverse repo rate. During the financial crisis, on account of liquidity supporting measures taken by the RBI, the call money rates eased significantly during October 2008 to May 2010 period. From June 2010 onwards, the call money rates moved up reflecting the tight liquidity and the monetary tightening measures taken by the RBI to curb inflation in the economy. Yields in the Government securities market generally hardened from January 2005 to August 2008, but declined sharply thereafter following the monetary easing by the RBI due to global financial crisis. But from 2009 onwards, the government securities yield started hardening again reflecting the increase in the government market borrowings, inflation persistence and policy rates hikes by the RBI. The 10-year corporate bond market yield also followed the same trend as of the government securities yield. In the foreign exchange market, the Indian rupee exhibited two-way movements during the period under study. The exchange rate, which more or less remained stable during 2005-06, started appreciating from mid-July 2006 onwards mainly due to capital inflows into India. During mid- 2008 to mid- 2009, the exchange rate depreciated against the US dollar, as Reserve Bank followed expansionary monetary policy in the aftermath of the global financial crisis. Thereafter, the exchange rate started appreciating reflecting the inflow of capital and monetary policy tightening on account of persistence of inflation. Towards the end of 2011, the exchange rate depreciated reflecting adverse global sentiments and moderation in capital flows. The capital markets were buoyant and reached highs during August 2008, driven by increased interest by domestic as well as foreign investors on the back of strong macroeconomic fundamentals. With the impact of global financial crisis being felt in India, the capital market was in a subdued mood during August 2008- April 2009, but thereafter it started becoming buoyant as foreign investors were attracted by the high return and higher growth story of the Indian economy. However, subsequently, during September – December 2011, reflecting dampened global sentiments on account of Euro zone debt crisis, the stock market declined. The descriptive statistics of these variables reveal a number of interesting trends (Table 5). The coefficient of variation of money markets and stock markets are higher than bond and forex market. The skewness is positive for call rate, exchange rate and 10 year AAA corporate bond yield, while other financial market variables are negative, indicating that there is an asymmetry of the probability distribution. All the variables except CBLO, market repo and stock price displays a kurtosis of more than 3, thus indicating the density function is characterised by fat tails. 5. Monetary Policy and Financial Markets in India Interestingly, a key consideration in the extent of monetary policy transmission to financial markets and onwards to the real sector is the integration of the financial markets. If the markets are weakly integrated, the transmission may not be effective, and may force monetary authorities to act separately in each segment of the financial markets. If the market is greatly integrated, the monetary policy transmission is fast to the financial markets, which can have the desired effect in the real economy. Thus, degree of integration plays a key role in the effective transmission of monetary policy signals. What has been the extent of association among the rates in the different segments in the financial markets? Towards understanding this, a useful tool could be the simple correlation structure of rates / indices in the various financial market segments. Correlation Structure The correlation structure for the whole period (i.e., January 2005-November 2011) shows that there is stronger correlation among money market rates (i.e., call rate, CBLO rate and market repo rate) and are very significant (Table 6). The high correlation also indicates improvement in efficiency in the operations of financial intermediaries trading in different instruments (RBI, 2007). The money market instruments and 10 year government securities yield show moderate correlation, as money market is a short term and the 10 year G-sec is a long term market, even though dominant role played by commercial banks. As expected, there is higher degree of correlation within the bond market i.e., between G-sec market and corporate bond market. The exchange market is positively correlated with all other markets than expected negative sign, but has lower degree of correlation. This could be due to excessive capital inflows to India during the period of study, which could only be partially explained by the interest rate differential between India and foreign countries. The other factors are search of better yield by foreign investors and strong macroeconomic fundamentals in India could have attracted more flows to India. The stock market shows unexpected positive correlation with exchange rate, but the degree of correlation is low. Monetary Policy Stance: A Relevant Digression How is monetary policy conducted in India? Before analysing the behaviour of the monetary policy rates, it may be useful to have a brief overview of the monetary policy operating procedure in India. The objectives of monetary policy in India have traditionally been maintaining price stability while ensuring adequate flow of credit to the productive sectors of the economy; considerations of financial stability have often been taken into account in recent years. As elsewhere, the monetary policy in India endeavours to maintain a judicious balance between these objectives depending on the existing macro-economic developments. It may be useful to go back to history little bit at this juncture. Since the mid-1980s till 1997-98, the RBI had been following a monetary targeting framework based on the recommendations of an internal committee which viewed the existence of a stable relationship between money, output and prices (RBI, 1985). The Committee noted that, “…….the demand for money is, understandably, not found to be very sensitive to interest rates in India in the context of a system of administered interest rates……” and considered changes in broad money as reasonable predictor of average changes in prices. In this framework, annual growth in broad money (M3) was used as an intermediate target of monetary policy (Mohanty 2010). However, with the introduction of economic reforms in the financial sector, and increasing integration with the global markets, many of the postulates that lie under monetary targeting were questioned; illustratively, the assumption of stable money demand function was found to be no longer valid. Accordingly, in 1997, the RBI adopted a "multiple indicator approach", under which, a variety of indicators including high frequency financial market rates such as call rate, exchange rate etc, fortnightly/ monthly indicators such as deposit and credit growth, inflation, fiscal, trade and currency etc along with output data are tracked, for monetary policy purposes.10 The operating procedure of monetary policy also underwent a sea-change following the financial sector reforms as well as unprecedented capital flows in the 1990s. In the pre-1990s period, the preponderance of direct instruments of monetary policy such as interest rate regulations, selective credit control, CRR and SLR were subsequently changed to the indirect instruments such as interest rates. The RBI introduced the interim liquidity adjustment facility (ILAF) in April 1999, which was subsequently became full-fledged LAF in June 2000, in order to manage the large and persistent capital flows in the late 1990s. Consequently all liquidity management operations were based on OMO in the form of outright purchases/sales of government securities and daily reverse repo and repo operations under LAF. The LAF as a short term liquidity management mechanism has enabled the RBI to modulate day to day liquidity under varied financial market conditions, including that emanating from large capital inflows from abroad. In this new operating environment, changes in the repo and reverse repo rates have become primary instruments for interest rate signalling (Chart 4). Since the 2000s, the persistence of large capital inflows have posed major challenges as the liquidity management through day-to-day LAF and open market operations (OMO) became inadequate, as the stock of government securities available with the RBI declined progressively. In order to resolve the issue the RBI signed a memorandum of understanding with the Government of India in March 2004 for issuance of Treasury Bills and dated government securities for issuance under the Market Stabilisation Scheme (MSS). The intention of MSS is essentially to differentiate the liquidity absorption of a more enduring nature by way of sterilisation from the day-to-day normal liquidity management operations. The ceiling on the outstanding obligations of the Government under MSS has been initially indicated but is subject to revision through mutual consultation. The issuances under MSS are matched by an equivalent cash balance held by the Government in a separate identifiable cash account maintained with the RBI. The operationalisation of MSS to absorb liquidity of more enduring nature reduced the burden of sterilisation on the LAF window considerably. The MSS experience makes us believe the fact that the operating framework and procedures may not remain fixed but undergo changes contextually, and one needs to keep innovating to calibrate market operations to the evolving liquidity conditions. In May 2011, based on the Report of the RBI Working Group on Monetary policy operating procedures (RBI, 2011), the RBI has introduced a new operating procedure. The weighted average overnight call money rate is now the operating target of monetary policy. The repo rate is the only one independently varying policy rate. A new marginal standing facility (MSF) has been instituted from which SCBs can borrow overnight up to 1.0 per cent of their respective NDTL at 100 basis points above the repo rate. With the above changes, the revised LAF corridor has a fixed width of 200 basis points. The repo rate has been placed in the middle of the corridor, with the reverse repo rate 100 basis points below it and the MSF rate 100 basis points above it (RBI Annual Report 2010-11). Thus, monetary policy in recent period has evolved with the changes in the financial sector and the increasing integration of the Indian economy with the global economies. Monetary Policy: A Phase-wise Analysis The monetary policy within the period under consideration can be broadly classified as some distinct phases in terms of presence or absence of liquidity in the Indian financial system (Chart 5). There are distinctive phases when liquidity was in surplus mode (as measured by net absorption of liquidity by the RBI through LAF) and when liquidity was in deficit mode (measured by net injection of liquidity by Reserve Bank through LAF). Four phases can be identified in particular: (a) the first phase from January 2005 to November 2006 is characterised by liquidity surplus, as there was absorption of liquidity by the RBI through LAF operations; (b) the second phase from December 2006 to November 2008 is characterised as liquidity deficit; (c) the third phase during December 2008 to May 2010 is characterised as liquidity surplus; and (d) the fourth and final phase for June 2010 to November 2012 is characterised as liquidity deficit.11 We will delve into some details of these four phases below. First liquidity surplus phase (January 2005 to November 2006) During this period, the monetary management was focused on managing the transition to a higher growth path while containing the inflationary pressures so that potential output and productivity were firmly entrenched to sustain growth. The monetary policy was tightened gradually on account of inflationary pressures, sustained growth in monetary and credit aggregates, elevated asset prices and capital flows into the Indian economy. During this period, the repo rate and the reverse repo was hiked by 125 basis points each by the RBI. However, there was no hike in the cash reserve ratio (CRR). Despite the gradual contractionary policy adopted by the RBI, the liquidity condition in the system was surplus on account of large capital flows in to India. The monetary policy stance of the RBI during the period, in general, was price stability and maintaining monetary and interest rate environment conducive to growth and financial stability. First liquidity deficit phase (December 2006 to November 2008) The RBI continued to tighten the monetary policy on account of hardening of inflation and inflationary pressures, persistent and unprecedented capital flows. The inflationary pressures and inflationary expectations hardened due to supply side factors such as surge in global prices of commodities, especially food grains, crude oil, and steel as well as domestic demand pressures due to supply constraint in the economy. During this period, the monetary authorities hiked the repo rate from 7.25 per cent in December 2006 to 9.00 per cent in July 2008, while keeping the reverse repo rate constant in 6.00 per cent. The repo rate was reduced by 100 basis points on October 20, 2008 to counter the fallout of intensification of the global financial crisis after the collapse of the Lehman Brothers. The CRR was also reduced to 5.0 per cent in November 2008 on account of the global financial crisis reversing the earlier stance of increasing the CRR from 5.00 per cent in December 2006 to 9.00 per cent in August 2008. The monetary policy stance of the RBI during the period, in general, was price stability, anchoring inflation expectations, maintaining growth momentum and financial stability. Second liquidity surplus phase (December 2008 to May 2010) The contagion of the global financial crisis has spread to India through the financial channel, the real channel, and importantly the confidence channel. The impact on India marked a reversal of RBI's policy stance from monetary tightening in response to heightened inflationary pressures of the previous period to monetary easing in response to easing inflationary pressures and moderation in growth in the current cycle (Subbarao, 2009). Both the Government and the RBI responded to the challenges decisively, swiftly and in close coordination and consultation. The RBI has taken several measures aimed at infusing rupee as well as foreign exchange liquidity and to maintain credit flow to productive sectors of the economy. Measures aimed at expanding the rupee liquidity included significant reduction in the cash reserve ratio (CRR), reduction of the statutory liquidity ratio (SLR), opening a special repo window under the liquidity adjustment facility (LAF) for banks for on-lending to the non-banking financial companies (NBFCs), housing finance companies (HFCs) and mutual funds (MFs), and extending a special refinance facility, which banks can access without any collateral. The RBI has also unwinded securities issued under the market stabilisation scheme (MSS), and broadly synchronised with the government borrowing programme (Subbarao 2008). The substantial reduction in the policy rates and the special liquidity measures conducted by RBI boosted the liquidity in the Indian financial system. The conduct of monetary policy during the 2009-10 was broadly guided by the evolution of policy stance from “managing the crisis” to “managing the recovery” (RBI 2009).12 Second liquidity deficit phase (June 2010 to November 2012) With the emergence of inflationary concerns, the monetary policy stance in 2010-11 changed its course from "calibrated normalisation" to "tightening". Liquidity conditions remained consistent with the shift in monetary policy stance, though some of the key determinants of liquidity remained volatile. The cumulative effect of transient factors (such as, advance tax collections), frictional factors (large government surplus balances) and structural factors (such as, high increase in currency in circulation and higher credit growth relative to deposit growth) culminated in large deficit liquidity conditions, which were managed by the RBI through an appropriate mix of SLR, OMO and LAF (RBI 2011). The monetary policy stance of the RBI during the period, in general, was maintaining an interest rate environment that moderates inflation and anchors inflation expectation, managing the risk of growth falling significantly below trend as well as managing liquidity to ensure that monetary transmission remains effective, without exerting undue stress on the financial system (RBI 2011). Phase-wise Correlation Structure How does the correlation structure look in a phase-wise analysis? Instead of looking at the details of the full correlation matrix for each phase, given the primacy of money market in monetary policy, for the sake of brevity, we wanted to see how the correlation structure between call money rate and other financial market interest rates exists under different liquidity phases. The call money market shows high correlation with other money markets in the first two periods i.e., period 1 and Period 2 and Period 4 (Table 7). However, the correlation between the call money rate and other money market rates declined in the Period 3. This could be due to increased volatility experienced in the money market during the phase 3 on account of global financial crisis.13 The call money market shows positive but low correlation with bond markets during the first two periods. However, in the fourth period, the call money rate and the bond market has shown high degree of correlation. The increased correlation may be due to hike in monetary policy rates, persistence of inflation, and increased government fiscal deficit on account of fiscal measures to tackle global financial crisis. The correlation between the call money rate and the stock market was negatively related in the periods 2 to 4. We have also tried to check the nature of correlation between G-Sec yield and yield on corporate bond. While it is uniformly positive across all periods, its magnitude undergoes considerable changes – in particular, during period III, the correlation between G-Sec yield and yield on corporate though positive and significant turned out to be as low as 0.27. A priori given the role of FII flows into the stock market, one would expect a negative correlation between the exchange rate and Nifty index (given that exchange rate is defined as Rupees per USD and an increase would indicate depreciation). While this is true for all the three periods 2 – 4, for the first period it is positive. This could be indicative of the limited role played by foreign institutional investors in the stock market during this period. 6. Monetary Policy Transmission across different segments of financial market: Results from a Structural Vector Autoregression (SVAR) Model When it comes to quantitative evidence on monetary policy transmission across different segments of financial market, one finds typically three strands in the literature: (a) event studies; (b) cointegration analysis between the market segments; and (c) structural VAR (SVAR) modelling between different segments of financial market. While rich in details, event studies often fail to throw up the general broad trends and miss trees for the woods. Thus, we were left with the two choices: a cointegrated VAR (and its error correction version) or a SVAR.14 Between the paradigms of cointegration and SVAR modelling, we preferred SVAR. There are two specific reasons for this. First, analytically cointegration is a long run concept - and we felt the span of around eight years (January 2005 – November 2012) is not sufficiently long to treat it for discerning a cointegrating relation.15 Furthermore the continuous time specification ensures that the discrete time model satisfied by the observed data is independent of the sampling frequency, a feature that is not always true in temporal aggregation of discrete time models (Chambers, 2011). After all, having high frequency data is no substitute for the length of the period. Second, it can be argued that the specification of a dynamic model in levels has proved sufficient to remove the spurious regression problem and that the VECM representation of a VAR model in levels is just a reparamterization, before the rank reduction restrictions are imposed (Fevaro, 2001). In fact, it has been pointed out that a VAR model in levels in the presence of cointegration is over-parameterized and, therefore, leads to inefficient but consistent estimates of parameters of interest (Sims, Stock and Watson, 1990). The loss of efficiency has to be weighted against the risk of inconsistency of estimates which occurs when the wrong cointegrating restrictions are imposed. Sims, Stock, and Watson (1990) further showed that standard distributions can be applied when doing an inference in a VAR model which involves variable admitting stationary linear combinations, reverting to non-standard distributions only when the subsets of variables on which inference is performed do not admit any stationary linear combination.16 Thus, co-integration among the markets essentially involves an error correction mechanism and implies that the cointegrated variables tend towards an equilibrium situation for that the divergence between their values keep on vanishing in the short-run. This adjustment by the market interest rates may lead to arbitrage opportunities and hence inefficiency in the market. In fact, cointegration and other standard measures of degree of market integration could actually show the linkage among the markets and that closer linkages do not necessarily imply higher financial market integration (Ayuso and Blanco, 1999). Besides, strength of the SVAR framework is that it allows one to explore the dynamic linkages in an empirical model and its relationship with the underlying theoretical / prior foundation. The dynamic linkages are represented in the form of impulse response functions, which are easy to interpret..17 The reduced form VAR We begin with estimating reduced form VARs for the four sub-periods separately, with a set of variables comprising the effective policy rate (i.e., repo or reverse repo depending on the period), call rate, 10-year G-Sec yield, 10-year corporate bond yield, rupee-dollar exchange rate and Nifty, of the form: These apart, we have included a constant term as well as a fortnightly dummy to reflect the behaviour of money market. The fortnightly seasonality of Indian money market and the inclusion of the relevant dummy in the VAR need some clarification. The banks usually frontload the CRR maintenance reserves at the start of the fortnight and drawdown in the second week. So on the closing Friday, the banks generally have surplus funds in their hands. Further, CBLO liabilities are eligible for cash reserve ratio maintenance, hence banks generally do not prefer CBLO market on a reporting Friday. So the rate and the volume in CBLO generally go down on the reporting Friday. In estimating the reduced form VAR models, we also faced the typical Hamletian dilemma whether to difference the variables or not. After all, if the variables are found to be non-stationary, there is a view that they need to be differenced. But there is yet another influential view that specifying a VAR in differences would amount to losing information on the co-movement among the variables which, in fact, is our primary interest (Brooks, 2002). Furthermore, it has been established that while VARs with non-stationary variables incur some loss in the estimator’s efficiency, the consistency properties of the estimators remain in tact (Sims, Stock and Watson, 1990). Even in case of loss in efficiency of estimates, differencing the variables has not been recommended since the goal of VAR analysis is to study inter-relationships among variables and not to determine efficient estimates (Sims, 1980).18 We were in two minds whether to include a stock price index in our choice of the vector r. There was an influential view that central banks would hardly care for asset prices. This is best known as ‘the Greenspan orthodoxy’. The crisis has, however, cast a serious doubt on the credibility of the ‘Greenspan orthodoxy’. In fact, in recent symposium on "Should, or Can, Central Banks Target Asset Prices", twenty economists gave their views that ranged from benign neglect to active consideration.19 Nevertheless, irrespective of the importance of asset prices in the central bankers' toolbox, our choice to include stock prices in the SVAR model is dictated by more agnostic considerations and has been motivated primarily by our quest to understand the transmission of monetary policy across financial markets. While estimating the first step VAR models, two issues are important: (a) lag structure; and (b) serial correlation. While the lags are selected on the basis of the AIC criteria, issues relating to serial correlation are more tricky. After all, serial correlation could be indicative of missing variables or resultant misspecification bias. Towards this, we have examined for both portmanteau autocorrelation test and autocorrelation LM test in all the four VARs. In all the cases, for most of the lags, we are able to accept the null hypotheses of no residual correlation (Portmanteau test) and the null hypothesis of no serial correlation (LM test). The SVAR Model and the Identifying Restrictions 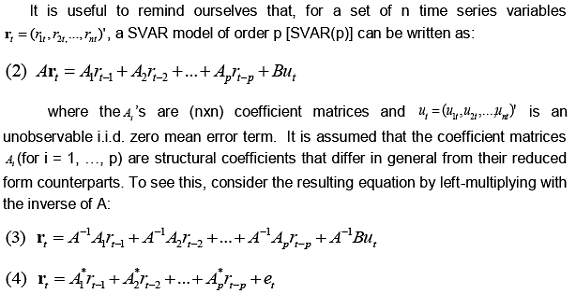 A SVAR model can be used to identify shocks and trace these out by employing impulse responses and/or forecast error variance decomposition through imposing restrictions on the matrices A and/or B. Incidentally, though a SVAR model is a structural model, it departs from a reduced form VAR(p) model and only restrictions for A and B can be added. The restrictions on the A and B in the SVARs are as follows.20 The Financial Market VAR described in equation (1) needs to be identified with structural restrictions, so that we can perform the impulse response analysis in terms of the structural innovations. The relationship between reduced form innovation (et) and structural innovations (ut) is as follows: 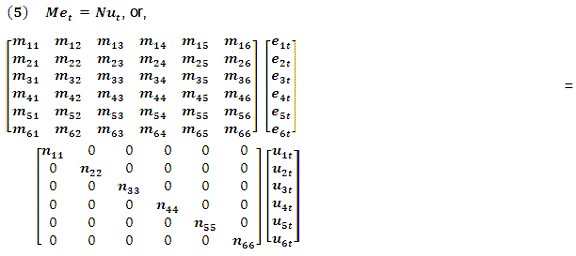 For identifying restrictions, based on the stylized facts presented so far we assume the following. While innovations in policy rate are self-determined, innovations in call rate are determined by policy rate; innovations in 10 year government securities rate is determined by policy rate and call rate; innovations in 10 year corporate bond yield is determined by policy rate and 10 year government securities rate; innovations in market exchange rate is determined by policy rate, call rate, g-sec rate and corporate bond yield and innovations in nifty is determined by policy rate and market exchange rate. These restrictions are in general in tune with the block exogeneity Chi-squared Wald tests. As explained we have run four such SVAR models corresponding to four distinct periods. Thus, in terms of (5), the identifying restrictions are: 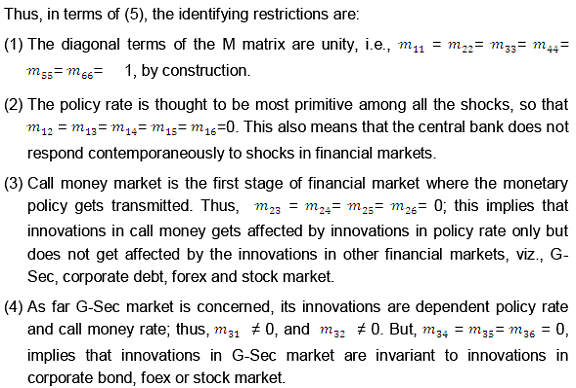 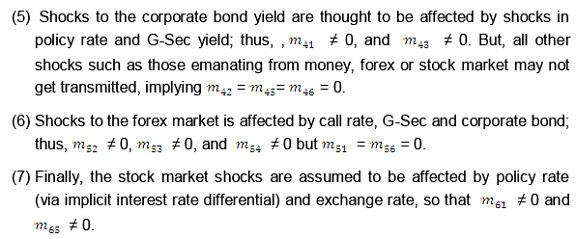 It should be noted that while these identifying restrictions are primarily based on institutional details, these are not necessarily atheoretical. After all, term structure theories would predict transmission of policy shocks from the short-end to the long-end of the market. Besides, the restrictions also emanate from the market microstructure and the implied restrictions on mobility of funds across different segments of financial markets that we have described earlier in section 3. Impulse Response Functions for the Four Periods21 The impulse responses of structural VAR for the first period, show that a positive shock to the effective policy rate, where the policy rate is reverse repo, in general, leads to increase in the call rate (Chart 6A). The peak effect was occurring in three days – thereafter, the effect was moderated, but still maintained the positive increase. The impulse response function of 10 year G-Sec yield shows that it increases after a positive shock, reaching peak effect in 2 days, thereafter, declines and shows negative effect during the subsequent period. In the case of corporate bond yield, the monetary policy shock shows that it has positive shock and its effect is seen within the month. In the case of exchange rate, the monetary policy shock does not show any effect on first few days, but within the month it affects in the positive way, i.e., the increase in policy rates leads to appreciation of exchange rate. However, in the case of stock market, the positive shock in the policy rate, not lead to decline in stock market, but it actually increases. This could be due to high inflow of FII inflows during the period amounting to Rs. 87,541 crore. As regards the positive shock to the call money market rate, the impulse response function shows desired effect on all the other markets i.e., 10 year G-Sec yield, 10 year Corporate Bond yield, and exchange rate except stock market prices. Thus, combining the effect of monetary policy shock and call money rate shock, it shows very high transmission to other financial market rates except the stock prices. In the second period, being liquidity deficit period, the effective policy rate is the repo rate. The positive shock to the Repo rate, instantly impacted the call money rate with the peak effect reached on the same day, and thereafter the impact declines showing only very moderate effect (chart 6B). This result could be due to the fact that towards the end of the period i.e., September-November 2008, the RBI took a number of measures to boost liquidity in the system. The positive shock in the Repo rate does show negative impact rather than expected positive impact, on the 10 year G-Sec yield during 3-6 days, thereafter, it shows mean reversion. However, in the case of corporate bond yield, the monetary policy shock shows that it is positive in the long run. In the case of stock market, it first increases, but thereafter declines, showing the expected sign. As regards the positive shock to the call money market rate, the impulse response function shows no or little effect on the G-Sec and Corporate yield, but has desired effect on the exchange rate. Again, the stock market prices do not show the expected negative negative sign, implying that money market rates do not affect it. As expected, the shock to G-Sec yield has the positive impact on the corporate bond yield. In the third period, being liquidity surplus period, the effective policy rate is the reverse repo rate. The positive shock to the reverse repo rate, impacted the call money rate with the peak effect reached on the third day, and thereafter the impact declines while retaining the positive impact (chart 6C). The positive shock in the reverse repo rate does show small but positive impact on the G-Sec yield and corporate bond yield, but, thereafter, it declines. In the case of exchange rate, the monetary policy shock actually appreciates the rupee but very marginally. In the case of stock market, it increases rather than declining. As regards the positive shock to the call money market rate, the impulse response function shows very little effect on the G-Sec, but no effect on the corporate yield, exchange rate and stock market prices. In the fourth period, being liquidity deficit period, the effective policy rate is the Repo rate (Chart 6D). The positive shock to the Repo rate impacts all other financial market rates except the forex market. The impulse responses of call rate, G-Sec yield, corporate bond yield and stock market show a very persistent impact. As regards the impulse responses of exchange rate, initially it appreciates on the expected line, but thereafter it shows a depreciation impact. Thus, broadly the evidence seems to be indicating that the transmission of monetary policy works well in the call money rate, as it is impacted immediately with robustness. These results also indicate the primacy of call rate in the money markets and are in consonance with the official RBI stance of treating the weighted average of overnight call money rate as the operating target of monetary policy (RBI, 2011). As regards the other financial market variables except the stock market, we could find evidence of transmission from the monetary policy shocks. The impact of monetary policy shocks on stock market prices, the impulse response shows no effect. This could be due to high alignment of domestic stock market with respect to other international stock markets as well as the role played by the foreign institutional investors. As regards the period-wise transmission of monetary policy is concerned, comparison of the impulse responses gives the following results. First, the transmission was swift and persistent for the fourth period when compared to other periods, where the liquidity was in the deficit mode and the monetary policy was tightened. Next, the transmission was also good in the first period, where the liquidity was in the surplus mode but monetary policy was tightened due to inflationary pressures. Transmission was not on the expected lines for the second and third period, as towards the end of second period was market with economic growth boosting measures to reduce the impact of global financial crisis, and the third period was marked by period of accommodative monetary policy and moderation in growth. Thus, there is asymmetric in monetary policy transmission to financial markets in India, where the monetary policy transmission is faster and persistent when the monetary system is under deficit mode, than otherwise. Variance Decomposition Forecast error variance decomposition examines the role of monetary policy shocks in contributing to volatility in the financial market interest rates. The variance in call rate at 14 day horizon is most explained by call rate, effective policy rate, exchange rate, corporate bond market, G-Sec and Nifty for most of the periods (Table 8). Forecast error variance decomposition shows that the variance in G-sec rate at 14 day horizon is most explained by G-sec, corporate bond yield, stock market, effective policy rate, call and exchange rate, in this order. As regards the variations in corporate bond yield at 14 day horizon is explained by corporate bond yield, G-sec yield, Nifty, effective policy rate, call rate and exchange rate in this order. The variation in rupee dollar exchange rate at 14 day horizon is explained by exchange rate, G-sec yield, Nifty, call rate, effective policy rate and corporate bond yield in this order. The variation in stock market at 14 day horizon is explained by Nifty, exchange rate, G-sec yield, corporate bond yield, call rate, and effective policy rate, in this order. Using a Regime-invariant Measure of Effective Policy Rate While the period wise analysis provides rich documentation on the behaviour of monetary policy, its identification is essentially an ex post phenomenon. Thus, for discerning the monetary policy stance, we choose to depend on a simple rule. Depending on the mode of liquidity conditions (i.e., injection or absorption by the RBI) one can choose the repo or reverse repo as the effective policy rate. Specifically, in a day when net LAF (reverse repo amount – repo amount) is negative, the effective policy rate becomes the repo and when net LAF is positive the effective policy rate of the reverse repo rate (Similar to Patra and Kapur 2010 approach). Thus,  The movements in the effective policy rate are given in the chart 7. The chart shows that there is relatively high variation in the effective policy rate, when compared with only repo or reverse repo rate, which are relatively stable and shows less variation. The chart also shows that the call money market were significantly fluctuating between the surplus liquidity and deficit liquidity in the second period i.e., first liquidity deficit phase when compared to other periods. Before we proceed further in estimating an SVAR with all the segments of the financial market, it is useful to check for the correlation of the effective policy rate with different financial market rates (Table 9). All the rates turn out to be significantly correlated with the effective policy rate but exchange rate and Nifty shows positive rather than expected negative sign. The impulse response using the synthetic effective policy rate shows that the shocks in the monetary policy have expected effects on the financial markets (Chart 8). The positive shock to the policy rate leads to increase in the call rate and the corporate bond yield, with the peak effect occurring on 2nd day of the policy shock for call rate and 13th day of the policy shock for corporate bond yield. The positive shock to the policy rate increases the g-sec rate after 10 period lag. The positive shock to the policy rate initially appreciate the exchange rate marginally, but thereafter, the exchange rate continues to depreciate. The positive shock to the policy rate leads to increase in the Nifty by the third day, but thereafter the effect tapers off, showing some sort of mean reverting nature. Forecast error variance decomposition shows that the variance in G-sec rate at 14 day horizon is most explained by G-sec, corporate bond yield, effective policy rate, call, exchange rate and nifty in this order (Table 10). As regards the variations in corporate bond yield at 14 day horizon is explained by corporate bond yield, G-sec yield, nifty, effective policy rate, exchange rate, and call rate in this order. The variation in rupee dollar exchange rate at 14 day horizon is explained by exchange rate, Nifty, G-sec yield, call rate, corporate bond yield, and effective policy rate in this order. The variation in stock market at 14 day horizon is explained by Nifty, call rate, corporate bond yield, G-sec yield, exchange rate and effective policy rate in this order. Using CBLO, 5 Year Corporate Bond Yield and Sensex as an alternative indicator for Money, Corporate Bond and Stock Market.22 The impulse response using the synthetic effective policy rate on the alternative indicators for the money, corporate bond and stock market shows that the shocks in the monetary policy have expected immediate effects on the financial markets except Stock market (Chart 9). The positive shock to the policy rate leads to increase in the call rate, G-sec rate and the corporate bond yield. The positive shock to the policy rate initially appreciate the exchange rate marginally, but thereafter, the exchange rate continues to depreciate. The positive shock to the policy rate leads to increase in the Nifty, but thereafter the effect tapers off, showing some sort of mean reverting nature. Introducing CPs and CDs as additional Instruments in the VAR23 The impulse response using the synthetic effective policy rate on the 3 month Certificate of Deposits (CD) rate and Commercial Paper (CP) rate shows the expected result, that is, the shocks in the monetary policy have expected immediate and persistent effects on these market rates (Chart 10). 8. Concluding Observations In the process of fostering financial development in India, policies have been undertaken towards development of appropriate institutions and markets. While there could be questions on the pace of financial development in India, it is by now well-accepted that these policies of financial liberalization have furthered the process of integration among various segments of domestic financial markets. These also have implications for effectiveness of transmission of monetary policy across financial markets. The extent of integration between these segments of financial markets can be studied in pairs and such an analysis may shed interesting light on the nature of financial market integration. The present paper, instead, concentrated on the general nature of integration with a limited number of variables. This could be extended to a larger set that includes instruments like CP, CD and credit market-related intruments like credit derivatives. Furthermore, real sector variables like GDP as well as prices could be built in to form a full-fledged models looking into monetary transmission mechanisms. Besides, the real sector with its distinguishing features is absent in our analysis (Goyal, 2011). These are some of the major limitation of our paper. While all these constitute agenda for further research, at the risk of borad generalizations, notwithstanding these limitations we venture to put forward some broad conclusions. As far as financial integration is concerned, we found that the money market segment is fairly integrated. At the next level, among the constituents of the domestic financial markets, G-sec and corporate bond market are somewhat integrated. Interestingly, forex market and stock market are somewhat correlated, perhaps indicating the commonalities of players between these two markets. There is, however, scanty evidence of integration between the money market and stock market. Money market and forex market too show lower correlation, perhaps indicating the usual non-interventionist strategy of the RBI and the market determined character of the rupee. Besides, it has been empirically found that the effects of monetary policy on the exchange rate are negatively affected by the economy’s openness. Thus, the more open the economy, the smaller the (short-run) depreciation effects of a given increase in the money growth rate (as in the long run, relative PPP applies) (Karras, 1999). Thus, the result could be consistent with India’s increasing openness during the period. As far as transmission of monetary policy across different segments of financial markets is concerned, the study finds that the impact differs considerably across these four periods. The study finds that the transmission to money market is fast and efficient, fairly strong in G-sec and corporate bond market, modest in forex market. However, the impact of policy rates to stock market is limited. The paper also finds that monetary policy transmission is more effective during the liquidity deficit mode as compared to the surplus mode. The transmission occurs faster in the fourth period (June 2010 – November 2012), which is the liquidity deficit period. The second and third period, the transmission was not on the expected lines, as it was affected by the global financial crisis and its aftermath. Thus, there is asymmetric in monetary policy transmission to financial markets in India, where the monetary policy transmission is faster and persistent when the monetary system is under deficit mode, than otherwise. There are two major limitations of this study. First, in its quest of pursuing high frequency data, the model suffers from an obsession of the financial markets. Thus, it does not any role for the real sector variables, nor does it include various monetary and credit aggregates.24 In this sense, the model is unable to handle issues relating to monetary policy transmission channels as has been pursued in the literature (e.g., Mohanty, 2012). Second, even within the financial markets, the model did not consider two crucial asset markets, viz., credit and gold – the importance of both can hardly be underemphasized in a country like India.25 All these constitute agenda for further research. @ Director, Department of Economic and Policy Research, currently on sabbatical to Indian Institute of Management, Calcutta as Professor of Economics; Email. Assistant Adviser, Department of Economic and Policy Research; Email 1 The authors are indebted to Shri Deepak Mohanty, Shri K U B Rao, Dr. Himanshu Joshi and Shri Anand Shankar for their comments on an earlier draft of the paper. The authors are also indebted for the comments of the participants of an internal seminar at the Department of Economic and Policy Research on November 30, 2012 where they have had the privilege to present an earlier version of the paper. Usual disclaimer applies. The paper reflects personal views of the authors and not necessarily of the institution(s) to which they belong. 4 Ayuso and Blanco (1999) rightly noted, “…perfect cross-market integration is generally understood as a situation in which there is no barrier of any kind to cross-border financial transactions, such as tariffs, taxes, restrictions on the trading of foreign assets, information costs or any other cost that makes it more difficult to trade across countries than within them. With perfect cross-market integration there are no cross-market arbitrage opportunities and the law of one price – i.e., portfolios with the same payoffs should have the same price in different markets– holds”. 5 We choose to ignore the credit market for two reasons. First, there is a large literature on credit channel of monetary policy looking into transmission of monetary policy to credit market in India (e.g., Pandit et al, 2006). Second, credit market has a number of regulatory restrictions that may allow only partial integration with other financial markets. 6 See for example, Kaminsky and Schmukler (2002), Moosa and Bhatti (1997) or Fratzscher (2001) on financial market integration across different global territories. Kaminsky and Schmukler (2002) suggested that equity prices tend to be more internationally connected than interest rates. Moosa and Bhatti (1997) found high level of integration between goods and financial markets of Japan and six Asian countries by testing uncovered interest parity (UIP) and ex ante purchasing power parity (PPP). In this line Hansda and Ray (2002) found that prices of dually listed stocks at different stock exchanges like BSE or Nasdaq are highly related. Also see Raj and Dhal (2008) on this issue of stock market integration in India and abroad. 7 In the context of monetary transmission channel for India, using quarterly structural vector auto regression (SVAR) model, Mohanty (2012) finds that policy rate increase have negative effect on output growth with a lag of two quarters and a moderating impact on inflation with a lag of three quarters; the overall impact persists through 8-10 quarters. 8 During bulk of the period under study, the Indian monetary policy was operated through a repo (injection of liquidity) and a reverse repo (absorption of liquidity) by the RBI, where the unwritten objective of the RBI was to keep the call money rate within this informal corridor of repo and reverse repo rates. The details are explained in section 5 of the paper. 9 See Gokarn (2011) for a discussion on derivative markets in India. 10 The approach also augmented by forward looking indicators drawn from the industrial outlook survey, capacity utilisation survey, inflation expectations survey etc. the assessment from these indicators and models feed into the projection of growth and inflation (Mohanty 2010). 11 The classification of the first three phases was broadly in line with the periodisation adopted by the RBI (see, RBI, 2011). 12 Towards the end of the period, viz., March-May 2010, in order to handle inflationary pressures, the RBI tightened its repo rate and reverse repo by 50 basis points each. 13 Interestingly, the signs of the correlation coefficient varied across the different periods. Even among two deficit liquidity periods, there are instances when its sign have differed. While this may be to do with the identification of the different liquidity period, one cannot a priori establish a correspondence between the correlation coefficients with the shape of the impulse response functions derived from the SVARs. We are indebted to Somnath Chatterjee for pointing this out to us. 14 We are indebted to Saurabh Ghosh for our discussion with him on this issue. 15 Illustratively, using Monte Carlo methods, Zhou (2001) showed the potential benefits of using high frequency data series and that when the studies are restricted by relatively short time spans, increasing data frequency may yield considerable power gain and less size distortion. 16 It is instructive to turn to Favaro (2001) in this context, who argued that, “Imposing the wrong cointegrating parameters will make the system converge to the wrong long-run equilibria but will also bias the short-run dynamics, as the system is pulled in the wrong direction. For this reason the recent research has taken a defined line and VARs in levels rather than cointegrated VARs are used when the issue of economic interest is related to the short-run rather than to the long-run” (p. 80). 17 In addition it is possible to quantify the role of the individual structural shocks for the variability of the variables in the model. For instance, Gali (1992) presents a historical decomposition of the output series, which links different business cycle episodes to specific shocks hitting the economy. 18 The position has been succinctly summed up in Canova (2007), who said, “when doubts about the unit root test exists, one can indirectly check the reasonableness of the stationarity assumption by studying estimated residuals. In fact, if yt is nonstationary and no cointegration emerges, the estimated residuals are likely to display nonstationary path. Hence, a plot of the VAR residuals may indicate if a problem exists. Practical experience suggests that VAR residuals show break and outliers but they rarely display unit root behavior. Hence, a level VAR could be appropriate even when yt is nonstationary. It is also important to remember that the properties of yt are important in testing hypothesis about the coefficients since classical distribution theory is different when unit roots are present. However, they are irrelevant for estimation. Consistent estimates of VAR coefficients, in fact, obtain with classical methods, even when unit roots are present …” (Canova, 2007; p. 115). 19 Available at http://www.international-economy.com/TIE_F09_AssetPriceSymp.pdf 20 Thus, we need to estimate 10 ’s and six ’s. Using 1848 observations for the full period and we used method of scoring (analytic derivatives) to arrive at the estimates. 21 A priori, one would expect a faster transmission of policy shock to different segments of the financial markets than their real counterparts. In this spirit, we first concentrate on the first day shock. 22 We are indebted to S/Shri Deepak Mohanty, B M Misra and S Arunachalaramanan for urging us to check this. 23 Shri Deepak Mohanty has pointed this out to us. 24 Mridul Saggar and O P Mall have pointed this to us. 25 We are indebted to K U B Rao on this point.References (All URLs have been accessed during January – April 2012) Ayuso, J., & Blanco, R. (1999): “Has financial market integration increased during the 1990’s?” Banco De Espana Documentos de Trabajo, 9923– 9958. Bagehot, Walter (1873): Lombard Street: A Description of the Money Market. E. Johnstone, and Hartley Withers (eds.): Library of Economics and Liberty, available at http://www.econlib.org/library/Bagehot/bagLom.html. Bhattacharyya, Indranil and Rudra Sensarma (2007): “How Effective are Monetary Policy Signals in India: Evidence from a SVAR Model”, Journal of Policy Modeling, 30(1): 169-183. Bhattacharyya, Indranil., Mohua Roy, Himanshu Joshi and Michael Debabrata Patra (2009): “Money market microstructure and monetary policy: the Indian experience”, Macroeconomics and Finance in Emerging Market Economies, 2(1): 59-77. Bhoi, B.K. and S.C. Dhall (1998): “Integration of financial markets in India: an empirical evaluation”, RBI Occasional Papers, 19(4): 345-380. Brooks, Chris (2002): Introductory Econometrics for Finance, Cambridge: Cambridge University Press. Buigut, Steven and Vadhindran K. Rao (2011): “International Financial Integration of the Indian Money Market”, International Journal of Economics and Finance, 3(4): 170 – 180. Canova, Fabio (2007): Methods of Applied Macroeconomic Research, Princeton: Princeton University Press. Chambers, Marcus J. (2010): "Cointegration and Sampling Frequency", Econometrics Journal, Volume 13, pp. 1-29. Favaro, Carlo A (2001): Applied Macroeconomics, Oxford: Oxford University Press. Fratzscher, Marcel (2001): “Financial Market Integration in Europe: on the Effects of EMU on Stock Markets”, ECB Working Paper No. 48. Gali, Jordi (1992): "How Well Does the IS-LM Model Fit Post-war U.S. Data", Quarterly Journal of Economics, 107 (2): 709-38. Gokarn, Subir (2011): “Regulatory Perspectives on Derivatives Markets in India” (Keynote address by Deputy Governor, Reserve Bank of India at the International Options Market Association, World Federation of Exchanges Annual Conference organised by the National Stock Exchange at Mumbai on May 4, 2011), RBI Bulletin. Gopinath, Shyamala (2008): “Financial Markets in India: Recent Developments and Challenges” (speech at the annual FIMMDA-PDAI Conference, Cairo, January 27, 2008), RBI Bulletin. Gopinath, Shyamala (2010): “Financial Markets – Some Regulatory Issues and Recent Developments” (speech at the annual FIMMDA-PDAI Conference, Mumbai, January 4, 2010), RBI Bulletin. Government of India (2005): Report of High Level Expert Committee on Corporate Bonds and Securitization (Chairman: R H Patil), Ministry of Finance, New Delhi. Government of India (2008): Report of the Committee on Financial Sector Reforms (Chairman: Raghuram Rajan), Planning Commission, New Delhi. Goyal, Ashima (2011): “A General Equilibrium Open Economy Model for Emerging Markets: Monetary policy with a dualistic labor market”, Economic Modelling, Vol. 17, No. 2, pp. 112-132. Hansda, S. K. and Partha Ray (2002): “Stock Market Integration and Dually Listed Stocks: Indian ADR and Domestic Stock Prices”, Economic and Political Weekly, February 22: 741- 753. Jena, Pradyot Ranjan., K. N. Murty and V. Narasimhan (2008): “Integration of Financial Markets in India: An Empirical Analysis”, mimeo, IGIDR, Mumbai. Jain, Surbhi and N.R. Bhanumurthy (2005): “Financial Markets Integration In India”, Asia-Pacific Development Journal, Vol. 12, No. 2, December 2005. Karras, Georgios (1999): “Monetary Policy and the Exchange Rate: the Role of Openness”, International Economic Journal, 13 (2): 75-88. Kaminsky, Graciela and Sergio L. Schmukler (2002): "Emerging Market Instability: Do Sovereign Ratings Affect Country Risk and Stock Returns?," World Bank Economic Review, 16(2): 171-195, August. Mohan, Rakesh (2007): “Development of Financial Markets in India”, speech at the First Indian-French Financial Forum, Mumbai, May 16, 2007, RBI Bulletin. Mohanty, Deepak (2010): “Implementation of Monetary Policy in India”, speech at the Bankers Club, Bhubaneswar, March 15, 2010, RBI Bulletin. Mohanty, Deepak (2012): “Evidence on Interest Rate Channel of Monetary Policy Transmission in India”, presented at the Second International Research Conference, RBI, Mumbai, February 2, 2012, available at http://sirc.rbi.org.in/downloads/SIRCPaper.pdf Moosa, I.A. and R.H. Bhatti (1997): “Are Asian markets integrated? Evidence for six countries vis-à-vis Japan”, International Economic Journal, 11: 51-67. Nag, A.K. and Mitra, A. (1999): “Integration of Financial Markets in India: An Empirical Investigation”, Prajnan. Pandit, B.L., Ajit Mittal, Mohua Roy, and Saibal Ghosh (2006): Transmission Of Monetary Policy And The Bank Lending Channel: Analysis And Evidence For India, RBI – DRG No. 25, Mumbai: Reserve Bank of India. Patra, Michael Debabrata and Kapur, Muneesh (2010): “A Monetary Policy Model without Money for India”, IMF Working Paper WP/10/183. Pattanaik, I. and Vasudevan, D. (1999): “Integration of Money Markets: Evidence from Interest Rates”, A project report sponsored by the Canadian International Development Agency (CIDA) and the Industrial Credit and Investment Corporation of India (ICICI). Raj, Janak and Sarat Dhal (2008): “Integration of India’s stock market with global and major regional markets, in Regional financial integration in Asia: present and future, BIS Paper 42. Rajaram, Sahana and Ghose, Payal (2011): “Indian Corporate Bond Market”, Rakshitra, Mumbai, CCIL. Reddy, Y.V (2007), “Developing Debt Markets in India: Review and Prospects”, speech at Washington DC, USA on October 18, 2007, RBI Bulletin, October. Reserve Bank of India (1985): Report of the Committee to Review the Working of the Monetary System (Chairman: S. Chakravarty), Mumbai: Reserve Bank of India. Reserve Bank of India (2007): Report on Currency and Finance, 2005-06, Mumbai: Reserve Bank of India. Reserve Bank of India (2007): Annual Report 2006-07, Mumbai: Reserve Bank of India. Reserve Bank of India (2011): Working Group on Monetary Policy Operating Procedures (Chairman: Deepak Mohanty), Mumbai: Reserve Bank of India. Shah, Ajay., Susan Thomas, and Michael Gorham (2008): India's Financial Markets: An Insider's Guide to How the Markets Work, Amsterdam: Elsevier. Sims, Christopher A (1980): "Macroeconomics and Reality", Econometrica, 48(1): 1-48. Sims, Christopher A., James H Stock, and Mark W Watson ( 1990): "Inference in Linear Time Series Models with Some Unit Roots," Econometrica, 58(1): 113-44. Singh, Bhupal (2011): “How Asymmetric is Monetary Policy Transmission to Financial Markets in India”, (processed) paper presented at First Research Conference, Reserve Bank of India, November 25, 2011. Subbarao, Duvvuri (2008): “The Global Financial Turmoil and Challenges for the Indian Economy”, speech by Governor, Reserve Bank of India at the Bankers' Club, Kolkata, December 10, 2008, RBI Bulletin. Subbarao, Duvvuri (2009): “Should Banking Be Made Boring? - An Indian Perspective”, Keynote address by Governor, Reserve Bank of India at the International Finance and Banking Conference organized by the Indian Merchants’ Chamber on ‘Banking - Crisis and Beyond’ on November 25, 2009 in Mumbai, RBI Bulletin. Zhou, Su (2001): "The Power of Cointegration Tests versus Data Frequency and Time Spans", Southern Economic Journal, 67(4): 906-921. |
Page Last Updated on:


