 IST,
IST,
RBI WPS (DEPR): 05/2012: Estimation of Capacity Utilisation in Indian Industries: Issues and Challenges
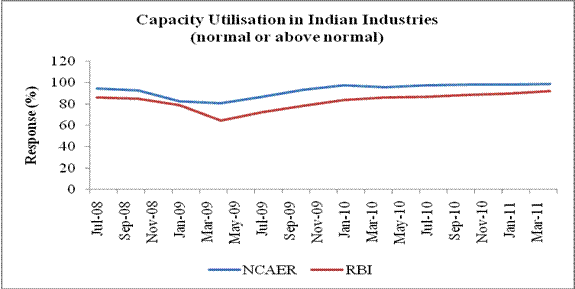
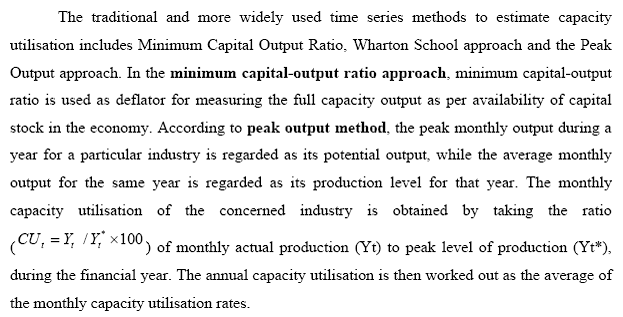
| RBI Working Paper Series No. 05 Abstract *The estimation of capacity utilisation (CU) derives its significance from the fact that, if properly assessed, it may provide a reliable indication of incipient inflationary pressure in an economy. Measurement of CU is not confined to a unique method and can be measured for an economy, industry or plant through the employment of survey method or the use of production data. In India, there is no single official estimate of CU. In this paper an attempt has been made to identify the more suitable method of estimating CU in Indian industries through a comparative analysis of the time series and survey method and a study of the international practices. The findings of the study reveal that time series estimates of CU can capture the business cycle fluctuations and the inflationary pressures in the economy fairly well. But the international experience and the methodological limitations of the time series measures put forward survey method as the more suitable model for estimating CU in the Indian industries. It is important, however, to compare the CU estimates obtained from the survey of select firms, with those obtained from time series methods to ensure that the appropriate macroeconomic picture is captured and both series reflect similar trends. Introduction The estimation of capacity utilisation (CU) derives its significance from the fact that, if properly assessed, it may provide a reliable indication of incipient inflationary pressure in an economy. This is so because realistic assessment of CU rate encapsulates the demand pressure in an economy such that if market demand grows, CU tends to rise, and if demand weakens, CU tends to slacken. Therefore, higher CU is associated with higher inflation. Measurement of CU is not confined to a unique method. CU can be measured for an economy, industry or plant level through the employment of survey method or the use of production data. Unfortunately, however, alternative measures of capacity utilisation do not always tell the same story. International experience suggests official estimates of CU are not released by many countries. However, in some of the countries either the central bank or the government statistics department takes the responsibility of compilation and dissemination of capacity utilisation estimates for the manufacturing sector. In almost all the cases, the official estimates of capacity utilisation of the manufacturing sector are based on the results of various industrial surveys conducted by the central bank, government or their agents. In India, there is no single official estimate of capacity utilisation. The Reserve Bank of India in its quarterly “Industrial Outlook Survey” and “Order Books, Inventories and Capacity Utilisation Survey” provides some estimate about the level of CU in Indian manufacturing sector. Federation of Indian Chambers of Commerce & Industry (FICCI) in its quarterly Business Confidence Survey and Survey on Indian Manufacturing Sector provides some assessment of capacity utilisation in the industrial sector. National Council of Applied Economic Research (NCAER) in its quarterly Business Expectation Survey also provides information on capacity utilisation in Indian industries. Over time, however, a need has been felt for a reliable official series on CU for monitoring inflationary conditions in the economy. I. Capacity Utilisation : Concept and Measures Measures of capacity utilisation are extensively relied upon to help explain the changes in the rate of investment, productivity of labour and inflation. Capacity utilisation can be defined as the percentage of total capacity that is actually being achieved in a given period. It measures how much of the productive potential of the economy is being used at a given point in an economic cycle. Capacity utilisation serves as an important indicator as it reflects the business cycles as well as policy changes. Capacity utilisation falls during a recession because of falling aggregate demand for goods and services. When capacity utilisation is falling the economy is likely to operate with a negative output gap (actual GDP < potential GDP). At the same time the unit costs of production may rise since fixed/ overhead costs are being spread over a lower level of output. Businesses may decide to retrench labour. Moreover, low capacity utilisation implies that the demand for new capital investment will be weaker in future and demand-pull inflationary pressure would decline. The economic capacity represents the desired level of output from given plant and equipment. If one were to accept the neoclassical assumption that except during cyclical downturns most economies operate at full capacity, measurement of CU would have been simpler. This assumption forms the premise of the Wharton Method as per which capacity is defined as the peak output achieved in each business cycle. An implicit assumption of this method is that all short run peaks in output represent 100 per cent of capacity utilisation. Thus, Wharton method automatically excludes the possibility of medium and long term variations in CU (Hertsberg et al, 1974, Schnader, 1984). Tracking CU through economic surveys of operating rates provides a means of capturing the variations of both short as well as long term in capacity utilisation. In the surveys the firms are asked to indicate their current rate of capacity utilisation. However, the surveys generally offer a subjective measure of CU as they do not specify any explicit definition of capacity. A third method of measuring CU is by estimating potential output. In this method, potential output is estimated by production function which represents the optimal output which can be produced by full utilisation of capital and labour inputs (Fisher, 1969). Here, potential output is estimated using a labour input defined by the natural rate of unemployment and a capital input defined by the trend level of total factor productivity for that particular input (De masi, 1997). There are several other methods of estimating CU including the one put forward by Foss (1963) which estimated CU by measuring the utilisation rate of the electric motors which are used to drive capital equipment. Another alternative method of measuring capacity utilisation is the production frontier approach. Within the frontier approach, the maximum possible output (i.e., the capacity output) for given input levels is estimated. Capacity utilisation is the ratio of observed output to maximum potential output. The frontier is generally estimated at the firm level. The industry capacity output is the sum of the frontier outputs; the industry capacity utilisation equals the sum of observed output divided by the industry capacity output. One of the more recent approaches towards estimating production capacity involves the use of a structural vector autoregression including industrial production, the inflation rate, and the long-run real interest rate (Lolande 1999). The structural vector autoregression (SVAR) is used to decompose industrial production into permanent and transitory components. In this model, the shocks affecting trend production, thereby driving capacity, are assumed to be supply shocks. On the other hand, shocks affecting production on a temporary basis are assumed to be demand shocks, which capture the deviation of production from capacity. Consequently, demand shocks determine the capacity utilisation rate. The estimation results showed that production capacity was consistent with stable trend inflation. Dergiades and Tsoulfidis (2007) developed a new approach to estimate CU using profit and investment data. They have provided an alternative definition of CU as the ratio of actual investment to the equilibrium-maintaining investment based on standard economic theory and a SVAR estimating technique. Their definition is based on a single factor of production, i.e., capital. However, it nevertheless yields a data series that is highly correlated, both contemporaneously and dynamically, with the survey measures created by the Federal Reserve Board and Statistics Canada, derived from a combination of all factors of production. II. Measuring Capacity Utilisation: Experience from Select Countries An analysis of the country practices regarding measurement of CU reveals that official estimate of CU is not released by many countries. However, in some of the countries the compilation and dissemination of capacity utilisation estimates for the manufacturing sector are undertaken either by the central bank or the government statistics department and are based on survey results. In the United States, the Survey of Plant Capacity Utilisation provides statistics on the rates of capacity utilisation for the U.S. manufacturing and publishing sectors. The Federal Reserve Board (FRB) and The Department of Defense (DOD) co-fund the survey. The survey collects data on actual, full, and emergency production levels from manufacturing and publishing establishments by means of a mailed questionnaire. From these reported values, full and emergency utilisation rates are calculated. Based on the survey results, the Federal Reserve Board constructs estimates of capacity and capacity utilisation for the industries in manufacturing, mining, electric and gas utilities. For a given industry, the capacity utilisation rate is equal to an output index (seasonally adjusted) divided by a capacity index. Capacity indices are constructed for 89 detailed industries (71 in manufacturing, 16 in mining, and 2 in utilities), which mostly correspond to industries at the three- and four-digit North American Industrial Classification System (NAICS) level. In the United Kingdom (UK), the extent of capacity utilisation is captured through a number of surveys conducted by the Bank of England’s regional agents, the British Chambers of Commerce, the Confederation of British Industry (CBI), and Eurostat. Despite some variation in scope and design, all these surveys contain specific questions on whether or not companies have free capacity to expand production of their goods or services. The most frequently cited measure of capacity utilisation in UK manufacturing is derived from the CBI Industrial Trend Survey, the results of which are used by both the European Union (EU) and OECD for measuring capacity utilisation in the UK manufacturing sector. Business Tendency Surveys provide information on capacity utilisation within the European Union. In assessing the overall level of capacity utilisation for an industry, the percentage utilisations in the large firms are given more weight than the utilisation rates in small ones. The most common practice among the respondents to assess capacity utilisation is to refer physical capacity alone – buildings, plant, machinery, vehicles, etc. Some respondents, however, also take into account other factors such as access to financial capital and, particularly, the supply of labour. Therefore, the survey data on the actual levels of capacity utilisation represent both capital as well as labour utilisation. In Turkey, both the central bank and the Turkish Statistical Institute compile and disseminate data on capacity utilisation in the manufacturing sector. Data on the capacity utilisation rate of manufacturing industry, compiled and disseminated by the Central Bank of the Republic of Turkey (CBRT), are calculated on the basis of the responses of the local units operating in the manufacturing industry to the Business Tendency Survey (BTS) of the CBRT. The capacity utilisation rates, calculated for the overall manufacturing industry and the sub-sectors, are the weighted averages of the actually realised capacity utilisation rates of the respondent local units as per their physical capacities. On the other hand, data on capacity utilisation compiled and disseminated by the Turkish Statistical Institute (TurkStat) are based on the results of the “Tendencies in Manufacturing Industry (TMI)” survey. The results of the survey carried out by the TurkStat for the local units operating in the manufacturing industry within the scope of the industrial production index are generally announced prior to the industrial production data of the related period. Thus, the data on capacity utilisation rates are closely monitored as leading indicators. III. Estimation of CU in India : Select Literature Survey Select literature survey of the studies on CU in Indian context reveals that this aspect has received little attention in the past. One of the earliest estimates of CU were provided by Budin and Paul (1961) based on the Monthly Statistics of Production of Selected Industries (MSP) published by CSO for the period 1951-59. The Study estimated CU for 75 industries and showed an increase in CU during the period under review from 62 per cent in 1951 to 91.5 per cent in 1959. NCAER also conducted a study on CU in Indian industry in 1966 based on MSP data and survey data and concluded that the CU rate for Indian industry was 89 per cent for all industries. The limited studies available in the Indian context are confined to specific sectors of the economy, lacking economy-wide representation. In one of the earliest studies, RBI (1968) published annual estimates of CU for select industries (for the years 1965, 1966 and 1967) using conventional installed capacity figures obtained under the licensing regime. In 1970, RBI published estimates of ‘potential utilisation rate’ for manufacturing industries in India (Divatia and Varma, 1970) for the years 1960 to 1968 using a trends-through-peaks method as discussed earlier. The potential production was considered to be the resultant of several factors such as the installed capacity, extent of availability of inputs, availability of skilled labour, demand, etc. Goldar and Rangnathan (1991) studied the effect of market structure and government policies on CU in Indian industries. The study showed a significant positive relationship between demand pressure and CU and also between market concentration and CU. A study by Ajit (1993) estimated the CU in Indian industry for the period 1970-90. As per the study, average CU at 76.1 per cent in 1980s was higher than the average CU rates of 73.3 per cent in the 1970s. Burange (1992) computed the CU for the period 1951 to 1987 for the organised manufacturing sector in India. The study concluded that the CU in Indian industry has risen continuously during the period under review. RBI (1996) estimated capacity utilisation for manufacturing sector (for entire sector and for use-based groups) for the years 1994-94 to 1995-96 using the methodology suggested in RBI (1970). RBI (2002) estimated CU for 1971-72 to 2000-01 using two competing methods, viz., the Wharton School method and the method based on minimum capital-output ratio. Azeez (2002) examined the performance of Indian manufacturing sector in terms of economic capacity utilisation, over 1974-1998 in which the economic CU, was defined as the realisation of output at which the short run average total cost is minimised, and was estimated using a translog cost function. The Paper identifies three distinct phases with regard to the movements in CU. While phase one (1974-1984) is characterised by relatively wide fluctuations, phase two (1985-1990) witnessed a roughly stable level of utilisation. In the third phase (1991-1998), a variant of the fluctuations witnessed in the first phase is seen to have resurfaced. Interestingly, there has not been any significant correspondence between the observed phases of CU with the corresponding policy environment. While supply and demand side factors are significant in determining CU in Indian manufacturing, the impact of economic reforms per se has not been found to be remarkable. IV. Estimation of CU in India : Current Practices At present, in India, there is no single official estimate of capacity utilisation. The Reserve Bank of India (RBI), National Council of Applied Economic Research (NCAER) and the Federation of Indian Chambers of Commerce & Industry (FICCI) conduct various business expectation surveys which capture some assessment about CU in the Indian industries. The Central Statistics Office (CSO) provides some estimates of CU in select infrastructure industries. The major highlights of the CU estimates by these agencies are set out below: The Central Statistics Office At present, the CSO in its monthly Capsule Report on Infrastructure Sector Performance provides some estimates of capacity utilisation in the core infrastructure industries, viz., steel, cement, fertiliser, petroleum refinery products etc. The Federation of Indian Chambers of Commerce & Industry FICCI Quarterly Business Confidence Survey provides some assessment about capacity utilisation in Indian industries. The respondents of the survey are requested to report whether they were operating at higher capacities vis-à-vis the same quarter last year and the previous quarter. FICCI Quarterly Survey on Indian Manufacturing Sector provides estimates of capacity utilisation at a disaggregate level for various manufacturing industries, viz., textiles, capital goods, machine tools, cement, consumer durables, metal and metal products, automobiles, leather and footware, etc. National Council of Applied Economic Research The NCAER began conducting Business Expectations Surveys (BES) on a quarterly basis since early 1991. A uniform methodology for calculating Business Confidence Index (BCI) was adopted in July 1993. There are about ten questions in each round. BCI is calculated on the basis of responses to four questions: (i) overall economic conditions in the next six months; (ii) financial position of the firm in the next six months; (iii) present investment climate and (iv) the current levels of operation of the firm vis- à- vis its optimal capacity. The NCAER survey results, however, do not capture the actual level of capacity utilisation in the industry, but only what percentage of the respondents feel that the present capacity utilisation is close to or above optimal level. Reserve Bank of India The RBI in its Industrial Outlook Survey collects views of the manufacturing companies on: (i) capacity of the main product (increase/decrease/no change); (ii) level of capacity compared to the average in the last four quarters (above normal/below normal/normal); and (iii) assessment of production capacity with regard to expected demand in the next six months (more than adequate/less than adequate/adequate). The more recently introduced “Order Books, Inventories and Capacity Utilisation Survey (OBICUS)” results capture the level of CU in the Indian manufacturing sector on a quarterly basis. From the foregoing, it is evident that the surveys conducted by all the three agencies, viz., RBI, NCAER and FICCI collect information on CU in Indian industry, but the results obtained from each of the surveys are not strictly comparable as the focus of the questionnaire is different for each of these. The surveys conducted by the RBI (Industrial Outlook Survey) and NCAER, however, show broadly similar trend in CU (Chart 1).
V. Estimation of CU in India through Time Series Method
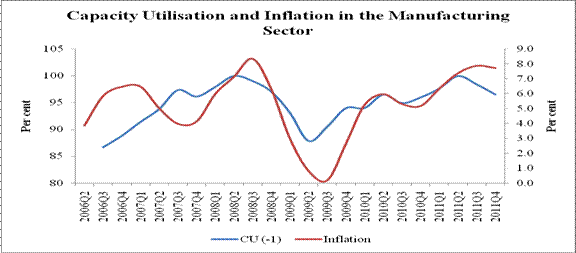
Under the Wharton School Index (peak through trend) method, capacity utilisation is calculated from seasonally adjusted IIP data. The monthly series are adjusted for seasonality and aggregated to quarterly value. The adjusted quarterly series is used to identify the peaks. It is assumed that the output at these peaks indicate the capacity output. During the intervening periods, capacity output is obtained by interpolation based on the peak output. Interpolation is carried out simply by joining the successive peaks by straight line. For the periods prior to first peak and after last peak, capacity output is estimated by extrapolation. Capacity utilisation rates are calculated by expressing actual output as the percentage of estimated capacity output. Wharton method of capacity utilisation has an advantage over the peak output method and minimum capital output ratio method as it can more successfully track the demand pressures in an economy. High CU rates are indicative of higher demand pressure in an economy, which is associated with high inflation rates. It can be observed from Chart 2, that the CU rate in the Indian manufacturing sector measured by Wharton method has generally acted as a lead indicator of inflationary pressure, which is also a theoretical expectation. Inflation in manufactured products has a significant positive correlation (correlation coefficient 0.54) with one period lagged values of capacity utilisation.
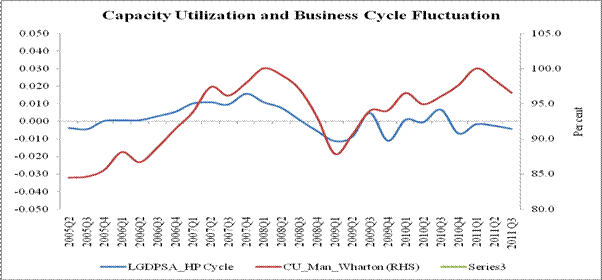
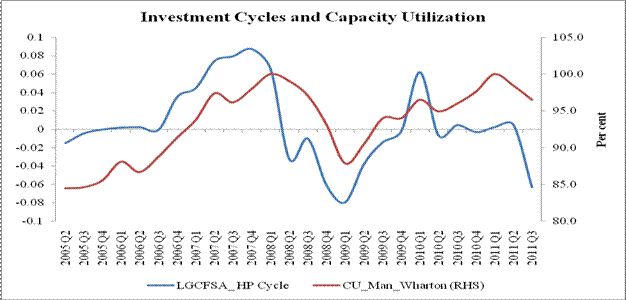
As a corollary to the above, CU rates estimated through the Wharton method can also track the upswings and downswings of the business cycles. It has been observed that CU rates measured from the revised base (2004-05) IIP data have captured the cyclical component of seasonally adjusted gross domestic product (GDP) and seasonally adjusted gross capital formation (GCF) to a large extent (Chart 3 and Chart 4). The correlation coefficient between capacity utilisation and cyclical component of seasonally adjusted GDP works out to be 0.48 for the period 2005 Q2 to 2011Q3. Similarly, the correlation coefficient between capacity utilisation and cyclical component of seasonally adjusted GCF works out to be 0.41 for the period 2005 Q2 to 2011Q3.
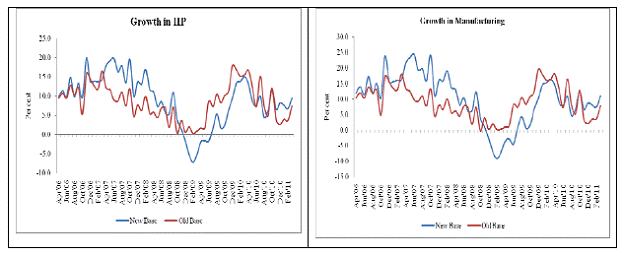
VI. Limitations of Time Series Measures of Capacity Utilisation Despite the simplicity in the estimation procedures, most of countries prefer survey method over time series method for estimating CU as the latter suffers from a number of limitations. The first major limitation of the time series measures of CU estimation is that use of alternative methods may give rise to widely different results. In addition, CU estimates obtained from the time series method generally tend to be higher or have an upward bias compared to the survey estimates. Second, each of the time series methods mentioned above have their own limitations. The limitation of the minimum capital output ratio method is that it presumes that entire capital stock available to the industrial sector would be used with most allocative efficiency which is generally not the case. The main limitation of the peak output method is that the selection of peak remains restricted from within the performance of the manufacturing sector within a relatively short time horizon of one year. The Wharton indices also suffer from various limitations emanating from its theoretical framework. In this method, one first identifies the major peaks in a seasonally adjusted output series, assuming that the major peaks represent output where resources are utilised at full capacity. Joining these major peaks by linear interpolation, potential output is estimated for nonpeak years. It is unrealistic to assume that each major peak represents the same intensity of resource utilisation. Assuming a constant arithmetic growth rate of potential output between peaks is also not justifiable. In addition, CU in the latest period cannot be estimated accurately based on the Wharton method because of end point specification problem. The frontier production function approach has also not gained acceptance due to a number of limitations. One major difficulty of this approach is the specification of an underlying production function for each firm. The frontier approach also requires extensive data if the precision of the estimates has to be maintained. In addition, the production frontier approach is more useful for estimating capacity at the firm level rather than at the industry level, which requires a lot of aggregation. Although considered to be an improvement over other approaches towards CU, at the same time, the specification of SVAR models also has some drawbacks. On the one hand, one needs to identify at most only as many types of shocks as there are variables. In addition, the SVAR methodology assumes that the exogenous innovations correspond to pure uncorrelated different shocks, as for instance supply or demand shocks. However, many types of shocks may have some varying supply or demand characteristics. Accordingly, composite pure shocks are often difficult to relate to some specific economic variables (Chagny et al. 2003). The third disadvantage of time series method arises from the revision of the base year and the associated variability in the industrial production data. With the change in base year of IIP to 2004-05 from 1993-94 the growth in IIP has changed significantly by as much as +/- 11 per cent in the new series (Chart 5). Much of the variation in IIP is on account of the manufacturing data. Manufacturing data have undergone large revisions and the growth rate in manufacturing has changed as much as +/-15 per cent in the new series for certain data points.
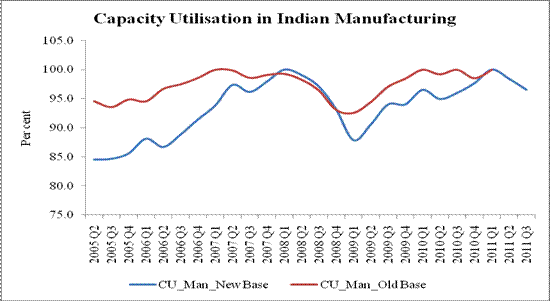
In line with the change in production data, the capacity utilisation estimates have also undergone considerable changes in the revised series (Chart 6).
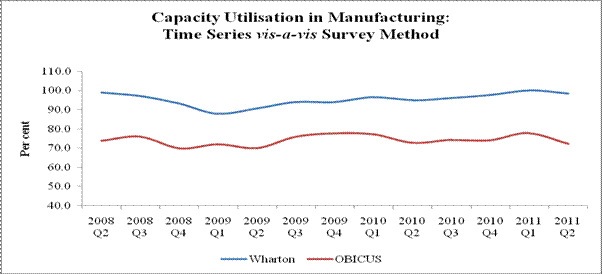
VII. Advantages and Disadvantages of the Survey Method Overall, it emerges from the above analysis that there is a need to have a reliable estimate of capacity utilisation in the Indian context. Our analysis reveals that time series methods can capture demand pressures and business cycle fluctuations in an economy fairly accurately. However, the limitations of the time series estimates and the results of the cross-country study make a strong case in favour of the use of survey method to measure CU in India. The CU estimates obtained from the OBICUS have been compared with the CU estimates from the Wharton method (Chart 7). There are significant differences in the levels of CU obtained from the two methods, which may be partly explained by the upward bias in the estimates of CU through the Wharton method. The two series, however, reveal broadly similar trends in the more recent period starting from 2010-11.
It is important here to note that the Survey based measures of CU also have certain weaknesses. The difficulty with surveys is that they do not specify any explicit definition of what is meant by “capacity”. Thus the respondents are free to choose between various measures of capacity, and may misperceive the effective utilisation rate. In the case of questions about spare capacity, for instance, it is unclear how companies take into account temporarily idle resources (IMF 2010). Second, there is uncertainty over the capacity estimates for multi-product firms. Third, the definition of installed capacity differs from firm to firm as there is no uniform way to define it. Many of the firms report capacity based on a single shift operation, which is not the case in practice (Azeez 2002). Therefore, the results of the survey would depend on the judgments of the individual assessees. Fourth, the relationship between survey responses and average spare capacity across firms could be non-linear, as surveys typically reveal the share of companies reporting spare capacity, but not the extent of such capacity (IMF 2010). In this context, time series measures can actually convey important information which can be complementary to survey measures. The Federal Reserve, for example, finds that in some periods the resulting estimates of capacity utilisation are not plausible from its point of view, so it further operates to change it using regression methods (Shapiro, 1989). In view of the above, it seems to be essential that the CU estimates thus obtained from the survey of select manufacturing companies need to be compared with the estimates obtained from time series methods to ensure that the correct macroeconomic picture is captured and both series reflect similar trends. The estimation of capacity utilisation (CU) provides an indication of the demand pressure in an economy. CU can be measured through the employment of survey method or the use of time series method. International experience suggests official estimates of CU are not released by many countries. However, in all such cases, the official estimates of capacity utilisation of the manufacturing sector are based on the results of various business tendency surveys conducted by the central bank, government or their agents. In India, there is no single official estimate of capacity utilisation. Various agencies, viz., the RBI, NCAER and FICCI conduct various business expectation surveys to assess CU in the Indian manufacturing sector. An attempt has been made in this paper to find out which is the more suitable method of estimating CU in the Indian context. The findings of the study reveals that time series estimates of CU can capture the business cycle fluctuations and the inflationary pressures in the economy fairly well. But the international experience and the methodological limitations of the time series measures put forward survey method as the more suitable model for estimating CU in the Indian industries. However, it is essential that the CU estimates obtained from the survey of select manufacturing companies need to be compared with the estimates obtained from time series methods to ensure that the correct macroeconomic picture is captured and both series reflect similar trends. @Ms.Atri Mukherjee and Ms. Rekha Misra are the Assistant Adviser and Director in the Department of Economic and Policy Research. *The authors are grateful to Smt. Balbir Kaur, Adviser, DEPR for her constant encouragement and valuable guidance on both theoretical and technical aspects of the paper.The paper reflects personal views of the authors. References : Ajit, D. (1993). “Capacity Utilization in Indian Industries”, Reserve Bank of India OccasionalPapers, March, Vol. 14, No. 1, pp. 21-46. Azeez, E. Abdul (2002). “ Economic Reforms and Industrial Performance: An Analysis of Capacity Utilisation in Indian Manufacturing”. Working Paper 334, Centre for Development Studies Berndt, Ernst R. and Morrison Catherine J. (1981). “Capacity Utilization Measures: Underlying Economic Theory and an Alternative Approach”. The American Economic Review, Vol. 71, No. 2, Papers and Proceedings of the Ninety-Third Annual Meeting of the American Economic Association (May, 1981), pp. 48-52. Bordoloi, Sanjib, Das, Abhiman and Jangili Ramesh (2009). “Estimation of Potential Output in India”. Reserve Bank of India Occasional Papers Vol. 30, No.2, Monsoon 2009. Budin, M and S.Paul (1961). “The Utilization of Indian Industrial Capacity (1949-1959)”, Indian Economic Journal, Vol.19, No.l. Burange, L.G. (1992). “Trends in Capacity Utilization in Indian Manufacturing Sector (1951-1986)”. Journal of Indian School of Political Economy, Vol TV, No.3 Chagny, Odile, Lemoine, Matthieu and Pelgrin, Florian (2003). “An Assessment of Multivariate Output Gap Estimates in the Euro area”. Working Papers and Studies, Eurostat De Masi, P. (1997). “IMF Estimates of Potential Output: Theory and Practice.” IMF WorkingPaper, no. 97/177. Dergiades, Theologos and Tsoulfidis, Lefteris (2007). “A New Method for the Estimation of Capacity Utilization: Theory and Empirical Evidence from 14 EU Countries”. Bulletin of Economic Research, Vol. 59, No. 4, pp. 361-381. Divatia, V.V and Ravi Varma (1970), "Index of Potential Production and Potential Utilization Fisher, F. M. (1969). “The Existence of Aggregate Production Functions.” Econometrica 37 (4):553-77. Foss, M. F (1963) ."The Utilization of Capital Equipment: Postwar Compared with Prewar," Surv. Curr. Bus., June 1963, 43, 8-16. Goldar, B. and V.S.Renganathan (1991). “Capacity Utilization in Indian Industries”. Indian Economic Journal, Vol.39, No.2. Hertzberg, M. R., Jacobs, A. I., and Trevathan, J. E. (1974). “The Utilization of Manufacturing Capacity, 1965-73.” Survey of Current Business. International Monetary Fund (2010). “United Kingdom: Selected Issues Paper”. IMF Country Report Number 10/337 Lalonde, Rene (1999). “The U.S. Capacity Utilization Rate: A New Estimation Approach”. Bank of Canada Working Paper No. 99-14. National Council of Applied Economic Research (2001). “Business Cycle Indicators in the Indian Economy”, Report submitted to the Reserve Bank of India, October. Reserve Bank of India (1968), “On the Recent Recessionary Trends in Organised Industry”, RBI Bulletin, July. Reserve Bank of India (1996), “An Estimate of Capacity Utilisation – Manufacturing Sector”,RBI Bulletin, August, pp. 30. Reserve Bank of India (2002), Report on Currency and Finance, 2000-01. Report of the Working Group on Economic Indicators, Reserve Bank of India, June 28, 2002 Schnader, M. H. (1984). “Capacity Utilization.” The Handbook of Economic and Financial Measures, Frank J. Fabozzi and Harry I. Greenfield, eds. Illinois: Dow-Jones Irwin. Shaikh, Anwar M. and Moudud, Jamee K.(2004), Measuring Capacity Utilization in OECD Countries:A Cointegration Method, The Levy Economics Institute Working paper No. 415, November. Shapiro, Matthew D. (1989). "Assessing the Federal Reserve's Measures of Capacity and Utilisation," Brookings Papers on Economic Activity, Economic Studies Program, The Brookings Institution, vol. 20(1989-1), pages 181-242 |
صفحے پر آخری اپ ڈیٹ:


