
II. The Real Economy - RBI - Reserve Bank of India


II. The Real Economy
Macroeconomic Scene
Aggregate Supply
Agriculture
Industry
Services Sector
Aggregate Demand
2.1 A broad-based revival in industrial activity and a resurgence of growth in the services sector sustained economic activity in 2002-03. Real GDP originating in industry recovered steadily from the first quarter onwards, surging up towards trend levels on the strength of a rebound in manufacturing. The improvement in services sector GDP growth emanated from construction, ‘financing, insurance, real estate and business services’ and ‘community, social and personal services’. While the return of growth momentum in industry and services augured well for the economy, severe drought conditions impacted on the farm sector in several States, producing a contraction in real GDP originating from ‘agriculture and allied activities’. The loss of agricultural output was pronounced from the second quarter onwards, reflecting the full effects of the drought. Moisture stress was of a scale and intensity comparable to the severe drought of 1987 which had resulted in real GDP growth slowing down to 3.8 per cent in 1987-88. Despite the intensity of the supply shock to agriculture, the growth of real GDP at 4.3 per cent in 2002-03 was symptomatic of resilience and a degree of weather-proofing of the economy (Table 2.1, Appendix Tables II.1 and II.2).
2.2 Absolute declines in agricultural activity have invariably dragged down overall GDP growth. Although the share of agriculture in real GDP has declined over the years, the share of non-food items in rural expenditure has been increasing. Consequently, compression of rural income in years of poor agricultural performance has delayed effects on aggregate demand. Furthermore, in terms of the backward linkages, the demand from the agriculture sector for industrial inputs are becoming progressively significant.
(Per cent) |
|||||||||||||||||
|
|
|||||||||||||||||
Sector |
2002- |
2001- |
1992-93 to |
2002-03 |
2001-02 |
||||||||||||
03# |
02* |
2000-01 |
Q1 |
Q2 |
Q3 |
Q4 |
Q1 |
Q2 |
Q3 |
Q4 |
|||||||
(Average) |
|||||||||||||||||
|
|
|||||||||||||||||
1 |
2 |
3 |
4 |
5 |
6 |
7 |
8 |
9 |
10 |
11 |
12 |
||||||
|
|
|||||||||||||||||
1. |
Agriculture and Allied Activities |
-3.2 |
5.7 |
3.0 |
2.7 |
-3.5 |
-7.6 |
-2.8 |
2.6 |
5.6 |
5.9 |
8.3 |
|||||
(22.1) |
(23.9) |
(27.9) |
|||||||||||||||
2. |
Industry |
5.7 |
3.2 |
6.6 |
4.3 |
6.2 |
6.2 |
6.2 |
2.4 |
3.0 |
3.5 |
4.0 |
|||||
(21.8) |
(21.5) |
(22.0) |
|||||||||||||||
2.1 |
Manufacturing |
6.1 |
3.4 |
7.2 |
3.8 |
6.5 |
6.7 |
7.1 |
2.9 |
3.1 |
3.4 |
4.1 |
|||||
2.2 |
Mining and Quarrying |
5.0 |
1.0 |
4.1 |
7.6 |
6.0 |
3.8 |
3.2 |
-2.5 |
-0.2 |
3.6 |
2.7 |
|||||
2.3 |
Electricity, Gas and Water Supply |
3.9 |
4.3 |
5.9 |
4.4 |
4.0 |
5.0 |
2.4 |
3.5 |
5.0 |
3.4 |
5.1 |
|||||
3. |
Services |
7.1 |
6.5 |
7.7 |
6.8 |
7.8 |
6.4 |
7.5 |
6.0 |
5.8 |
7.7 |
6.3 |
|||||
(56.1) |
(54.6) |
(50.1) |
|||||||||||||||
3.1 |
Trade, Hotels, Restaurants, |
||||||||||||||||
Transport and Communication |
7.8 |
8.7 |
8.3 |
6.9 |
8.1 |
7.2 |
8.8 |
7.7 |
9.0 |
8.4 |
9.7 |
||||||
3.2 |
Financing, Insurance, |
||||||||||||||||
Real Estate and Business Services |
6.1 |
4.5 |
8.1 |
6.7 |
7.0 |
6.3 |
4.4 |
4.5 |
5.0 |
4.8 |
3.8 |
||||||
3.3 |
Community, Social and |
||||||||||||||||
Personal Services |
6.8 |
5.6 |
7.3 |
6.9 |
7.8 |
4.6 |
7.7 |
6.8 |
3.1 |
10.3 |
3.1 |
||||||
3.4 |
Construction |
7.2 |
3.7 |
5.5 |
6.2 |
8.6 |
6.7 |
7.5 |
0.3 |
1.3 |
5.5 |
7.5 |
|||||
4. |
GDP at factor cost |
4.3 |
5.6 |
6.1 |
5.3 |
5.2 |
2.3 |
4.9 |
4.4 |
5.1 |
6.3 |
6.3 |
|||||
(100.0) |
(100.0) |
(100.0) |
|||||||||||||||
|
|
|||||||||||||||||
* Quick Estimates. |
# Revised Estimates. |
Notes : |
|||||||||||||||||
1. |
Figures in brackets denote shares in real GDP. |
||||||||||||||||
2. |
Q1 : First Quarter (April-June); |
Q2 : Second Quarter (July-September); |
|||||||||||||||
Q3 : Third Quarter (October-December); |
Q4 : Fourth Quarter (January-March). |
||||||||||||||||
Source : |
Central Statistical Organisation. |
||||||||||||||||
The marginal and small farmers have also substantially increased their usage of purchased inputs such as HYV seeds and pesticides, irrigated water and fertilisers. Moreover, the ratio of net irrigated area to the net sown area is around 40 per cent for marginal holding brackets. Nearly two-third of the area operated by the marginal and small farmers is treated with fertilisers, which is less than 50 per cent for the medium farmers and roughly 39 per cent for the large farmers. Under the circumstances, sustainability of the momentum of growth in industry and services depends upon stabilisation of rural demand and recovery in agricultural activity. The share of industry in GDP has stagnated since 1997-98, bound by the downswing in the business cycle and manifested in inventory accumulation, unutilised capacity, restructuring and organisational change. Services have been the principal engine of growth (Chart II.1).
AGRICULTURE
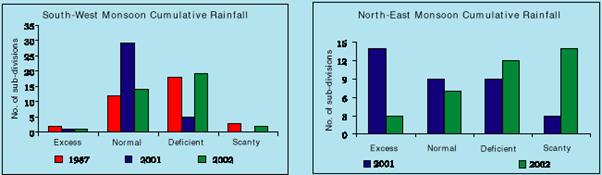
2.3 Indian agriculture experienced one of the worst droughts in 2002-03. A long, dry spell beginning in July 2002, a crucial month for sowing and plant growth, culminated in rainfall during the South-West monsoon season being at only 81 per cent of the Long Period Average (LPA). Acute moisture scarcity prevailed in various parts of the country with the failure of the South-West monsoon after a spell of 14 years. The sowing month of July, which normally receives 30 per cent of the season's rain, suffered a shortage of about 49 per cent. Only 15 out of 36 meteorological sub-divisions in the country received normal to excess rainfall, a situation last experienced in the drought of 1987. The live storage level in the 70 major reservoirs across the country was less than 50 per cent of the designed storage levels at the end of the season. The retreating monsoon (North-East monsoon) was delayed and inadequate with the cumulative rainfall in 26 sub-divisions being deficient to scanty (Chart II.2). The Government quickly initiated several policy measures to mitigate the severity of the drought. A Task Force on Drought was set up to oversee the relief measures. Additional quantities of foodgrains were allocated to various States as part of the food for work programme, besides ensuring supplies of fodder for cattle. Measures were initiated to provide employment and purchasing power for the drought affected people. Furthermore, waiver of interest on kharif loans and rescheduling of crop loans into terms loans were announced. In addition, specific fiscal measures were initiated in the form of a grant of input subsidy to small and marginal farmers.
Chart II.2 Rainfall Conditions
Production
2.4 The production of foodgrains and non-foodgrains was adversely affected almost across-the-board with the fall in kharif output sharper than that of rabi (Appendix Table II.3). Rice and coarse cereals were particularly affected by drought conditions. Oilseeds production declined mainly on account of dip in the production of groundnut, rapeseed/mustard and soyabean. The index of agricultural production (base: triennium ending 1981-82 = 100) recorded the steepest decline since 1979-80 (Table 2.2).
2.5 India is the second largest producer of rice and wheat in the world, first in the production of pulses and fourth in coarse grains. A distinct bias in agricultural price support policies in favour of rice and wheat has, however, distorted cropping pattern and input usage. The market for farm output continues to be subject to heavy procurement interventions. While the minimum support price policy needs to be assessed in terms of the producer equivalents that it generates in the face of the adverse terms of trade confronting the farmer, the distortion in relative prices of crops in favour of rice and wheat has induced a highly skewed cropping pattern, adverse distribution of rural incomes and ecological damage to arable land resources. In the post-reform period, the terms of trade have moved favourably, reducing the implicit tax on agriculture and creating the pre-conditions for a withdrawal of these interventions. The need for developing an institutional framework for agricultural product markets as a concurrent requirement for phasing out the MSP assumes critical importance on the agenda for future reforms in agriculture.
Crop |
2002-03 AE |
2001-02 |
2000-01 |
|||
|
|
||||||
1 |
2 |
3 |
4 |
|||
|
|
||||||
1. |
Growth Rate $ (Per cent) |
|||||
All Crops |
-12.6 |
7.0 |
-6.3 |
|||
a) |
Foodgrains |
-14.6 |
8.4 |
-6.7 |
||
b) |
Non-foodgrains |
-9.5 |
4.8 |
-5.7 |
||
2. |
Production (Million Tonnes) |
|||||
a) Foodgrains |
182.6 |
212.0 |
196.8 |
|||
i) |
Rice |
75.7 |
93.1 |
85.0 |
||
ii) |
Wheat |
69.3 |
71.8 |
69.7 |
||
iii) |
Coarse cereals |
26.2 |
33.9 |
31.1 |
||
iv) |
Pulses |
11.3 |
13.2 |
11.1 |
||
b)Non-foodgrains |
||||||
i) |
Oilseeds + + |
15.8 |
20.8 |
18.4 |
||
ii) |
Sugarcane |
278.6 |
300.1 |
296.0 |
||
iii) |
Cotton @ |
9.3 |
10.1 |
9.5 |
||
iv) |
Jute & Mesta + |
10.8 |
11.6 |
10.6 |
||
v) |
Tea * |
N.A. |
847.3 |
848.4 |
||
vi) |
Coffee * |
275.3 |
300.6 |
301.2 |
||
|
|
||||||
AE |
Advance estimates as on July 1, 2003. |
|||||
$ |
Based on Index of Agricultural Production with base: triennium |
|||||
ending 1981-82 = 100. |
||||||
++ |
For nine oil seeds out of eleven in all. |
|||||
+ |
Million bales of 180 kg. Each. |
|||||
@ |
Million bales of 170 kg. Each. |
|||||
* |
Million kilograms and data for tea on a calendar year basis. |
|||||
N.A. Not Available. |
||||||
Source :Ministry of Agriculture, Government of India; Tea Board; and Coffee Board. |
||||||
2.6 In recent years, there has been considerable emphasis on crop diversification in favour of horticulture (fruits, vegetables, ornamental crops, medicinal and aromatic plants, spices), plantation crops (coconut, cashew nut and cocoa) and allied activities. This process has been facilitated by the creation of critical infrastructure for cold storage, refrigerated transportation, rapid transit, grading, processing, packaging and quality control. India is the largest producer of coconut, areca nut, cashew nut, ginger, turmeric, black pepper and the second largest producer of groundnut and fruits and vegetables. India accounts for about 10 per cent of the world fruit production with the country ranking first in the production of mango, banana, sapota and acid lime. Milk production estimated at 84.6 million tonnes is the highest in the world. India is also the fifth largest producer of eggs and seventh in the production of meat. It is important to explore new frontiers in technology focusing on evolving location-specific and economically viable varieties of agricultural and horticultural crops by leveraging developments in the field of bio-technology.
2.7 Sharp fluctuations in agricultural activity in India have characterised the past decade with agriculture making a negative contribution to real GDP growth (17 per cent in 2002-03) for the fifth year since 1990-91. Gross domestic capital formation in agriculture has undergone a secular decline brought about by a steady erosion in the share of public investment. The increase in private sector capital formation has been concentrated in areas where water, power and other inputs are available uninterruptedly and with large subsidy. The inadequacy of private investment in filling capital requirements of agriculture has raised concerns about the widening gaps in rural infrastructure which could become binding constraints on growth. Irrigation coverage remains distinctly lower than the potential in terms of the gross cropped area. Village electrification has been inadequate in its coverage and this has affected the expansion of irrigation coverage, processing industries and cold storages. Poor rural road connectivity and insufficient rural markets are other major infrastructure constraints (Box II.1).
2.8 Private participation in food processing and extension services could provide insurance against risks to the farmers through longer-term supply contracts. Development of futures markets in agricultural commodities enables hedging of price risks faced by farmers (Box II.2).
Box II.2 Commodity futures hedge the risks faced by farmers and agricultural trade functionaries from seasonal and cyclical fluctuations in the prices of agricultural commodities. Futures markets perform the two important functions of price discovery and price risk management, facilitating rational production and distribution decisions. They act as a price barometer, helping to stabilise the amplitude of price variations and create an integrated price structure throughout the country. Internationally, FT is allowed in a range of commodities and even in a number of non-commodities such as a weather indices and pollution permits. In some major derivative exchanges such as the Chicago Board of Trade (CboT) and the London Inter-Bank Financial Futures Exchange (LIFFE), there is a convergence of futures markets with freedom to trade in all types of derivatives. Some of the best practices followed internationally include daily clearing, margining, creation of trade guarantee fund, transparency in trade and management practices to ensure market integrity and strict monitoring and surveillance of the trade in the exchange. With the globalisation of financial markets, significant developments are taking place in the international arena in terms of electronic trading, internet based commodity exchanges and electronic communication networks (ECNs) using multiple products and combination of networks as competitors to exchanges. There are increasing alliances, often international, to compete effectively with exchanges and ECNs. The first ever organised futures market in India evolved with the setting up of the Bombay Cotton Trade Association Limited in 1875. The Forward Contract Regulation Act (FCRA) was enacted in December 1952, providing an institutional framework for the evolution of futures markets in India. During the 1960s and 1970s, however, FT was either suspended or prohibited. The Khusro Committee (June 1980) recommended the reintroduction of futures trading in major commodities. On the recommendations of the Kabra Committee in 1993, the Government of India permitted futures trading in a large number of commodities. There are, at present, 22 exchanges in the country and all commodities have been permitted to be traded in futures. International futures markets in pepper and castor oil were developed by upgrading the existing exchanges at Kochi and Mumbai, respectively. A Multi-commodity Nationwide Exchange has also been started in Ahmedabad. There has been a good response in terms of volumes traded, price discovery and evening out of price fluctuations in 2001-02 (Chart). Indian commodity futures markets are still at a nascent stage. They are dispersed and fragmented with small turnover and catering to separate trading communities in different regions. Apart from physical/ infrastructural constraints such as limited online trading, online surveillance and monitoring, the non-availability of a fool proof legal system of contracts relating to the warehouse receipt system is impeding the development of futures markets in India. Furthermore, the hawala markets, which have been operating since decades, trade 20-30 times the volume of official future exchanges. They are often localised, operating with low transaction costs and hence attract many speculators and small hedgers. Efforts are being made to bring informal forward trading into the ambit of the Forward Markets Commission to ensure their orderly integration with the formal marketing structure. Efforts have also been made by the Government and Forward Markets Commission to improve the infrastructure and trade practices in commodity exchanges. Some of the exchanges have been encouraged to adopt screen-based on-line trading systems and best international trade practices. Convergence of markets for commodity derivatives and security derivatives is a recommended objective, with all existing restrictions under the Essential Commodities Act (1955) removed. Effective co-ordination and interface between the exchanges, banks and the warehousing agencies is crucial in evolving the necessary framework for a mature warehousing system based on legally enforceable contracts and supporting transferability and negotiability. There is need to calibrate proper incentive structure by minimising the stamp duties imposed by the State Governments and changing the income tax laws suitably as is being felt in several corners. Granting industry status to commodity futures can improve access for participants to institutional funds for their working capital. Participation in commodity futures market needs to be enlarged by including mutual funds, financial institutions and foreign institutional investors under appropriate regulatory supervision. References
|
2.9 The World Trade Organisation (WTO)'s Agreement on Agriculture (AoA) sets specific implementation periods for developed and developing countries regarding various commitments for reducing trade-distorting subsidies and improving market access. The Fourth WTO Ministerial Conference held in November 2001 in Doha, Qatar reconfirmed these commitments, enjoining members to firm up modalities before March 31, 2003 for final negotiations to be concluded by January 1, 2005. At the Tokyo Summit in March 2003, however, members failed to reach an agreement on the modalities for agriculture, underscoring the wide differences among the negotiating parties which impede the progress towards a multilateral system of trade in agriculture The final deadline for reaching a consensus is January 1, 2005 (Box II.3).
Food Management: Procurement, Off-take and Stocks
2.10 Foodgrain procurement was lower in 2002-03, reflecting the drought conditions. Wheat procurement was highest in Punjab (9.86 million tonnes), followed by Haryana (5.89 million tonnes) and Uttar Pradesh (2.29 million tonnes). Rice procurement was highest in Punjab (7.82 million tonnes comprising 2.61 million tonnes by the Food Corporation of India and 5.21 million tonnes by the State agencies), followed by Andhra Pradesh (1.69 million tonnes), Haryana (1.30 million tonnes) and Uttar Pradesh (1.23 million tonnes).
2.11 Off-take, on the other hand, was significantly higher, mainly on account of Open Market Sales (OMS) including exports, 'food for work' schemes and other welfare schemes (OWS). Higher off-take through the PDS and OWS was facilitated by lowering of issue prices under Targeted Public Distribution System (TPDS) for Above Poverty Line (APL) families, and by increasing the monthly allocation for APL, Below Poverty Line (BPL) families and Antyodaya families. As part of drought relief measures, the Central Government allocated 8.3 million tonnes of foodgrains to the drought affected States; of this 4.7 million tonnes were lifted during 2002-03.
2.12 Foodgrain stocks (including coarse grains) with the FCI went down rapidly as a result of the higher off-take. The decline in foodgrains stocks resulted in lower levels of food credit availed by the FCI. Substantial expansion in off-take entailed higher food subsidies (Table 2.3 and Appendix Table II.4).
(Million Tonnes) |
||||||||||||
|
|
||||||||||||
Month |
Opening |
Buffer |
Food- |
Foodgrains off-take |
Closing |
Food |
Food |
|||||
Stock of |
Stocking |
grains |
PDS |
OWS |
OMS |
Exports |
Stock |
Credit |
Subsidy |
|||
Food- |
Norm $ |
Procure- |
(excluding |
@ |
# |
|||||||
grains |
ment |
Exports) |
||||||||||
|
|
||||||||||||
1 |
2 |
3 |
4 |
5 |
6 |
7 |
8 |
9 |
10 |
11 |
||
|
|
||||||||||||
April 2002 |
51.0 |
15.8 |
14.3 |
1.2 |
0.4 |
0.2 |
1.0 |
62.6 |
52,484 |
1,754 |
||
May |
62.6 |
6.1 |
1.5 |
0.8 |
0.2 |
1.2 |
64.8 |
60,669 |
1,632 |
|||
June |
64.8 |
2.5 |
1.6 |
1.3 |
0.2 |
0.9 |
63.1 |
61,008 |
1,703 |
|||
July |
63.1 |
24.3 |
0.2 |
1.5 |
0.6 |
0.4 |
1.1 |
59.9 |
59,077 |
2,490 |
||
August |
59.9 |
0.2 |
1.8 |
0.5 |
1.1 |
1.5 |
55.4 |
56,400 |
1,734 |
|||
September |
55.4 |
0.6 |
1.5 |
0.5 |
0.7 |
1.4 |
51.4 |
53,362 |
2,283 |
|||
October |
51.4 |
18.1 |
7.1 |
1.8 |
1.2 |
0.7 |
0.9 |
53.6 |
52,705 |
2,601 |
||
November |
53.6 |
1.3 |
1.5 |
0.8 |
0.4 |
0.8 |
51.5 |
54,346 |
1,924 |
|||
December |
51.5 |
1.3 |
2.0 |
1.2 |
0.4 |
0.9 |
48.2 |
51,947 |
2,653 |
|||
January 2003 |
48.2 |
16.8 |
2.0 |
1.8 |
1.3 |
0.8 |
0.8 |
40.1 |
49,784 |
2,261 |
||
February |
40.1 |
1.4 |
2.1 |
1.1 |
0.4 |
0.9 |
36.2 |
50,227 |
23 |
|||
March |
36.2 |
0.9 |
1.9 |
1.7 |
0.3 |
1.1 |
32.8 |
49,479 |
3,117 |
|||
April |
32.8 |
15.8 |
13.1 |
1.4 |
0.9 |
0.2 |
0.6 |
41.3 |
44,589 |
1,462 |
||
May |
41.3 |
3.6 |
1.8 |
1.6 |
0.1 |
0.9 |
39.8 |
51,047 |
2,209 |
|||
June |
39.8 |
1.0 |
1.2 |
2.5 |
0.2 |
1.1 |
35.2 |
50,066 |
2,830 |
|||
|
|
||||||||||||
$ |
Represents the total minimum stocks to be maintained by public agencies on the first day of the quarter under buffer stocking policy with effect from October 30, 1998. |
|||||||||||
@ |
Outstanding in Rupees crore as on the last reporting Friday of the month. |
|||||||||||
# |
Monthly expenditure on food subsidy in Rupees crore. |
|||||||||||
PDS :Public Distribution System. |
OWS : Other Welfare Schemes. |
OMS :Open Market Sales. |
||||||||||
Source : Ministry of Food, Consumer Affairs and Public Distribution; Ministry of Finance, Government of India. |
||||||||||||
2.13 The system of procurement at assured price, buffer stocking and public distribution has locked up large resources - in the form of both explicit and implicit subsidies - which in turn has affected public sector capital formation in agriculture. Recognising the associated fiscal costs, the Expenditure Reforms Commission recommended that all input subsidies be phased out and a buffer stock of 10 million tonnes, comprising four million tonnes of wheat and six million tonnes of rice be maintained, as adequate from the stand point of national food security. As against the quarterly norms for buffer stocks at 15.8 million tonnes at end-March as recommended by 4th Technical Group appointed by the Government of India, the actual stocks averaged at 35.9 million tonnes in the last five years.
2.14 A modest revival in industrial activity which set in by March, 2002 permeated all segments during 2002-03, with manufacturing contributing more than 80 per cent of the overall growth of industrial production. Strengthening signs of resumption of investment demand were evident in a sharp rise in the production and imports of capital goods. The industrial recovery enabled a robust expansion in exports of manufactures in spite of the slack in global demand, and triggered a coincident upswing in non-food credit from the banking system. Business confidence improved in all sectors against the backdrop of a distinct improvement in the financial performance of the corporate sector, slowing down of inventory accumulation, and an expansion in capacity utilisation and order books. Industrial activity was broadly insulated from the impact of the drought, except in the durable consumer goods segment where the compression of income affected production.
2.15 The Index of Industrial Production (IIP) rose through the first half of 2002-03 boosted by rural demand in the wake of the rabi harvest, before levelling off in the second half of the year. The growth of manufacturing peaked in September 2002, driven up by resumption of export demand in a wide range of industries. The growth in mining and quarrying reached a high in July 2002. The growth of electricity remained broadly unchanged, despite the persistence of demand-supply gaps (Chart II.3 and Appendix Table II.5).

Manufacturing Sector
2.16 Industrial performance is dominated by the behaviour of manufacturing. In 2002-03, it was the distinct improvement in manufacturing which led the industrial recovery, contributing as much as 86.2 per cent of the growth of overall industrial production. Improvement in manufacturing activity was diffused across most of the constituent 17 two-digit industry groups (Table 2.4).
2.17 Leading the upsurge in manufacturing were five industry groups comprising 'beverages, tobacco and related products', 'basic chemicals and chemical products', 'food products', 'transport equipment and parts' and 'basic metal and alloy’ industries (Appendix Tables II.6 and II.7). These industry groups contributed 75.3 per cent of the growth in the manufacturing sector. The improvement in the production of ‘beverages, tobacco and related products’, ‘basic chemicals and chemical products’ as well as ‘food products’ was mainly export-driven. These industries benefited from policy initiatives for the setting up of food parks to foster entrepreneurial activity in areas relating to cold storage, warehousing, quality control laboratories, effluent treatment plants and other ancillary activity. Food processing, vegetable oils and vanaspati industries exhibited a distinct pick-up in credit demand. The improvement in the performance of basic metals and alloy industries mainly reflected the turnaround in the steel industry during the year. The domestic steel industry received a stimulus from the increase in international prices as well as from the highway construction under the National Highway Authority of India (NHAI) for the 'golden quadrilateral'. Exports of iron and steel increased by 100.3 per cent during 2002-03, reversing the decline of 12.7 per cent in the previous year. Competitive reductions of interest rates on automobile loans combined with buoyant external demand enabled an expansion in the production of transport equipment industries.
2.18 The expansion in export orders also had a salutary effect on the moderate performers in the manufacturing sector such as readymade garments, man-made yarn, fabrics, made-ups and textiles products. The surge in construction activity on account of increased demand for cement from housing and highway construction buoyed up activity in non-metallic mineral products industries and led to improved capacity utilisation. Paper and paper products and printing, publishing and allied industries also increased capacity utilisation in response to increased demand in the upstream market. Foreign equity participation up to 100 per cent under the automatic route is allowed in these industries. Production levels in leather and fur products industries suffered due to a decline in export demand. Other industries which experienced decline in activity were ‘wood and wood products, furniture and fixtures’ and ‘cotton and cotton textiles’.
2.19 The financial performance of the companies also markedly improved during 2002-03. Abridged financial results of sample companies showed a pick up in sales and a sustained decline in interest burden, leading to a surge in post tax profits (Table 2.5).
Use-based Classification
2.20 The demand composition of industrial production reveals that consumer non-durables production rose sharply and accounted for nearly half of the growth in the IIP, followed by basic goods (Appendix Table II.8). A positive development in 2002-03 was the significant turnaround in capital goods production after an absolute decline in the preceding year. Along with the accompanying expansion of 29.0 per cent in the import of capital goods, this improved the prospects of fresh capital infusion and strengthening of demand after a hiatus covering the second half of the 1990s up to the preceding year. Intermediate goods shared in this expansion albeit on a more moderate scale. Production in the consumer durables segment declined reflecting weak demand, particularly the slowdown of rural demand (Table 2.6). Industrial outlook surveys pointed to the domestic economic scenario as being the principal limiting factor on consumer expectations in this segment.
Infrastructure Industries
2.21 A larger number of infrastructure industries achieved their production targets set for 2002-03 than in 2001-02. Performance remained below targets in power, finished steel, crude petroleum, fertilisers and petroleum refinery products. The domestic civil aviation sector operated significantly below capacity (Table 2.7).
2.22 Despite some shortfalls vis-a-vis the targets in key infrastructure industries, there was an overall improvement in production conditions in infrastructure during 2002-03 (Chart II.4 and Appendix Table II.9). Improved growth in the finished steel industry was facilitated by strong external demand. On the other hand, the acceleration in the cement sector was mainly driven by domestic demand emanating from the growth in construction and housing. Electricity, on the other hand, continued to show low growth.
2.23 A significant element of the Central Government's initiative towards infrastructural development is the implementation of Central Sector Projects (CSPs). CSPs have been initiated in the power, petroleum and coal sectors, although most of these projects relate to the railways and, in the more recent period, to the surface transport sector. The total number of delayed CSPs increased in June 2003 (Table 2.8). According to the Ministry of Statistics and Programme Implementation, the major reasons for delays in the completion of projects are absence of proper techno-economic studies before sanctioning projects, inadequacy of financial resources, delays in acquisition of land, problems relating to award of contracts, poor performance of consultants, vendors and contractors, delays in obtaining clearances, inadequate infrastructure support and poor law and order situations in certain parts of the country. Railway projects, in particular, were affected by inadequate pre-project surveys, funds shortages and problems relating to civil works and acquisition of land. There was also a substantial setback in the progress of the projects under the NHDP since February 2003 (particularly in Uttar Pradesh, Orissa, Tamil Nadu and Karnataka). Of the total cost overrun in respect of delayed projects, the power sector accounts for around 52 per cent of the total cost overrun in respect of delayed projects.
June 2003 |
June 2002 |
June 2001 |
||
|
|
||||
1 |
2 |
3 |
4 |
|
|
|
||||
Ahead |
42 |
77 |
5 |
|
On Schedule |
70 |
71 |
54 |
|
Delayed |
93 |
61 |
56 |
|
Without O.D.C and D.O.C |
59 |
69 |
74 |
|
Total |
264 |
278 |
189 |
|
Cost Overruns of Delayed |
||||
Projects (Rupees crore) |
26,258 |
24,326 |
21,957 |
|
Cost Overruns of Delayed |
||||
Projects (as % of Original |
||||
Cost of such projects) |
59.0 |
60.2 |
76.0 |
|
|
|
||||
Notes : |
ODC : Original Date of Commissioning. DOC : Date of Commissioning. |
|||
Source: |
Ministry of Statistics and Programme Implementation, Government of India. |
|||
2.24 Sustainable growth hinges around the existence of a critical minimum in terms of the availability of the physical infrastructure. The acceleration of growth in the 1980s and 1990s exposed the gaps in the infrastructure, particularly in power, roads and highways, ports and telecommunications. Although the demand-supply gaps have narrowed since the second half of the 1990s, infrastructural bottlenecks remain the major impediment to accelerating growth. A critical issue in the development of the infrastructure is financing. Infrastructural projects are prone to a variety of risks beyond the traditional management and technical risks. The free rider problem and political considerations create appropriability risk. Financial and legal risks arise from non-recourse financing, complex payment mechanisms and imperfect credit enhancement. There are also instrument-specific risks arising from maturity mismatches, exposure to market risk, restrictions on assignability and charge creation. Evolving appropriate mechanisms to manage these risks holds the key to releasing resources for financing infrastructure (Box II.4).
Mergers and Acquisitions (M&As)
2.25 The process of industrial restructuring continued during 2002-03 via mergers and acquisitions. The most important deals in 2002-03 were either due to privatisation of major public sector undertakings or deals struck by major domestic companies and multinational companies (MNCs).
2.26 As against 1,048 deals involving an amount of Rs.35,086 crore struck in the previous year, there were only 841 acquisition deals involving an amount of Rs.23,113 crore in 2002-03. There were 332 merger deals as against 319 during 2001-02.
2.27 The depressed stock market conditions in India encouraged open offers by promoters interested in increasing their stakes in industries with good growth prospects, but suffering from poor stock market valuations. There were 109 open offers/bids involving an amount of Rs.5,465 crore during 2002-03 as against 99 open offers/bids with an amount of Rs.4,791 crore during 2001-02. These developments provide an insight into the deep-seated changes underway in the structure of Indian industry (Box II.5).
Small Scale Industries
2.28 Small scale industries (SSIs) continued to be an important segment of Indian industry in terms of output and employment. Despite relatively high interest rates faced by SSI units and increasing competition from domestic and foreign producers due to dereservation and import liberalisation of items, the SSI sector withstood the overall slowdown in the industrial sector, recording higher production and employment (Table 2.9).
|
|
|||||
2002-03 |
2001-02 |
2000-01 |
1995-96 |
1990-91 |
|
|
|
|||||
1 |
2 |
3 |
4 |
5 |
6 |
|
|
|||||
1. No. of Units (millions) |
3.57 |
3.44 |
3.31 |
2.66 |
1.95 |
2. Value of Output (Rupees crore) |
5,14,292 |
4,78,456 |
4,51,033 |
2,96,400 |
2,07,200 |
3. Employment (millions) |
20.0 |
19.2 |
18.6 |
15.3 |
12.5 |
|
|
|||||
Source : Ministry of Small Scale Industries, Government of India. |
|||||
2.29 There are several inhibiting factors impacting on the development of SSI. Vestiges of reservation in the small scale industry need to be phased out to enable producers to achieve appropriate economies of scale and technological upgradation. Furthermore, the SSI investment limits need to be reviewed to enable them to 'graduate' from traditional, labour-intensive, consumer-goods production to capital intensive sectors. Financial intermediaries need to review their credit assessment capabilities with regard to small-scale enterprises. Cluster-based assessment of credit to the SSI can reduce the cost of credit.
2.30 Services regained their role as the principal driver of the Indian economy, accounting for 89.4 per cent of the real GDP growth in 2002-03. The resumption of near-trend growth in services was enabled by a pick up in activity in construction, 'financing, insurance, real estate and business services' and 'community, social and personal services'. This outweighed the deceleration in the growth of 'trade, hotels, transport and communication' services which constitute a little less than half of the services sector (Table 2.10).
2.31 Since the 1990s, high growth in ‘trade, hotels, transport and communication’ services has mainly reflected the robust growth of communication which benefited significantly from the reforms underway in the telecom sector. The growth of the communication sector accelerated from an average of 16.9 per cent during 1994-98 to 21.4 per cent during 1998-2002 with its share in GDP doubling by 2001-02. A resurgence of growth of revenue from freight traffic boosted the performance of railways, which played a critical role in the movement of foodgrains to tackle the drought. Similarly, cargo traffic at major ports accelerated due to enhanced traffic in respect of iron ore, POL and coal. Transport services expanded with the increased production of commercial vehicles. Improved financial performance of the banking system enabled a recovery of activity under banking and insurance which were held back by the sluggishness experienced since 1998-99 on account of the poor performance of non-banking financial institutions. The acceleration in 'community, social and personal services' during 2002-03 was mainly on account of personal, recreational, cultural, educational and other services.
2.32 The share of services in GDP moved up to 56.1 per cent in 2002-03 from 54.6 per cent in 2001-02. Services include construction which constitutes about 5 per cent of GDP. The impact of technological progress has led to the progressive splintering and disembodiment of services from goods and from services themselves. Currently, a host of services are produced and traded independent of the mode of delivery. Accordingly, the inclusion of construction under services has become an issue of considerable debate with questions relating to the 'service content' of construction in an environment where architectural design, project appraisal and execution, and a variety of managerial and technical services embodied in construction are priced and exchanged separately (Box II.6).
Box II.6 An important issue in the context of the structural transformation of the Indian economy is the classification of construction - whether as secondary or as tertiary activity. This has implications for the assessment of structural shifts and sectoral performance within the overall growth process. In the Economic Survey, the share of industry including construction was placed at 27.1 per cent of GDP in 2002-03, while services accounted for 50.8 per cent. On the other hand, in the Reserve Bank's Annual Reports, construction is included under services. Consequently, the share of the services works out to 56.1 per cent while that of industry to 21.8 per cent in 2002-03. The difference in classificatory practice with regard to construction produces variation in sectoral growth rates (Table). In the Indian national accounts, construction comprises kutcha and pucca activities. The estimates of pucca construction, based on the use of construction materials such as cement, steel, bricks, timber and fixtures are prepared by the commodity flow approach, which is also adopted for computing the value added for the manufacturing sector. On the other hand, the estimates of kutcha construction undertaken with the help of freely available materials like leaves, reeds and mud are prepared by the expenditure approach which is adopted for estimation of GDP originating from the various kinds of services. If the mode of compilation is employed as a criterion, pucca construction needs to be classified under industry and kutcha construction under services. On the other hand, construction is also categorised as a part of fixed capital formation, partaking the features of industrial activity. The debate on the classification of construction is not new. Conceptual difficulties were evident even in seminal works on the classification of the economy by type of activity with some preference expressed for including construction under services since a large part of its output consists of 'repair and maintenance work'. An intuitive bias for inclusion of construction under services is also discernible in India. Cross-country practices do not offer standards and are beset with a lack of uniformity. In some cases, construction is categorised separately without including it under any particular activity group (viz., the Singapore Monetary Authority and the European Central Bank). Construction is treated as part of industry in the national accounts statistics of several countries including the US and the UK. The United Nations Statistical Office recommends that the general scope of the index of industrial production (IIP) should include construction apart from mining, manufacturing, electricity and gas. However, due to constraints of the data availability, the present general index of industrial production compiled in India has in its scope the mining, manufacturing and electricity sector only. In the IMF's data dissemination, the coverage of industrial production indices comprises mining and quarrying, manufacturing and electricity, gas and water supply. The growing tertiarisation of the production process and the industrialisation of services as well as the growing externalities associated with services make an analytical classification by type of activity difficult. In particular, this poses a challenge to evaluating industrial production under a broader coverage inclusive of services. References
|
Information Technology Services
2.33 India maintained its internationally competitive edge in the production and exports of information technology (IT) services during 2002-03, despite a general contraction in this sector worldwide and intensifying competition. Revenues surged by 26 per cent, drawing from a major jump in IT enabled/ Business Process Outsourcing (BPO) services. IT enabled services grew at over 65 per cent during 2002-03 on account of increased outsourcing by US firms to cut costs and to improve bottom lines which improved India's export prospects. The BPO segment is estimated to have accounted for about a quarter of the total IT Enabled Services (ITES) and software exports from India. Indian companies increased their share of global IT spending and began to increase market penetration in new destinations in the Asia-Pacific region. Lower spending on IT was reflected in a fall in the share of India's software exports to Europe.
2.34 A factor contributing to the buoyancy in the services sector has been a shift in the consumption pattern away from goods over the years. The share of services in private final consumption expenditure in the domestic market moved up from 24.4 per cent in 1993-94 to 27.0 per cent in 2001-02. An examination of consumption patterns shows a clear preference in favour of expenditure on transport and communication. There has also been an increased allocation of investment in favour of services; its share in aggregate capital formation moved up from 41 per cent in 1993-94 to 45 per cent in 2001-02.
2.35 The Indian economy continues to be predominantly services-intensive. Recent estimates show that 55 per cent of all the economic activities are directly services-intensive. Consequently, a major factor contributing to a resumption of the momentum of services sector growth was the pick up in industrial growth during 2002-03. The sustainability of services growth over the medium term would depend upon the emergence and growth of information, communication and entertainment and other 'new economy' of services, as well as the fuller exploitation of existing comparative advantages and synergies with commodity producing sectors.
2.36 The halting recovery of aggregate demand seems to have restrained a stronger acceleration of sectoral activity in 2002-03. The evolution of real effective demand up to 2001-02 indicates that it is consumption which has held up aggregate demand in the period of slower growth since 1998-99. The upsurge in real consumption expenditures in the recent period was shared between private final consumption expenditure and government final consumption expenditure, the latter including the counter-cyclical component of fiscal policy in the context of the slowdown. On the other hand, the growth of real gross fixed capital formation slowed down in both private and public sectors, reflecting the moderation of planned investment in the presence of idle capacity. Since 1995-98, there has been a precipitous decline in private fixed investment in real terms and considerable volatility in stocks/inventories (Table 2.11).
|
|
|||||||
# |
Based on select disposition of real GDP at market prices. |
||||||
* |
Quick Estimates. |
||||||
@ |
Provisional. |
||||||
+ |
Adjusted for errors and omissions. |
||||||
++ |
Unadjusted for errors and omissions. |
||||||
Source: Central Statistical Organisation. |
|||||||
Saving and Capital Formation
2.37 The gross domestic saving (GDS) rate has been increasing in recent years, buoyed by the rise in both physical and financial saving of the household sector (Appendix Table II.10). A major factor contributing to this increase has been a steady improvement in personal disposable income. The improvement in the financial saving of the household sector has been mainly in the form of contractual instruments (Appendix Table II.11).
2.38 A major area of concern is an unprecedented deterioration in the rate of public sector saving from a high of 2 per cent of GDP in 1991-92 to a dissaving which began in 1998-99 and touched (-)2.5 per cent in 2001-02, posing a constraint on growth. The poor performance of public sector saving is attributable to a persistent fall in the gross tax/GDP ratio, coupled with the increase in expenditures on salaries under the Fifth Pay Commission award. The rate of saving of the private corporate sector has decelerated since 1996-97 as a result of declining profitability in the downswing of the business cycle (Chart II.5).
(Amount in Rupees crore) |
|||||||
|
|
|||||||
Item |
2002-03# |
2001-02P |
2000-01P |
1999-00 |
1998-99 |
||
|
|
|||||||
1 |
2 |
3 |
4 |
5 |
6 |
||
|
|
|||||||
A. |
Financial assets (Gross) |
3,39,626 |
2,97,816 |
2,58,171 |
2,41,051 |
2,07,103 |
|
a) As per cent of GDP at current market prices |
13.7 |
13.0 |
12.3 |
12.4 |
11.9 |
||
1. |
Currency |
30,560 |
28,156 |
17,686 |
20,845 |
21,822 |
|
a) As per cent of GDP at current market prices |
1.2 |
1.2 |
0.8 |
1.1 |
1.3 |
||
b) As per cent of financial assets (gross) |
9.0 |
9.5 |
6.9 |
8.6 |
10.5 |
||
2. |
Deposits@ |
1,27,151 |
1,18,477 |
1,05,020 |
90,517 |
80,233 |
|
a) As per cent of GDP at current market prices |
5.2 |
5.4 |
5.0 |
4.7 |
5.0 |
||
b) As per cent of financial assets (gross) |
37.4 |
39.8 |
40.7 |
37.6 |
38.7 |
||
3. |
Claims on Government |
57,983 |
51,929 |
39,007 |
28,985 |
28,220 |
|
a) As per cent of GDP at current market prices |
2.3 |
2.3 |
1.9 |
1.5 |
1.6 |
||
b) As per cent of financial assets (gross) |
17.1 |
17.4 |
15.1 |
12.0 |
13.6 |
||
4. |
Investment in shares and debentures+ |
13,299 |
8,251 |
10,932 |
18,119 |
6,992 |
|
a) As per cent of GDP at current market prices |
0.5 |
0.4 |
0.5 |
0.9 |
0.4 |
||
b) As per cent of financial assets (gross) |
3.9 |
2.8 |
4.2 |
7.5 |
3.4 |
||
5. |
Contractual saving** |
1,10,634 |
91,002 |
85,526 |
82,585 |
69,836 |
|
a) As per cent of GDP at current market prices |
4.5 |
4.0 |
4.1 |
4.3 |
4.0 |
||
b) As per cent of financial assets (gross) |
32.6 |
30.6 |
33.1 |
34.3 |
33.7 |
||
B. |
Financial liabilities |
65,563 |
46,679 |
31,756 |
35,275 |
26,773 |
|
a) As per cent of GDP at current market prices |
2.7 |
2.0 |
1.5 |
1.8 |
1.5 |
||
C. |
Saving in financial assets (Net) (A-B) |
2,74,063 |
2,51,136 |
2,26,415 |
2,05,776 |
1,80,330 |
|
a) As per cent of GDP at current market prices |
11.1 |
10.9 |
10.8 |
10.6 |
10.4 |
||
|
|
|||||||
# |
Preliminary. P Provisional. |
||||||
@ |
Comprise bank deposits, non-bank deposits and trade debt (net). |
||||||
+ |
Including units of Unit Trust of India and other Mutual Funds. |
||||||
** |
Comprise Life Insurance, Provident and Pension Funds. |
||||||
Notes : |
|||||||
1. Based on the latest available information, these data are revised in July 2003 and hence may not tally with the data published in the Quick Estimates of the Central Statistical Organisation released in January 2003. |
|||||||
2. Data on GDP at current market prices for 2002-03 are not yet available from the CSO. In this Table, GDP at current market prices for2002-03 has been estimated on the basis of the Revised Estimates of GDP at factor cost at current prices for 2002-03 released by the Central Statistical Organisation in June 2003. |
|||||||
2.39 On the basis of the latest available data, financial saving (net) of the household sector, as a percentage of gross domestic product at current market prices, is estimated at 11.1 per cent in 2002-03 as compared with the revised estimate of 10.9 per cent in the previous year (Table 2.12). The marginal increase in 2002-03 primarily reflected increases in the rates of contractual saving (life insurance, provident and pension funds) and shares and debentures. In contrast, the rate of household sector saving in the form of deposits is estimated to have shown a marginal deceleration in 2002-03 principally due to non-bank deposits and trade debt (net).
2.40 Despite the easing of the traditional constraints on the availability of domestic and external saving, rates of gross capital formation (GCF) at current prices and gross domestic capital formation (GDCF) (adjusted for errors and omissions) have decelerated (Table 2.13). The persistent slowdown in the private corporate investment rate underscores the imperatives for intensifying reforms in the core and infrastructure sectors of the economy. Available stylised and empirical evidence points to the crowding-in effects of public sector investment in the infrastructure sectors. Consequently, the declining trend in the rate of public sector investment is expected to have dampened private sector investment in an environment dominated by a synchronised global downturn in investment appetite.
|
|
|||||||
(As percentage of GDP at |
|||||||
current market prices) |
|||||||
Item |
2001-02* |
2000-01@ |
1999-2000 |
||||
|
|
|||||||
1 |
2 |
3 |
4 |
||||
|
|
|||||||
1. |
Household Sector |
11.3 |
11.2 |
10.3 |
|||
2. |
Public Sector |
6.3 |
6.4 |
6.9 |
|||
3. |
Private Corporate Sector |
4.8 |
4.9 |
6.5 |
|||
4. |
Gross Capital Formation (GCF) 22.4 |
22.5 |
23.7 |
||||
5. |
Gross Domestic Capital |
||||||
Formation (GDCF)# |
23.7 |
24.0 |
25.2 |
||||
|
|
|||||||
* Quick Estimates. |
@ Provisional. |
||||||
# |
GDCF is adjusted for errors and omissions. |
||||||
Source: |
Central Statistical Organisation. |
||||||
2.41 Domestic saving has traditionally financed over 90 per cent of investment in India. The recourse to external saving has averaged less than one per cent of GDP since 1991-92. The deceleration of the investment rate has essentially reflected the failure of investment demand to absorb available resources. The overall saving-investment balance turned around into a surplus of 0.2 per cent of GDP in 2001-02 for the first time after the period 1975-78 (Box II.7).
2.42 The growth prospects for the current financial year hinge around the sustainability of the industrial upturn and a recovery in agricultural performance. The performance of agriculture would continue to depend upon the progress of monsoon, particularly its spatial distribution. Initial expectations support a strong rebound from the absolute decline in output recorded last year. The climate for industrial revival is showing a distinct improvement in an environment of higher overall growth prospects, low and stable inflation, rising international competitiveness and conducive monetary and fiscal policies. The higher growth momentum in industry during 2003-04 so far was maintained principally on account of four out of the top five growth contributors in 2002-03. Basic chemical and chemical products, however, showed a decline, while rubber exhibited a turnaround in its performance. In terms of use-based classification, the consumer durables witnessed a turnaround over the corresponding quarter of the previous year. On the other hand, some deceleration was witnessed in the basic goods mainly on account of mining sector. The overall industrial growth at 5.3 per cent during April-June 2003 was higher than 4.3 per cent experienced a year ago. However, the infrastructure growth during the first quarter of 2003-04 at 4.1 per cent still trails behind the 6.2 per cent growth recorded in the first quarter of 2002-03. The financial performance of the private corporate sector has shown substantial improvement in terms of sales and profitability. Leading indices of industrial activity are indicating stable growth ahead. The industrial outlook is optimistic with expectations of fresh capital investments in existing projects, increase in capacity utilisation and a stabilising of inventory levels. Export demand is expected to increase over the next six months, supported by a realistically valued exchange rate. Easing the constraints in terms of availability of power, procedural bottlenecks, cost and availability of credit, and road and port facilities will entrench the industrial recovery. The buoyancy of the services sector would be contingent upon the strength of the symbiotic interface with the goods sector and the growth of 'new economy' activities.
2.43 The Tenth Five Year Plan (2002-07) has envisaged an average annual growth of 8 per cent. India's growth experience over the Eighth and Ninth Plan periods demonstrates that this growth target is feasible. The future growth strategy will have to rely on a combination of increased investment and improvement in efficiency. Rapid dismantling of policy constraints, procedural rigidities and price distortions will play a critical role in the drive to a higher growth path. It will also require that the appropriate changes in institutional architecture are put in place. In these efforts, achieving a growth rate of 6.0 per cent in 2003-04 becomes a critical minimum.

Share this page:


Install the RBI mobile application and get quick access to the latest news!


