 IST,
IST,


Chapter III : Financial Sector: Regulation and Developments
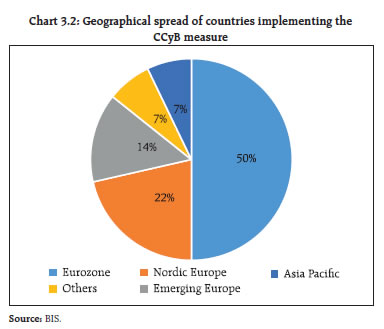
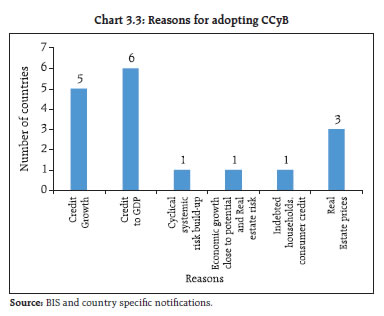
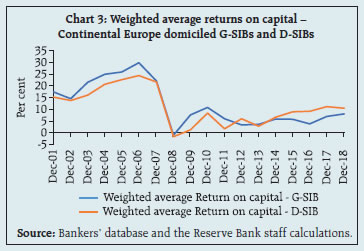
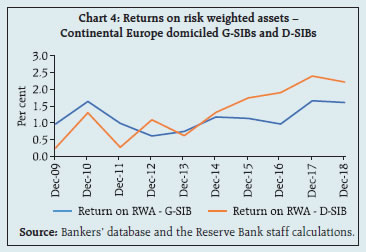
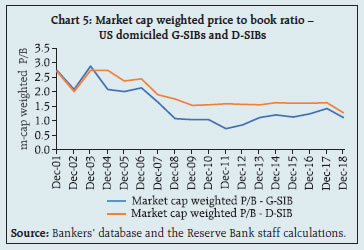
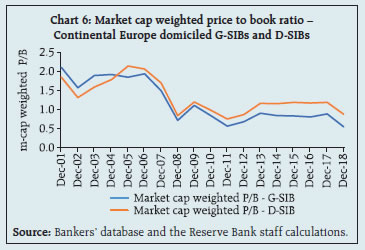
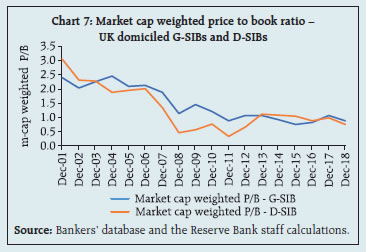
While significant progress has been made globally in improving banks’ resilience through the adoption of multiple macroprudential tools to tailor policy responses, perceived sources of vulnerabilities have moved from banking to non-banking financial intermediation, corporate indebtedness and asset market illiquidity which require policy response. On the domestic front, the Reserve Bank initiated policy measures to introduce a liquidity management regime for non-banking financial companies (NBFCs), to improve the banks’ governance culture, for resolution of stressed assets and the development of payment infrastructure. Adoption of a revised prudential framework on stressed assets is making slow progress owing to a hold-up at the resolution plan (RP) level. Given the complexity of the new accounting standards introduced in the NBFC sector, the subjective interpretation of Ind AS across financial firms requires attention. The Securities and Exchange Board of India (SEBI) has taken a number of steps to improve the financial markets including a revised risk management framework for liquid funds, revised norms for investment and valuation of money market and debt securities by mutual funds (MFs), revised norms for credit rating agencies (CRAs), facilitating new commodity derivative products and setting up institutional trading platforms (ITPs) on stock exchanges to promote start-ups. The Insolvency and Bankruptcy Board of India (IBBI) continues to make steady progress in the resolution of stressed assets. The Insurance Regulatory and Development Authority of India (IRDAI) has taken initiatives for growth of InsurTech and strengthening insurers’ corporate governance processes. The Pension Fund Regulatory and Development Authority (PFRDA) continues to bring more citizens under the pension net. International and domestic regulatory developments International developments 3.1 Well over a decade after the global financial crisis (GFC) and the subsequent policy responses, the global financial system remains vulnerable (Global Financial Stability Report (GFSR), October 2019), although according to GFSR the sources of vulnerability have moved from being led by the banking sector to being led by corporate and emerging market indebtedness, and asset market illiquidity. The International Monetary Fund (IMF) has exhorted that to avoid unintended consequences brought in by generally accommodative monetary policies being adopted globally, macroprudential policies may be tightened. 3.2 One of the aims of the post-crisis reforms has been to protect the banking sector from periods of excess aggregate credit growth that have often been associated with the build-up of system-wide risks. One such post-crisis measure, the countercyclical capital buffer (CCyB), aims to ensure that the banking sector’s capital requirements take into account the macro-financial environment in which the banks operate. The countercyclical buffer regime was phased-in in parallel with the capital conservation buffer between January 2016 and December 2018 and became fully effective on January 01, 2019. A brief review of the variability in the application of CCyB is presented in Chart 3.1. A jurisdiction-wise break-up of CCyB’s implementation (Chart 3.2) suggests that Euro zone countries dominate the implementation of CCyB norms. Incidentally, European Central Bank (ECB) has deployed some of the most aggressive monetary measures to counter ‘below the target’ inflation and growth. It may be mentioned here that since CCyB is often applied prospectively, in some of the regimes the announced CCyB measures are yet to take effect. Three frequently cited reasons for adopting CCyB are: stabilising credit to GDP ratio, stabilising absolute growth in credit and stabilising real estate prices (Chart 3.3). Incidentally, while US has not formally adopted any additional CCyB, its stress test framework, the Comprehensive Capital Analysis and Review (CCAR), possibly contains a buffer for forward looking risks including some of the risks sought to be captured by CCyB. 3.3 According to GFSR (October 2019), authorities across the world have adopted a number of macroprudential tools to tailor policy responses to specific circumstances. Charts 3.4 and 3.5 outline the number of tools targeted towards nonbanking financial intermediaries as also household and corporate sectors. However, notwithstanding the deployment of these tools, GFSR (October 2019) cautions about three specific vulnerabilities – a rising corporate debt burden, illiquidity of institutional investor portfolios and increased reliance on external borrowings by emerging and frontier market economies. 3.4 Post-crisis reforms were aimed at mitigating systemic risks that arise from global systemically important banks (G-SIBs). Box 3.1 outlines some of the salient features of the operational performance of G-SIBs and domestic systemically important banks (D-SIBs) in the post-crisis period across some of the major banking jurisdictions. This issue has implications for the regulatory architecture of the ‘too-big-to-fail’ (TBTF) financial intermediaries in emerging economies. Typically, it is assumed that the banking sector exhibits economies of scale. However, in the post-crisis period, it seems that the economies of scale through size are not commensurate with the attendant costs (both regulatory and management) for TBTF intermediaries, given the spillover potential of such entities.
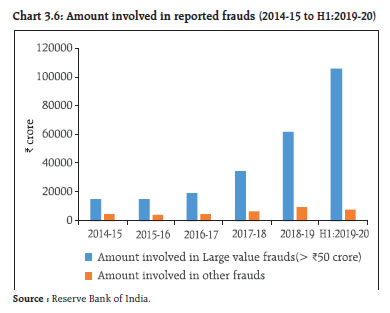
3.5 Probability of default is one of the fundamental metrics for judging the riskiness of a credit portfolio. Yet, the differing capital standards for measuring capital for credit risk (standardised versus the internal-rating based approaches) lead to different interpretations of what constitutes a default. With the implementation of the International Financial Reporting Standards (IFRS) based expected credit loss oriented accounting regime (from the erstwhile incurred loss based regime), the semantics of ‘default’ get further complicated and hence there is a need to harmonise various strands of regulatory and accounting measurements of the default risk. To this end, the European Banking Authority (EBA) recently harmonised the definition of a borrower being declared in default across member states in its recently released final draft1 of the Regulatory Technical Standards (RTS) on the materiality threshold of past due credit obligations. The guidelines clarify all aspects related to the application of the definition of default. The conditions set out in RTS require that competent authorities set a materiality threshold that is composed of both an absolute and a relative threshold. The absolute threshold refers to the sum of all past due amounts related to a borrower’s credit obligations towards the institution. The relative threshold is defined as credit obligations past due as a percentage of total on-balance sheet exposures to the obligor (excluding equity exposures). In a case where both these limits are breached for 90 consecutive days (or 180 days if the competent authority has decided to replace 90 days with 180 days in accordance with Article 178(1)(b) of the Capital Requirements Regulation (CRR)), it would be considered that a default has occurred. The implementation of the guidelines and RTS is expected at the latest by end-2020 but institutions are encouraged to introduce the necessary changes as soon as possible. This may be relevant in the Indian context with the implementation of Ind AS by Indian authorities for NBFCs. 3.6 The International Organisation of Securities Commissions (IOSCO) committee on emerging risks analysed the factors affecting liquidity under stressed conditions in the secondary corporate bond markets. Its report2 observes that the structure of the corporate bond market has changed significantly since the financial crisis. These changes are a result of aspects such as post-crisis regulations that have reduced the intermediaries’ capacity to provide liquidity in secondary corporate bond markets, greater risk aversion on the part of the intermediaries, gradual introduction of electronic trading and significant growth in the size of these markets resulting from central banks’ quantitative easing policies and low rates of return on other financial assets. The report also notes that market participants’ willingness, resources and ability to provide sufficient demand-side liquidity to help stabilise markets will be critical factors in determining how corporate bond markets operate under stress. 3.7 The US Securities and Exchange Commission (SEC) in its recently released proposed rules3 for regulating proxy advisors (PAs) overhauled the complete framework of regulations of proxy advisors. As opposed to being regulated under a fiduciary type regime, in the proposed regulations the proxy advisors are to be regulated under the “solicitation” regime. SEC in its proposal specifically underlines the difference that such a new regime entails for PAs ”… the furnishing of proxy voting advice by a person who has decided to offer such advice, separately from other forms of investment advice, to shareholders for a fee, is conducting the type of activity that raises the investor protection concerns about inadequate or materially misleading disclosures that Section 14(a) and the Commission’s proxy rules are intended to address” ... Conceptually, under a fiduciary type responsibility the PAs’ duties were essentially to their clients. However, under the solicitation regime PAs may be held responsible, as the extract above states, under investor protection by any third party. Also under SEC’s proposed rules the PA voting advice has to be first routed through corporate managers to give them a chance to respond before it is released to investor clients. The changing regulatory landscape for PAs holds significant implications for corporate governance and oversight globally. Domestic developments I. Regulatory and market developments 3.8 Sound corporate governance and a robust compliance culture will strengthen reliance on a regulated entity’s internal processes. In this regard, supervisory experience underscores the importance of having appropriate levels of authority, responsibility, accountability and checks and balances in each entity including those of the board of directors, senior management and the assurance functions. The Reserve Bank of India has laid down rules4 for compensation packages offered to the top management of private lenders and foreign banks and introduced mandatory rules to claw back the rewards if a lender falters. Risk taking and governance in a financial intermediary are inextricably linked. This link makes governance in a financial institution akin to culture of a society and has to be observed more from practice than from the enshrined codes. 3.9 The Task Force on Offshore Rupee Markets in its report5 submitted on July 30, 2019 recommended several important measures to incentivise non-residents to access the onshore foreign exchange market. The Reserve Bank has decided to accept the key recommendations viz., (i) allowing domestic banks to freely offer foreign exchange prices to non-residents at all times, out of their Indian books, either by a domestic sales team or through their overseas branches; and (ii) permitting rupee derivatives (with settlement in foreign currency) to be traded in International Financial Services Centres (IFSCs). The Reserve Bank constituted a Task Force on the Development of a Secondary Market for Corporate Loans which recently came out with suggestions6 for enhancing the secondary market for corporate loans. The task force acknowledges the need for more market participants and removal of regulatory hurdles and restrictions. II. The Financial Stability and Development Council 3.10 Since the publication of the last FSR in June 2019, the Financial Stability and Development Council (FSDC) held its 21st meeting on November 07, 2019 which was chaired by the Finance Minister of India. The Council reviewed the current global and domestic macroeconomic situation and financial stability and vulnerability issues, including those concerning NBFCs and credit rating agencies. The council reviewed the action taken by members on the FSDC’s decisions taken earlier and held discussions on the proposals submitted for further strengthening of the resolution framework and the framework for cyber security of the financial sector. The Council also took note of the activities undertaken by the FSDC Sub-Committee chaired by the Governor, RBI and the initiatives taken by the various regulators in the financial sector. 3.11 The Sub-Committee of the FSDC held its 23rd meeting on September 27, 2019 chaired by the Governor, RBI. It reviewed major developments in global and domestic economies and financial markets that impinge on financial stability. The Sub-Committee discussed measures to promote interest and competition in stressed assets market, enhancing the scope of the Legal Entity Identifier (LEI) to more effectively monitor group exposures, issues relating to credit rating agencies and audit quality. It discussed measures to strengthen the system against frauds and deliberated on revisiting the framework for early warning signals. III. Banks (A) Banking frauds 3.12 A brief analysis of frauds with amounts involving '₹ 1 lakh and above' during the last 5 years is presented in this section. A systemic and comprehensive check of legacy stock of PSBs’ NPAs for frauds during H1:2019-20 helped unearth frauds perpetrated over a number of years and this is reflected in an increased number of reported incidents of frauds in recent years (Table 3.1 and Chart 3.6).
Vintage of frauds 3.13 An analysis of the vintage of frauds reported during the FY 2018-19 (Table 3.3) and H1:2019-20 (Table 3.4) shows a significant time-lag between the date of occurrence of a fraud and its detection. The amount involved in frauds that occurred between FY 2000-01 and FY 2017-18 formed about 90.6 per cent of the frauds reported in 2018-19 in terms of value. Similarly, 97.3 per cent of the frauds reported in H1:2019-20 by value occurred in previous financial years. 3.14 The relative share of each bank group in the overall reported frauds is given in Table 3.5. Category of frauds 3.15 Similar to earlier trends, loan-related frauds continued to dominate in aggregate constituting 90 per cent of all frauds reported in FY 2018-19 by value and constituting 97 per cent of all frauds reported in H1:2019-20 by value (Tables 3.2 and 3.6). 3.16 The Reserve Bank is taking steps to integrate fraud reporting of NBFCs and Urban co-operative banks in its central fraud registry database. Such interlinking would serve as an invaluable resource in effective fraud detection/monitoring. In addition, a greater thrust has been put on improved governance. Special emphasis is being given towards specific expectations on Board/ its committees and senior management towards fraud management. A sharpened focus on fraud response plan is being sought from the banks and for this, stricter timelines and clear cut guidance with respect to reporting of frauds and declaration and processing of red flagged accounts (RFAs) will be prescribed. Banks are required to set up specialised units to make use of market intelligence and data analytics and also put in place transaction monitoring system. In order to bring clarity, the role and scope of forensic audit along with timelines is also being examined. Further, to ensure effective implementation of early warning signals (EWS) which has been designed to strengthen the frameworks of early detection and pre-emptive actions, banks are being provided with a list of EWS that should be mandatorily a part of their tracking system, in addition to a list of optional EWS, which may be included as per the specific requirements of each entity. (B) Deposit insurance 3.17 The deposit insurance agency has an important role in safeguarding financial stability. The Deposit Insurance and Credit Guarantee Corporation (DICGC) functions primarily as a pay box entity, that is, reimbursing the depositors of failed member banks, although it has some role in resolution through the provision of financial support to depositors of weak banks that merge with strong banks after the approval of the merger by the regulator. With the present limit of deposit insurance in India at ₹ 1 lakh, the number of fully protected accounts constituted 92 per cent of the total number of accounts. Amount-wise, insured deposits at ₹ 33,70,000 crore as at end- March 2019 constituted 28.1 per cent of assessable deposits at ₹ 1,20,05,100 crore. The total premium collected from member banks was ₹ 12,040 crore during 2018-19. Commercial banks contributed 93 per cent of the premium while cooperative banks accounted for the remaining 7 per cent. Premium received for H1:2019-20 was ₹ 6,484 crore. The corporation sanctioned aggregate claims of ₹ 40 crore with respect to 15 cooperative banks during 2018-19. 3.18 The Reserve Bank of India (RBI) issues directions to cooperative banks to protect the interests of the depositors and in public interest on finding serious irregularities during the course of regular inspections. The nature of these directions includes a ban on grant/renewal of loans and advances, grant of accommodation without specific authorisation from National Bank for Agriculture and Rural Development (NABARD)/RBI, making/renewing investments in bonds without prior approval of the RBI and incurring any liability including borrowing of funds and acceptance of fresh deposits or making any payments or discharging any liability or obligation except in accordance with the provisions of the directives. The total insured deposits (IDs) of State Co-operative Banks (StCBs), District Central Co-operative Banks (DCCBs) and Urban Co-operative Banks (UCBs) put under direction by the RBI as well as weak UCBs as on September 30, 2019 are given in Table 3.7. The extent of devolvement on DICGC in the event of all the banks ‘under direction’ or weak banks going into liquidation/ordered to be wound up, would be ₹ 3,414 crore in the case of StCBs/DCCBs and ₹ 10,684 crore in the case of UCBs (including Punjab and Maharashtra Co-operative (PMC) Bank) (Table 3.7). 3.19 Insured deposits of banks which are ‘under direction’ or ‘weak’ constituted about 0.4 per cent of the total insured deposits of commercial and cooperative banks as at end-September 2019. As a percentage of the deposit insurance fund, these deposits are about 13.9 per cent. It needs to be noted that the banks which are under direction/ weak will go under liquidation over a period, not together at a particular point of time. Weak banks may also witness a revival. 3.20 DICGC has facilitated the merger of 22 weak banks with strong banks since 1985 (nine commercial banks and 13 cooperative banks). However, the recovery rate of funds provided by DICGC is not satisfactory. (C) Enforcement 3.21 During July 2019 to December 15, 2019,8 the Enforcement Department (EFD) undertook enforcement action against 29 banks (including 22 Indian banks, one foreign bank and six cooperative banks) and one NBFC, and imposed an aggregate penalty of ₹ 47.92 crore for non-compliance with/ contravention of directions on fraud classifications and reporting by the banks, reporting of fraud on the CRILC platform, fraud monitoring in NBFCs, discipline to be maintained while opening current accounts, discounting/ rediscounting of bills by the banks, monitoring the end use of the funds, creating deposits near the balance sheet date and disbursal of housing loans, violations of directions/ guidelines issued by the Reserve Bank on know your customer (KYC) norms, Income Recognition and Asset Classification (IRAC) norms, and the supervisory action framework; non-compliance with licensing conditions pertaining to promoter holding, provisions of Section 10B(4) of the Banking Regulation Act, directions on the cyber security framework, time-bound implementation and strengthening of SWIFT-related operational controls, directions on honouring commitments under “Guarantees and Co-acceptances”; and contravention of directions pertaining to third party account payee cheques and prohibiting loans to directors, their relatives and firms in which they are interested, among others. (D) Resolution and recovery 3.22 The revised prudential framework on stressed assets issued by the Reserve Bank on June 07, 2019 significantly addresses earlier concerns in the stressed assets resolution framework and also builds in incentives for the early adoption of a resolution plan (RP). The framework when applied to an eligible obligor rests on two operating phases. The first involves adopting an inter-creditor agreement by all lenders. The second phase involves adopting a resolution plan through majority rule. Although the timelines for adopting the resolution plan of 210 days from the date of first default is currently applicable only for aggregate exposures (AEs) greater than ₹ 2,000 crore, a review of progress under the revised prudential framework may be useful in terms of assessing the efficacy of the framework in dealing with a pipeline of stressed assets. Based on a survey of 13 banks with regard to assets that were initially assigned to be resolved through the prudential framework (as of June 30, 2019) an inter-creditor agreement is yet to be signed for exposures amounting to ₹ 33,610 crore while the same has been signed with respect to aggregate exposures of ₹ 96,075 crore. However, the RP has been implemented only with respect to one borrower with a reported exposure of ₹ 1,617 crore. The numbers quoted here exclude the cases that are being resolved under IBC. 3.23 The Insolvency and Bankruptcy Code, 2016 provides for reorganisation and insolvency resolution of corporate persons, among others, in a time bound manner for maximising the value of the assets of such persons to promote entrepreneurship, availability of credit and for balancing the interests of all the stakeholders. Since the coming into force of the provisions of corporate insolvency resolution process (CIRP) with effect from December 01, 2016, 2,542 CIRPs had commenced by end-September 2019 (Table 3.8). Of these, 186 have been closed on appeal or review or settled; 116 have been withdrawn; 587 have ended in orders for liquidation; and 156 have ended in an approval of their resolution plans. Sectoral distribution of corporate debtor (CDs) under CIRPs is presented in Table 3.9. 3.24 The distribution of stakeholders who triggered the resolution process is presented in Table 3.10. Operational creditors (OCs) triggered 48.5 per cent of the CIRPs, followed by financial creditors (FCs) and corporate debtors (CD) (Table 3.10). 3.25 The status of CIRPs as on September 30, 2019 is given in Table 3.11. Resolution Plans 3.26 About 56.2 per cent (587 of 1,045) of CIRPs, which were closed, ended in liquidation, as compared to about 15 per cent ending with a resolution plan. However, it is important to note that 72.9 per cent of the CIRPs that ended in liquidation (427 of 586) (information on 1 CIRP about whether it is a Board for Industrial and Financial Reconstruction (BIFR) and/or defunct is not available presently) were earlier with BIFR and/or defunct (Table 3.12). The economic value of most of these corporate debtors had already eroded before they were admitted into CIRPs. (E) Payment and settlement systems 3.27 Access to non-banks in Centralised payment systems (CPS): Internationally, central banks are expanding access to payment systems by enabling various types of non-banks to become members. Bank of England has permitted access to payment institutions and e-money providers. Switzerland has provided access to fintech and insurance companies. Providing direct access to non-banks can quicken their access to funds by pruning one layer and also reduce their costs. The Reserve Bank will examine the case for increased participation of non-banks in CPS. The Reserve Bank operates CPS such as the Real Time Gross Settlement (RTGS) system and the National Electronic Funds Transfer (NEFT) system. Currently, non-bank participants who have been permitted access to CPS are standalone primary dealers, clearing corporations, central counterparties, retail payment system organisations, select financial institutions (NABARD, Export-Import Bank of India (EXIM Bank)) and DICGC. 3.28 Proposed New Umbrella Entity (NUE) for retail payment systems and its impact on financial stability: Over a decade, the National Payments Corporation of India (NPCI), an umbrella organisation for retail payment systems in India, has grown in scale and scope of its operations offering multiple payment systems and products and processing nearly 60 per cent of the retail electronic payment transactions by volume in October 2019. By virtue of the numerous payment systems that it operates, NPCI has emerged as a systemically important payment system entity. This is specifically the case for instant retail payment systems like the Immediate Payment Service (IMPS) and Unified Payments Interface (UPI), both of which are operated by NPCI. Availability of NUE offering products which will lead to the redundancy of existing systems can, besides addressing concentration risk, also encourage competition and innovation, thus contributing to financial stability. By offering alternative digital retail payment systems to the consumers, the NUE would help in enhancing the reach of digital payments to a larger number of people and thereby reduce the dependency on cash. IV. Non-banking Financial Companies (NBFCs) 3.29 With the implementation of Ind AS, a principle based accounting approach, impairment assessments which were earlier rule-based have now been subjected to entity specific interpretations. Box 3.2 examines some of the salient features of the assessment based on a study of the retail portfolios of seven major NBFCs.
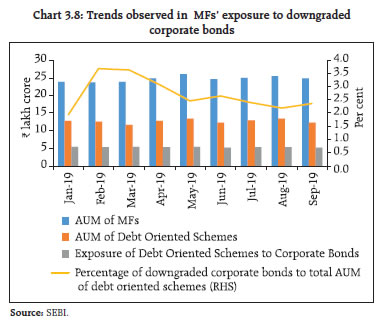
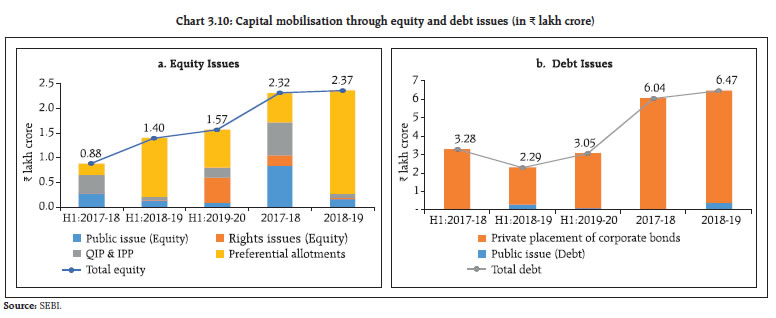
3.30 The Reserve Bank has mandated a new liquidity risk management framework9 to strengthen and raise the standards of the asset liability management (ALM) framework in all nondeposit taking NBFCs with asset size of ₹ 100 crore and above, systemically important core investment companies and all deposit taking NBFCs (these guidelines will not apply to Type 1 NBFC-NDs, non-operating financial holding companies and standalone primary dealers). V. Securities and commodity derivatives markets (A) Regulatory developments 3.31 Norms for trading of companies listed on the Innovators Growth Platform (IGP): To promote start-ups, SEBI introduced the institutional trading platform (ITP) on stock exchanges where e-commerce, data analytics, bio-technology and other start-ups can list and trade their shares. Later this platform was renamed the 'Innovators Growth Platform' (IGP) with certain modifications. Based on discussions with the exchanges and SEBI’s Primary Market Advisory Committee (PMAC), the norms for allowing companies listed on IGP to trade under the regular category of the ‘main board’ were decided. The approved norms10 for trading of companies listed on IGP include being listed for a minimum period of one year on IGP, minimum 200 shareholders at the time of making an application for trading, profitability/net worth track record of 3 years or 75 per cent of capital held by qualified institutional buyers (QIBs) as on date of migration and 20 per cent minimum promoters’ contribution which shall be locked in for 3 years. 3.32 Framework for the process of accreditation of investors for the purpose of IGP: SEBI clarified that accredited investors (AIs) for the limited purpose of IGP are investors whose holding in the issuer company is eligible for the computation of at least 25 per cent of the pre-issue capital in accordance with Regulation 283 (1) of the SEBI (Issue of Capital and Disclosure Requirements) Regulations, 2018 (ICDR Regulations). SEBI proposed a detailed framework for the process of accreditation of investors. In this framework, SEBI mandated the eligibility, procedure for accreditation, validity of accreditation and responsibility of merchant bankers at the time of listing on IGP with regard to AIs. 3.33 Framework for issuance of differential voting rights (DVR) shares: New technology firms which own relatively fewer capital assets compared to the value of their operations generally prefer equity over debt capital. However, raising equity on a periodic basis leads to dilution of founder/promoter stakes. In such new technology firms where the promoters/founders are instrumental in the success of the firms, there is a need for a structure which enables them to retain decision-making powers and rights vis-à-vis other shareholders. One such possible structure could be the issuance of shares with superior voting rights to founders/ promoters of a company. SEBI approved a framework for issuance of differential voting rights shares along with amendments to the relevant SEBI regulations. The framework also warrants amendments to the Securities Contract (Regulations) Rules, 1957. A company with superior voting rights shares (SR shares) is permitted to make an initial public offering (IPO) of only ordinary shares to be listed on the main board, subject to fulfilling eligibility requirements of the SEBI (Issue of Capital and Disclosure Requirements) Regulations, 2018 and certain conditions laid down by SEBI. Market Integrity 3.34 Disclosure of encumbrances: SEBI mandated disclosure of details regarding pledging of shares by promoters by amending the SEBI (Substantial Acquisition of Shares and Takeovers) Regulations, 1997 in January 2009. Later, the requirement continued in the SEBI (Substantial Acquisition of Shares and Takeovers) Regulations, 2011 and was further expanded to cover all types of encumbrances. Concerns were raised with regard to mutual funds’ exposure to debt and money market instruments through structured obligations, pledges of shares, non-disposal undertakings (NDUs), related party transactions, corporate/promoter guarantees and various other complex structures. To address this issue, SEBI reviewed the regulatory requirements with respect to disclosures of encumbrances (including pledges). During August 2019, SEBI came out with additional disclosure requirements to bring greater transparency regarding reasons for encumbrance, particularly when significant shareholding by a promoter along with persons acting in concert (PACs) with him is encumbered. Further, during July 2019, the scope of “encumbrance” has also been revised to include: i. any restriction on the free and marketable title to shares, by whatever name called, whether executed directly or indirectly; ii. pledge, lien, negative lien, non-disposal undertaking; or iii. any covenant, transaction, condition or arrangement in the nature of encumbrance, by whatever name called, whether executed directly or indirectly. Additionally, the promoters of listed companies are now required to declare to the audit committee of the company and to the stock exchanges on a yearly basis, that they along with PACs, have not made any encumbrance, directly or indirectly, other than those already disclosed during the financial year. 3.35 SEBI revised the Risk Management Framework of Liquid Funds, Investment Norms and Valuation of Money Market and Debt Securities by MFs11: To safeguard investors’ interests and for maintaining the orderliness and robustness of mutual funds various regulatory measures have been notified in the recent past. Some of the significant measures concerning liquid funds include holding at least 20 per cent of their assets under management in liquid assets, levy of exit load and restrictions on investing in short-term deposits and debt and money market instruments having structured obligations or credit enhancements. Some of the significant measures on investment norms include reduced exposures of 20 per cent to a single sector (as against the earlier 25 per cent), cap of 10 per cent for investment in unlisted non-convertible debentures (NCDs), investments only in listed CPs, adequate security cover for investment in debt securities having credit enhancements backed by equities directly or indirectly, etc. In order to bring uniformity and consistency in valuation, and to ensure fair pricing of the money market and debt securities, various guidelines on the waterfall approach to be followed for valuation of money market and debt securities by mutual funds have been issued. Further, with effect from April 01, 2020, all money market and debt securities shall be valued on mark to market basis only. 3.36 Parking of funds in short term deposits of SCBs by mutual funds – pending deployment: To ensure that the funds collected in a scheme are invested as per the investment objectives stated in the offer document, SEBI stipulated guidelines in 2007 for parking of funds by mutual funds in short-term deposits (STDs) of SCBs pending deployment. ‘Short term’ for such parking of funds by mutual funds is treated as a period not exceeding 91 days. SEBI clarified that trustees/asset management companies (AMCs) have to ensure that no funds of a scheme are parked in a bank’s STDs which has invested in that scheme. Trustees/AMCs also need to ensure that the bank in which a scheme has STDs does not invest in the said scheme until the scheme has STDs with the bank. (B) Market developments (i) Mutual Funds 3.37 Mutual funds continue to be the largest net providers of funds to the financial system. During April-September 2019 there was a net inflow of ₹ 1,64,000 crore as compared to an outflow of ₹ 2,66,300 crore witnessed during the same period in 2018. Assets under management (AUM) increased by 11.2 per cent as at end-September 2019 compared to September 2018 (Chart 3.7). Systematic investment plans (SIPs) have been growing continuously, which is adding stability to the inflows. 3.38 MF inflows through SIPs: SIPs continue to be a favoured choice of investors since 2013-14. During April-September 2019, the number of folios increased by 19 lakh (Table 3.13). There was a growth of 454 per cent in the number of SIPs from 2013-14 to 2019-20 with the numbers increasing from 60 lakh to 332 lakh. Investments through SIPs in mutual funds are relatively more stable from the point of view of sustainability of fund inflows (Table 3.14).  3.39 MFs’ exposure to downgraded corporate bonds: While investments in corporate bonds offer higher returns, the risk premium may not be commensurate with the current elevated risks in the corporate bonds market. The exposure of debt oriented mutual fund schemes to corporate bonds as a percentage of total AUM of these schemes was 42.9 per cent at end-September, 2019 as against 44.3 per cent as at end-September 2018. The exposure of debt oriented mutual funds to corporate bonds which have been downgraded during the last 6 months decreased to 2.37 per cent in September 2019 from 3.63 per cent in March 2019. The percentage touched a record high of 3.69 in February 2019 followed by a decreasing trend thereafter (Chart 3.8). (ii) Trends in capital mobilisation 3.40 FY 2018-19 witnessed a nearly 6 per cent increase in the total capital raised in primary markets as compared to the previous year (Chart 3.9). The first half of FY 2019-20 witnessed an increase of 24 per cent; ₹ 4.7 lakh crore was raised during April- September 2019 as compared to ₹ 3.8 lakh crore during the same period in the previous year. 3.41 During H1:2019-20 the funds raised by public issues in both equities and debt and preferential allotments went down as compared to H1:2018-19, whereas the funds raised through right issues, qualified institutional placements (QIPs) in equities and private placements of corporate bonds witnessed a sharp increase during the same period (Chart 3.10a and b). 3.42 During H1:2019-20, about ₹ 7500 crore was raised through public issues in the bond market. Further, about ₹ 3 lakh crore was raised through private placements of corporate bonds during the same period (Chart 3.10). The major issuers of corporate bonds were body corporates and NBFCs accounting for nearly 50 per cent of outstanding corporate bonds as on September 30, 2019 (Chart 3.11a) whereas body corporates and mutual funds were their major subscribers (Chart 3.11b). Chart 3.12 details the disaggregated issuer/investor profiles of public and private issuances. (C) Trends in credit ratings of debt issues of listed companies – April-September 2019 3.43 Recent norms for credit rating agencies: Over the last year, there have been growing concerns over the liquidity and credit issues at NBFCs and HFCs, starting with defaults on short term obligations by IL&FS followed by a sharp rise in the yields of certain debt papers issued by Dewan Housing Finance Company (DHFL) in the secondary market. These episodes have warranted a review of the framework under which credit rating agencies (CRAs) are operating. Inability to detect emerging financial troubles in the IL&FS group on time has also raised questions on the effectiveness of due diligence by CRAs. In November 2018, in its continued efforts to enhance the quality of disclosures made by CRAs and strengthening the rating framework, SEBI issued various guidelines to CRAs such as disclosure of parentage support, group companies and a specific section on liquidity. To further strengthen the disclosures made by CRAs and for enhancing the rating standards, SEBI prescribed additional disclosures/modifications12 in June 2019 including disclosure of average 1-year, 2-year and 3-year cumulative default rates (CDRs) computed based on the marginal default rate (MDR) approach, prepared in consultation with SEBI’s standardised and uniform PD benchmarks for each rating category, prescribing permitted tolerance levels for the rating categories AAA, AA and A and a specific section on ‘rating sensitivities’ to be included in CRAs’ press releases explaining the broad level of operating and/or financial performance levels that could trigger a rating change. Further, CRAs also need to disclose liquidity indicators using one of the indicators of superior/ strong, adequate, stretched and poor and give an explanation for this. It was reiterated that CRAs will devise a model to track deviations in bond spreads in line with that prescribed vide SEBI circular dated November 13, 2018. 3.44 An analysis of the credit rating of debt issues of listed companies by major CRAs for the last 4 quarters shows that on an aggregate basis there was an increase in the share of downgraded/ suspended companies during the April-June 2019 and July-September 2019 quarters (Table 3.15). 3.45 The rating of the underlying obligors in an investment portfolio is a visible sign of the underlying credit quality. In this regard, the role of ratings in investment screening is explored in Box 3.3.
(D) Commodity derivatives markets 3.46 During April-October 2019, the MCX COMDEX Index increased by 4.4 per cent and the NCDEX NKrishi Index increased by 2.1 per cent. Both the S&P World Commodity Index and the Thomson Reuters CRB Index declined during the period by 7.7 and 3.7 per cent, respectively (Chart 3.13). 3.47 The total turnover at all the commodity derivative exchanges (futures and options combined) increased by 15.5 per cent during H1:2019-20 as compared to H2:2018-19. During this period, commodity futures volume increased by 14.5 per cent while options volume increased by 70 per cent as compared to H2:2018-19. The commodity derivatives market witnessed mixed trends during H1:2019-20. While agri, bullion and energy segments’ turnover increased by 5.8 percent, 58.3 percent and 20.3 per cent, respectively, the turnover in the metals segment witnessed a decline of 20.8 per cent over H2:2018-19. The metals segment has been weighed down by concerns that the US-China trade war and slowing global economic growth will heavily impact their demand. Metals like nickel and iron ore have been affected by supply concerns. The energy segment witnessed a broad decline in energy prices – that of crude oil and natural gas, driven mainly by record high US production and weaker economic growth projections in emerging markets. 3.48 The total share of the non-agri derivatives in the turnover was 92.6 per cent during H1:2019-20 while agri-derivatives contributed the remaining 7.4 per cent (Table 3.16). 3.49 During H1:2019-20, the energy segment had a share of 39.6 per cent followed by bullion which had a share of 32.1 per cent. Metals had a market share of 20.9 per cent while agri-derivatives had a market share of 7.4 per cent during the period (Chart 3.14). 3.50 Futures trading in new commodities was launched by various exchanges. Multi Commodity Exchange of India Limited (MCX) launched futures contract in Kapas, National Commodity and Derivatives Exchange (NCDEX) in unprocessed whole raw moong and basmati paddy, BSE in turmeric, soybean, castor seed and chana and Indian Commodity Exchange Ltd. (ICEX) in basmati paddy. VI. Pension funds 3.51 The National Pension System (NPS) and the Atal Pension Yojana (APY) both registered growth in terms of the total number of subscribers as well as AUM. The number of subscribers in NPS and APY have reached 1.29 crore and 1.82 crore, respectively (Table 3.17). AUM under NPS and APY touched ₹ 3,74,097 crore and ₹ 9,143 crore, respectively (Table 3.17). 3.52 PFRDA continued its work towards financial inclusion of the unorganised sector and low-income groups by expanding coverage under APY. As on October 31, 2019, 403 banks were registered under APY with the aim of bringing more citizens under the pension net. Recent regulatory initiatives and their rationale 3.53 Some of the recent regulatory initiatives, including prudential and consumer protection measures and their rationale are given in Table 3.18. 1 Available at: https://eba.europa.eu/eba-harmonises-the-definition-of-default-across-the-eu. 2 Available at: https://www.iosco.org/library/pubdocs/pdf/IOSCOPD634.pdf 3 Available at: https://www.sec.gov/news/press-release/2019-231 4 Please see ‘Guidelines on Compensation of Whole Time Directors/ Chief Executive Officers/ Material Risk Takers and Control Function staff’ at: /documents/87730/39710850/NOTI898c120d41d0e3465b8552e5467edd7a56.pdf 5 Available at: /en/web/rbi/-/publications/reports/report-of-the-task-force-on-offshore-rupee-markets-937 6 Available at: /en/web/rbi/-/publications/reports/report-of-the-task-force-on-the-development-of-secondary-market-for-corporate-loans-940 7 ‘Amount involved’ need not be the loss suffered by the reporting bank. It may refer to the amount outstanding in the books of the reporting bank. Further, the entire amount lent need not have been diverted by the borrower/ fraudster. 8 Includes data for the period June 20, 2019 to June 30, 2019. 9 Please see ‘Liquidity Risk Management Framework for Non-Banking Financial Companies and Core Investment Companies.’ Available at: /en/web/rbi/-/notifications/liquidity-risk-management-framework-for-non-banking-financial-companies-and-core-investment-companies-11719 10 Available at: https://www.sebi.gov.in/sebi_data/meetingfiles/sep-2019/1567578074155_1.pdf 11 Available at: https://www.sebi.gov.in/legal/circulars/sep-2019/risk-management-framework-for-liquid-and-overnight-funds-and-norms-governing-investment-in-short-term-deposits_44328.html 12 Available at: https://www.sebi.gov.in/legal/circulars/jun-2019/guidelines-for-enhanced-disclosures-by-credit-rating-agencies-cras-_43268.html 13 Srinivasan Anand, “Rating Efficiency in the Indian Commercial Paper Market “, available at http://www.cafral.org.in/sfControl/content/Speech/311201922258PMRATINGEFFICIENCYAnandV5.pdf 14 The TR-MCX iCOMDEX Commodity Index is a composite Index based on the traded futures prices at MCX comprising a basket of contracts of bullion, base metals, energy and agri commodities. | ||||||||||||||||||||||||||||||||||||||||||||||||||||||||||||||||||||||||


Install the RBI mobile application and get quick access to the latest news!
Scan the QR code to install our app


Page Last Updated on:


