|
Today, the Reserve Bank released the results of 39th round of its quarterly Services and Infrastructure Outlook Survey (SIOS) conducted during Q3:2023-24. This forward-looking survey[1] captures qualitative assessment and expectations of Indian companies engaged in the services and infrastructure sectors on a set of business parameters relating to demand conditions, price situation and other business conditions. In the latest round of the survey, 528 companies provided their assessment for Q3:2023-24 and expectations for Q4:2023-24 as well as outlook on key parameters for the subsequent two quarters.
Highlights:
1. Services Sector
Assessment for Q3:2023-24
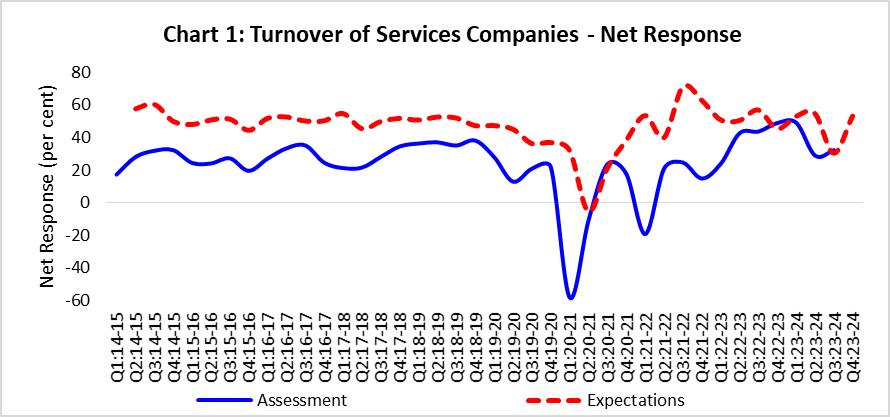
- Services sector enterprises gauged improvement in the overall business situation, employment conditions, finance availability and their turnover during Q3:2023-24 (Chart 1 and Table A).
- On the expenditure side, pressures stemming from input prices, cost of finance and staff expenses were assessed to have continued.
- Assessment for profit margin improved, benefitting from rise in turnover and selling prices.
Expectations for Q4:2023-24
- Demand for services is likely to rise further on the back of improved business situation; firms remained highly optimistic on turnover, availability of finance and job landscape (Table A).
- Cost pressures are likely to persist in Q4:2023-24; respondents displayed higher optimism on selling prices, profit margins and physical investment, when compared to the previous survey round.
Expectations for Q1:2024-25 and Q2:2024-25
- Respondents remain optimistic on business conditions for the first half of 2024-25 with sequential improvement in successive quarters. In tandem, job scenario is also expected to improve (Table C).
- Input cost pressures are likely to continue, and firms also expect rise in selling prices.
2. Infrastructure Sector
Assessment for Q3:2023-24
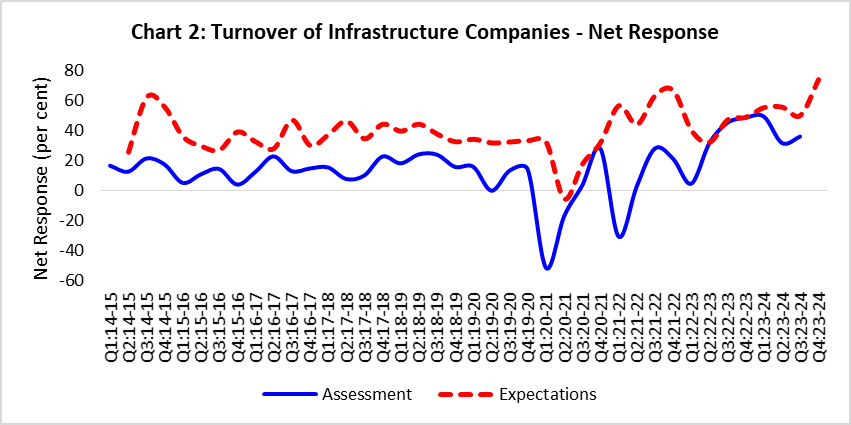
- Infrastructure companies assessed better overall business situation as well as their turnover during Q3:2023-24 (Chart 2 and Table B).
- Respondents were positive on both full-time and part-time employment.
- Enterprises assessed rise in selling prices in the phase of increasing cost pressures in the sector during Q3:2023-24.
Expectations for Q4:2023-24
- Infrastructure companies remain highly optimistic about overall business situation, their turnover and employment conditions (Table B).
- Cost pressures are likely to rise further and firms expected higher selling prices and profit margins.
- Optimism on physical investment in the infrastructure sector has surged in the latest survey round.
Expectations for Q1:2024-25 and Q2:2024-25
- Respondents expect sequential improvement on demand and employment conditions during H1:2024-25 (Table D).
- Both input costs and selling prices are likely to increase till Q2:2024-25.
Summary of Net Responses on Survey Parameters
|
|
|
(per cent)
|
|
Parameters
|
Assessment period
|
Expectations period
|
|
Q2:2023-24
|
Q3:2023-24
|
Q3:2023-24
|
Q4:2023-24
|
|
Overall Business Situation
|
34.4
|
35.6
|
43.1
|
54.8
|
|
Turnover
|
28.9
|
32.3
|
30.5
|
53.4
|
|
Full-time Employees
|
17.3
|
21.4
|
16.5
|
28.8
|
|
Part-time Employees
|
6.2
|
13.2
|
14.4
|
23.1
|
|
Availability of Finance
|
18.0
|
24.9
|
24.2
|
37.4
|
|
Cost of Finance
|
-30.1
|
-32.3
|
-26.6
|
-34.4
|
|
Salary & Wages
|
-39.2
|
-38.4
|
-29.5
|
-36.8
|
|
Cost of Inputs
|
-28.1
|
-37.9
|
-22.2
|
-45.7
|
|
Selling Price
|
6.5
|
15.1
|
14.2
|
30.7
|
|
Profit Margin
|
4.3
|
9.7
|
13.8
|
27.5
|
|
Inventories
|
16.5
|
22.2
|
22.9
|
28.3
|
|
Technical/Service Capacity
|
25.3
|
21
|
40.0
|
34.1
|
|
Physical Investment
|
27.6
|
20.1
|
22.3
|
32.2
|
|
Table B: Infrastructure Sector
|
|
(per cent)
|
|
Parameters
|
Assessment period
|
Expectations period
|
|
Q2:2023-24
|
Q3:2023-24
|
Q3:2023-24
|
Q4:2023-24
|
|
Overall Business Situation
|
29.8
|
34.2
|
64.4
|
68.1
|
|
Turnover
|
31.7
|
36.1
|
50.0
|
73.9
|
|
Full-time Employees
|
16.3
|
22.2
|
39.4
|
60.7
|
|
Part-time Employees
|
31.0
|
29.2
|
55.2
|
68.3
|
|
Availability of Finance
|
26.0
|
30.8
|
42.7
|
61.3
|
|
Cost of Finance
|
-44.8
|
-31.8
|
-54.2
|
-60.7
|
|
Salary & Wages
|
-35.9
|
-40.7
|
-39.2
|
-59.0
|
|
Cost of Inputs
|
-45.1
|
-47.9
|
-45.0
|
-55.7
|
|
Selling Price
|
20.7
|
28.0
|
38.0
|
60.0
|
|
Profit Margin
|
7.8
|
25.0
|
31.4
|
48.7
|
|
Inventories
|
36.8
|
36.9
|
57.9
|
74.3
|
|
Technical/Service Capacity
|
36.2
|
35.5
|
66.7
|
75.0
|
|
Physical Investment
|
34.2
|
31.6
|
46.8
|
75.3
|
Expectations of Select Parameters for extended period – Net response (in per cent)
|
Table C: Services Sector
|
|
Parameter
|
Round 38
|
Round 39
|
|
Q3:2023-24
|
Q4:2023-24
|
Q1:2024-25
|
Q2:2024-25
|
|
Overall Business Situation
|
43.1
|
54.8
|
57.8
|
60.6
|
|
Turnover
|
30.5
|
53.4
|
60.9
|
61.8
|
|
Full-time Employees
|
16.5
|
28.8
|
44.7
|
43.6
|
|
Part-time Employees
|
14.4
|
23.1
|
33.0
|
33.1
|
|
Cost of Inputs
|
-22.2
|
-45.7
|
-47.6
|
-46.7
|
|
Selling Price
|
14.2
|
30.7
|
37.8
|
39.4
|
|
Table D: Infrastructure Sector
|
|
Parameter
|
Round 38
|
Round 39
|
|
Q3:2023-24
|
Q4:2023-24
|
Q1:2024-25
|
Q2:2024-25
|
|
Overall Business Situation
|
64.4
|
68.1
|
76.3
|
83.8
|
|
Turnover
|
50.0
|
73.9
|
80.5
|
82.1
|
|
Full-time Employees
|
39.4
|
60.7
|
67.8
|
72.2
|
|
Part-time Employees
|
55.2
|
68.3
|
69.3
|
74.0
|
|
Cost of Inputs
|
-45.0
|
-55.7
|
-73.9
|
-73.6
|
|
Selling Price
|
38.0
|
60.0
|
78.8
|
77.6
|
Note: Please see the excel file for time series data
Services Sector
|
Table S1: Assessment and Expectation for Overall Business Situation
(Percentage responses)@
|
|
Quarter
|
Assessment
|
Expectation
|
|
Better
|
No Change
|
Worse
|
Net response#
|
Better
|
No Change
|
Worse
|
Net response
|
|
Q3:22-23
|
52.4
|
43.3
|
4.3
|
48.1
|
57.4
|
38.1
|
4.4
|
53.0
|
|
Q4:22-23
|
59.8
|
30.0
|
10.3
|
49.5
|
55.0
|
40.0
|
5.0
|
50.1
|
|
Q1:23-24
|
55.0
|
32.0
|
13.0
|
42.0
|
64.2
|
27.4
|
8.4
|
55.8
|
|
Q2:23-24
|
48.4
|
37.7
|
14.0
|
34.4
|
62.3
|
31.3
|
6.4
|
56.0
|
|
Q3:23-24
|
47.6
|
40.4
|
12.0
|
35.6
|
51.0
|
41.2
|
7.8
|
43.1
|
|
Q4:23-24
|
|
|
|
|
59.4
|
36.0
|
4.6
|
54.8
|
|
‘Increase’ in Overall business situation is optimistic.
@: Due to rounding off percentage may not add up to 100.
#: Net Response (NR) is the difference of percentage of the respondents reporting optimism and that reporting pessimism. The range is -100 to 100. Any value greater than zero indicates expansion/ optimism and any value less than zero indicates contraction/ pessimism.
|
|
Table S2: Assessment and Expectation for Turnover
(Percentage responses)
|
|
Quarter
|
Assessment
|
Expectation
|
|
Increase
|
No Change
|
Decrease
|
Net response
|
Increase
|
No Change
|
Decrease
|
Net response
|
|
Q3:22-23
|
49.2
|
45.2
|
5.5
|
43.7
|
61.6
|
34.0
|
4.4
|
57.1
|
|
Q4:22-23
|
57.4
|
34.0
|
8.5
|
48.9
|
51.5
|
42.5
|
6.0
|
45.5
|
|
Q1:23-24
|
59.4
|
30.2
|
10.4
|
49.0
|
60.0
|
33.1
|
6.9
|
53.1
|
|
Q2:23-24
|
43.8
|
41.3
|
14.9
|
28.9
|
59.3
|
36.3
|
4.4
|
54.9
|
|
Q3:23-24
|
48.2
|
35.9
|
15.9
|
32.3
|
40.3
|
49.9
|
9.8
|
30.5
|
|
Q4:23-24
|
|
|
|
|
59.8
|
33.8
|
6.4
|
53.4
|
|
‘Increase’ in Turnover is optimistic. Footnotes @ and # given in Table 1 are applicable here.
|
|
Table S3: Assessment and Expectation for Full-time Employees
(Percentage responses)
|
|
Quarter
|
Assessment
|
Expectation
|
|
Increase
|
No Change
|
Decrease
|
Net response
|
Increase
|
No Change
|
Decrease
|
Net response
|
|
Q3:22-23
|
42.9
|
52.5
|
4.6
|
38.4
|
38.4
|
55.9
|
5.8
|
32.6
|
|
Q4:22-23
|
45.1
|
48.0
|
7.0
|
38.1
|
47.1
|
48.0
|
4.8
|
42.3
|
|
Q1:23-24
|
40.1
|
47.8
|
12.1
|
27.9
|
47.8
|
45.9
|
6.3
|
41.6
|
|
Q2:23-24
|
34.3
|
48.7
|
17.0
|
17.3
|
44.7
|
52.6
|
2.7
|
42.0
|
|
Q3:23-24
|
29.9
|
61.6
|
8.5
|
21.4
|
26.4
|
63.7
|
9.9
|
16.5
|
|
Q4:23-24
|
|
|
|
|
32.4
|
64.0
|
3.6
|
28.8
|
|
‘Increase’ in Full-time Employees is optimistic. Footnotes @ and # given in Table 1 are applicable here.
|
|
Table S4: Assessment and Expectation for Part-time Employees
(Percentage responses)
|
|
Quarter
|
Assessment
|
Expectation
|
|
Increase
|
No Change
|
Decrease
|
Net response
|
Increase
|
No Change
|
Decrease
|
Net response
|
|
Q3:22-23
|
40.1
|
54.8
|
5.1
|
34.9
|
27.8
|
67.3
|
5.0
|
22.8
|
|
Q4:22-23
|
36.2
|
58.5
|
5.3
|
30.9
|
41.8
|
53.1
|
5.1
|
36.7
|
|
Q1:23-24
|
30.9
|
59.1
|
9.9
|
21.0
|
35.3
|
60.6
|
4.2
|
31.1
|
|
Q2:23-24
|
24.4
|
57.5
|
18.1
|
6.2
|
36.7
|
57.9
|
5.3
|
31.4
|
|
Q3:23-24
|
21.5
|
70.3
|
8.2
|
13.2
|
31.0
|
52.3
|
16.7
|
14.4
|
|
Q4:23-24
|
|
|
|
|
28.8
|
65.4
|
5.8
|
23.1
|
|
‘Increase’ in Part-time Employees is optimistic. Footnotes @ and # given in Table 1 are applicable here.
|
|
Table S5: Assessment and Expectation for Availability of Finance
(Percentage responses)
|
|
Quarter
|
Assessment
|
Expectation
|
|
Improve
|
No Change
|
Worsen
|
Net response
|
Improve
|
No Change
|
Worsen
|
Net response
|
|
Q3:22-23
|
42.1
|
53.4
|
4.6
|
37.5
|
32.9
|
61.0
|
6.2
|
26.7
|
|
Q4:22-23
|
34.9
|
61.6
|
3.6
|
31.3
|
42.3
|
52.4
|
5.4
|
36.9
|
|
Q1:23-24
|
29.3
|
61.2
|
9.5
|
19.7
|
36.0
|
61.4
|
2.6
|
33.4
|
|
Q2:23-24
|
30.6
|
56.8
|
12.6
|
18.0
|
39.5
|
57.0
|
3.5
|
36.0
|
|
Q3:23-24
|
32.3
|
60.3
|
7.4
|
24.9
|
31.5
|
61.1
|
7.3
|
24.2
|
|
Q4:23-24
|
|
|
|
|
40.4
|
56.7
|
2.9
|
37.4
|
|
‘Improve’ in Availability of Finance is optimistic. Footnotes @ and # given in Table 1 are applicable here.
|
|
Table S6: Assessment and Expectation for Cost of Finance
(Percentage responses)
|
|
Quarter
|
Assessment
|
Expectation
|
|
Increase
|
No Change
|
Decrease
|
Net response
|
Increase
|
No Change
|
Decrease
|
Net response
|
|
Q3:22-23
|
40.7
|
54.7
|
4.6
|
-36.1
|
39.7
|
57.1
|
3.2
|
-36.5
|
|
Q4:22-23
|
36.7
|
60.1
|
3.2
|
-33.5
|
41.6
|
53.2
|
5.2
|
-36.5
|
|
Q1:23-24
|
42.1
|
49.6
|
8.3
|
-33.7
|
35.4
|
62.0
|
2.6
|
-32.8
|
|
Q2:23-24
|
39.0
|
52.1
|
8.9
|
-30.1
|
38.1
|
57.6
|
4.3
|
-33.7
|
|
Q3:23-24
|
36.5
|
59.3
|
4.2
|
-32.3
|
32.8
|
61.0
|
6.2
|
-26.6
|
|
Q4:23-24
|
|
|
|
|
38.1
|
58.2
|
3.7
|
-34.4
|
|
‘Decrease’ in Cost of Finance is optimistic. Footnotes @ and # given in Table 1 are applicable here.
|
|
Table S7: Assessment and Expectation for Salary/Wages
(Percentage responses)
|
|
Quarter
|
Assessment
|
Expectation
|
|
Increase
|
No Change
|
Decrease
|
Net response
|
Increase
|
No Change
|
Decrease
|
Net response
|
|
Q3:22-23
|
47.9
|
48.4
|
3.7
|
-44.2
|
42.4
|
56.0
|
1.6
|
-40.9
|
|
Q4:22-23
|
47.6
|
48.4
|
3.9
|
-43.7
|
43.3
|
52.1
|
4.6
|
-38.7
|
|
Q1:23-24
|
48.8
|
45.6
|
5.6
|
-43.2
|
45.9
|
46.7
|
7.5
|
-38.4
|
|
Q2:23-24
|
44.5
|
50.3
|
5.3
|
-39.2
|
46.4
|
52.0
|
1.6
|
-44.8
|
|
Q3:23-24
|
42.4
|
53.5
|
4.0
|
-38.4
|
33.6
|
62.3
|
4.1
|
-29.5
|
|
Q4:23-24
|
|
|
|
|
38.6
|
59.6
|
1.8
|
-36.8
|
|
‘Decrease’ in Salary/Wages is optimistic. Footnotes @ and # given in Table 1 are applicable here.
|
|
Table S8: Assessment and Expectation for Cost of Inputs
(Percentage responses)
|
|
Quarter
|
Assessment
|
Expectation
|
|
Increase
|
No Change
|
Decrease
|
Net response
|
Increase
|
No Change
|
Decrease
|
Net response
|
|
Q3:22-23
|
46.1
|
49.2
|
4.7
|
-41.4
|
49.4
|
45.6
|
4.9
|
-44.5
|
|
Q4:22-23
|
41.9
|
53.4
|
4.7
|
-37.2
|
50.1
|
44.5
|
5.3
|
-44.8
|
|
Q1:23-24
|
45.2
|
45.4
|
9.5
|
-35.7
|
43.8
|
53.6
|
2.7
|
-41.1
|
|
Q2:23-24
|
39.1
|
49.9
|
11.0
|
-28.1
|
47.0
|
46.8
|
6.1
|
-40.9
|
|
Q3:23-24
|
44.6
|
48.6
|
6.8
|
-37.9
|
32.1
|
57.9
|
9.9
|
-22.2
|
|
Q4:23-24
|
|
|
|
|
47.4
|
50.9
|
1.7
|
-45.7
|
|
‘Decrease’ in Cost of Inputs is optimistic. Footnotes @ and # given in Table 1 are applicable here.
|
|
Table S9: Assessment and Expectation for Selling Price
(Percentage responses)
|
|
Quarter
|
Assessment
|
Expectation
|
|
Increase
|
No Change
|
Decrease
|
Net response
|
Increase
|
No Change
|
Decrease
|
Net response
|
|
Q3:22-23
|
40.8
|
54.4
|
4.8
|
36.0
|
25.7
|
68.3
|
6.1
|
19.6
|
|
Q4:22-23
|
34.4
|
62.2
|
3.5
|
30.9
|
38.9
|
55.6
|
5.5
|
33.4
|
|
Q1:23-24
|
28.8
|
59.8
|
11.4
|
17.4
|
35.7
|
60.0
|
4.3
|
31.3
|
|
Q2:23-24
|
21.9
|
62.7
|
15.4
|
6.5
|
39.5
|
53.7
|
6.8
|
32.7
|
|
Q3:23-24
|
24.3
|
66.6
|
9.2
|
15.1
|
26.4
|
61.5
|
12.1
|
14.2
|
|
Q4:23-24
|
|
|
|
|
35.3
|
60.0
|
4.7
|
30.7
|
|
‘Increase’ in Selling Price is optimistic. Footnotes @ and # given in Table 1 are applicable here.
|
|
Table S10: Assessment and Expectation for Profit Margin
(Percentage responses)
|
|
Quarter
|
Assessment
|
Expectation
|
|
Increase
|
No Change
|
Decrease
|
Net response
|
Increase
|
No Change
|
Decrease
|
Net response
|
|
Q3:22-23
|
41.9
|
52.0
|
6.1
|
35.8
|
36.3
|
54.3
|
9.5
|
26.8
|
|
Q4:22-23
|
43.6
|
46.7
|
9.7
|
33.9
|
44.8
|
49.7
|
5.4
|
39.4
|
|
Q1:23-24
|
26.3
|
52.3
|
21.4
|
4.9
|
48.4
|
42.3
|
9.3
|
39.1
|
|
Q2:23-24
|
26.3
|
51.8
|
22.0
|
4.3
|
50.3
|
40.6
|
9.1
|
41.2
|
|
Q3:23-24
|
27.1
|
55.5
|
17.4
|
9.7
|
27.3
|
59.2
|
13.5
|
13.8
|
|
Q4:23-24
|
|
|
|
|
36.1
|
55.2
|
8.6
|
27.5
|
|
‘Increase’ in Profit Margin is optimistic. Footnotes @ and # given in Table 1 are applicable here.
|
|
Table S11: Assessment and Expectation for Inventories
(Percentage responses)
|
|
Quarter
|
Assessment
|
Expectation
|
|
Increase
|
No Change
|
Decrease
|
Net response
|
Increase
|
No Change
|
Decrease
|
Net response
|
|
Q3:22-23
|
48.3
|
46.9
|
4.8
|
43.5
|
40.5
|
56.8
|
2.7
|
37.8
|
|
Q4:22-23
|
38.1
|
58.1
|
3.8
|
34.2
|
48.8
|
46.0
|
5.2
|
43.5
|
|
Q1:23-24
|
30.4
|
58.8
|
10.8
|
19.6
|
38.6
|
57.7
|
3.7
|
34.8
|
|
Q2:23-24
|
30.2
|
56.2
|
13.6
|
16.5
|
40.3
|
54.3
|
5.4
|
34.8
|
|
Q3:23-24
|
29.6
|
62.9
|
7.5
|
22.2
|
34.5
|
53.9
|
11.6
|
22.9
|
|
Q4:23-24
|
|
|
|
|
34.2
|
60.0
|
5.8
|
28.3
|
|
‘Increase’ in Inventories is optimistic. Footnotes @ and # given in Table 1 are applicable here.
|
|
Table S12: Assessment and Expectation for Technical/Service Capacity
(Percentage responses)
|
|
Quarter
|
Assessment
|
Expectation
|
|
Increase
|
No Change
|
Decrease
|
Net response
|
Increase
|
No Change
|
Decrease
|
Net response
|
|
Q3:22-23
|
41.7
|
53.6
|
4.7
|
37.1
|
29.5
|
68.8
|
1.7
|
27.7
|
|
Q4:22-23
|
36.4
|
60.9
|
2.7
|
33.7
|
41.5
|
53.9
|
4.6
|
37.0
|
|
Q1:23-24
|
30.0
|
65.1
|
4.9
|
25.1
|
36.4
|
61.1
|
2.5
|
34.0
|
|
Q2:23-24
|
28.1
|
69.2
|
2.7
|
25.3
|
51.2
|
47.5
|
1.3
|
49.8
|
|
Q3:23-24
|
22.6
|
75.8
|
1.6
|
21.0
|
41.9
|
56.3
|
1.9
|
40.0
|
|
Q4:23-24
|
|
|
|
|
34.1
|
65.9
|
0.0
|
34.1
|
|
‘Increase’ in Technical/Service Capacity is optimistic. Footnotes @ and # given in Table 1 are applicable here.
|
|
Table S13: Assessment and Expectation for Physical Investment
(Percentage responses)
|
|
Quarter
|
Assessment
|
Expectation
|
|
Increase
|
No Change
|
Decrease
|
Net response
|
Increase
|
No Change
|
Decrease
|
Net response
|
|
Q3:22-23
|
41.3
|
54.4
|
4.3
|
37.0
|
22.8
|
75.8
|
1.5
|
21.3
|
|
Q4:22-23
|
32.2
|
65.5
|
2.3
|
30.0
|
41.4
|
53.9
|
4.7
|
36.7
|
|
Q1:23-24
|
26.9
|
66.8
|
6.3
|
20.7
|
33.0
|
64.3
|
2.7
|
30.3
|
|
Q2:23-24
|
30.7
|
66.1
|
3.1
|
27.6
|
43.4
|
54.8
|
1.8
|
41.5
|
|
Q3:23-24
|
21.7
|
76.6
|
1.6
|
20.1
|
23.3
|
75.8
|
0.9
|
22.3
|
|
Q4:23-24
|
|
|
|
|
32.2
|
67.8
|
0.0
|
32.2
|
|
‘Increase’ in Physical Investment is optimistic. Footnotes @ and # given in Table 1 are applicable here.
|
Infrastructure Sector
|
Table I1: Assessment and Expectation for Overall Business Situation
(Percentage responses)@
|
|
Quarter
|
Assessment
|
Expectation
|
|
Better
|
No Change
|
Worse
|
Net response#
|
Better
|
No Change
|
Worse
|
Net response
|
|
Q3:22-23
|
55.5
|
38.0
|
6.5
|
49.0
|
49.2
|
46.7
|
4.1
|
45.1
|
|
Q4:22-23
|
60.9
|
28.7
|
10.4
|
50.4
|
56.8
|
37.2
|
6.0
|
50.9
|
|
Q1:23-24
|
62.6
|
23.1
|
14.3
|
48.4
|
60.5
|
34.2
|
5.3
|
55.3
|
|
Q2:23-24
|
44.2
|
41.3
|
14.4
|
29.8
|
62.6
|
30.8
|
6.6
|
56.0
|
|
Q3:23-24
|
44.2
|
45.8
|
10.0
|
34.2
|
67.3
|
29.8
|
2.9
|
64.4
|
|
Q4:23-24
|
|
|
|
|
73.1
|
21.8
|
5.0
|
68.1
|
|
‘Increase’ in Overall business situation is optimistic.
@: Due to rounding off percentage may not add up to 100.
#: Net Response (NR) is the difference of percentage of the respondents reporting optimism and that reporting pessimism. The range is -100 to 100. Any value greater than zero indicates expansion/ optimism and any value less than zero indicates contraction/ pessimism.
|
|
Table I2: Assessment and Expectation for Turnover
(Percentage responses)
|
|
Quarter
|
Assessment
|
Expectation
|
|
Increase
|
No Change
|
Decrease
|
Net response
|
Increase
|
No Change
|
Decrease
|
Net response
|
|
Q3:22-23
|
52.6
|
40.2
|
7.2
|
45.4
|
56.1
|
35.0
|
8.9
|
47.2
|
|
Q4:22-23
|
60.9
|
27.0
|
12.2
|
48.7
|
55.8
|
37.2
|
7.0
|
48.8
|
|
Q1:23-24
|
64.8
|
19.8
|
15.4
|
49.5
|
61.4
|
32.5
|
6.1
|
55.3
|
|
Q2:23-24
|
46.2
|
39.4
|
14.4
|
31.7
|
61.1
|
33.3
|
5.6
|
55.6
|
|
Q3:23-24
|
47.9
|
40.3
|
11.8
|
36.1
|
53.8
|
42.3
|
3.8
|
50.0
|
|
Q4:23-24
|
|
|
|
|
75.6
|
22.7
|
1.7
|
73.9
|
|
‘Increase’ in Turnover is optimistic. Footnotes @ and # given in Table 1 are applicable here.
|
|
Table I3: Assessment and Expectation for Full-time Employees
(Percentage responses)
|
|
Quarter
|
Assessment
|
Expectation
|
|
Increase
|
No Change
|
Decrease
|
Net response
|
Increase
|
No Change
|
Decrease
|
Net response
|
|
Q3:22-23
|
51.2
|
42.3
|
6.5
|
44.7
|
36.4
|
57.0
|
6.6
|
29.8
|
|
Q4:22-23
|
47.0
|
47.8
|
5.2
|
41.7
|
52.4
|
40.7
|
6.9
|
45.5
|
|
Q1:23-24
|
46.7
|
40.0
|
13.3
|
33.3
|
50.9
|
44.7
|
4.4
|
46.5
|
|
Q2:23-24
|
28.8
|
58.7
|
12.5
|
16.3
|
48.9
|
48.9
|
2.2
|
46.7
|
|
Q3:23-24
|
32.5
|
57.3
|
10.3
|
22.2
|
42.3
|
54.8
|
2.9
|
39.4
|
|
Q4:23-24
|
|
|
|
|
63.2
|
34.2
|
2.6
|
60.7
|
|
‘Increase’ in Full-time Employees is optimistic. Footnotes @ and # given in Table 1 are applicable here.
|
|
Table I4: Assessment and Expectation for Part-time Employees
(Percentage responses)
|
|
Quarter
|
Assessment
|
Expectation
|
|
Increase
|
No Change
|
Decrease
|
Net response
|
Increase
|
No Change
|
Decrease
|
Net response
|
|
Q3:22-23
|
50.3
|
43.2
|
6.5
|
43.8
|
24.6
|
68.6
|
6.8
|
17.8
|
|
Q4:22-23
|
46.4
|
50.0
|
3.6
|
42.9
|
52.1
|
41.7
|
6.2
|
45.9
|
|
Q1:23-24
|
48.1
|
40.7
|
11.1
|
37.0
|
43.8
|
55.4
|
0.9
|
42.9
|
|
Q2:23-24
|
37.9
|
55.2
|
6.9
|
31.0
|
50.9
|
45.3
|
3.8
|
47.2
|
|
Q3:23-24
|
35.8
|
57.5
|
6.6
|
29.2
|
60.3
|
34.5
|
5.2
|
55.2
|
|
Q4:23-24
|
|
|
|
|
68.3
|
31.7
|
0.0
|
68.3
|
|
‘Increase’ in Part-time Employees is optimistic. Footnotes @ and # given in Table 1 are applicable here.
|
|
Table I5: Assessment and Expectation for Availability of Finance
(Percentage responses)
|
|
Quarter
|
Assessment
|
Expectation
|
|
Improve
|
No Change
|
Worsen
|
Net response
|
Improve
|
No Change
|
Worsen
|
Net response
|
|
Q3:22-23
|
50.5
|
43.7
|
5.8
|
44.7
|
43.4
|
50.8
|
5.7
|
37.7
|
|
Q4:22-23
|
45.1
|
49.6
|
5.3
|
39.8
|
52.2
|
41.9
|
5.8
|
46.4
|
|
Q1:23-24
|
28.9
|
54.4
|
16.7
|
12.2
|
46.8
|
50.5
|
2.7
|
44.1
|
|
Q2:23-24
|
36.5
|
52.9
|
10.6
|
26.0
|
51.1
|
43.3
|
5.6
|
45.6
|
|
Q3:23-24
|
36.7
|
57.5
|
5.8
|
30.8
|
46.6
|
49.5
|
3.9
|
42.7
|
|
Q4:23-24
|
|
|
|
|
63.0
|
35.3
|
1.7
|
61.3
|
|
‘Improve’ in Availability of Finance is optimistic. Footnotes @ and # given in Table 1 are applicable here.
|
|
Table I6: Assessment and Expectation for Cost of Finance
(Percentage responses)
|
|
Quarter
|
Assessment
|
Expectation
|
|
Increase
|
No Change
|
Decrease
|
Net response
|
Increase
|
No Change
|
Decrease
|
Net response
|
|
Q3:22-23
|
51.0
|
42.8
|
6.2
|
-44.9
|
47.5
|
46.7
|
5.8
|
-41.7
|
|
Q4:22-23
|
43.4
|
49.6
|
7.1
|
-36.3
|
49.7
|
44.5
|
5.8
|
-43.8
|
|
Q1:23-24
|
50.6
|
41.2
|
8.2
|
-42.4
|
43.8
|
53.6
|
2.7
|
-41.1
|
|
Q2:23-24
|
51.0
|
42.7
|
6.3
|
-44.8
|
44.0
|
53.6
|
2.4
|
-41.7
|
|
Q3:23-24
|
38.2
|
55.5
|
6.4
|
-31.8
|
54.2
|
45.8
|
0.0
|
-54.2
|
|
Q4:23-24
|
|
|
|
|
61.7
|
37.4
|
0.9
|
-60.7
|
|
‘Decrease’ in Cost of Finance is optimistic. Footnotes @ and # given in Table 1 are applicable here.
|
|
Table I7: Assessment and Expectation for Salary/Wages
(Percentage responses)
|
|
Quarter
|
Assessment
|
Expectation
|
|
Increase
|
No Change
|
Decrease
|
Net response
|
Increase
|
No Change
|
Decrease
|
Net response
|
|
Q3:22-23
|
56.3
|
39.2
|
4.4
|
-51.9
|
35.0
|
62.4
|
2.6
|
-32.5
|
|
Q4:22-23
|
47.0
|
49.6
|
3.5
|
-43.5
|
50.5
|
43.6
|
5.8
|
-44.7
|
|
Q1:23-24
|
40.7
|
56.0
|
3.3
|
-37.4
|
46.5
|
50.9
|
2.6
|
-43.9
|
|
Q2:23-24
|
42.7
|
50.5
|
6.8
|
-35.9
|
47.8
|
52.2
|
0.0
|
-47.8
|
|
Q3:23-24
|
44.9
|
50.8
|
4.2
|
-40.7
|
41.2
|
56.9
|
2.0
|
-39.2
|
|
Q4:23-24
|
|
|
|
|
59.8
|
39.3
|
0.9
|
-59.0
|
|
‘Decrease’ in Salary/Wages is optimistic. Footnotes @ and # given in Table 1 are applicable here.
|
|
Table I8: Assessment and Expectation for Cost of Inputs
(Percentage responses)
|
|
Quarter
|
Assessment
|
Expectation
|
|
Increase
|
No Change
|
Decrease
|
Net response
|
Increase
|
No Change
|
Decrease
|
Net response
|
|
Q3:22-23
|
52.2
|
41.6
|
6.2
|
-46.0
|
53.0
|
42.7
|
4.3
|
-48.7
|
|
Q4:22-23
|
46.9
|
50.4
|
2.7
|
-44.2
|
55.3
|
37.8
|
6.9
|
-48.5
|
|
Q1:23-24
|
47.7
|
47.7
|
4.5
|
-43.2
|
49.6
|
48.7
|
1.8
|
-47.8
|
|
Q2:23-24
|
50.0
|
45.1
|
4.9
|
-45.1
|
51.1
|
44.3
|
4.5
|
-46.6
|
|
Q3:23-24
|
52.1
|
43.6
|
4.3
|
-47.9
|
52.0
|
41.0
|
7.0
|
-45.0
|
|
Q4:23-24
|
|
|
|
|
59.1
|
37.4
|
3.5
|
-55.7
|
|
‘Decrease’ in Cost of Inputs is optimistic. Footnotes @ and # given in Table 1 are applicable here.
|
|
Table I9: Assessment and Expectation for Selling Price
(Percentage responses)
|
|
Quarter
|
Assessment
|
Expectation
|
|
Increase
|
No Change
|
Decrease
|
Net response
|
Increase
|
No Change
|
Decrease
|
Net response
|
|
Q3:22-23
|
51.4
|
41.8
|
6.8
|
44.5
|
32.2
|
62.6
|
5.2
|
27.0
|
|
Q4:22-23
|
46.8
|
48.6
|
4.5
|
42.3
|
50.3
|
43.1
|
6.6
|
43.8
|
|
Q1:23-24
|
29.3
|
63.4
|
7.3
|
22.0
|
43.5
|
53.7
|
2.8
|
40.7
|
|
Q2:23-24
|
33.7
|
53.3
|
13.0
|
20.7
|
43.4
|
54.2
|
2.4
|
41.0
|
|
Q3:23-24
|
37.0
|
54.0
|
9.0
|
28.0
|
42.4
|
53.3
|
4.3
|
38.0
|
|
Q4:23-24
|
|
|
|
|
62.0
|
36.0
|
2.0
|
60.0
|
|
‘Increase’ in Selling Price is optimistic. Footnotes @ and # given in Table 1 are applicable here.
|
|
Table I10: Assessment and Expectation for Profit Margin
(Percentage responses)
|
|
Quarter
|
Assessment
|
Expectation
|
|
Increase
|
No Change
|
Decrease
|
Net response
|
Increase
|
No Change
|
Decrease
|
Net response
|
|
Q3:22-23
|
52.2
|
40.1
|
7.6
|
44.6
|
34.7
|
47.1
|
18.2
|
16.5
|
|
Q4:22-23
|
46.0
|
44.2
|
9.7
|
36.3
|
52.8
|
39.6
|
7.6
|
45.1
|
|
Q1:23-24
|
36.7
|
38.9
|
24.4
|
12.2
|
47.3
|
45.5
|
7.1
|
40.2
|
|
Q2:23-24
|
24.5
|
58.8
|
16.7
|
7.8
|
46.1
|
48.3
|
5.6
|
40.4
|
|
Q3:23-24
|
35.0
|
55.0
|
10.0
|
25.0
|
37.3
|
56.9
|
5.9
|
31.4
|
|
Q4:23-24
|
|
|
|
|
56.3
|
36.1
|
7.6
|
48.7
|
|
‘Increase’ in Profit Margin is optimistic. Footnotes @ and # given in Table 1 are applicable here.
|
|
Table I11: Assessment and Expectation for Inventories
(Percentage responses)
|
|
Quarter
|
Assessment
|
Expectation
|
|
Increase
|
No Change
|
Decrease
|
Net response
|
Increase
|
No Change
|
Decrease
|
Net response
|
|
Q3:22-23
|
52.4
|
41.0
|
6.6
|
45.9
|
45.8
|
47.5
|
6.8
|
39.0
|
|
Q4:22-23
|
48.7
|
46.0
|
5.3
|
43.4
|
53.6
|
39.2
|
7.2
|
46.4
|
|
Q1:23-24
|
28.3
|
58.3
|
13.3
|
15.0
|
48.2
|
50.0
|
1.8
|
46.4
|
|
Q2:23-24
|
42.1
|
52.6
|
5.3
|
36.8
|
36.7
|
60.0
|
3.3
|
33.3
|
|
Q3:23-24
|
41.7
|
53.4
|
4.9
|
36.9
|
60.5
|
36.8
|
2.6
|
57.9
|
|
Q4:23-24
|
|
|
|
|
75.2
|
23.8
|
1.0
|
74.3
|
|
‘Increase’ in Inventories is optimistic. Footnotes @ and # given in Table 1 are applicable here.
|
|
Table I12: Assessment and Expectation for Technical/Service Capacity
(Percentage responses)
|
|
Quarter
|
Assessment
|
Expectation
|
|
Increase
|
No Change
|
Decrease
|
Net response
|
Increase
|
No Change
|
Decrease
|
Net response
|
|
Q3:22-23
|
50.2
|
43.9
|
6.0
|
44.2
|
27.7
|
70.5
|
1.8
|
25.9
|
|
Q4:22-23
|
45.9
|
50.5
|
3.7
|
42.2
|
50.5
|
43.5
|
6.0
|
44.6
|
|
Q1:23-24
|
35.7
|
59.5
|
4.8
|
31.0
|
45.0
|
53.2
|
1.8
|
43.1
|
|
Q2:23-24
|
38.3
|
59.6
|
2.1
|
36.2
|
51.2
|
48.8
|
0.0
|
51.2
|
|
Q3:23-24
|
39.8
|
55.9
|
4.3
|
35.5
|
66.7
|
33.3
|
0.0
|
66.7
|
|
Q4:23-24
|
|
|
|
|
75.0
|
25.0
|
0.0
|
75.0
|
|
‘Increase’ in Technical/Service Capacity is optimistic. Footnotes @ and # given in Table 1 are applicable here.
|
|
Table I13: Assessment and Expectation for Physical Investment
(Percentage responses)
|
|
Quarter
|
Assessment
|
Expectation
|
|
Increase
|
No Change
|
Decrease
|
Net response
|
Increase
|
No Change
|
Decrease
|
Net response
|
|
Q3:22-23
|
49.7
|
44.1
|
6.3
|
43.4
|
26.9
|
70.4
|
2.8
|
24.1
|
|
Q4:22-23
|
45.9
|
50.5
|
3.7
|
42.2
|
49.8
|
43.6
|
6.6
|
43.2
|
|
Q1:23-24
|
37.1
|
52.9
|
10.0
|
27.1
|
43.9
|
52.3
|
3.7
|
40.2
|
|
Q2:23-24
|
38.0
|
58.2
|
3.8
|
34.2
|
36.8
|
60.3
|
2.9
|
33.8
|
|
Q3:23-24
|
35.8
|
60.0
|
4.2
|
31.6
|
46.8
|
53.2
|
0.0
|
46.8
|
|
Q4:23-24
|
|
|
|
|
75.3
|
24.7
|
0.0
|
75.3
|
|
‘Increase’ in Physical Investment is optimistic. Footnotes @ and # given in Table 1 are applicable here.
|
|
 IST,
IST,