Rajmal*
This paper provides a phase-wise analytical review of the
fiscal situation of the Indian major States over the previous two and half decades
and examines the effectiveness of the policy measures to strengthen the State
finances. The analysis reveals that the States’ fiscal position showed imbalances,
albeit in a varied degree, since the mid-1980s which deepened in the
second half of the 1990s. The effectiveness of policy measures has remained largely
inadequate. Most of the Policy measures were exigency-driven rather than being
structured. As the States face large resource gap, they require effective and
time-bound policy measures to enhance revenues particularly non-taxes and shift
in expenditure pattern towards economic infrastructure and social sectors to facilitate
acceleration in growth.
JEL Classification : H71, H72,
H74
Key Words : State Taxation,
State Budget, State Borrowing
Introduction
In the Indian federal set up, the States play an important role in accelerating
and sustaining growth. The Indian Constitution assigns important responsibilities
to States in many sectors such as agricultural development, infrastructure, poverty
alleviation, water supply and irrigation, public order, public health and sanitation.
Furthermore, they have concurrent jurisdiction in several areas like education,
electricity, economic and social planning and family planning. In view of the
larger responsibilities assigned to the States, their expenditure accounts for
a substantial portion of the Government sector expenditure (Centre plus
States) in India. The comparative position across countries reveals that in India
the share of aggregate States’ expenditure in Government sector expenditure
is higher than that in several other countries such as Australia, Denmark, Argentina,
USA and Germany (World Bank, 2005). The composition of receipts and expenditure
of the Government sector in India reveals that while the State Governments collect
about one-third of the total Government sector receipts, they incur more than
three-fourth of the total expenditure on social services and more than half of
the total expenditure on economic services. The States’ ability to undertake
and perform the developmental functions adequately and effectively is critically
determined by their fiscal position.
A State specific assessment of fiscal
position assumes importance in view of the wide disparities that exist among the
Indian States and their increasing role in the development.The policy measures
and prescriptions which are suggested for aggregate State finances may not be
appropriate and effective for drawing out strategies for an individual State.
It is worth noting as stated in the Economic Survey, (2004-05), Government
of India, “Though the fiscal deterioration of States began much later
than that of the Centre, the fiscal stress of some of the State Governments is
more acute and an important constraint in their development.” The
analysis of State finances in historical perspective since the mid 1980s reveals:
(i) steady deterioration in revenue receipts-GSDP ratio, (ii) stagnating social
sector expenditure, (iii) inadequate investment for basic infrastructure sectors,
(iv) pre-emption of high cost borrowed funds for financing current expenditure,
(v) large and persistent resource gap, and (vi) accumulation of high debt stock
and debt service payments.
Many States undertook various policy measures
to strengthen their finances mainly in the late 1990s. Given the size of the problem,
the effectiveness of such policy measures, however, remained largely inadequate.
Most of the policy measures were ad hoc in natureand were guided by the
exigency rather than being structured. Against the above background, the
paper provides an analytical review of fiscal situation at State level during
the previous two and a half decades. The paper examines the policy measures undertaken
and their effectiveness to improve the State finances.The entire period under
review is divided into four phases based on the emerging fiscal developments.
The structure of the remaining paper is as follows. Section I provides an analytical
framework to study the public finance at State level. Section II presents an analytical
review and assessment of fiscal situation at State level. Section III sets out
the review of policy measures. The details of effectiveness of the policy measures
are provided in Section IV. The concluding observations are outlined in Section
V. Section I
Analytical
Framework In a federal system, the sub-national
governments are assigned certain sources of revenues and expenditure responsibilities.
In the Indian context, the State Governments have their own independent sources
of revenue as well as transfers from the Central Government. Accordingly, the
level of resource flow at State level in India is determined by both (i) endogenous
factors (i.e., States’ own efforts in generating resources) and
(ii) exogenous factors (i.e., the resource transfers from the Central
Government). The details of various sources of revenues and expenditure responsibilities
of State Governments are set out below.
Sources of Revenues
States’ own Revenues
(i) States’
own tax revenues: States’ own taxes can be grouped into three
parts, viz., (i) taxes on commodities and services such as sales tax,
State excise, taxes on vehicles and taxes on goods and passengers, (ii) taxes
on property and capital transactions such as stamps and registrations and land
revenue, and (iii) taxes on income such as profession, trade and agricultural
income. Among the above, the principal sources of States’ tax revenue are
sales tax, State excise and stamps and registration fees. Sales tax alone accounts
for nearly two-thirds of the total States’ own tax revenue. Realising the
need for tax reforms, many States have switched over to a Value Added Tax (VAT)
regime on the basis of the recommendations of the Empowered Committee of State
Finance Ministers with effect from April 1, 2005. VAT may be defined as a tax
on the value added at each stage of production and distribution of a commodity.
(ii) States’ own non-tax revenues: These include
(i) interest receipts, (ii) dividend and profits,(iii) user charges on account
of social and economic services, and (iv) general services which mainly include
State lotteries. The major part of revenues comes from interest receipts, State
lotteries and user charges on account of economic services.
Current
Transfers and Devolution from the Centre
The current transfers
and devolution from the Centre include States’ share in the Central taxes
and grants. The provision for these transfers to States aims at addressing the
vertical imbalance or fiscal gap that stems from asymmetric devolution of functions
and tax powers among different Government levels. Furthermore, such transfers
aim to secure fiscal equalisation among the States which is necessary and imperative
in the interest of equity and efficiency.
Expenditure Responsibilities
of States
State Governments incur considerable expenditure
towards provision of various social and economic services in addition to expenditure
requirements towards maintenance of various organs and general administration.
The total expenditure comprises of revenue and capital components. Broadly the
expenditure which does not result in creation of assets is treated as revenue
expenditure. Capital expenditure mainly includes expenditure on acquisition of
assets like land, building, machinery etc. and also loans and advances
by States mainly to Public Sector Undertakings (PSUs). Under revenue expenditure,
certain items of expenditure, viz., interest payments, pensions outgo,
wages and salaries and expenses towards administrative services have downward
rigidity.
Financing Pattern of Gross Fiscal Deficit (GFD)
The analysis of the State Government finances during previous two and half
decades reveals that invariably almost all the States incur more expenditure than
the revenues they mobilise. Consequently, the States undertake borrowings from
a number of sources to finance their resource gap/GFD. The financing pattern of
resource gap indicates that, historically, loans from the Centre have been the
most important source of borrowings for the States. However, with the changes
in accounting system in respect of small savings since April 1, 1999 and operationalisation
of Debt Swap Scheme (during 2002-03 to 2004-05), the share of this source in financing
GFD has declined significantly. The small saving receipts [(i.e., Special
Securities issued to National Small Saving Fund (NSSF)] are emerging a major source
to finance the resource gap – constituting over two third of GFD in the
recent period (RBI, 2005). The other major sources of financing available to the
States include: (i) market borrowings, (ii) loans from banks and financial institutions
(FIs) and (iii) public account borrowings.
Scheme of Presentation
of States’ Fiscal Analysis
Taking into account the fiscal
developments on both front, viz., (i) endogenous factors (within States’
control) and (ii) exogenous factors (States’ dependence on Central transfers),
the period under review has been divided into four phases.
(i)
Revenue Account in Surplus Position: This phase covers the period
1980-81 to 1985-86. The buoyant growth in States taxes particularly sales tax
led to the higher growth in revenues than the expenditure - resulting in surplus
in the Revenue Account.
(ii) Emergence of Fiscal Imbalances:
This phase deals with the period 1986-87 to 1997-98. The growth in revenues
remained sluggish on account of low/negligible user charges and dividends and
profits coupled with stagnation in States’ share in Central taxes. The liberalisation
of trade and investment policies providing various incentives and concessions
to attract private investment impacted the States’ finances.
(iii)
Deepening and Persistent Fiscal Imbalances1: This phase pertains
to the period 1998-99 to 2003-04. The major reasons behind the worsening of fiscal
imbalances were the significant increase in revenue expenditure due to Fifth Pay
Commission award and growing interest payments on the past high cost borrowed
funds. The growth in revenues remained sluggish due to stagnation in States’
tax-GSDP ratio and decline in States’ own non-taxes and Central transfers,
particularly, grants to States. (iv) Recent
Fiscal Developments and Challenges Ahead: This
phase takes into account the period since 2004-05 onwards.
Implementation
of VAT with effect from April 1, 2005, recommendations of Twelfth Finance Commission
(TFC) for the period 2005-10 and the States’ continued emphasis on the on-going
fiscal reforms with statutory backing such as fiscal responsibility legislations
(FRLs) which got further boost on account of TFC’s recommendations are the
major recent developments. The fiscal position of States would be largely influenced
in the medium term by these developments. This phase also highlights the major
challenges for the States in the medium term. The details of major fiscal
indicators to examine the fiscal situation of States include: (i) trends in revenue
receipts, States’ own revenues and share in the Central taxes and grants,
(ii) pattern and trends in major components of expenditure, (iii) available resources
for financing resource gap, and (iv) movement in major deficits and debt stocks2.
Section II
Finances of
Major States: Analytical Review and Assessment3
An Overview
A quick overview of the fiscal position of major States reveals that they were
generating surpluses in their revenue account in the first phase. The fiscal position
of States, however, had started to show signs of stress in the second phase and
fiscal imbalances deepened and persisted during the third phase. The factors responsible
for the widening fiscal inbalances include: (i) growing interest burden, (ii)
increasing wages and salaries (iii) pension liabilities, (iv) losses incurred
by State Public Sector Undertakings, (v) inadequate user charges/cost recoveries
and (vi) deceleration in the Central transfers (RBI, 2004). In the recent years,
interest payments alone constitutes over one-fourth of the revenue expenditure
and absorbs between 30-50 per cent of revenue receipts in many States (West Bengal,
Orissa, Punjab, Rajasthan, Gujarat, Uttar Pradesh). Notably, during 2002-03 to
2003-04, interest payments and pensions outgo taken together absorbed as high
as around 70 per cent of revenue receipts in case of West Bengal and nearly 50
per cent of revenue receipts in Kerala.
The fiscal stress experienced
by the States has seriously constrained their ability to discharge major responsibility
of developing social and economic infrastructure. The expenditure for developmental
activities, which are directly related to growth, has suffered. On the other hand,
expenditure on non-developmental purposes, largely committed in nature, has witnessed
a steady rise. The problem was exacerbated by low productivity of capital expenditure.
The proliferation of projects spread the resources thinly and inadequate financial
allocations cause severe cost and time over runs (Rao, 2002).
The Planning
Commission, while stressing the need for fiscal and other reforms at the State
level, observed that “… a joint effort by the Centre and States
is needed to fulfill the Tenth Plan objectives. Along with the Centre, States
need to reform more and much faster, and raise substantially higher levels of
their own resources to mobilise the financial resources essential for the much
needed productive investments. ..” (Mid Term Appraisal, Tenth
Five Year Plan).
Phase-wise Analysis of State Finances:
Major Features
The analytical framework developed in section
I has been used to analyse the fiscal position of States. The major features of
each phase are set out below. Phase 1: Revenue Account in Surplus
Position
All the major States except West Bengal4 were
generating surplus in the Revenue Account. The major features of this phase include:
(i) growth in revenue receipts was mainly led by States own taxes particularly,
sales tax, (ii) the revenue expenditure of major States in terms of GSDP, on an
average remained at 12.8 per cent, (iii) the revenue receipts of States were placed
at 13.2 per cent of GSDP thus leaving surplus of 0.4 per cent of GSDP under revenue
account, and (iv) GFD-GSDP ratios in case of all the States except Punjab and
Orissa was below 4 per cent.
Phase 2: Emergence of Fiscal
Imbalances
The major highlights of this phase are: (i)
Revenue Account of the States turned into deficit from surplus, (ii) the deceleration
in the States’ own non-tax revenues coupled with stagnation in States’
share in Central taxes resulted in sluggish growth in the revenue receipts, (iii)
revenue expenditure in terms of GSDP, on an average, increased by more than two
percentage points, (iv) the revenue receipts-GSDP ratio increased less than one
percentage point in this phase over the previous phase, (v) many States started
utilising the high cost borrowed funds to finance the current expenditure, (vi)
total expenditure-GSDP ratio increased marginally over the first phase - reflecting
the impact of cutback of capital expenditure which declined to 3.8 per cent from
5.6 per cent of GSDP in the previous phase, (vii) the liberalisation of trade
and investment policies in the economy impacted State finances as they provided
various incentives and concessions to attract private investment, and (viii) the
increasing share of the services in States’ GSDP, which were not covered
under the tax net, also affected adversely their fiscal health.
Phase 3: Deepening and Persistent Fiscal Imbalances
The major features include: (i) the increasing fiscal imbalances in the
previous phase had started deepening and persisted, (ii) revenue receipts-GSDP
ratio decelerated by 0.8 per cent while revenue expenditure-GSDP ratio increased
by around 2 percentage points over the previous phase, (iii) deceleration in revenue
receipts was due to decline in States own non-tax revenues, which reflected low/negligible
user charges, dividends and profits, and central grants, (v) revenue expenditure
grew significantly mainly due to increase in salaries and wages bill on account
of the Fifth Pay Commission recommendations coupled with high interest payments
on past loans and pensions outgo, (vi) interest payments and pension outgo of
major States absorbed as high as 37 per cent of revenue receipts (varying from
26 per cent in Madhya Pradesh to 58 per cent in West Bengal) as against 21 per
cent in the previous phase (varying from 15 per cent in Maharashtra to 28 per
cent in Kerala), (vii) total expenditure-GSDP ratio increased to around 21 per
cent due to significant increase in revenue expenditure, (viii) a sharp increase
in revenue expenditure accompanied by inadequate growth in revenues constrained
the States ability for releasing adequate resources for capital expenditure which
remained almost stagnated at the level of the previous phase (3.8 per cent of
GSDP), (ix) the large and persistent resource gap resulted in a vicious cycle
of deficit, debt and debt service payments.
Phase 4: Recent
Fiscal Developments and Challenges Ahead
The recent major
fiscal development, viz., implementation of VAT, TFCs recommendations
and States’ FRLs, are expected to largely impact the State finances in the
medium term. There are some signs of improvement in the State finances as reflected
in their recent budgets. However, given the past track record of weak fiscal marksmanship
of State Governments, the high level of fiscal corrections appears to be difficult
to achieve in a short span of time. For a durable fiscal discipline and realistic
fiscal correction path, States would have to place continuous emphasis on timely
and effective measures towards on both revenue enhancement and expenditure reprioritisation.
In this regard, the fiscal correction path as spelt out by the TFC provides a
new direction and motivatation to the States to undertake the appropriate policy
measures.
TFC’s Impact on State Finances
The TFC’s recommendations for fiscal consolidation in the States will
have far-reaching implications for the federal-state fiscal relationship. The
States’ fiscal imbalances are likely to ease on account of higher tax devolution,
enhanced grants as well as the debt relief schemes by the TFC. The critical aspect
of the recommendations of the TFC is the linking of certain resource transfers
to enhance the fiscal prudence on the part of the States, in general, and the
enactment of FRLs by the States, in particular. The increase in transfers
recommended through tax devolution and grants are expected to facilitate the States
to undertake fiscal correction even while undertaking social and infrastructure
expenditure required to move on an accelerated growth path.
A New Borrowing Regime for States
Following the TFC’s
recommendations that the Centre should not act as an intermediary for future lending
and allow the State Governments to approach the market directly, a new borrowing
regime for the States was put in place5 . Accordingly, in the Union Budget 2005-06,
there was no provision made for Central loans for State Plan Schemes. The Union
Budget indicated an amount of Rs.29,003 crore which was to be raised by the States
and Union Territories with Legislature directly from the market. Furthermore,
as per the TFC’s recommendations (also accepted by the Government of India),
external assistance would be transferred to the States on the same terms and conditions
as attached to such conditions by external funding agencies (making Centre a financial
intermediary - without any gain or loss). The States would get the same maturity,
moratorium and amortisation schedule as the Centre gets from the external lender.
The past experience of some States reveals that the weaknesses in their
finances invited adverse reaction from the financial markets as manifested in
the widening spread on State Government securities and under-subscription to market
loans. The under-subscription to the State market loans also brings to the fore
various factors that impact State Governments liquidity. These factors include:
(i) the fiscal health of the State Governments, (ii) the credibility of their
prospective policy actions and, (iii) transparency of their budgets (RBI, 2004). In
view of the new borrowings regime, States would need to improve the market perception
about their fiscal position by exhibiting adequate will and action for fiscal
rectitude by actively considering the fiscal reforms measures. The better fiscal
performing States would get the benefit relatively more than the fiscally weak
States from the market. Challenges Ahead In
the process of fiscal correction in the medium term, the allocation of adequate
resources towards productive sectors, which is essential to accelerate the growth
and to increase the revenues particularly through non-taxes by increasing user
charges, cost recovery, dividends and profits, etc., would be major challenges
for the States.
The large repayment of market borrowings (from Rs.
6,274 crore in 2005-06 to increase two-fold by 2007-08, three-fold by 2010-11
and nearly six times by 2014-15) would have a bearing on the fiscal health of
the States (RBI, 2005).
Furthermore, the impact of the Sixth Pay
Commission on fiscal health, if followed by the State Governments, also needs
to be taken into account6. Although the Pay Commission, is meant to cover only
the Central Government employees, its recommendations, as the past experience
reveals, are generally adopted by the State Governments as well. The Commision
is expected to submit the report within eighteen months from the date of its constitution.
A State-wise Analysis
A State-wise analytical
review of the fiscal position based on select fiscal indicators is set out below.
Trends in Major Deficits and Financing pattern
Revenue Deficit
The degree of deterioration
in the revenue account varied significantly across the States (Chart 1 and Exhibit
1). States like Orissa and West Bengal showed substantial increase in their revenue
deficit-GSDP ratio in the third phase as compared to the 
second
phase. The deterioration in the revenue account led to significant increase in
the overall resource gap.
Revenue Deficit Accounts for
Sizeable Portion of GFD
The revenue deficit of State Governments
such as West Bengal, Punjab, Kerala and Uttar Pradesh showed substantial increase
and accounted for over 70 per cent of GFD in the third phase. The significant
deterioration in Revenue Account of States led them to
Exhibit
1 : States’ Revenue Surplus/Deficit-GSDP Ratio:
A Comparative
Position | Per
cent | Phase 1 : 1980-86
(Revenue Surplus) | Above
1 | Haryana, Madhya Pradesh |
0.5 to 1 | Uttar
Pradesh, Bihar, Punjab, Gujarat, Tamil Nadu | Below
0.5 | Kerala, Orissa, Maharashtra, Andhra
Pradesh, Rajasthan, Karnataka, West Bengal * |
* : During the first phase, West Bengal
revenue account was in surplus only in 1985-86. |
Phase 2: 1986-98
(Revenue Deficit) | Above
1.5 | Punjab, Kerala, Uttar Pradesh, West
Bengal | 0.5 to
1.5 | Orissa, Tamil Nadu, Gujarat, Rajasthan,
Bihar, Andhra Pradesh | below
0.5 | Haryana, Maharashtra, Madhya Pradesh,
Karnataka | Phase
3 : 1998-2004 (Revenue Deficit) | Above
4 | West Bengal, Orissa, Punjab, Uttar Pradesh,
Kerala, Rajasthan | 2.5
to 4.0 | Gujarat, Bihar, Maharashtra, Madhya
Pradesh, Tamil Nadu | Below
2.5 | Karnataka, Andhra Pradesh, Haryana |
Exhibit
2 : States’ Revenue Surplus/Deficit-GFD Ratio:
A Comparative
Position | Per
cent | Phase 1 : Revenue
Surplus/ GFD Ratio | Above
40 | Madhya Pradesh, Haryana |
20 to 35 | Tamil
Nadu, Karnataka, Gujarat, Bihar, Uttar Pradesh, Punjab, West Bengal * |
Below 20 | Kerala,
Andhra Pradesh, Maharashtra, Rajasthan, Orissa |
* : During the first
phase, West Bengal revenue account was in surplus only in 1985-86. |
Phase
2 : Revenue Deficit/GFD Ratio | Above
40 | Kerala, West Bengal, Tamil Nadu |
20-40 | Andhra
Pradesh, Orissa, Uttar Pradesh, Punjab | below
20 | Karnataka, Haryana, Maharashtra, Madhya
Pradesh, Rajasthan, Gujarat, Bihar | Phase
3 : Revenue Deficit/GFD Ratio | Above
70 | Kerala, Punjab, West Bengal, Uttar
Pradesh | 60 to
70 | Gujarat, Tamil Nadu, Orissa, Rajasthan,
Maharashtra | Below
60 | Madhya Pradesh, Bihar, Karnataka, Haryana,
Andhra Pradesh | use a substantial portion of the
borrowed funds to finance their current expenditure in the third phase (Exhibit
2).
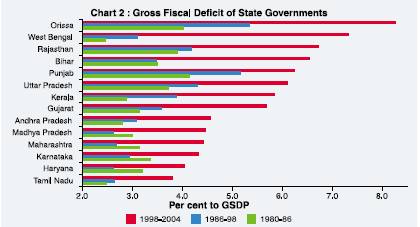
GFD of State Governments
The
substantial increase in GFD was evident in case of many States such as Orissa,
West Bengal, Rajasthan, Bihar, Punjab, Uttar Pradesh (Chart 2 and Exhibit 3). Financing
Pattern of GFD State Governments access funds
from a number of sources to finance their resource gap viz., (i) loans
from the Centre, (ii) market borrowings, (iii) loans from banks and financial
institutions (FIs) (such as SBI and other banks, NABARD, LIC, GIC) and (iv) Public
Account Borrowings (PAB) (such as State provident funds, reserve funds and deposits
and advances). To meet the temporary mismatches in receipts and expenditure, the
States also avail ways and means advances from the Reserve Bank of India. A quick
analysis of the
borrowed funds by the States reveals that during the 1990s loans
from the Centre was a dominant source of financing States’ deficit followed
by State Provident Funds and other PAB, market loans and banks and FIs.
The States dependence on the Centre to finance their deficit, however, showed
significant decline due to introduction of NSSF
Exhibit
3 : States’ GFD-GSDP Ratio: A Comparative Position |
Per cent | Phase
1 : 1980-86 | Above
3.5 | Punjab, Orissa, Rajasthan, Uttar Pradesh,
Bihar | 3.0-3.5 | Karnataka,
Haryana, Maharashtra, Gujarat, Madhya Pradesh |
Below 3.0 | Kerala,
Andhra Pradesh, Tamil Nadu, West Bengal | Phase
2: 1986-98 | Above
4 | Orissa, Punjab, Uttar Pradesh, Rajasthan |
3.5- 4.0 | Kerala,
Gujarat, Bihar | Below
3.5 | West Bengal, Andhra Pradesh, Karnataka,
Maharashtra, Tamil Nadu, | | Haryana,
Madhya Pradesh | Phase
3 : 1998-2004 | Above
6 | Orissa, West Bengal, Rajasthan, Bihar,
Punjab, Uttar Pradesh | 4.5
to 6.0 | Kerala, Gujarat, Andhra Pradesh,
Madhya Pradesh | Below
4.5 | Maharashtra, Karnataka, Haryana, Tamil
Nadu |
Exhibit
4 : Financing Pattern of GFD of States: |
A Comparative
Position | (Per
cent to GFD) | State
| Phase
2 : 1986-1998 | Phase
3 : 1998-2004 | | CL | MB | OT
* | CL | MB | NSSF
# | OT * |
Andhra Pradesh | 51 | 23 | 26 | 24 | 31 | 26 | 19 |
Bihar | 65 | 34 | 1 | 24 | 19 | 41 | 16 |
Gujarat | 57 | 10 | 33 | 16 | 24 | 61 | -1 |
Haryana | 50 | 15 | 35 | 10 | 21 | 51 | 18 |
Karnataka | 46 | 16 | 38 | 21 | 27 | 34 | 18 |
Kerala | 33 | 23 | 44 | 8 | 21 | 18 | 53 |
Madhya Pradesh | 40 | 17 | 43 | 18 | 25 | 34 | 23 |
Maharashtra | 52 | 8 | 40 | 9 | 14 | 42 | 35 |
Orissa | 38 | 25 | 37 | 23 | 28 | 18 | 31 |
Punjab | 76 | 7 | 17 | 1 | 18 | 54 | 27 |
Rajasthan | 39 | 19 | 42 | 12 | 26 | 48 | 14 |
Tamil Nadu | 49 | 21 | 30 | 9 | 24 | 35 | 32 |
Uttar Pradesh | 50 | 17 | 33 | 10 | 24 | 40 | 26 |
West Bengal | 60 | 18 | 22 | 17 | 16 | 56 | 11 |
CL : Central Loans,
MB: Market Borrowings, OT : Others, \
NSSF : Loans from National Small Saving
Fund.
* : Includes negotiated loans from Banks and FIs and public account
borrowings. # : Came into existence on April 1, 1999. |
since April 1, 1999. During 2002-05, States have made substantial repayment of
Central Loans under Debt Swap Scheme. Consequently, the share of Central loans
in financing the States’ GFD has declined significantly while the share
of market loans, small savings and other loans has increased. In the recent years,
a number of States have financed over 50 per cent of their GFD through loans from
NSSF (Exhibit 4).
Revenue Performance of States
Revenue receipts showed sluggish growth in case of many States in the third
phases. Inadequate growth in revenue receipts was due to near stagnation in States’
tax-GSDP ratio with no perceptible change in the contribution of States’
non-tax revenue to GSDP and deceleration in resource transfers from the Centre
to the States. Revenue receipts-GSDP ratio was above 15 per cent in case of five
States during the second phase, however, in the third phase only two States could
manage their revenue-GSDP ratio at this level (Exhibit 5).
Exhibit
5 : States’ Revenue Receipts-GSDP Ratio:
A Comparative
Position | Per
cent | Phase 1 : 1980-86 |
Above 14 | Andhra
Pradesh, Karnataka, Tamil Nadu, Orissa | 13
to 14 | Kerala, Rajasthan, Bihar, Madhya
Pradesh, Maharashtra, Haryana | Below
13 | Gujarat, Punjab, Uttar Pradesh, West
Bengal | Phase
2: 1986-98 | Above
15 | Orissa, Bihar, Haryana, Karnataka,
Rajasthan | 14 to
15 | Andhra Pradesh, Kerala, Tamil Nadu |
Below 14 | Madhya
Pradesh, Uttar Pradesh, Gujarat, Punjab, Maharashtra, West Bengal |
Phase
3 : 1998-2004 | Above
15 | Bihar, Orissa |
13 to 15 | Madhya
Pradesh, Karnataka, Rajasthan, Andhra Pradesh, Punjab, Uttar Pradesh, Tamil Nadu |
Below 13 | Kerala,
Gujarat, Haryana, Maharashtra, West Bengal | Many
State Governments showed deterioration in their revenue receipts-GSDP ratio in
the third phase (Chart 3). The componentwise performance of revenue receipts of
State Governments is set out below.
Trends in States’
Own Revenue
States’ own taxes States’
own taxes remained almost stagnant at 7 per cent of GSDP during the second and
third phase. Under State taxes, the poor performance has been mainly marked
in the case of taxes on sales tax, state excise and

stamps
and registrations. The major reasons behind the inadequate growth in States taxes
over the years are (i) narrow tax base, (ii) greater dependence on indirect taxes
mainly the sales tax, (iii) lack of harmonised inter-state tax structure which
allowed distortions and rigidities to creep in, (iv) competitive tax reductions
by the States to attract trade and industry. The competitive reduction in taxes
led to a mere redistribution of existing capital among the States at the cost
of significant revenue foregone, (v) States inabilty to levy taxes on services
and agricultural income, and (vi) tax evasion and slackness in the recovery of
arrears.
States’ own non-tax revenue. The States’
own non-tax revenue in terms of GSDP showed deterioration in the second and third
phases. A major reason underlying the sluggish growth in non-tax revenue is the
levy of inadequate user charges/cost recoveries. The cost recovery in the case
of education and health services has hovered around 1 per cent and 5 per cent,
respectively, in the recent period (RBI, 2005). Apart from inappropriate user
charges, low or negative returns from investment have adversely affected the growth
of States’ own non-tax revenues over the years.
The trends in States’
own revenue receipts (comprising State’ own taxes and own non-taxes) indicate
that the many States such as West Bengal, Karnataka, Haryana, Gujarat and Maharashtra
showed deterioration in the third phase as against the second phase (Chart 4).
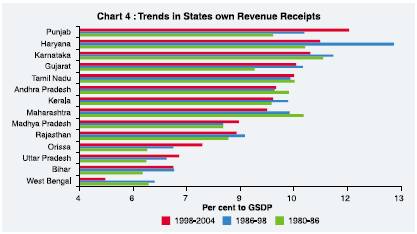
Exhibit 6 : States’
Own Revenue-GSDP Ratio: A Comparative Position |
Per cent | Phase
1 : 1980-86 | Above
10 | Karnataka, Haryana, Maharashtra, Tamil Nadu |
8 to 10 | Andhra
Pradesh, Punjab, Kerala, Gujarat, Rajasthan,
Madhya Pradesh |
Below 8 | West
Bengal, Orissa, Uttar Pradesh, Bihar | Phase
2: 1986-98 | Above
10 | Haryana, Karnataka, Punjab, Gujarat |
8 to 10 | Tamil
Nadu, Maharashtra, Kerala , Andhra Pradesh, Rajasthan,
Madhya Pradesh |
Below 8 | Bihar
, Orissa, Uttar Pradesh, West Bengal | Phase
3 : 1998-2004 | Above
10 | Punjab, Haryana, Karnataka, Gujarat, Tamil Nadu |
8 to 10 | Andhra
Pradesh, Kerala, Maharsahtra, Madhya Pradesh,
Rajasthan |
Below 8 | Orissa, Uttar Pradesh,
Bihar, West Bengal | The near stagnation in States
taxes and deterioration in States’ own non taxes resulted in decline in
States’ own revenue from 8.9 per cent of GSDP in second phase to 8.6 per
cent of GSDP in the third phase. The degree of variation, however, varied across
the States (Exhibit 6).
It is worth noting that many States could
finance less than 50 per cent of their total expenditure from own revenue receipts
(Exhibit 7).
Exhibit
7 : Financing of Total Expenditure through States’ Own
Revenues:
A Comparative Position | Per
cent | Phase 1 : 1980-86 |
Above 55 | Maharashtra,
Haryana | 50-55 | | Karnataka,
Gujarat, Andhra Pradesh, Tamil Nadu, Punjab | Below | 50 | Kerala,
Madhya Pradesh, West Bengal, Rajasthan, Uttar Pradesh, Bihar, Orissa |
Phase
2: 1986-98 | Above
55
50-55 | Haryana, Maharashtra, Gujarat,
Karnataka
Tamil Nadu, Punjab, Kerala | Below
50 | Andhra Pradesh, Madhya Pradesh, West
Bengal,
Rajasthan,
Uttar Pradesh,
Bihar, Orissa |
Phase 3 : 1998-2004
| Above
55 | Haryana, Maharashtra, Tamil Nadu |
50-55 | Karnataka,
Punjab | Below
50 | Gujarat, Kerala, Andhra Pradesh, Madhya
Pradesh, Rajasthan, Uttar Pradesh,
West Bengal, Orissa, Bihar |
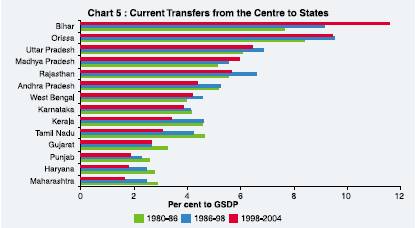
Trends
in current transfers and devolution from the Centre
The
trends in central transfers indicate stagnation in terms of GSDP in the second
phase and decline in the third phase due to lower central grants. Bihar, Orissa,
Uttar Pradesh and Rajasthan continued to receive the highest level of current
transfers while Punjab, Haryana and Maharashtra occupied the lowest positions
(Chart 5). Pattern and Trends in Total Expenditure
The pattern of expenditure reveals that revenue expenditure accounted for
a significant proportion (about three-fourth) of the total expenditure of the
States over the years. Total expenditure showed a significant increase in many
States such as Orissa, Bihar, Uttar Pradesh, Rajasthan and Punjab (Exhibit 8).
Trends in Revenue Expenditure
Interest
payments, expenses towards administrative services, wages and salaries, pensions
and subsidies given by the States led the revenue expenditure to grow significantly.
Interest payments alone constitute more than one-fifth of the total revenue expenditure.
The major components of revenue expenditure, viz., interest payments
and pensions absorbed as high as over 45 per cent, on an average, of revenue receipts
in the third phase as against 25 percent in the second phase (Exhibit 9 and Chart
6). In fact, in some years (during 2002-03 and 2003-04) these two components of
expenditure absorbed around 70 per cent of revenue receipts in case of West Bengal
and nearly 50 per cent of revenue receipts in case of Kerala.
Exhibit
8 : Total Expenditure-GSDP Ratio of States:
A Comparative
Position | Per
cent | Phase 1 : 1980-86 |
Above 20 | Karnataka,
Orissa, Rajasthan | 18
to 20 | Bihar, Tamil Nadu, Andhra Pradesh,
Punjab, Kerala, Haryana | Below
18 | Madhya Pradesh, Maharashtra, Uttar
Pradesh, Gujarat, West Bengal | Phase
2: 1986-98 | Above
20 | Orissa, Rajasthan, Bihar |
18 to 20 | Kerala,
Karnataka, Haryana, Andhra Pradesh, Punjab, Uttar Pradesh, Tamil Nadu |
Below 18 | Gujarat,
Madhya Pradesh, Madhya Pradesh, Maharashtra, West Bengal |
Phase 3 : 1998-2004 |
Above 20 | Orissa,
Bihar, Rajasthan, Uttar Pradesh, Punjab, Gujarat, Andhra Pradesh |
18 to 20 | Karnataka,
Kerala, Tamil Nadu, Madhya Pradesh | Below
18 | Haryana, West Bengal, Maharashtra |
Exhibit
9 : Interest Payments and Pensions as per cent to
Revenue
Receipts: A Comparative Position | Per
cent | Phase 1 : 1980-86 |
Above 14 | Rajasthan,
Kerala | 12 to 14 | Punjab,
West Bengal, Orissa, Karnataka | Below
12 | Bihar, Haryana, Gujarat, Andhra Pradesh,
Uttar Pradesh, Tamil Nadu, | | Maharashtra,
Madhya Pradesh | Phase
2: 1986-98 | Above
25 | Kerala, Orissa, Punjab |
22 to 25 | West
Bengal, Uttar Pradesh, Bihar, Rajasthan | Below
22 | Gujarat, Andhra Pradesh, Karnataka,
Tamil Nadu, Madhya Pradesh, Haryana, Maharashtra |
Phase 3 : 1998-2004 |
Above 45 | West
Bengal, Kerala, Punjab | 35
to 45 | Orissa, Rajasthan, Uttar Pradesh,
Bihar | Below 35 | Gujarat,
Tamil Nadu, Andhra Pradesh, Haryana, Maharashtra, Karnataka, Madhya Pradesh |

The
significant increase in revenue expenditure was observed in States such as Orissa,
Bihar, Punjab, Madhya Pradesh, Gujarat, Kerala and Rajasthan in the third phase
over the second phase (Chart 7 and Exhibit 10).
Trends in
Capital Expenditure
The impact of resource crunch and
the need for fiscal correction has more often been in form of a compromise in
the capital expenditure. Amidst the fiscal consolidation process in the 1990s, 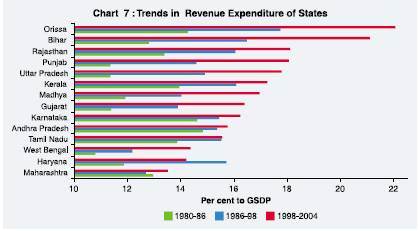
Exhibit
10 : States’ Revenue Expenditure-GSDP Ratio:
A Comparative
Position | Per
cent | Phase 1 : 1980-86 |
Above 14 | Andhra
Pradesh, Karnataka, Orissa, Kerala | 12
to 14 | Tamil Nadu, Rajasthan, Maharashtra,
Bihar | Below 12 | Madhya
Pradesh, Haryana, Gujarat, Uttar Pradesh, Punjab, West Bengal |
Phase 2: 1986-98 |
Above 16 | Orissa,
Bihar, Kerala, Rajasthan | 14
to 16 | Haryana, Tamil Nadu, Karnataka,
Andhra Pradesh, Uttar Pradesh, Punjab, Madhya Pradesh |
Below 14 | Gujarat
, Maharashtra, West Bengal | Phase
3 : 1998-2004 | Above
18 | Orissa, Bihar |
16 to 18 | Rajasthan,
Punjab, Uttar Pradesh, Kerala, Madhya Pradesh, Gujarat |
Below 16 | Andhra
Pradesh, Tamil Nadu, West Bengal, Haryana, Maharashtra, Karnataka |
the capital expenditure of many States started to show declining
trend (Chart 8 and Exhibit 11).
Debt Stocks of Major States
Persistenee of large deficits of State Governments has resulted in accumulation
of large debt stocks. The growth in debt stocks varied across States. Debt-GSDP
ratio was higher by 19 per cent in case of Orissa, 15 per cent for West Bengal,
14 per cent for Rajasthan and 12 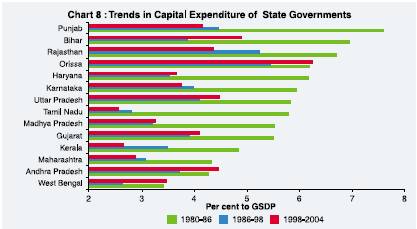
Exhibit
11 : States’ Capital Expenditure-GSDP Ratio:
A Comparative
Position | Per
cent |
Phase 1 : 1980-86 | Above
6.0 | Haryana, Orissa, Rajasthan, Bihar,
Punjab | 5.5 to
6.0 | Gujarat, Madhya Pradesh, Tamil Nadu,
Uttar Pradesh, Karnataka | Below
5.5 | West Bengal, Andhra Pradesh, Maharashtra,
Kerala | Phase
2: 1986-98 | Above
4.0 | Orissa, Rajasthan, Punjab, Uttar Pradesh |
3.5 to 4.0 | Karnataka,
Gujarat, Bihar, Andhra Pradesh, Haryana, Kerala |
Below 3.5 | Madhya
Pradesh, Maharashtra, Tamil Nadu, West Bengal |
Phase 3 : 1998-2004 |
Above 6.0 | Orissa |
4.0 to 6.0 | Bihar,
Uttar Pradesh, Andhra Pradesh, Rajasthan, Punjab, Gujarat |
Below 4.0 | Karnataka,
Haryana, West Bengal, Madhya Pradesh, Maharashtra, Kerala, Tamil Nadu |
per cent for Uttar Pradesh in the third phase over the second
phase (Chart 9).
In addition to budgetary debt, states have also increasingly
resorted to off-budget borrowings through guarantees. With States increasingly
accessing the market for resources, those with poor fiscal position may find financial
markets unwilling to absorb their securities. Recognising the magnitude of the
problem, the Comptroller and Auditor General of India (CAG) and the Finance Commissions
in their various reports have sounded warnings about the unsustainability of finances
of State Governments. During 2003-04, the outstanding State Government’
Guarantees in terms of GSDP were above 15 per cent in a number of States such
as Maharashtra, Kerala, Punjab and Rajasthan. 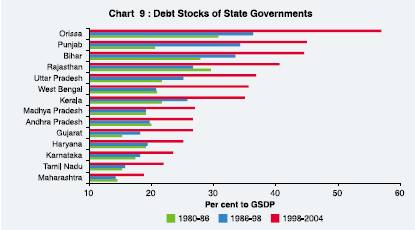
Section III
A Review of Policy Measures
The growing fiscal imbalances of the States called for structured policy
initiatives to address the problem. These initiatives had to be operationalised
by the States when the Eleventh Finance Commission set binding preconditions for
undertaking reforms to get the fiscal assistance. The policy initiatives include
preparation of Medium-Term Fiscal Reform Programmes (MTFRPs). Adjustment programme
had also been undertaken in some of the States which were linked to borrowings
from multilateral agencies. Major landmark in coordinated tax reforms were simplification
and rationlisation of the sales tax system since the beginning of the current
decade and the introduction of VAT from April 1, 2005, in place of the existing
cascading type sales (Rao, et al., 2005). Incentive based fiscal reforms
recommended by the TFC are also an important policy step towards bringing fisal
discipline at State level.
Supplementing the States efforts, the Central
Government introduced measures to encourage and facilitate fiscal reforms at the
State level. These mainly include: (i) introduction of Fiscal Reforms Facility,
(ii) one time settlement of State Electricity Boards, (iii) introduction of Debt
Swap Scheme and debt relief measures. The Reserve Bank of India, as debt manager
and banker to the State Governments has also initiated measures towards strengthening
their fiscal position. The major initiatives include: (i) constitution of various
Group/Committees on State finances, (ii) managing Market Borrowings Programme
of States, (iii) organising conferences on State Finances, (iv) policy initiatives
towards cash management, (v) policy initiatives towards off-budget borrowings7.
The policy measures initiated by the States may be grouped under three
categories, viz., (i) Policy measures towards State taxes and non-taxes,
(ii) Expenditure Management, and (iii) Institutional Reforms. The detatils of
these policy measures are set out below.
Policy Measures towards
States’ taxes and non-taxes
States’
taxes
The general approach of the States has been to rationalise
and simplify the tax structure, broaden the tax base and impose moderate rates
of taxation. States have initiated policy measures towards fiscal empowerment
mainly through States own taxes and showed intention to increase the magnitude
and efficiency of tax revenue mobilisation over the years. The initiated measures
by States include enhancement/ restructuring of various taxes such as land revenue,
vehicle tax, entertainment tax, sales tax, electricity duty, tax on trades, professional
tax and luxury tax. The major policy initiatives are as under:
(i)
Expert Committees/Commissions: A number of States have appointed committee/commission
to review the structure of their tax and non-tax revenues (Exhibit 12). The efforts
were also initiated towards computerisation of tax/budget departments, treasuries
and check-posts in view of the VAT as implementated by the States.
Exhibit
12 : Policy Initiatives by Major States |
Policy Measures | Name
of the State | 1.
Expert Committee/Commissions | Andhra Pradesh
(Revenue Reforms Committee), Karnataka (Tax and Revenue Reforms Commission,
Fiscal Policy and
Analysis Cell), Tamil Nadu (Taxation Reforms
and Revenue Augmentation Commission, Staff and Expenditure Reforms Commission,
Disinvestment Commission), Haryana (Committee to Mobilise Additional
Resources),
Maharashtra (Consultative Committee of Trade and Industry),
Uttar Pradesh (Resource and Expenditure Commission) |
2. Introduction of VAT | All
the States have introduced VAT except Tamil Nadu and Uttar Pradesh. Haryana was
the first State to introduce the VAT in April 2003. |
3. One-time settlement/amnesty schemes for recovery
of tax arrears. | A number of States including
those of Maharashtra, Karnataka and Kerala | (ii)
Introduction of VAT: Realising the need for tax reforms,
most of the States have switched over to a VAT regime on the basis of recommendations
of the Empowered Committee of State Finance Ministers with effect from April 1,
2005. VAT may be defined as a tax on the value added at each stage of production
and distribution of a commodity. VAT is inherently efficient than the sales tax
or excise duty or any turnover tax. Operationally, application of VAT at a particular
stage implies payment of tax by the producer or distributor on the value of his
output but with a rebate (or credit) on the taxes paid by him on the inputs.
States’ non-tax revenues
The policy
measures towards non-taxes include reviewing/ rationalising the royalties, including
those on major and minor minerals, forestry and wildlife, revision of tuition
fees, medical fees, irrigation water rates and tariffs on urban water supply.
The States have prepared MTFRPs and have emphasised on the cost effectiveness
and raising user charges of services rendered by them.
Expenditure
Management
The major policy initiatives on expenditure front
include containing unproductive expenditures and reorienting spending towards
developmental purpose, restrictions on fresh recruitment/ creation of new posts,
review of manpower requirements, cut in establishment expenses and reduction in
non-merit subsidies through better targeting. In their recent budgets, some State
Governments, such as Punjab, have called for restructuring of the staff position
in each government department and have indicated that future employment in the
government would be project-specific and need-based.
Tamil Nadu
took initiatives to constitute an Expenditure Review Committee to review,
on an on-going basis, the expenditure in respect of each department. States, like
Punjab, have initiated measures towards disinvestment on a select basis in respect
of loss-making Public Sector Undertakings. Many States including those of Andhra
Pradesh, Gujarat, Rajasthan, Tamil Nadu, Uttar Pradesh and Madhya Pradesh have
introduced the new pension scheme based on the defined contribution system. Institutional
Reforms
The institutional reforms facilitating the fiscal
consolidation process are set out below:
Rule based fiscal
policy measures: Recognising the need for providing statutory
backing to the fiscal reforms, many States have initiated measures to enact the
FRLs targeting to eliminate revenue deficit and reduce GFD (Exhibit 13).
Other Institutional Reforms: Theseinclude setting
up of the Guarantee Redemption Fund, Consolidated Sinking Fund and Ceiling on
Guarantees (Exhibit13).
State Public Sector Undertakings Reforms
Several States have shown interest in undertaking a comprehensive review
of the functioning of the State Public Sector Undertakings (SPSUs), including
the possibility of closing down of non-viable units after providing for suitable
safety-nets to the employees including voluntary retirement scheme (VRS). States
such as Tamil Nadu, Kerala, Haryana, Karnataka and Orissa have encouraged
private sector participation in the transport and power generation sectors. Karnataka’s
initiatives towards Policy Paper on restructuring of SPSUs and Maharashtra’s
initiatives towards setting up a Board for Restructuring of the SPSUs are noteworthy.
A notable development has been the initiation of power sector reforms which include
the constitution of State Electricity Regulatory Commissions (SERCs) for determining
the tariff structure,
Exhibit
13 : Initiatives towards Institutional Reforms by Major States |
Institutional Reforms | Name
of the State | 1.
Fiscal Responsibility Legislation | All
the major States (except Bihar and West Bengal) have enacted FRLs. |
2. Guarantee Redemption Fund | Andhra
Pradesh, Gujarat, Haryana, Karnataka, Orissa, Rajasthan |
3. Ceiling on Guarantees | Gujarat,
Karnataka, Kerala, Punjab, Rajasthan, Tamil Nadu, West Bengal |
4. Consolidated Sinking Fund | Andhra
Pradesh, Gujarat, Haryana, Maharashtra, Orissa, West Bengal | unbundling
of electricity boards into separate entities for power generation, transmission
and distribution, increasing power tariffs and measures for reducing transmission
and distribution losses. Section IV
Effectiveness of Policy Measures
The effectiveness of policy measures to strengthen the State finances remained
largely inadequate keeping in view of the size of the problem. Most of the policy
measures were ad hoc in nature and were guided by the exigency rather
than being structured and well planned to put the State finances on the right
path. The componentwise details of various policy measures and their effectiveness
to strengthen the State finances are set out below.
Effectiveness
of Revenue Mobilisation Measures
The policy initiatives towards
revenue mobilisation remained inadequate to keep pace with the growing expenditure
requirements. These are discussed below.
States’ Tax
Revenues
Taking into account the past trends of State
finances and the literature available on State finances, it seems that there was
not much progress on restructuring of State finances. Many State Governments continued
to carry their business as usual. There has been some progress in reforming the
tax system, although the leakages in tax base through exemptions continue to pose
problems (RBI, 2005). States took initiatives towards setting up Committees/ Groups
and prepared MTFRPs to suggest the ways to enhance revenues. However, the implementation
part of these measures remained weak as evident with the near stagnation in States
taxes-GSDP ratios in the 1990s.
Despite the States’ efforts towards
enhancing revenues, the factors, such as, narrow States’ tax base, greater
dependence on indirect taxes and lack of control on populist measures (such as
free electricity) taken by States continued to persist. Furthermore, the increased
competition among the States to attract the investment by providing tax concessions
and other fiscal incentives has only resulted in a race to the bottom (Rastogi,
2004). Competitive reduction in taxes led to a mere redistribution of existing
capital among the States at the cost of significant revenue foregone, while taxes
could not be levied on services and agricultural income (Rao, 2002).
States’ Non-Tax Revenues The effectiveness of various
non-tax reforms to improve cost recovery for major social and economic services
provided by States has remained below the expectations. This is reflected in very
low user charges/cost recovery from various services and low/negative returns
from investment in PSEs. User charges remained inadequate because of the perception
of availing government services as free. Furthermore, with the inferior quality
of services, the public is loath to pay higher charges for public services. Cost
recovery in the case of a number of social services, such as education and health,
have hovered around 1 per cent and 5 per cent, respectively, in the recent
period. The cost recovery in respect of economic services such as irrigation,
roads and power is found to be higher than that of social services but still remains
quite low (RBI, 2005). It seems that there is no link between capacity to borrow
and the return on services provided by the Government. Since there is not enough
incentive for the government to undertake appropriate levy of user charges, states
are encouraged to become fiscally irresponsible and to subject user charges to
populist considerations (Mohan, 2000; Acharya, 2002).
Over the years,
States have initiated a number of measures to improve the functioning of State
public sector enterprises (PSEs). There has, however, not been adequate generation
of revenues in the form of dividends and profits received from the PSEs. There
is a need to take a relook of the functioning of PSEs in order to ensure the viability
of running State level PSEs in long run. Around one-fourth of the total State
public sector enterprises are profit making while the rest are the largest drain
on the system. Most State PSEs are unlikely to yield significant resources from
privatisation proceeds, but privatisation could at least help avoid recurring
losses which are otherwise a burden on the budgets. The power sector remains the
worst affected by the populist measures announced by a number of States. The average
tariff rate for electricity provided to agriculture remained 25 paisa per kwh
for all States (even some States have actually made it free) while average cost
of supplying power remained Rs.2.81 per unit. Irrigation charges cover only around
one fifth of the maintenance costs of the system, to say nothing of capital charges
(Ahluwalia, 2001).
The reforms initiated in the power sector in
recent years at State level are encouraging. However, keeping in view of the past
record of populist measures such as free electricity, for certain sectors requires
a close monitoring on the effectiveness of these reforms. In view of the large
investment made by States in the public sector enterprises, state level fiscal
strategy should be designed in a manner which ensures that these returns in the
form of user charges and profits from commercial activities be adequate and augment
fiscal discipline.
Effectiveness of Expenditure Management Measures
The effectiveness of policy measures towards expenditure management could
be seen in the light of the fact the non-developmental expenditure (comprising,
inter alia, interest payments, pensions and administrative services)
has shown noticeable increase and stood at around 7 per cent of GSDP in the third
phase higher by over 3 per cent and 2 per cent than the first phase and second
phase, respectively. A sizeable reduction in non-developmental expenditure may
not be feasible in the short-term, given the committed nature of many of its constituent
items.
Notwithstanding the downward rigidity, the Debt Swap Scheme
has brought about definite savings on interest costs as far as interest payments
are concerned. Here again the question arises what about the higher interest cost
in case of those loans negotiated from banks and FIs. Furthermore, the high interest
cost on small saving receipts used by States to finance the resource gap also
assume importance.
The States initiatives towards containing the
subsidies were also not much effective and the subsidies given to various sectors
including those of power sector and State road transport corporations continued
to increase. Over the years, the inability to contain consumption expenditure
due to explicit and implicit subsidies, which are mostly cornered by the influential
segments of the society, and the reluctance to raise additional resources on the
part of the States have been the main causes for the deterioration of fiscal situation
in States (Kurian, 1999). Direct and indirect subsidies provided by State Governments,
most of which are not well targeted, have become unsustainable (Ahluwalia, 2001).
The power subsidies have increased manifold over the years and even after subventions
(financial support) from State Governments and cross-subsidisation, the magnitude
of the ‘uncovered’ subsidy leaves little scope for the State Electricity
Boards (SEBs), but to default on payments (RBI, 2004).
The States
efforts to enhance desired allocations towards developmental expenditure could
not materalise with the fact that in terms of GSDP this component of expenditure
in the third phase showed decline around one percentage point from the earlier
phases. The share of developmental expenditure in total expenditure also continued
to show deterioration in the second and third phase.
To sum up,
it is worth noting as stated in the Draft on “Towards Faster and More
Inclusive Growth: An Approach to the Eleventh Five Year Plan”, Planning
Commission, Government of India, “….Fiscal discipline also requires
control in non-Plan expenditure by both the Centre and the States. Some of what
is non-Plan expenditure is essential for effective delivery of public services.
Another part is pre committed such as interest payments and pensions. Effective
control must be exercised in the rest of non-Plan expenditure if ambitious plan
targets are to be met. In practice this means control of subsidies and also levy
of rational user charges to keep the demands on budgetary expenditure within limits”.
Section V
Concluding Observations
The fiscal imbalances at State level appeared in the second phase had deepened
and continued to persist in the third phase. The States took policy measures which
helped to some extent to avoid further worsening of their fiscal position; however,
these have not been significant. The recent fiscal developments at State level
put emphasis on the on-going fiscal and institutional reforms and seem to follow
the path of reforms as suggested by the TFC. As the States face large resource
gap, they would have to explore new avenues apart from utilising the traditional
resources effectively and efficiently. States need to set priorities in their
expenditures to reap the benefits and operate their economy in its full capacity.
Notwithstanding some moderation in fiscal imbalances in recent years, the
low and stagnant revenues particularly non taxes and large component of non developmental
expenditure requires the States to take corrective measures. Interest payments
account a major portion of the revenue expenditure and absorb a sizeable portion
of revenue receipts in case of many States. The increasing liabilities from the
NSSF need to be addressed as they involve high interest cost. Furthermore, the
loans contracted from banks and financial institutions in the past also carry
high interest rate. The upturn in interest rate cycle, currenly underway,
is likely to put further pressure on interest burden of the States
In
view of the large and persistent resource gap, the cornerstone of the fiscal strategy
pursued at State level needs to be examined as per the changing requirements.
As rightly stated in the Mid Term Appraisal of the Tenth Five Year Plan 2002-07,
Government of India, “Improving resources of States on a sustainable
basis, providing incentives for developmental performance, fiscal prudence and
accountability and putting in place successful and flexible mechanisms for intergovernmental
transfer are key issues, not only in the remaining period of the Tenth Plan but
even more for the Eleventh Plan”.To sum up, the fiscal policy pursued
at State level needs to be mainly focussed on (i) to broaden tax base including
those of agriculture income and to reduce exemptions/concessions, (ii) administrative
and legislative reforms in taxation, (iii) increase in cost recovery/user charges
and returns from public investment, (iv) public sector undertakings restructuring,
(v) rationalisation and containment of both explicit and implicit subsidies, (vi)
expenditure reprioritisation towards social and productive sectors and, more importantly,
(vii) institutional reforms. These initiatives would go a long way to bring fiscal
discipline and sustainability in the public finance at State level.
Notes
1 Major deficits of States revealed marginal improvement
during 2000-03; however, States’ fiscal health again deteriorated in 2003-04.
Notwithstanding some moderation in major deficits, the low and stagnant revenues
particularly non tax and large component of non developmental expenditure remained
cause of concern.
2 The data have been sourced from the State finances
articles, various issues published by the RBI and the Budget Documents of the
State Governments. The GSDP data have been sourced from the Central Statistical
Organisation website.
3 The analytical review is based on the fiscal
position of 14 major States of India. These States account for about 90
per cent of aggregate budget of all States. Uttar Pradesh, Madhya Pradesh, and
Bihar are taken as undivided States for purpose of comparison. North Eastern
and other special category States have been excluded from the analysis because
of special features and also gaps in the data for some of these States. The small
States of Goa and Delhi have also been excluded, the latter having the additional
feature of being the capital.
4 West Bengal’s Revenue Account
was in surplus (0.4 per cent of GSDP) only in 1985-86 and the rest of the period
State’s Revenue Account was in deficit (on an average at 1.2 per cent of
GSDP).
5 The TFC also recommended, if, however, some fiscally weak States
are unable to raise funds from the market, the Centre could resort to lending,
but the interest rate should remain aligned to the marginal cost of borrowings
for the Centre.
6 The constitution of the Sixth Pay Commission
has been approved by the Union Cabinet on July 20, 2006.
7 For
further details of these policy measures, please see RBI’s publication
: State Finances: A Study of Budgets”, various issues, published
by the RBI annually. References
Acharya, S.
(2002), “Macroeconomic Management in the 1990s”, Economic and
Political Weekly (April 20-27); p. 1515-38.
Ahluwalia, Montek
S. (2000), “Economic Performance of States in Post Reforms Period”,
Economic and Political Weekly, May 6, pp 1637-48.
—— (2001), “State Level Performance under Economic Reforms in
India” Center for Research on Economic Development and Policy Reforms, Working
Paper No 96, March.
Bagchi, Amaresh (2005), Symposium on Report of
Twelfth Finance Commission, Introduction and Overview, Economic and Political
Weekly, July 30.
Bagchi, Amaresh (2003), “Fifty Years of
Fiscal Federalism in India: An Appraisal” NIPFP Working Paper No.2.
Government of India, Report of the Finance Commission, (various issues),
Ministry of Finance.
——, Mid-Term Appraisal of the Tenth
Five Year Plan (2002-07).
——, (Draft) An Approach to
the Eleventh Five Year Plan (2007-12).
——, Economic
Survey, various issues.
Kannan, R., S.M. Pillai, R. Kausaliya and Jai
Chander, (2004), “Finance Commission Awards in India and Fiscal Stability
in State Finances” Economic and Political Weekly, January
31.
Kurian N.J. (2000), “Widening Regional Disparities in India,
Some Indicators”, Economic and Political Weekly, February 12; pp
538-550.
Lahiri, Ashok, 2000, “Sub National Public Finance in
India”, Economic and Political Weekly, April 29.
Lahiri,
A. and R. Kannan (2001), “India’s Fiscal Deficits and their Sustainability
in Perspective”. Paper presented at World Bank-NIPFP Seminar on Fiscal Policies
for Growth.
Mohan, Rakesh (2000), “Fiscal Correction for Economic
Growth: Data Analysis and Suggestions”, Economic and Political Weekly,
June 10-16, XXXV:24; 2027-36.
Pillai, S.M., S. Chatterjee, B. Singh,
S. Das and A. Gupta (1997), “Fiscal Policy: Issues and Perspectives, RBI
Occasional Papers, No. 18
Pinto, Brian and Farah Zahir (2004),
“India: Why Fiscal Adjustment Now”World Bank Policy Research Working
Paper 3230, March.
Rajaraman, Indira, Shashank Bhide and R.K.
Pattnaik (2005), “A Study of Debt Sustainability at State Level in
India”, RBI Bulletin, October.
Rangarajan, C. and D.K. Srivastava
(2005), “Fiscal Deficits and Government Debt in India: Implications for
Growth and Stabilisation”, NIPFP Working Paper No. 35.
Rakshit,
Mihir (2005), “Some Analytics and Empirics of Fiscal Restructuring in India”,
Economic and Political Weekly, July, 30; pp 3440-3449.
Rao,
M. Govinda (2002), “State Finances in India: Issues and Challenges”,
Economic and Political Weekly, August 3; pp 3261-3271.
Rao,
M. Govinda and R. Kavita Rao (2005), “Trends and Issues in Tax Policy
and Reform in India”, NIPFP, Working Paper no 1, 2005, November.
Rastogi, Anupam (2004), “ Restructuring Public Finances”, Economic
and Political Weekly, June 26
Reserve Bank of India, Report
on Currency and Finance, various issues.
——, Annual
Report, various issues.
——, Article on State Finances,
various issues.
Reddy, Y.V., (2001), “Fiscal Reforms at
the State Level: Review and Prospects”, RBI Bulletin, January.
State Governments, Economic Survey, various issues.
World Bank
(2005), “State Fiscal Reforms in India, Progress and Prospects”, A
World Bank Report.
* Shri Rajmal is Research Officer in the Department
of Economic Analysis and Policy of the Reserve Bank of India. The views expressed
are those of the author and not of the institution to which he belongs. |
 IST,
IST,


