|
The Reserve Bank has been conducting the survey of professional forecasters (SPF) since September 2007. Forty-four panellists participated in the 89th round of the bi-monthly survey conducted during July 2024. The survey results are summarised in terms of their median forecasts and summary statistics are presented in Annexes 1-7 .
Highlights:
1. Output
- Real gross domestic product (GDP) is expected to grow by 7.0 per cent in 2024-25, revised up by 20 basis points (bps) from the previous round. It is expected to grow by 6.7 per cent in 2025-26 (Table 1).
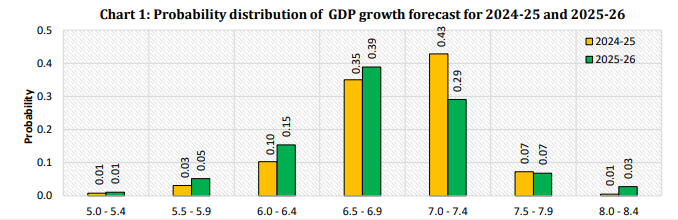
- SPF panellists placed GDP growth forecasts in the range of 6.5-8.1 per cent for 2024-25 and in the range of 6.2-8.1 per cent for 2025-26 (Annexes 1 and 2).
- Forecasters have assigned highest probability to real GDP growth in the range of 7.0-7.4 per cent for 2024-25 and in the range of 6.5-6.9 per cent in 2025-26 (Chart 1).
Note: Tail parts of the distributions are not presented in this chart but are included in Annex 6.
- Annual growth in real private final consumption expenditure (PFCE) and real gross fixed capital formation (GFCF) for 2024-25 are expected at 6.0 per cent and 8.0 per cent, respectively.
- Real gross value added (GVA) growth projection has been revised up marginally to 6.7 per cent for 2024-25 and remained unchanged at 6.4 per cent for 2025-26.
| Table 1: Median Forecast of Growth in GDP, GVA and components |
| (in per cent) |
| |
2024-25 |
2025-26 |
| Real GDP |
7.0
(+0.2) |
6.7
(0.0) |
| a. Real PFCE |
6.0
(0.0) |
6.4
(+0.2) |
| b. Real GFCF |
8.0
(-0.6) |
7.8
(+0.3) |
| Nominal PFCE |
10.0
(-0.3) |
9.7
(0.0) |
| Real GVA |
6.7
(+0.1) |
6.4
(0.0) |
| a. Agriculture and Allied Activities |
3.7
(+0.1) |
3.2
(+0.1) |
| b. Industry |
7.0
(0.0) |
6.7
(+0.1) |
| c. Services |
7.4
(0.0) |
7.0
(-0.2) |
Gross Saving Rate
[per cent of gross national disposable income] |
30.0
(-0.1) |
30.3
(+0.3) |
Gross Capital Formation Rate
[per cent of GDP at current market prices] |
33.3
(-0.6) |
33.6
(-0.1) |
| Note: The figures in parentheses indicate the extent of revision in median forecasts (in percentage points) relative to the previous SPF round (applicable for Tables 1-4). |
- In terms of quarterly path, real GDP growth (y-o-y) is expected to remain in the narrow range of 6.9-7.0 per cent during 2024-25 (Table 2).
| Table 2: Median Growth Forecast of Quarterly GDP, GVA and components |
| (in per cent) |
| |
Q1:2024-25 |
Q2:2024-25 |
Q3:2024-25 |
Q4:2024-25 |
Q1:2025-26 |
| Real GDP |
7.0
(+0.2) |
7.0
(+0.1) |
6.9
(+0.2) |
7.0
(+0.1) |
6.8 |
| a. Real PFCE |
5.5
(0.0) |
6.0
(0.0) |
6.0
(0.0) |
6.1
(0.0) |
6.5 |
| b. Real GFCF |
7.5
(-0.5) |
7.5
(-0.5) |
8.0
(-0.7) |
7.6
(-0.4) |
8.0 |
| Real GVA |
6.4
(-0.1) |
6.7
(+0.2) |
6.7
(+0.1) |
6.5
(-0.1) |
6.6 |
2. Inflation
- Annual headline inflation, based on consumer price index (CPI), is expected at 4.5 per cent for both the years 2024-25 and 2025-26 (Annexes 1 and 2).
- Headline CPI inflation (y-o-y) is expected at 4.0 per cent in Q2:2024-25; it is likely to increase and remain between 4.6-4.7 per cent in the subsequent three quarters (Table 3).
- The panellists expect CPI inflation, excluding food and beverages, pan, tobacco and intoxicants, and fuel and light, to rise in successive quarters from 3.5 per cent during Q2:2024-25 to 4.5 per cent during Q1:2025-26.
| Table 3: Median Forecast of Quarterly Inflation |
| (in per cent) |
| |
Q2:2024-25 |
Q3:2024-25 |
Q4:2024-25 |
Q1:2025-26 |
| CPI Combined (General) |
4.0
(+0.2) |
4.7
(0.0) |
4.6
(0.0) |
4.7 |
| CPI Combined excluding food and beverages, pan, tobacco and intoxicants and fuel and light |
3.5
(-0.1) |
4.0
(0.0) |
4.3
(0.0) |
4.5 |
| WPI All Commodities |
2.4
(0.0) |
3.3
(0.0) |
3.9
(+0.2) |
3.6 |
| WPI Non-food Manufactured Products |
1.5
(+0.1) |
2.1
(0.0) |
3.4
(+0.1) |
3.4 |
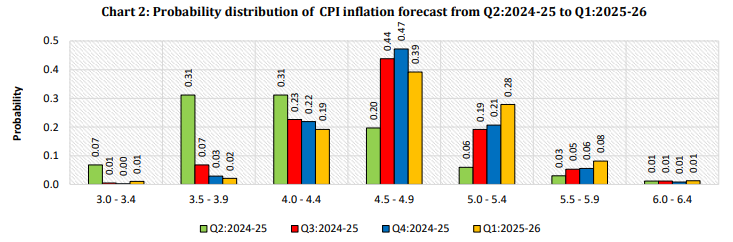
- Forecasters have assigned the highest probability to the headline CPI inflation lying in the range of 3.5-4.4 per cent in Q2 and in the range of 4.5-4.9 per cent during the subsequent three quarters (Chart 2).
Note: Tail parts of the distributions are not presented in this chart but are included in Annex 7.
3. External Sector
- Merchandise exports and imports are projected to grow by 3.8 per cent and 5.3 per cent, respectively, during 2024-25 and by 5.4 per cent and 5.8 per cent, respectively, during 2025-26, in US dollar terms (Table 4).
- Current account deficit (CAD) is expected at 1.0 per cent (of GDP at current market prices) during 2024-25 and at 1.1 per cent during 2025-26.
| Table 4: Median Forecast of Select External Sector Variables |
| |
2024-25 |
2025-26 |
Merchandise Exports in US $ terms
(annual growth in per cent) |
3.8
(-0.1) |
5.4
(+0.3) |
Merchandise Imports in US $ terms
(annual growth in per cent) |
5.3
(+0.1) |
5.8
(-0.2) |
Current Account Balance
(per cent of GDP at current market prices) |
-1.0
(0.0) |
-1.1
(0.0) |
|
The Reserve Bank thanks the following panellists for their participation in this round of the Survey of Professional Forecasters (SPF):
Abhishek Gupta (Bloomberg Economics), Aditi Nayar (ICRA Ltd.), Aditya Vyas (STCI Primary Dealer Ltd.), Anuradha Patnaik (University of Mumbai), Barclays Bank PLC, CRISIL Ltd., Debopam Chaudhuri (Piramal Enterprises Ltd.), Devendra Kumar Pant (India Ratings & Research), Gaura Sen Gupta (IDFC FIRST Bank), Gaurav Kapur (IndusInd Bank Ltd.), ICICI Securities Primary Dealership Ltd., Indranil Pan (Yes Bank Ltd.), Kanika Pasricha (Union Bank of India), Madan Sabnavis (Bank of Baroda), Madhavi Arora (Emkay Global Financial Services Ltd.), Nikhil Gupta (Motilal Oswal Financial Services Ltd.), Sachchidanand Shukla (Larsen & Toubro), Shailesh Kejariwal (B&K Securities India Pvt. Ltd.), Shubhada Rao (QuantEco Research), Siddharth Kothari (Sunidhi Securities & Finance Ltd.), Soumya Kanti Ghosh (State Bank of India), Suvodeep Rakshit (Kotak Securities), TAC Economics, Tanvee Gupta Jain (UBS Securities India Private Ltd.), Tirthankar Patnaik (National Stock Exchange), Upasna Bhardwaj (Kotak Mahindra Bank) and Vikram Chhabra (360 ONE Asset).
The Bank also acknowledges the contribution of seventeen other SPF panellists, who prefer to remain anonymous.
|
| Annex 1: Annual Forecasts for 2024-25 |
| |
Key Macroeconomic Indicators |
Annual Forecasts for 2024-25 |
| Mean |
Median |
Max |
Min |
1st
quartile |
3rd
quartile |
| 1 |
GDP at constant (2011-12) prices: Annual Growth (per cent) |
7.0 |
7.0 |
8.1 |
6.5 |
6.8 |
7.1 |
| a |
Private Final Consumption Expenditure (PFCE) at constant (2011-12) prices: Annual Growth (per cent) |
5.9 |
6.0 |
7.3 |
3.5 |
5.2 |
6.7 |
| b |
Gross Fixed Capital Formation (GFCF) at constant (2011-12) prices: Annual Growth (per cent) |
7.9 |
8.0 |
9.8 |
5.3 |
7.0 |
8.9 |
| 2 |
Private Final Consumption Expenditure (PFCE) at current prices: Annual Growth (per cent) |
9.8 |
10.0 |
13.7 |
7.0 |
8.7 |
10.5 |
| 3 |
Gross Capital Formation Rate (per cent of GDP at current market prices) |
31.9 |
33.3 |
34.4 |
14.0 |
32.0 |
33.7 |
| 4 |
GVA at constant (2011-12) prices: Annual Growth (per cent) |
6.6 |
6.7 |
7.1 |
6.0 |
6.5 |
6.8 |
| a |
Agriculture & Allied Activities at constant (2011-12) prices: Annual Growth (per cent) |
3.7 |
3.7 |
7.2 |
1.2 |
3.1 |
4.2 |
| b |
Industry at constant (2011-12) prices: Annual Growth (per cent) |
6.9 |
7.0 |
9.0 |
3.1 |
6.4 |
7.6 |
| c |
Services at constant (2011-12) prices: Annual Growth (per cent) |
7.5 |
7.4 |
11.0 |
6.3 |
7.1 |
7.7 |
| 5 |
Gross Saving Rate (per cent of Gross National Disposable Income) -at current prices |
30.5 |
30.0 |
32.5 |
28.3 |
29.7 |
31.5 |
| 6 |
Fiscal Deficit of Central Govt. (per cent of GDP at current market prices) |
5.0 |
5.0 |
5.4 |
4.7 |
4.9 |
5.1 |
| 7 |
Combined Gross Fiscal Deficit (per cent to GDP at current market prices) |
8.0 |
7.9 |
8.7 |
7.3 |
7.8 |
8.1 |
| 8 |
Bank Credit of Scheduled commercial banks: Annual Growth (per cent) |
13.9 |
14.0 |
19.0 |
11.0 |
13.0 |
14.1 |
| 9 |
Yield on 10-Year G-Sec of Central Govt. (end-period) |
6.8 |
6.8 |
7.0 |
6.3 |
6.7 |
6.9 |
| 10 |
Yield on 91-day T-Bill of Central Govt. (end-period) |
6.5 |
6.5 |
6.9 |
6.0 |
6.4 |
6.7 |
| 11 |
Merchandise Exports (BoP basis in US$ terms): Annual Growth (per cent) |
3.6 |
3.8 |
16.8 |
-7.0 |
1.0 |
5.2 |
| 12 |
Merchandise Imports (BoP basis in US$ terms): Annual Growth (per cent) |
3.8 |
5.3 |
15.3 |
-39.4 |
3.0 |
6.9 |
| 13 |
Current Account Balance in US$ bn. |
-36.1 |
-38.0 |
-1.1 |
-59.0 |
-45.0 |
-30.0 |
| a |
Current Account Balance (per cent to GDP at current market prices) |
-1.0 |
-1.0 |
-0.1 |
-1.5 |
-1.1 |
-0.9 |
| 14 |
Overall BoP in US$ bn. |
47.8 |
47.4 |
81.8 |
20.0 |
34.6 |
59.4 |
| 15 |
Inflation based on CPI Combined: Headline |
4.6 |
4.5 |
5.3 |
4.3 |
4.5 |
4.6 |
| 16 |
Inflation based on CPI Combined: excluding Food and Beverages, Pan, Tobacco and Intoxicants and Fuel and Light |
3.8 |
3.8 |
4.5 |
3.2 |
3.7 |
3.9 |
| 17 |
Inflation based on WPI: All Commodities |
3.0 |
3.0 |
4.2 |
1.0 |
2.7 |
3.4 |
| 18 |
Inflation based on WPI: Non-food Manufactured Products |
2.1 |
1.9 |
3.9 |
0.3 |
1.7 |
2.4 |
| Annex 2: Annual Forecasts for 2025-26 |
| |
Key Macroeconomic Indicators |
Annual Forecasts for 2025-26 |
| Mean |
Median |
Max |
Min |
1st
quartile |
3rd
quartile |
| 1 |
GDP at constant (2011-12) prices: Annual Growth (per cent) |
6.8 |
6.7 |
8.1 |
6.2 |
6.5 |
7.0 |
| a |
Private Final Consumption Expenditure (PFCE) at constant (2011-12) prices: Annual Growth (per cent) |
6.2 |
6.4 |
7.4 |
4.0 |
5.9 |
6.6 |
| b |
Gross Fixed Capital Formation (GFCF) at constant (2011-12) prices: Annual Growth (per cent) |
8.0 |
7.8 |
12.1 |
5.8 |
7.2 |
8.4 |
| 2 |
Private Final Consumption Expenditure (PFCE) at current prices: Annual Growth (per cent) |
9.5 |
9.7 |
11.0 |
7.5 |
9.0 |
10.0 |
| 3 |
Gross Capital Formation Rate (per cent of GDP at current market prices) |
33.1 |
33.6 |
34.8 |
29.5 |
32.9 |
33.9 |
| 4 |
GVA at constant (2011-12) prices: Annual Growth (per cent) |
6.5 |
6.4 |
7.2 |
6.0 |
6.3 |
6.7 |
| a |
Agriculture & Allied Activities at constant (2011-12) prices: Annual Growth (per cent) |
3.3 |
3.2 |
6.5 |
1.2 |
3.0 |
3.7 |
| b |
Industry at constant (2011-12) prices: Annual Growth (per cent) |
6.9 |
6.7 |
9.0 |
5.5 |
6.1 |
7.7 |
| c |
Services at constant (2011-12) prices: Annual Growth (per cent) |
7.1 |
7.0 |
9.0 |
6.3 |
6.8 |
7.4 |
| 5 |
Gross Saving Rate (per cent of Gross National Disposable Income) -at current prices |
30.8 |
30.3 |
32.5 |
29.0 |
30.0 |
31.6 |
| 6 |
Fiscal Deficit of Central Govt. (per cent of GDP at current market prices) |
4.6 |
4.5 |
5.3 |
4.3 |
4.5 |
4.5 |
| 7 |
Combined Gross Fiscal Deficit (per cent to GDP at current market prices) |
7.5 |
7.5 |
8.6 |
6.8 |
7.2 |
7.6 |
| 8 |
Bank Credit of Scheduled commercial banks: Annual Growth (per cent) |
13.5 |
13.0 |
20.0 |
11.0 |
12.1 |
14.5 |
| 9 |
Yield on 10-Year G-Sec of Central Govt. (end-period) |
6.6 |
6.6 |
7.0 |
6.1 |
6.5 |
6.8 |
| 10 |
Yield on 91-day T-Bill of Central Govt. (end-period) |
6.2 |
6.2 |
6.8 |
5.5 |
6.0 |
6.5 |
| 11 |
Merchandise Exports (BoP basis in US$ terms): Annual Growth (per cent) |
5.0 |
5.4 |
10.9 |
-3.4 |
4.2 |
6.9 |
| 12 |
Merchandise Imports (BoP basis in US$ terms): Annual Growth (per cent) |
5.6 |
5.8 |
10.3 |
-5.1 |
4.2 |
7.8 |
| 13 |
Current Account Balance in US$ bn. |
-39.9 |
-42.2 |
-1.1 |
-61.5 |
-52.8 |
-32.3 |
| a |
Current Account Balance (per cent to GDP at current market prices) |
-1.0 |
-1.1 |
-0.1 |
-1.5 |
-1.2 |
-0.8 |
| 14 |
Overall BoP in US$ bn. |
41.2 |
39.6 |
80.0 |
10.0 |
29.6 |
49.0 |
| 15 |
Inflation based on CPI Combined: Headline |
4.5 |
4.5 |
5.2 |
4.0 |
4.3 |
4.7 |
| 16 |
Inflation based on CPI Combined: excluding Food and Beverages, Pan, Tobacco and Intoxicants and Fuel and Light |
4.3 |
4.3 |
5.1 |
3.2 |
4.1 |
4.5 |
| 17 |
Inflation based on WPI: All Commodities |
3.2 |
3.5 |
4.8 |
0.5 |
2.5 |
4.0 |
| 18 |
Inflation based on WPI: Non-food Manufactured Products |
2.8 |
2.7 |
4.2 |
0.5 |
2.0 |
4.0 |
| Annex 3: Quarterly Forecasts from Q1:2024-25 to Q1:2025-26 |
| |
Key Macroeconomic Indicators |
Quarterly Forecasts |
| Q1: 2024-25 |
Q2: 2024-25 |
Q3: 2024-25 |
| Mean |
Median |
Max |
Min |
Mean |
Median |
Max |
Min |
Mean |
Median |
Max |
Min |
| 1 |
GDP at constant (2011-12) prices: Annual Growth (per cent) |
7.0 |
7.0 |
7.9 |
6.0 |
7.1 |
7.0 |
7.9 |
6.4 |
6.9 |
6.9 |
7.9 |
6.2 |
| a |
Private Final Consumption Expenditure (PFCE) at constant (2011-12) prices: Annual Growth (per cent) |
5.5 |
5.5 |
8.0 |
3.1 |
6.3 |
6.0 |
9.3 |
4.1 |
5.8 |
6.0 |
8.5 |
3.3 |
| b |
Gross Fixed Capital Formation (GFCF) at constant (2011-12) prices: Annual Growth (per cent) |
7.1 |
7.5 |
11.0 |
3.6 |
7.3 |
7.5 |
10.0 |
3.6 |
8.0 |
8.0 |
13.0 |
4.0 |
| 2 |
Private Final Consumption Expenditure (PFCE) at current prices: Annual Growth (per cent) |
9.7 |
10.1 |
13.4 |
4.0 |
9.5 |
9.9 |
14.2 |
4.3 |
9.5 |
9.8 |
14.2 |
4.5 |
| 3 |
Gross Fixed Capital Formation (GFCF) Rate (per cent of GDP at current market prices) |
31.0 |
31.4 |
34.5 |
28.6 |
31.5 |
31.6 |
34.5 |
28.6 |
30.1 |
29.5 |
32.8 |
28.5 |
| 4 |
GVA at constant (2011-12) prices: Annual Growth (per cent) |
6.4 |
6.4 |
7.6 |
4.9 |
6.7 |
6.7 |
7.4 |
6.0 |
6.7 |
6.7 |
7.2 |
5.8 |
| a |
Agriculture & Allied Activities at constant (2011-12) prices: Annual Growth (per cent) |
3.2 |
3.1 |
6.6 |
1.0 |
3.7 |
3.5 |
5.9 |
1.4 |
4.1 |
4.0 |
9.5 |
1.0 |
| b |
Industry at constant (2011-12) prices: Annual Growth (per cent) |
6.8 |
6.8 |
9.0 |
4.1 |
6.5 |
6.7 |
8.1 |
3.9 |
6.8 |
6.9 |
8.1 |
5.2 |
| c |
Services at constant (2011-12) prices: Annual Growth (per cent) |
7.1 |
7.0 |
9.7 |
5.5 |
7.3 |
7.3 |
7.9 |
6.3 |
7.4 |
7.4 |
8.5 |
5.3 |
| 5 |
IIP (2011-12=100): Quarterly Average Growth (per cent) |
5.3 |
5.5 |
6.0 |
3.6 |
5.2 |
5.2 |
6.8 |
3.6 |
5.7 |
5.4 |
7.5 |
4.5 |
| 6 |
Merchandise Exports -BoP basis (in US$ bn.) |
110.1 |
110.2 |
123.0 |
93.8 |
113.0 |
113.6 |
124.0 |
95.4 |
114.1 |
114.2 |
122.4 |
104.5 |
| 7 |
Merchandise Imports -BoP basis (in US$ bn.) |
171.8 |
173.8 |
176.4 |
145.0 |
168.7 |
180.8 |
188.3 |
13.1 |
182.5 |
183.2 |
194.7 |
158.7 |
| 8 |
Rupee per US $ Exchange rate (end-period) |
- |
- |
- |
- |
83.4 |
83.5 |
84.5 |
81.0 |
83.2 |
83.5 |
85.0 |
78.5 |
| 9 |
Crude Oil (Indian basket) price (US $ per barrel) (end-period) |
- |
- |
- |
- |
84.7 |
85.0 |
97.0 |
78.0 |
84.4 |
85.0 |
105.0 |
74.0 |
| 10 |
Policy Repo Rate (end-period) |
- |
- |
- |
- |
6.49 |
6.50 |
6.50 |
6.25 |
6.32 |
6.25 |
6.50 |
5.75 |
| |
Key Macroeconomic Indicators |
Quarterly Forecasts |
| Q4: 2024-25 |
Q1: 2025-26 |
| Mean |
Median |
Max |
Min |
Mean |
Median |
Max |
Min |
| 1 |
GDP at constant (2011-12) prices: Annual Growth (per cent) |
6.9 |
7.0 |
7.7 |
5.4 |
6.9 |
6.8 |
8.1 |
6.4 |
| a |
Private Final Consumption Expenditure (PFCE) at constant (2011-12) prices: Annual Growth (per cent) |
6.3 |
6.1 |
8.5 |
4.0 |
6.2 |
6.5 |
8.1 |
4.1 |
| b |
Gross Fixed Capital Formation (GFCF) at constant (2011-12) prices: Annual Growth (per cent) |
7.7 |
7.6 |
14.1 |
3.5 |
8.2 |
8.0 |
12.8 |
5.2 |
| 2 |
Private Final Consumption Expenditure (PFCE) at current prices: Annual Growth (per cent) |
9.5 |
9.6 |
13.0 |
4.0 |
9.6 |
10.1 |
11.8 |
4.1 |
| 3 |
Gross Fixed Capital Formation (GFCF) Rate (per cent of GDP at current market prices) |
31.6 |
31.9 |
33.5 |
28.8 |
31.7 |
32.1 |
32.8 |
29.7 |
| 4 |
GVA at constant (2011-12) prices: Annual Growth (per cent) |
6.6 |
6.5 |
7.5 |
5.7 |
6.6 |
6.6 |
7.9 |
5.9 |
| a |
Agriculture & Allied Activities at constant (2011-12) prices: Annual Growth (per cent) |
3.8 |
4.0 |
8.0 |
0.5 |
3.2 |
3.4 |
5.0 |
1.1 |
| b |
Industry at constant (2011-12) prices: Annual Growth (per cent) |
6.6 |
6.8 |
8.8 |
1.9 |
6.3 |
6.1 |
9.0 |
5.4 |
| c |
Services at constant (2011-12) prices: Annual Growth (per cent) |
7.2 |
7.3 |
8.4 |
6.1 |
7.2 |
7.0 |
8.0 |
6.3 |
| 5 |
IIP (2011-12=100): Quarterly Average Growth (per cent) |
5.5 |
5.5 |
6.7 |
4.5 |
5.2 |
5.1 |
6.8 |
3.8 |
| 6 |
Merchandise Exports -BoP basis (in US$ bn.) |
121.3 |
123.3 |
132.3 |
98.5 |
116.4 |
117.9 |
124.0 |
102.8 |
| 7 |
Merchandise Imports -BoP basis (in US$ bn.) |
181.5 |
183.2 |
193.5 |
153.5 |
180.8 |
182.5 |
190.0 |
167.1 |
| 8 |
Rupee per US $ Exchange rate (end-period) |
83.2 |
83.2 |
85.5 |
78.0 |
83.1 |
83.4 |
86.0 |
78.0 |
| 9 |
Crude Oil (Indian basket) price (US $ per barrel) (end-period) |
82.9 |
83.7 |
106.0 |
65.0 |
82.8 |
85.0 |
102.0 |
60.0 |
| 10 |
Policy Repo Rate (end-period) |
6.17 |
6.25 |
6.50 |
5.75 |
5.98 |
6.00 |
6.50 |
5.75 |
| Annex 4: Forecasts of CPI Combined Inflation |
| (per cent) |
| |
CPI Combined (General) |
CPI Combined excluding Food and Beverages, Pan, Tobacco and Intoxicants and Fuel and Light |
| Mean |
Median |
Max |
Min |
Mean |
Median |
Max |
Min |
| Q2:2024-25 |
4.1 |
4.0 |
5.6 |
3.2 |
3.6 |
3.5 |
4.6 |
3.1 |
| Q3:2024-25 |
4.8 |
4.7 |
5.4 |
4.1 |
4.0 |
4.0 |
5.0 |
3.2 |
| Q4:2024-25 |
4.6 |
4.6 |
5.5 |
3.7 |
4.3 |
4.3 |
5.9 |
3.1 |
| Q1:2025-26 |
4.7 |
4.7 |
5.2 |
4.0 |
4.3 |
4.5 |
4.9 |
3.2 |
| Annex 5: Forecasts of WPI Inflation |
| (per cent) |
| |
WPI All Commodities |
WPI Non-food Manufactured Products |
| Mean |
Median |
Max |
Min |
Mean |
Median |
Max |
Min |
| Q2:2024-25 |
2.3 |
2.4 |
3.8 |
0.3 |
1.6 |
1.5 |
4.0 |
-0.4 |
| Q3:2024-25 |
3.1 |
3.3 |
4.8 |
0.8 |
2.3 |
2.1 |
4.1 |
0.4 |
| Q4:2024-25 |
3.8 |
3.9 |
6.4 |
0.2 |
3.2 |
3.4 |
4.6 |
0.5 |
| Q1:2025-26 |
3.3 |
3.6 |
5.2 |
0.8 |
2.9 |
3.4 |
4.5 |
0.5 |
| Annex 6: Mean probabilities attached to possible outcomes of Real GDP growth |
| Growth Range |
Forecasts for 2024-25 |
Forecasts for 2025-26 |
| 12.0 per cent or more |
0.00 |
0.00 |
| 11.5 to 11.9 per cent |
0.00 |
0.00 |
| 11.0 to 11.4 per cent |
0.00 |
0.00 |
| 10.5 to 10.9 per cent |
0.00 |
0.00 |
| 10.0 to 10.4 per cent |
0.00 |
0.00 |
| 9.5 to 9.9 per cent |
0.00 |
0.00 |
| 9.0 to 9.4 per cent |
0.00 |
0.00 |
| 8.5 to 8.9 per cent |
0.00 |
0.00 |
| 8.0 to 8.4 per cent |
0.01 |
0.03 |
| 7.5 to 7.9 per cent |
0.07 |
0.07 |
| 7.0 to 7.4 per cent |
0.43 |
0.29 |
| 6.5 to 6.9 per cent |
0.35 |
0.39 |
| 6.0 to 6.4 per cent |
0.10 |
0.15 |
| 5.5 to 5.9 per cent |
0.03 |
0.05 |
| 5.0 to 5.4 per cent |
0.01 |
0.01 |
| 4.5 to 4.9 per cent |
0.00 |
0.01 |
| 4.0 to 4.4 per cent |
0.00 |
0.00 |
| 3.5 to 3.9 per cent |
0.00 |
0.00 |
| 3.0 to 3.4 per cent |
0.00 |
0.00 |
| 2.5 to 2.9 per cent |
0.00 |
0.00 |
| 2.0 to 2.4 per cent |
0.00 |
0.00 |
| 1.5 to 1.9 per cent |
0.00 |
0.00 |
| 1.0 to 1.4 per cent |
0.00 |
0.00 |
| 0.5 to 0.9 per cent |
0.00 |
0.00 |
| 0.0 to 0.4 per cent |
0.00 |
0.00 |
| below 0.0 per cent |
0.00 |
0.00 |
| Note: The sum of the probabilities may not add up to one due to rounding off. |
| Annex 7: Mean probabilities attached to possible outcomes of CPI (Combined) inflation |
| Inflation Range |
Forecasts for Q2:2024-25 |
Forecasts for Q3:2024-25 |
Forecasts for Q4:2024-25 |
Forecasts for Q1:2025-26 |
| 9.0 per cent or above |
0.00 |
0.00 |
0.00 |
0.00 |
| 8.5 to 9.0 per cent |
0.00 |
0.00 |
0.00 |
0.00 |
| 8.0 to 8.4 per cent |
0.00 |
0.00 |
0.00 |
0.00 |
| 7.5 to 7.9 per cent |
0.00 |
0.00 |
0.00 |
0.00 |
| 7.0 to 7.4 per cent |
0.00 |
0.00 |
0.00 |
0.00 |
| 6.5 to 6.9 per cent |
0.00 |
0.00 |
0.00 |
0.01 |
| 6.0 to 6.4 per cent |
0.01 |
0.01 |
0.01 |
0.01 |
| 5.5 to 5.9 per cent |
0.03 |
0.05 |
0.06 |
0.08 |
| 5.0 to 5.4 per cent |
0.06 |
0.19 |
0.21 |
0.28 |
| 4.5 to 4.9 per cent |
0.20 |
0.44 |
0.47 |
0.39 |
| 4.0 to 4.4 per cent |
0.31 |
0.23 |
0.22 |
0.19 |
| 3.5 to 3.9 per cent |
0.31 |
0.07 |
0.03 |
0.02 |
| 3.0 to 3.4 per cent |
0.07 |
0.01 |
0.00 |
0.01 |
| 2.5 to 2.9 per cent |
0.01 |
0.00 |
0.00 |
0.00 |
| 2.0 to 2.4 per cent |
0.00 |
0.00 |
0.00 |
0.00 |
| 1.5 to 1.9 per cent |
0.00 |
0.00 |
0.00 |
0.00 |
| 1.0 to 1.4 per cent |
0.00 |
0.00 |
0.00 |
0.00 |
| 0.5 to 0.9 per cent |
0.00 |
0.00 |
0.00 |
0.00 |
| 0.0 to 0.4 per cent |
0.00 |
0.00 |
0.00 |
0.00 |
| -0.5 to -0.1 per cent |
0.00 |
0.00 |
0.00 |
0.00 |
| -1.0 to -0.6 per cent |
0.00 |
0.00 |
0.00 |
0.00 |
| Below -1.0 per cent |
0.00 |
0.00 |
0.00 |
0.00 |
| Note: The sum of the probabilities may not add up to one due to rounding off. |
Note: CPI: Consumer Price Index; GDP: Gross Domestic Products; GFCF: Gross Fixed Capital Formation; GVA: Gross Value Added; IIP: Index of Industrial Production; PFCE: Private Final Consumption Expenditure; WPI: Wholesale Price Index.
|
 IST,
IST,