 IST,
IST,
V. Financial Markets
International Financial Markets
During the second quarter of 2006-07, short-term interest rates increased further
in major advanced economies, excepting the US, as central banks raised their
policy rates to ward off inflationary pressures stemming from higher international
crude oil and other commodity prices in an environment of strong domestic demand
(Table 33). The European Central Bank increased its policy rate by 25 basis
points each on August 3, 2006 and October 5, 2006, while the UK raised its policy
rate by 25 basis points on August 3, 2006. After maintaining zero interest rates
for an extended period, the Bank of Japan on July 14, 2006 increased the uncollateralised
overnight call rate (adopted as the operating target for monetary policy since
March 2006) by 25 basis points. Other advanced economies such as Australia and
Switzerland also increased their policy rates during the quarter. Short-term
rates in the US, on the other hand, eased as the Federal Open Market Committee
has kept its fed funds rate unchanged in each of its three meetings held since
end-June 2006. Among emerging market economies (EMEs), short-term interest rates
increased in South Korea as the central bank raised policy rate. Short-term
rates in other economies such as Brazil, Malaysia and Philippines declined as
their central banks cut their rates or kept them unchanged.
In contrast to the mixed trend in short-term rates, long-term Government bond yields in major advanced economies eased during the quarter ended September 2006.
|
Table 33 : Short-term Interest Rates |
|||||||
|
(Per cent) |
|||||||
|
Region/Country |
At end of |
||||||
|
March |
2005 |
March 2006 |
June 2006 |
September 2006 |
October 2006 @ |
||
|
1 |
2 |
3 |
4 |
5 |
6 |
||
|
Advanced Economies |
|||||||
|
Euro Area |
2.15 |
2.80 |
3.06 |
3.38 |
3.51 |
||
|
Japan |
0.02 |
0.04 |
0.24 |
0.34 |
0.34 |
||
|
Sweden |
1.97 |
1.99 |
2.23 |
2.55 |
2.56 |
||
|
UK |
4.95 |
4.58 |
4.70 |
5.02 |
5.08 |
||
|
US |
2.90 |
4.77 |
5.48 |
5.21 |
5.24 |
||
|
Emerging Market Economies |
|||||||
|
Argentina |
4.56 |
9.63 |
10.00 |
10.38 |
10.13 |
||
|
Brazil |
19.25 |
16.54 |
15.18 |
14.17 |
14.16 |
||
|
China |
2.25 |
2.40 |
3.00 |
2.95 |
3.00 |
||
|
Hong Kong |
2.79 |
4.47 |
4.67 |
4.20 |
4.18 |
||
|
India |
5.37 |
6.11 |
6.36 |
6.60 |
6.65 |
||
|
Malaysia |
2.82 |
3.51 |
3.93 |
3.85 |
3.80 |
||
|
Philippines |
7.25 |
7.38 |
8.00 |
7.63 |
7.75 |
||
|
Singapore |
2.06 |
3.44 |
3.50 |
3.44 |
3.50 |
||
|
South Korea |
3.54 |
4.26 |
4.57 |
4.63 |
4.61 |
||
|
Thailand |
2.64 |
5.10 |
5.40 |
5.40 |
5.30 |
||
|
@ : As on October 18, 2006. |
|||||||
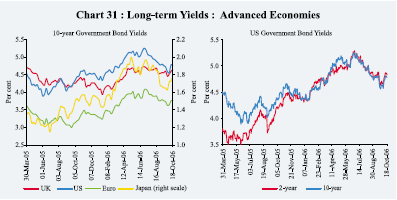
The yields, which had hardened during the quarter ended June 2006, fell on the back of easing of crude oil prices, signs of weakening of economic growth in the US and pause in monetary tightening in the US (Chart 31). Between end-June 2006 and end-September 2006, 10-year yields declined by 66 basis points in the US, 42 basis points in the euro area and 30 basis points in Japan. Since early June 2006, 10-year US bond yields have generally remained below those on 2-year bonds. Spreads on sovereign EME bonds, which had widened during May-June 2006 reflecting repricing of risks, eased during July-August 2006, back to low levels prevailing during April 2006.
Global equity markets during the second quarter of 2006-07 recovered part of the losses suffered during the broad sell-off between mid-May 2006 and early June 2006 (Chart 32). The MSCI World and MSCI emerging markets indices
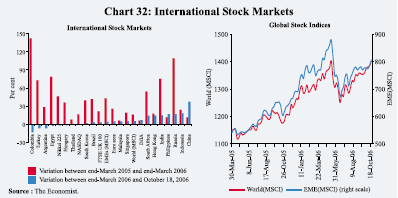
declined by 10.8 per cent and 23.4 per cent, respectively, between June 14, 2006 and their all-time highs on May 10, 2006; since then (up to October 18, 2006), these indices have gained 12.1 per cent and 19.7 per cent, respectively. Strong corporate results, better than expected growth in the euro area, declining bond yields and pause by the US Federal Reserve provided support to the equity markets during the second quarter of 2006-07.
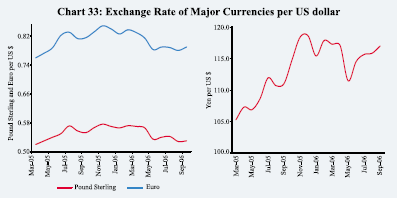
In the foreign exchange market, the US dollar depreciated by 1.9 per cent against the Pound sterling and remained broadly unchanged against the euro during the second quarter of 2006-07 (Chart 33). It, however, appreciated by 2.2 per cent against the Japanese yen during the quarter.
Domestic Financial Markets
Indian financial markets remained largely orderly during the second quarter
of 2006-07. Call money rates remained generally close to the reverse repo rate
except in the last fortnight of September 2006. Interest rates in the collateralised
segment of the overnight money market, the dominant segment in the money market,
remained below the reverse repo rate as well as the call rate during July-August
2006. In the foreign exchange market, the Indian rupee exhibited two-way movement.
Yields in the Government securities market softened from mid-July 2006 mirroring
trends in the overseas markets and developments such as sharp fall in crude
oil prices. The release of market borrowings calendar for the second half of
2006-07 was essentially in line with market expectations. In the credit market,
deposit and lending rates edged up during the quarter as credit demand remained
strong. The stock markets recovered the losses suffered in the global turmoil
of May-June 2006. The primary market segment of the equity market witnessed
moderation in resources raised during July-September 2006 (Table 34).
|
Table 34: Domestic Financial Markets at a Glance |
|||||||||||||||
|
Month |
Call Money |
Government |
Foreign Exchange |
Liquidity |
Equity |
||||||||||
|
Securities |
Management |
||||||||||||||
|
Average |
Average |
Average |
Average |
Average |
Average |
RBI’s net |
Average |
Average |
Average |
Average |
Average |
Average |
Average |
||
|
Daily |
Call |
Turnover |
10-Year |
Daily |
Exchange |
Foreign |
Forward |
MSS |
Daily |
Daily |
Daily |
BSE |
S&P |
||
|
Turnover |
Rates* |
in Govt. |
Yield@ |
Inter- |
Rate |
Currency |
Premia |
Out- |
Reverse |
BSE |
NSE |
Sensex** |
CNX |
||
|
(Rs. |
(Per |
Securities |
(Per |
bank |
(Rs. per |
Sales(-)/ |
3-month |
standing# |
Repo |
Turnover |
Turnover |
Nifty** |
|||
|
crore) |
cent) |
(Rs. |
cent) |
Turnover |
US $) |
Purchases |
(Per |
(Rs. |
(LAF) |
(Rs. |
(Rs. |
||||
|
crore)+ |
(US $ |
(+) |
cent) |
crore) |
Out- |
crore) |
crore) |
||||||||
|
million) |
(US $ |
standing |
|||||||||||||
|
million) |
(Rs. |
||||||||||||||
|
crore) |
|||||||||||||||
|
1 |
2 |
3 |
4 |
5 |
6 |
7 |
8 |
9 |
10 |
11 |
12 |
13 |
14 |
15 |
|
|
2004-05 |
14,170 |
4.65 |
4,826 |
6.22 |
8,892 |
44.93 |
20,847 £ |
1.66 |
46,445 |
35,592 |
2,050 |
4,506 |
5741 |
1805 |
|
|
2005-06 |
17,979 |
5.60 |
3,643 |
7.12 |
12,738 |
44.27 |
8,143 £ |
1.60 |
58,792 |
10,986 |
3,248 |
6,256 |
8295 |
2518 |
|
|
April |
17,213 |
4.77 |
3,001 |
7.02 |
9,880 |
43.74 |
0 |
1.96 |
65,638 |
30,675 |
1,890 |
4,136 |
6379 |
1987 |
|
|
May |
15,269 |
4.99 |
3,805 |
7.11 |
10,083 |
43.49 |
0 |
1.57 |
68,539 |
22,754 |
1,971 |
3,946 |
6483 |
2002 |
|
|
June |
20,134 |
5.10 |
6,807 |
6.88 |
10,871 |
43.58 |
-104 |
1.40 |
70,651 |
13,916 |
2,543 |
4,843 |
6926 |
2134 |
|
|
July |
20,046 |
5.02 |
3,698 |
7.13 |
11,003 |
43.54 |
2,473 |
1.56 |
70,758 |
10,754 |
3,095 |
6,150 |
7337 |
2237 |
|
|
August |
16,158 |
5.02 |
4,239 |
7.04 |
11,749 |
43.62 |
1,552 |
0.69 |
71,346 |
34,832 |
3,452 |
6,624 |
7726 |
2358 |
|
|
September |
16,292 |
5.05 |
5,207 |
7.04 |
11,040 |
43.92 |
0 |
0.62 |
67,617 |
30,815 |
3,871 |
6,923 |
8272 |
2512 |
|
|
October |
17,164 |
5.12 |
2,815 |
7.14 |
13,087 |
44.82 |
0 |
0.69 |
68,602 |
18,608 |
2,955 |
6,040 |
8220 |
2487 |
|
|
November |
22,620 |
5.79 |
3,314 |
7.10 |
11,228 |
45.73 |
0 |
0.67 |
67,041 |
3,268 |
2,635 |
5,480 |
8552 |
2575 |
|
|
December |
21,149 |
6.00 |
2,948 |
7.13 |
13,808 |
45.64 |
-6,541 |
1.51 |
52,040 |
1,452 |
3,516 |
6,814 |
9162 |
2773 |
|
|
January |
17,911 |
6.83 |
3,094 |
7.15 |
16,713 |
44.40 |
0 |
2.60 |
40,219 |
-15,386 |
3,966 |
7,472 |
9540 |
2893 |
|
|
February |
13,497 |
6.95 |
2,584 |
7.32 |
15,798 |
44.33 |
2,614 |
2.85 |
33,405 |
-13,532 |
3,688 |
7,125 |
10090 |
3019 |
|
|
March |
18,290 |
6.58 |
2,203 |
7.40 |
17,600 |
44.48 |
8,149 |
3.11 |
29,652 |
-6,319 |
5,398 |
9,518 |
10857 |
3236 |
|
|
2006-07 |
|||||||||||||||
|
April |
16,909 |
5.62 |
3,685 |
7.45 |
20,837 |
44.95 |
4,305 |
1.31 |
25,709 |
46,088 |
4,860 |
9,854 |
11742 |
3494 |
|
|
May |
18,074 |
5.54 |
3,550 |
7.58 |
20,174 |
45.41 |
504 |
0.87 |
26,457 |
59,505 |
4,355 |
9,155 |
11599 |
3437 |
|
|
June |
17,425 |
5.73 |
2,258 |
7.86 |
15,310 |
46.06 |
0 |
0.73 |
31,845 |
48,610 |
3,261 |
6,828 |
9935 |
2915 |
|
|
July |
18,254 |
5.86 |
2,243 |
8.26 |
14,086 P |
46.46 |
0 |
0.83 |
36,936 |
48,027 |
2,605 |
5,652 |
10557 |
3092 |
|
|
August |
21,294 |
6.06 |
5,786 |
8.09 |
15,630 P |
46.54 |
0 |
1.22 |
40,305 |
36,326 |
2,869 |
5,945 |
11305 |
3306 |
|
|
September |
23,665 |
6.33 |
8,306 |
7.76 |
17,837 P |
46.12 |
– |
1.31 |
40,018 |
25,862 |
3,411 |
6,873 |
12036 |
3492 |
|
|
* : Average of daily weighted call money borrowing rates. + : Average of daily outright turnover in Central Government dated securities. |
|||||||||||||||
Money Market
Money market conditions remained largely comfortable during the second quarter
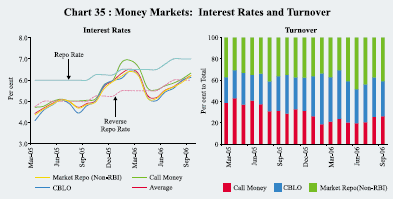
of 2006-07. Call money rates which had edged up during the second half of 2005-06
eased during early April 2006 and, up to mid-September 2006, generally remained
close to the reverse repo rate, the lower band of the LAF corridor, reflecting
comfortable liquidity conditions. With the increase in the fixed reverse repo
rate by 25 basis points effective July 25, 2006, call rates also edged up by
a similar magnitude (Chart 34). The call money rate increased during the second
half of September 2006 on account of liquidity pressures emanating from advance
tax outflows and festival season currency demand amidst high credit demand.
Call rates hovered around 6.5 per cent in the last week of September 2006 and
increased to 7.38 per cent on September 29, 2006 but eased to 6.55 per cent
as on October 3, 2006. The call rates again edged
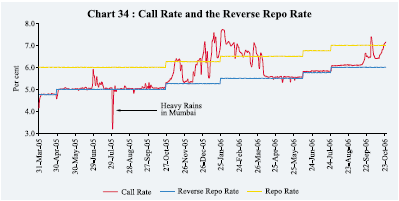
higher from mid-October 2006 and were 7.15 per cent as on October 23, 2006, 51 basis points higher than that at end-March 2006.
The interest rates in the collateralised segments of the money market –the market repo (outside the LAF) and the Collateralised Borrowing and Lending Obligation (CBLO) segments – continued to remain below the call rate during July-August 2006. The interest rates averaged 5.56 per cent and 5.60 per cent in the CBLO and market repo segments, respectively, during April-September 2006 as compared with 5.86 per cent in the call money market. The collateralised market is now the predominant segment in the money market, with a share of more than 70 per cent during 2006-07 so far (Chart 35 and Table 35). Mutual
|
Table 35: Activity in Money Market Segments |
|||||||
|
(Rupees crore) |
|||||||
|
Certificates |
|||||||
|
Average Daily Turnover # |
Commercial Paper |
||||||
|
of Deposit |
|||||||
|
Outstanding |
|||||||
|
Month |
Call Money |
Repo |
Collateralised |
Term |
Outstanding |
Amount |
|
|
Market |
Market |
Borrowing and |
Money |
Issued |
|||
|
(outside the |
Lending Obligation |
Market |
|||||
|
LAF) |
(CBLO) |
||||||
|
1 |
2 |
3 |
4 |
5 |
6 |
7 |
8 |
|
2004-05 ^ |
14,170 |
17,135 |
6,697 |
526 |
11,723 |
1,090 |
6,052 |
|
2005-06 ^ |
17,979 |
21,183 |
20,039 |
833 |
17,285 |
3,140 |
27,298 |
|
April |
17,213 |
12,174 |
10,370 |
661 |
15,598 |
3,549 |
16,602 |
|
May |
15,269 |
13,688 |
12,233 |
545 |
17,182 |
3,824 |
17,689 |
|
June |
20,134 |
17,163 |
11,792 |
534 |
17,797 |
2,925 |
19,270 |
|
July |
20,046 |
18,103 |
15,292 |
717 |
18,607 |
3,360 |
20,768 |
|
August |
16,158 |
21,325 |
14,544 |
754 |
19,508 |
4,110 |
23,568 |
|
September |
16,292 |
18,872 |
17,143 |
1,116 |
19,725 |
2,519 |
27,641 |
|
October |
17,164 |
20,980 |
21,763 |
734 |
18,726 |
2,892 |
29,193 |
|
November |
22,620 |
25,660 |
20,496 |
917 |
18,013 |
2,483 |
27,457 |
|
December |
21,149 |
25,574 |
21,265 |
775 |
17,234 |
4,104 |
32,806 |
|
January |
17,911 |
24,596 |
25,634 |
1,089 |
16,431 |
1,937 |
34,521 |
|
February |
13,497 |
24,096 |
34,162 |
813 |
15,876 |
3,160 |
34,487 |
|
March |
18,290 |
31,964 |
35,775 |
1,338 |
12,718 |
2,813 |
43,568 |
|
2006-07 |
|||||||
|
April |
16,909 |
21,914 |
32,657 |
894 |
16,550 |
6,065 |
44,059 |
|
May |
18,074 |
36,107 |
34,293 |
945 |
17,067 |
4,701 |
50,228 |
|
June |
17,425 |
42,250 |
27,617 |
1,256 |
19,650 |
4,981 |
56,390 |
|
July |
18,254 |
38,684 |
31,340 |
864 |
21,110 |
5,812 |
59,167 |
|
August |
21,294 |
31,056 |
31,178 |
1,020 |
22,854 |
6,460 |
65,621 |
|
September |
23,665 |
36,740 |
29,541 |
1,135 |
24,419 |
5,220 |
63,864 @ |
|
# : Turnover is twice the single leg volumes in case of call money and CBLO to capture borrowing and lending both, |
|||||||
funds, insurance companies and financial institutions are the major lenders in the CBLO market with nationalised banks being the major borrowers. In the market repo segment, mutual funds are the major provider of funds, while the foreign banks, private sector banks and primary dealers are the major borrowers.
Certificates of Deposit
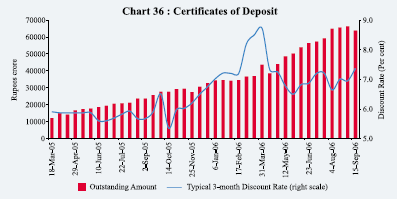
Demand for certificates of deposit (CDs) remained strong during the second quarter
of 2006-07 as banks continued to supplement their efforts at deposit mobilisation
to support sustained credit demand (Chart 36). The amount of outstanding CDs
increased from Rs.56,390 crore at end-June 2006 (4.3 per cent of aggregate deposits
of issuing banks) to Rs. 63,864 crore (4.3 per cent) by September 15, 2006.
The typical discount rate for ‘3 months to 179 days’ maturity CDs was 7.37 per
cent as on September 15, 2006 as compared with 6.87 per cent at end-June 2006.
Some of the private and public sector banks are increasingly taking the CD route
to meet the resource gap.
Commercial Paper
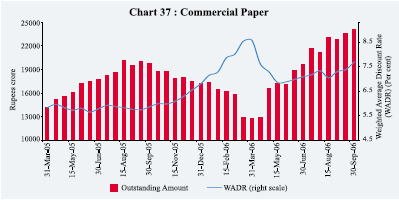
The total outstanding amount of commercial papers (CPs) issued increased from
Rs.19,650 crore as on June 30, 2006 to Rs.24,419 crore as on September 30, 2006
(Chart 37). The weighted average discount rate (WADR) on CPs increased from
7.10 per cent on June 30, 2006 to 7.70 per cent as at end-September 2006 in
tandem with the increase in the money market rates. Yields on CP issuances during
the quarter were in the range of 7.15-8.00 per cent for issuances in the ‘3-6
month’ tenor and 7.55-8.60 per cent in the ‘6 month to 1 year’ tenor.
|
Table 36: Commercial Paper – Major Issuers |
||||
|
(Rupees crore) |
||||
|
Category of Issuer |
End of |
|||
|
March 2005 |
March 2006 |
June 2006 |
September 2006 |
|
|
1 |
2 |
3 |
4 |
5 |
|
Leasing and Finance |
8,479 |
9,400 |
13,460 |
15,792 |
|
(59.6) |
(73.9) |
(68.5) |
(64.6) |
|
|
Manufacturing |
2,881 |
1,982 |
4,155 |
4,847 |
|
(20.2) |
(15.6) |
(21.1) |
(19.9) |
|
|
Financial Institutions |
2,875 |
1,336 |
2,035 |
3,780 |
|
(20.2) |
(10.5) |
(10.4) |
(15.5) |
|
|
Total |
14,235 |
12,718 |
19,650 |
24,419 |
|
(100.0) |
(100.0) |
(100.0) |
(100.0) |
|
|
Note : Figures in parentheses are percentage shares to the total. |
||||
Leasing and finance companies remained the pre-dominant issuers of CPs, reflecting the withdrawal of the access of these companies to public deposits (Table 36). Issuances by financial institutions and manufacturing companies also recorded an increase during the second quarter.
Treasury Bills
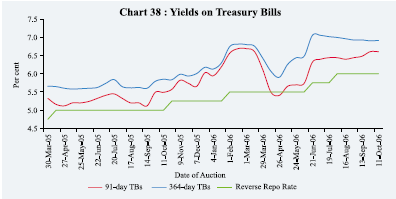
The primary market yields on 91-day Treasury Bills (TBs) increased from their
end-June 2006 levels while yields on 364-day TBs exhibited modest softening
during the quarter (Chart 38). As a result, the yield spread between 364-day
and 91-day TBs which had widened to 63 basis points in June 2006 narrowed to
29 basis points in October 2006 (up to October 18) (Table 37). All the issues
during
|
Table 37: Treasury Bills in the Primary Market |
|||||||
|
Month |
Notified |
Average Implicit Yield at |
Average Bid-Cover Ratio |
||||
|
Amount |
Minimum Cut-off Price (Per cent) |
||||||
|
(Rupees |
|||||||
|
crore) |
91-day |
182-day |
364-day |
91-day |
182-day |
364-day |
|
|
1 |
2 |
3 |
4 |
5 |
6 |
7 |
8 |
|
2004-05^ |
1,38,500 @ |
4.91 |
– |
5.16 |
2.43 |
– |
2.52 |
|
2005-06^ |
1,55,500 @ |
5.68 |
5.82 |
5.96 |
2.64 |
2.65 |
2.45 |
|
April |
19,000 |
5.17 |
5.36 |
5.62 |
4.03 |
4.48 |
2.54 |
|
May |
15,000 |
5.19 |
5.35 |
5.58 |
3.30 |
3.37 |
2.29 |
|
June |
18,500 |
5.29 |
5.37 |
5.61 |
1.54 |
2.42 |
1.81 |
|
July |
11,500 |
5.46 |
5.67 |
5.81 |
1.21 |
1.79 |
1.68 |
|
August |
21,000 |
5.23 |
5.42 |
5.63 |
3.07 |
2.68 |
2.54 |
|
September |
23,000 |
5.24 |
5.37 |
5.70 |
1.52 |
1.45 |
1.61 |
|
October |
15,000 |
5.50 |
5.71 |
5.84 |
1.69 |
1.53 |
3.44 |
|
November |
11,000 |
5.76 |
5.85 |
5.96 |
2.12 |
1.92 |
2.30 |
|
December |
5,000 |
5.89 |
6.00 |
6.09 |
3.07 |
2.97 |
2.36 |
|
January |
5,000 |
6.25 |
6.22 |
6.21 |
2.86 |
2.83 |
2.72 |
|
February |
5,000 |
6.63 |
6.74 |
6.78 |
3.04 |
2.07 |
2.71 |
|
March |
6,500 |
6.51 |
6.66 |
6.66 |
4.17 |
3.43 |
3.36 |
|
2006-07 |
|||||||
|
April |
5,000 |
5.52 |
5.87 |
5.98 |
5.57 |
4.96 |
2.02 |
|
May |
18,500 |
5.70 |
6.07 |
6.34 |
1.88 |
1.84 |
1.69 |
|
June |
15,000 |
6.14 |
6.64 |
6.77 |
1.63 |
1.35 |
2.11 |
|
July |
15,000 |
6.42 |
6.75 |
7.03 |
1.82 |
1.55 |
3.12 |
|
August |
19,000 |
6.41 |
6.70 |
6.96 |
2.03 |
2.71 |
3.48 |
|
September |
15,000 |
6.51 |
6.76 |
6.91 |
1.35 |
1.80 |
2.92 |
|
October* |
11,000 |
6.62 |
6.84 |
6.91 |
1.33 |
1.20 |
2.34 |
|
^ : Data are monthly averages. @ : Total for the financial year. * : Up to October 18, 2006. |
|||||||
2006-07 so far have been fully subscribed by the market except for the issue of 91-day TBs in the auction held on September 20, 2006.
Foreign Exchange Market
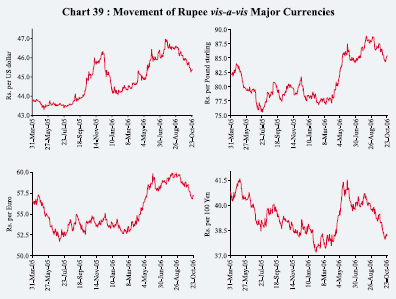
In the foreign exchange market, the Indian rupee exhibited two-way movement
during the quarter ended September 2006. The rupee came under pressure during
July 2006 due to high crude oil prices and geo-political risk in the Middle
East region. The rupee, however, appreciated from the last week of July 2006
on the back of FII inflows and easing of oil prices. The rupee has moved in
a range of Rs.44.61– 46.97 per US dollar during 2006-07 so far (up to October
23, 2006) (Chart 39). The exchange rate was Rs.45.40 per US dollar as on October
23, 2006 – a depreciation of 1.7 per cent over its level on March 31, 2006.
Over the same period, the rupee depreciated by 8.9 per cent against the Pound
sterling, 5.2 per cent against the euro and 0.5 per cent against the Japanese
yen.
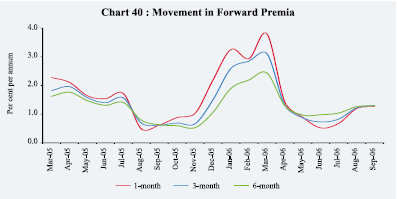
Forward premia increased during the second quarter of 2006-07 reflecting increase in domestic interest rates (Chart 40).
The turnover in the inter-bank as well as merchant segments of the foreign exchange market during the second quarter of 2006-07 was higher than in the corresponding period of 2005-06. While inter-bank turnover increased from
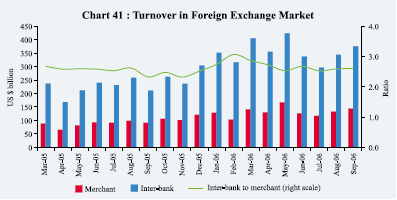
US $ 233 billion (monthly average) during the second quarter of 2005-06 to US $ 338 billion in the second quarter of 2006-07, the merchant turnover increased from US $ 94 billion to US $ 131 billion (Chart 41). The ratio of inter-bank to merchant turnover was 2.6 during the second quarter of 2006-07, almost the same as that of 2.5 a year ago.
Credit Market
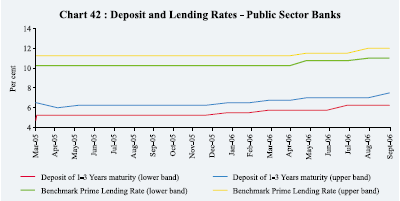
The public sector banks (PSBs) raised their interest rates for deposits of above
one year maturity from a range of 5.75-7.25 per cent at end-June 2006 to 6.25-8.00
per cent by mid-October 2006; the interest rates offered on deposits of maturity
up to one year also increased from a range of 2.75-6.50 per cent to 2.75-7.00
per cent over the same period (Table 38 and Chart 42). As regards foreign banks
and private sector banks, they increased the maximum rates offered on term deposits
of various maturities by 25-165 basis points while reducing the minimum rates
offered by 25-150 basis points. On the lending side, the PSBs and the private
sector banks increased their Benchmark Prime Lending Rates (BPLRs), while the
range of BPLRs of the foreign banks remained unchanged during the period. The
BPLRs of the public sector banks edged higher from a range of 10.75-11.50 per
cent at end-June 2006 to a range of 11.00-12.00 per cent by mid-October 2006.
The number of public sector banks with their BPLRs in the range of 11-12 per
cent increased from 21 at end-June 2006 to 26 by mid-October 2006. Private sector
banks increased their BPLRs from a range of 11.00-14.50 per cent in June 2006
to 11.50-15.00 per cent by mid-October 2006. The number of private sector banks
with their BPLRs in the
|
Table 38: Movements in Deposit and Lending Rates |
||||||||
|
(Per cent) |
||||||||
|
Interest Rate |
March |
March |
June |
July |
August |
September |
October@ |
|
|
2005 |
2006 |
2006 |
2006 |
2006 |
2006 |
2006 |
||
|
1 |
2 |
3 |
4 |
5 |
6 |
7 |
8 |
|
|
1. |
Domestic Deposit Rate |
|||||||
|
Public Sector Banks |
||||||||
|
Up to 1 year |
2.75-6.00 |
2.25-6.50 |
2.75-6.50 |
2.75-6.50 |
2.75-6.50 |
2.75-7.00 |
2.75-7.00 |
|
|
More than 1 year and up to 3 years |
4.75-6.50 |
5.75-6.75 |
5.75-7.00 |
6.25-7.00 |
6.25-7.00 |
6.25-7.50 |
6.25-7.50 |
|
|
More than 3 years |
5.25-7.00 |
6.00-7.25 |
6.00-7.25 |
6.25-7.25 |
6.25-7.50 |
6.50-8.00 |
6.50-8.00 |
|
|
Private Sector Banks |
||||||||
|
Up to 1 year |
3.00-6.25 |
3.50-7.25 |
3.50-6.75 |
3.00-7.00 |
3.00-7.00 |
3.00-7.25 |
3.00-8.00 |
|
|
More than 1 year and up to 3 years |
5.25-7.25 |
5.50-7.75 |
6.50-7.75 |
5.50-8.00 |
5.50-8.00 |
6.75-8.25 |
6.75-8.25 |
|
|
More than 3 years |
5.75-7.00 |
6.00-7.75 |
6.50-8.25 |
6.00-8.25 |
6.00-8.25 |
6.75-8.50 |
6.75-8.50 |
|
|
Foreign Banks |
||||||||
|
Up to 1 year |
3.00-6.25 |
3.00-6.15 |
3.25-6.50 |
3.00-6.75 |
3.00-6.75 |
3.00-7.50 |
3.00-7.50 |
|
|
More than 1 year and up to 3 years |
3.50-6.50 |
4.00-6.50 |
5.00-6.50 |
4.00-7.00 |
4.00-7.00 |
3.50-8.15 |
3.50-8.15 |
|
|
More than 3 years |
3.50-7.00 |
5.50-6.50 |
5.50-6.75 |
4.00-7.00 |
4.00-7.00 |
4.00-8.25 |
4.00-8.25 |
|
|
2. |
Benchmark Prime Lending Rate |
|||||||
|
Public Sector Banks |
10.25-11.25 |
10.25-11.25 |
10.75-11.50 |
10.75-11.50 |
11.00-12.00 |
11.00-12.00 |
11.00-12.00 |
|
|
Private Sector Banks |
11.00-13.50 |
11.00-14.00 |
11.00-14.50 |
11.00-15.00 |
11.50-15.00 |
11.50-15.00 |
11.50-15.00 |
|
|
Foreign Banks |
10.00-14.50 |
10.00-14.50 |
10.00-14.50 |
10.00-14.50 |
10.00-14.50 |
10.00-14.50 |
10.00-14.50 |
|
|
3. |
Actual Lending Rate* |
|||||||
|
Public Sector Banks |
2.75-16.00 |
4.00-16.50 |
4.00-16.50 |
– |
– |
– |
– |
|
|
Private Sector Banks |
3.15-22.00 |
3.15-20.50 |
3.15-26.00 |
– |
– |
– |
– |
|
|
Foreign Banks |
3.55-23.50 |
4.75-26.00 |
4.75-25.00 |
– |
– |
– |
– |
|
|
* : Interest rate on non-export demand and term loans above Rs.2 lakh excluding lending rates at the |
||||||||
range of 13-15 per cent increased from two at end-June 2006 to five by mid-October 2006 while those in the range of 11-12 per cent fell from 16 to 10.
Government Securities Market
The yields in the Government securities market eased during the second quarter
of 2006-07, reversing the hardening trend witnessed in the first quarter. After
recording some decline around mid-April 2006, yields had moved upwards till
mid-July 2006 reflecting a variety of factors such as further monetary policy
tightening in the US and in other economies, high and volatile crude oil prices,
apprehensions over domestic fuel price hike, expected issuance of oil bonds,
higher Government expenditure, volatility in stock markets, devolvement of auction
held on July 11, 2006 on the primary dealers and hike in the reverse repo and
repo rates by 25 basis points effective June 9, 2006. Reflecting these factors,
10-year yields reached 8.41 per cent on July 10, 2006, an increase of 89 basis
points over end-March 2006. Since mid-July 2006, the yields have softened, especially
since August. Easing of Government bond yields in the US, the Fed’s decision
to keep the fed funds rate unchanged in each of its meetings since end-June
2006 and easing of crude oil prices contributed to softening of domestic yields.
The announcement of the borrowing calendar of the Central Government was in
accordance with market expectations. On the whole, the 10-year yield has increased
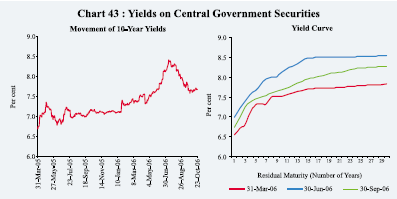
by 16 basis points during 2006-07 so far: from 7.52 per cent as on March 31,
2006 to 7.68 per cent as on October 23, 2006 (Chart 43). The spread between
1-10 year yields narrowed from 113 basis points at end-June 2006 to 94 basis
points at end-September 2006 (comparable to that of 98 basis points at end-March
2006). The spread between 10-year and 30-year yields, however, increased to
61 basis points from 30 basis points at end-March 2006.
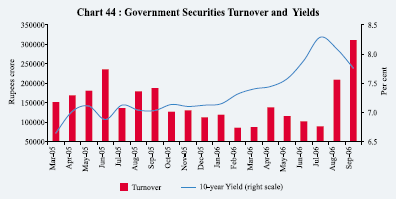
The turnover in Government securities largely remained subdued during April-July 2006 as banks preferred to hold securities, rather than trade, in an environment of hardening of yields (Chart 44). The turnover, however, increased sharply in August and September 2006 – the highest since June 2005 – as yields trended downwards.
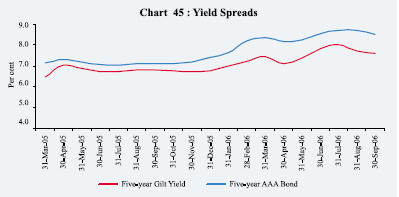
The yields on 5-year AAA-rated corporate bonds remained broadly unchanged during the second quarter of 2006-07, even as yields on Government securities exhibited some easing. The yield spread over 5-year Government securities was 91 basis points at end-September 2006, higher than that of 74 basis points at end-June 2006, but exactly the same (91 basis points) as at end-March 2006 (Chart 45).
Equity Market
Primary Market
Resources raised through the public issues segment increased by 51.6 per cent
during April-September 2006 over the corresponding period of 2005, even though
the number of issues came down from 55 to 50 (Table 39). Most of the amount
was, however, raised during April-May 2006 (Rs.10,390 crore out of Rs.12,770
crore). Following the volatility in stock market in May-June 2006, amounts raised
in the subsequent months have been low. The average size of public issues increased
from Rs.153 crore during April-September 2005 to Rs.255 crore during April-September
2006. All public issues during April-September 2006 were by non-Government public
limited companies (private sector) in the form of equity. Out of 50 issues during
April-September
|
Table 39: Mobilisation of Resources from the Primary Market |
||||||
|
(Amount in Rupees crore) |
||||||
|
Item |
No. of Issues |
Amount |
No. of Issues |
Amount |
||
|
1 |
2 |
3 |
4 |
5 |
||
|
2005-06 (April-September) |
2006-07 (April-September) P |
|||||
|
A. |
Prospectus and Rights Issues* |
|||||
|
1. |
Private Sector (a+b) |
52 |
5,903 |
50 |
12,770 |
|
|
a) Financial |
5 |
1,881 |
3 |
261 |
||
|
b) Non-financial |
47 |
4,022 |
47 |
12,509 |
||
|
2. |
Public Sector (a+b+c) |
3 |
2,520 |
– |
– |
|
|
a) Public Sector Undertakings |
– |
– |
– |
– |
||
|
b) Government Companies |
– |
– |
– |
– |
||
|
c) Banks/Financial Institutions |
3 |
2,520 |
– |
– |
||
|
3. |
Total (1+2) |
55 |
8,423 |
50 |
12,770 |
|
|
Of which: |
||||||
|
(i) Equity |
54 |
8,305 |
50 |
12,770 |
||
|
(ii) Debt |
1 |
118 |
– |
– |
||
|
2005-06 (April-June) P |
2006-07 (April-June) P |
|||||
|
B. |
Private Placement |
|||||
|
1. |
Private Sector |
241 |
12,171 |
301 |
14,211 |
|
|
a) Financial |
85 |
7,064 |
105 |
7,069 |
||
|
b) Non-financial |
156 |
5,107 |
196 |
7,142 |
||
|
2. |
Public Sector |
40 |
8,806 |
16 |
10,826 |
|
|
a) Financial |
30 |
4,996 |
15 |
9,991 |
||
|
b) Non-financial |
10 |
3,810 |
1 |
835 |
||
|
3. |
Total (1+2) |
281 |
20,977 |
317 |
25,037 |
|
|
Memo: |
||||||
|
Euro Issues $ |
17 |
3,828 |
29 |
7,917 |
||
|
P : Provisional. * : Excluding offers for sale. – : Nil/Negligible. |
||||||
2006, 27 issues were initial public offerings (IPOs), constituting 90.0 per cent of resource mobilisation, while during the corresponding period of 2005, 26 out of 55 issues were IPOs (constituting 79.6 per cent of resource mobilisation).
Mobilisation of resources through private placement increased by 19.4 per cent during April-June 2006 as compared with an increase of 79.8 per cent during April-June 2005 (Table 39). Public sector entities accounted for 43.2 per cent of total mobilisation during April-June 2006, marginally higher than the corresponding period of the previous year (42.0 per cent). Financial intermediaries (both from public sector and private sector) raised the bulk of resources (68.1 per cent of the total mobilisation) during April-June 2006 (57.5 per cent during April-June 2005).
During April-September 2006, the resources raised through Euro issues – American Depository Receipts (ADRs), Global Depository Receipts (GDRs) and Foreign Currency Convertible Bonds (FCCBs) – by Indian corporates more than doubled to Rs.7,917 crore as corporates took advantage of buoyant secondary markets to raise funds for their investment activities (Table 39).
During April-September 2006, net mobilisation of funds by mutual funds increased by 63.1 per cent to Rs.60,048 crore (Table 40). Net inflows were witnessed in case of both income/debt-oriented schemes and growth/equity-oriented schemes.
|
Table 40 : Resource Mobilisation by Mutual Funds |
||||||
|
(Rupees crore) |
||||||
|
April-September |
||||||
|
April-March |
||||||
|
Mutual Fund |
2005-06 |
2005-06 |
2006-07 |
|||
|
Net |
Net |
Net |
Net |
Net |
Net |
|
|
Mobilisation @ |
Assets # |
Mobilisation @ |
Assets * |
Mobilisation @ |
Assets * |
|
|
1 |
2 |
3 |
4 |
5 |
6 |
7 |
|
Private Sector |
42,977 |
1,81,515 |
30,945 |
1,59,683 |
46,311 |
2,28,254 |
|
Public Sector |
6,379 |
20,829 |
4,501 |
17,016 |
7,259 |
28,197 |
|
UTI |
3,424 |
29,519 |
1,377 |
24,969 |
6,478 |
34,755 |
|
Total |
52,780 |
2,31,863 |
36,823 |
2,01,668 |
60,048 |
2,91,206 |
|
@ : Net of redemptions. # : As at end of March. * : As at end of September. |
||||||
Secondary Market
Domestic stock markets recorded gains during the second quarter of 2006-07 offsetting
almost all the losses suffered in the meltdown in May-June
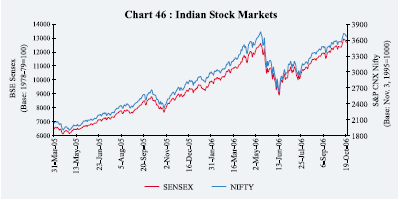
2006 (Chart 46). Beginning May 11, 2006, domestic stock markets had witnessed correction in consonance with global trends amidst increased risk aversion over concerns of slowdown in global growth, increase in global inflation and higher international interest rates. The BSE Sensex reached 8929 as on June 14, 2006, a decline of 29.2 per cent over the all-time high of 12612 reached on May 10, 2006. Stock markets recovered these losses thereafter, reflecting fresh buying by FIIs, robust first quarter corporate results, satisfactory progress of monsoon, upward trend in the international equity markets and decline in global crude oil prices. The BSE Sensex reached a new high of 12928 as on October 16, 2006. The BSE Sensex closed at 12623 as on October 23, 2006, 11.9 per cent above its end-March 2006 level.
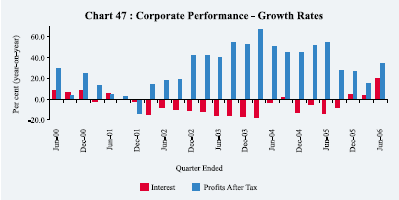
Profits after tax of corporates, after witnessing some deceleration for three consecutive quarters of 2005-06, exhibited substantial improvement in the first quarter of 2006-07. The ratio of net profits to sales also improved to 10.6 per cent during the quarter ended June 2006 and the ratio was higher than those registered in the preceding quarters (Table 41 and Chart 47).
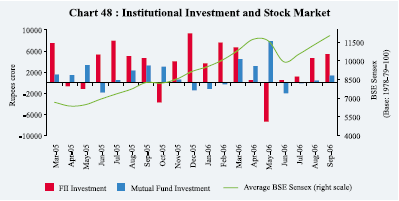
After recording large sales in May 2006, FIIs have turned net buyers in Indian stock markets, and made large purchases in August-September 2006. According to the Securities and Exchange Board of India (SEBI), FIIs made net investments of Rs.11,213 crore in July-September 2006 offsetting the sales during May 2006. During 2006-07 (up to October 20, 2006), FIIs have made net purchases of Rs.10,276 crore (US $ 2.2 billion) as compared with net purchases of Rs.19,739 crore (US $ 4.5 billion) during the corresponding period of the previous year.
|
Table 41 : Corporate Financial Performance |
||||||||||
|
(Growth rate in per cent) |
||||||||||
|
Item |
2003-04 |
2004-05 |
2005-06* |
2005-06 |
2006-07 |
|||||
|
Q1 |
Q2 |
Q3 |
Q4 |
Q1* |
||||||
|
1 |
2 |
3 |
4 |
5 |
6 |
7 |
8 |
9 |
||
|
Sales |
16.0 |
24.1 |
16.9 |
18.5 |
16.4 |
13.2 |
19.5 |
25.6 |
||
|
Expenditure |
14.4 |
22.9 |
16.4 |
18.0 |
16.3 |
12.7 |
18.9 |
24.6 |
||
|
Gross Profits |
25.0 |
32.5 |
20.3 |
32.0 |
19.1 |
21.2 |
16.6 |
33.9 |
||
|
Interest |
-11.9 |
-5.8 |
1.9 |
-13.5 |
-8.0 |
4.6 |
3.8 |
19.9 |
||
|
Profits After Tax |
59.8 |
51.2 |
24.2 |
54.2 |
27.5 |
27.0 |
15.1 |
34.7 |
||
|
Select Ratios (Per cent) |
||||||||||
|
Gross Profits to Sales |
11.1 |
11.9 |
13.0 |
13.1 |
13.0 |
12.8 |
12.7 |
15.6 |
||
|
Profits After Tax to Sales |
5.9 |
7.2 |
8.7 |
8.6 |
8.5 |
8.6 |
8.7 |
10.6 |
||
|
Interest Coverage Ratio (number) |
3.3 |
4.6 |
6.4 |
6.0 |
6.2 |
6.2 |
7.8 |
7.2 |
||
|
Interest to Sales |
3.4 |
2.6 |
2.0 |
2.2 |
2.1 |
2.1 |
1.7 |
2.2 |
||
|
Interest to Gross Profits |
30.7 |
21.8 |
15.7 |
16.6 |
16.2 |
16.2 |
13.7 |
13.9 |
||
|
Memo: |
(Amount in Rupees crore) |
|||||||||
|
No. of Companies |
2,214 |
2,214 |
2,210 |
2,355 |
2,361 |
2,366 |
2,415 |
2,228 |
||
|
Sales |
4,42,743 |
5,49,449 |
7,74,578 |
1,94,608 |
2,12,693 |
2,19,098 |
2,49,971 |
2,34,610 |
||
|
Expenditure |
4,22,110 |
5,14,574 |
6,66,690 |
1,66,972 |
1,83,717 |
1,88,934 |
2,18,511 |
1,95,556 |
||
|
Depreciation Provision |
20,406 |
22,697 |
28,883 |
7,137 |
7,617 |
7,748 |
8,340 |
8,449 |
||
|
Gross Profits |
49,278 |
65,301 |
1,00,666 |
25,577 |
27,620 |
28,135 |
31,652 |
36,567 |
||
|
Interest |
15,143 |
14,268 |
15,789 |
4,241 |
4,467 |
4,555 |
4,348 |
5,083 |
||
|
Profits After Tax |
26,182 |
39,599 |
67,506 |
16,726 |
18,169 |
18,790 |
21,634 |
24,845 |
||
|
Note : 1. Growth rates are percentage change in the level for the period under reference over the corresponding |
||||||||||
Mutual funds have also made net investments of Rs. 10,343 crore in the current financial year (up to October 20, 2006) on top of Rs.10,459 crore during the corresponding period of last year (Chart 48).
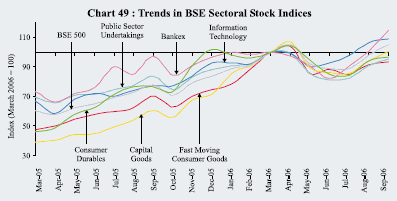
Major indices and sectors have shown mixed trends during 2006-07 so far (Chart 49). On a point-to-point basis (up to October 23, 2006), BSE 500 increased by 7.2 per cent, while BSE Small-cap and BSE Mid-cap declined by 1.9 per cent and 0.4 per cent, respectively, over end-March 2006. Amongst major sectors, oil and gas registered gains of 19.6 per cent followed by IT (17.6 per cent), banking (15.9 per cent), consumer durables (4.5 per cent), capital goods (3.8 per cent) and metals (0.6 per cent). On the other hand, fast moving consumer goods sector recorded losses of 9.6 per cent followed by healthcare (6.5 per cent), PSU (5.0 per cent) and auto (0.1 per cent).
|
Table 42: Stock Market Indicators |
||||||||
|
Indicator |
BSE |
NSE |
||||||
|
April-March |
April-September |
April-March |
April-September |
|||||
|
2004-05 |
2005-06 |
2005-06 |
2006-07 |
2004-05 |
2005-06 |
2005-06 |
2006-07 |
|
|
1 |
2 |
3 |
4 |
5 |
6 |
7 |
8 |
9 |
|
BSE Sensex / S&P CNX Nifty |
||||||||
|
End-period |
6493 |
11280 |
8634 |
12454 |
2036 |
3403 |
2601 |
3588 |
|
Average |
5741 |
8279 |
7187 |
11167 |
1805 |
2513 |
2205 |
3280 |
|
Volatility |
11.16 |
16.7 |
9.70 |
7.65 |
11.28 |
15.6 |
8.75 |
7.76 |
|
P/E Ratio |
||||||||
|
(end-period)* |
15.61 |
20.92 |
17.80 |
21.34 |
14.60 |
20.26 |
16.15 |
20.92 |
|
Turnover |
||||||||
|
(Rupees crore) |
5,18,716 |
8,16,074 |
3,58,770 |
4,45,090 |
11,40,071 |
15,69,556 |
6,95,049 |
9,23,664 |
|
Market Capitalisation |
||||||||
|
(Rupees crore) |
||||||||
|
(end-period) |
16,98,429 |
30,22,191 |
22,54,378 |
31,85,678 |
15,85,585 |
28,13,210 |
20,98,263 |
29,94,132 |
|
* : For 30 scrips included in the BSE Sensex and 50 scrips included in the S&P CNX Nifty. |
||||||||
The price-earnings (P/E) ratios for the 30 scrips included in the BSE Sensex increased from 19.4 at end-June 2006 to 21.3 as on October 23, 2006 (Table 42). The market capitalisation of the BSE increased by 21.5 per cent between end-June 2006 and October 23, 2006.
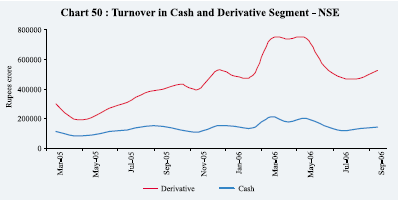
At the NSE, the total turnover in the cash segment during 2006-07 (up to end-September, 2006) at Rs.9,23,664 crore was 32.9 per cent higher over corresponding period of 2005 (Chart 50). On the other hand, the total turnover in the derivative segment during 2006-07 (up to end-September 2006) doubled to Rs.35,06,885 crore over the corresponding period of previous financial year.
Page Last Updated on:


